Article

Modification Model of Glued-In Rods Splice Connection Using Statistical Analysis for Mengkulang Glulam Timber

1
Faculty of Engineering, Built Environment and Information Technology, SEGi University, 9, Jalan Teknologi, PJU 5 Kota Damansara, Petaling Jaya 47810, Malaysia
2
Institute for Infrastructure Engineering and Sustainable Management (IIESM), Universiti Teknologi MARA, Shah Alam 40450, Malaysia
3
School of Civil Engineering, College of Engineering, Universiti Teknologi MARA, Shah Alam 40450, Malaysia
4
Department of Civil Engineering, University of Mataram, Kota Mataram 83115, Indonesia
5
Arkitek Azman Zainal, Shah Alam 40100, Malaysia
6
Laboratory of Biocomposite Technology, Institute of Tropical Forestry and Forest Products (INTROP), Universiti Putra Malaysia (UPM), Serdang 43400, Malaysia
*
Author to whom correspondence should be addressed.
Forests 2023, 14(3), 491; https://doi.org/10.3390/f14030491
Submission received: 14 January 2023 / Revised: 15 February 2023 / Accepted: 18 February 2023 / Published: 28 February 2023

Abstract

:
The statistical study of the glued-in rod splice connection for Mengkulang glulam timber is presented in this research. This type of connection is used in many applications, such as bridge construction and wide hall, besides becoming increasingly popular due to its cost-effectiveness and ease of installation. Using statistical analysis to evaluate the performance of glued-in rod splice connections is relatively new. Statistical analysis can assess the connection’s performance by examining the glued-in rod splice connection’s strength, stiffness, and durability. Glued-in rods have several advantages over traditional mechanical connections generally used in beam design, such as higher stiffness, more uniform stress distribution, fewer rod corrosion problems and better appearance. Due to this limitation, the standard design for glued-in rods using glulam is the estimated extrapolation for solid timber guidelines. The main objectives of this research were to develop the pull-out model and validate the effectiveness of the model equation for glued-in rods parallel (GRPS0°) and perpendicular (GRPS90°) to the grain directions using a statistical package for the social sciences (SPSS). The variables examined were the number of rods, diameter, length, spacing, the kind of glue utilised, and the number of adhesive layers. In conclusion, the model development clearly shows that most of the parameters achieved the R2 more than 80% accurate for both parallel (GRPS0°) and perpendicular (GRPS90°) to the grain directions.

1. Introduction

Timber connections are used to join two or more pieces of timber together. Timber connections ensure a structure’s structural integrity and provide a secure and aesthetically pleasing finish. It is typically used in a variety of applications, such as in the construction of buildings, bridges, and other structures. Kangas [1] and Riberholt [2] have studied the possibilities of the bonded-in rod technology for various new-build applications, such as the connection of glulam beams. By splicing in fresh wood or improving already-existing wooden structures that have degraded, these joints are also employed to rehabilitate the rotted areas of timber constructions [3].
The connections are often the critical elements of timber structures, responsible for reducing continuity and global structural strength, requiring oversized structural elements. According to Itany et al., 1984 about 80% of the failures observed in timber structures are due to connections [4]. The structure’s serviceability, resistance and durability depend mainly on the design of the connections between the elements [5]. To ensure the structural performance of the timber connections, the correct location of the fasteners concerning the end and edge distances of the members is of high importance [6]. There are many existing standards available, but not for tropical glulam timber. Examples of the standard used to design the pull-out formulas are the Old Danish Code of Practice (DS 413 1982) [7], the New Danish Code, and the Eurocode. The current design information is only available for softwood; the properties differ from hardwood. In convergent to the different properties be overly designed and not practical in terms of cost and weight ratio. An informative annexe exists in Eurocode 5: Part 2 (PRENV 1995-2) [8] for glued-in steel rods, but the knowledge is limited. This informative annexe recommends steel rods, such as spacing, distances, and minimum anchorage length. According to MS 544: Part 9: 2001 [9], EN 1995: 1-1:2004 [10] and EN 1995:1-2:2004 [11], the timber connection specification can be improved by modifying the design approach to predict the load-carrying capacity in the Malaysian tropical timber connections. This statement is supported by Shakimon et al. [12].
The glued-in rods provide one potential solution for constructing more successful joining techniques [13]. Glued-in rods are an innovative and highly efficient method to connect timber elements [14]. The rods can be applied either parallel or perpendicular to the grain direction of the timber [15] or at other angles [16]. In real connections with rods, timber is loaded in tension or compression parallel or perpendicular to grain combined with shear [5]. When timber connections are loaded in tension perpendicular to the grain, its failure may result either in the yielding of the rods, crushing of the timber under the rods, or splitting of the timber member. The first two failure modes are considered ductile failures while splitting or fracture of timber is a brittle failure and may lead to catastrophic collapse [17].
The splice connection is one of the most common types of jointing glulam between members. Gustafsson et al. [18] observed that the pull–pull type of loading is more representative and produces higher pull-out strengths. For that reason, this study aims to determine the applicability, validate the reliability of the existing pull-out equations, and predict the load-carrying capacity of glued-in rods for splice connection using Malaysian tropical glulam timber.
In this research, the performance of tensile behaviour of the glued-in rods parallel (GRPS0°) and perpendicular (GRPS90°) to the grain for Mengkulang glulam timber splice connections were determined. The statistical analysis method modified the glued-in rod for the splice connection modification model.
This paper focuses on developing a numerical model based on local experimental material identification and considering the mechanical contact and friction phenomenon between different components, with failure criterion to predict the mechanical behaviours of timber. The equation is developed by fitting the selected influential parameters into the SPSS program. Multiple Linear Regression Analyses (MLR) were employed to derive the equation. In this study, the effects of a single variable or multiple variables with or without the impact of other variables are considered as applied by Cohen and Aiken, 2003 [19].

2. Materials and Methods

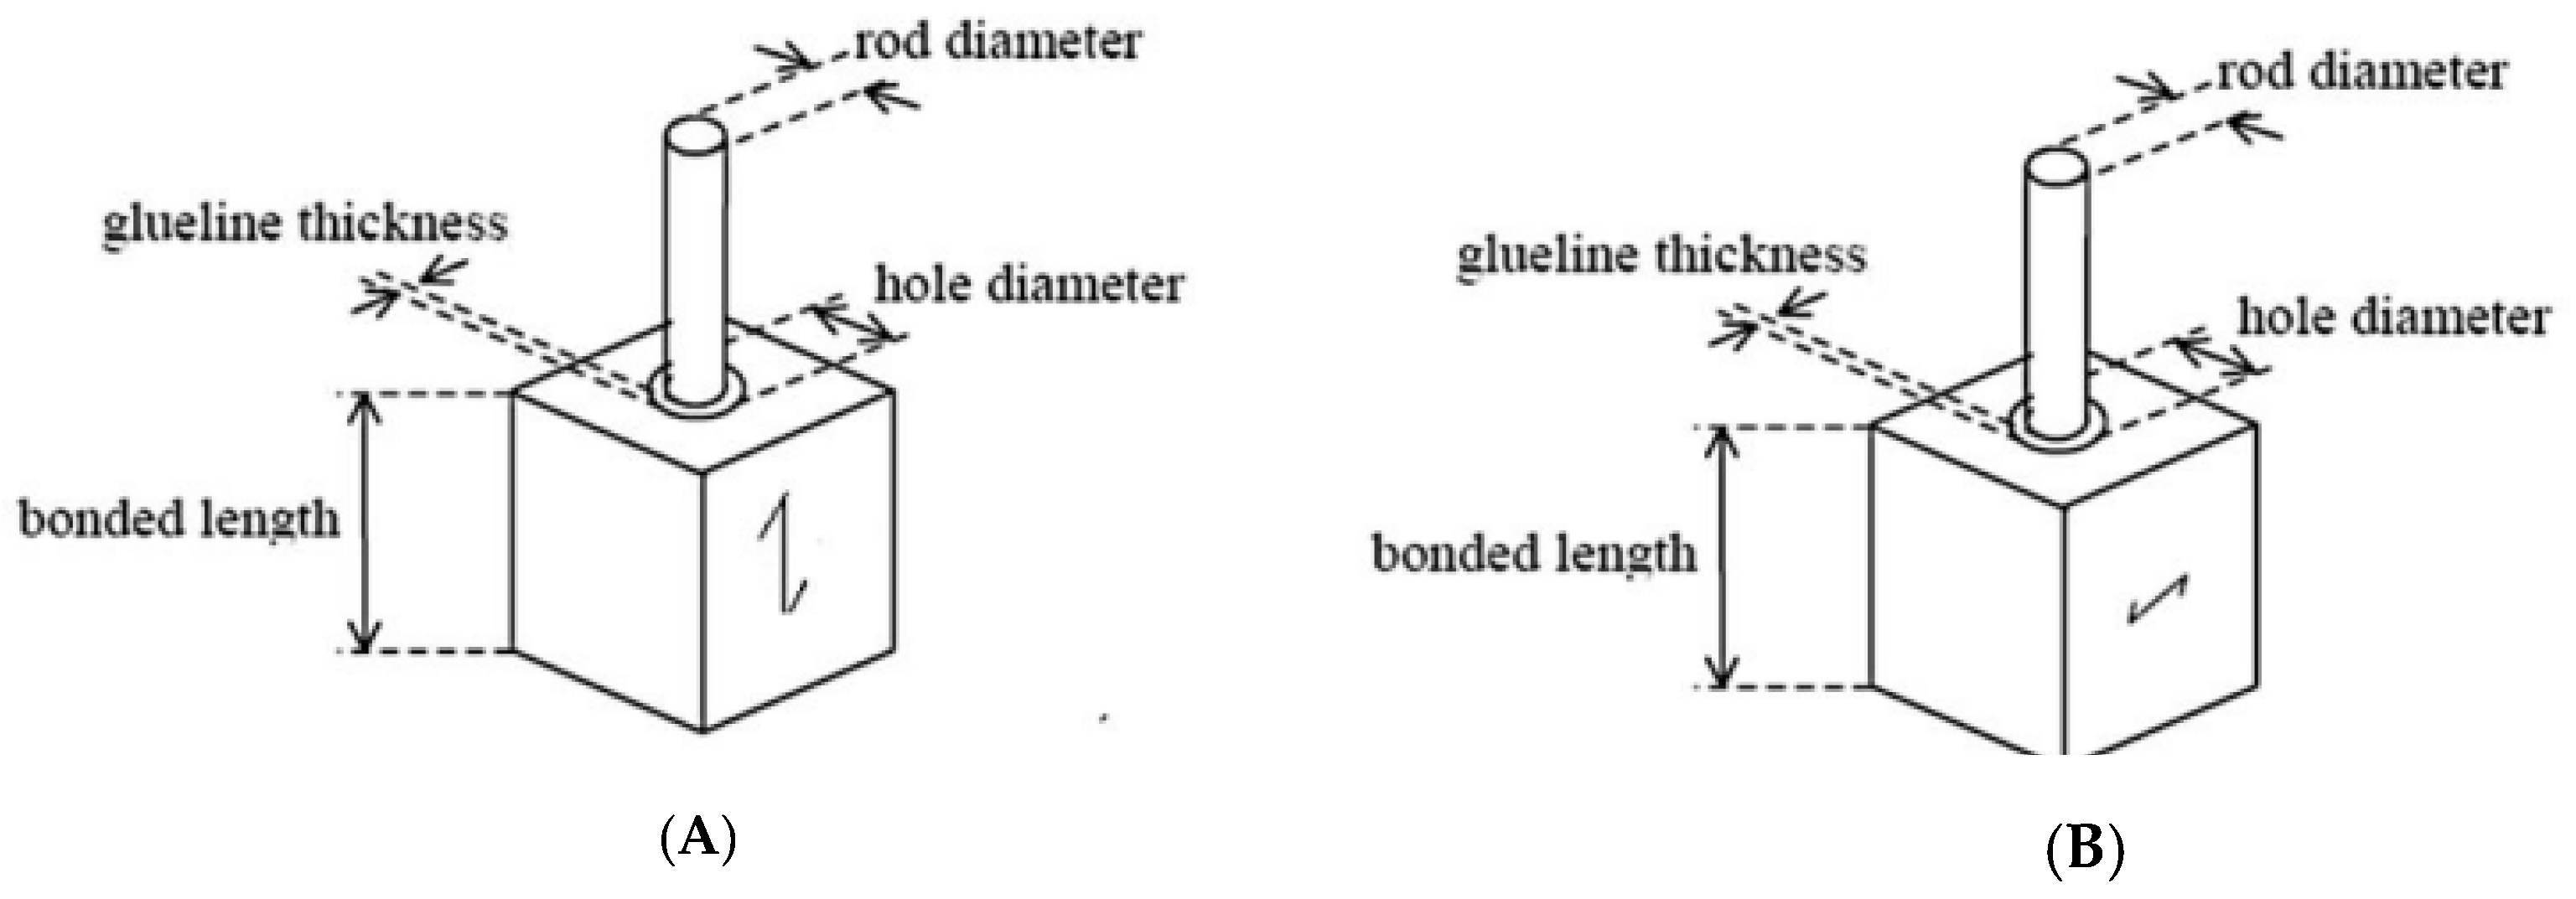
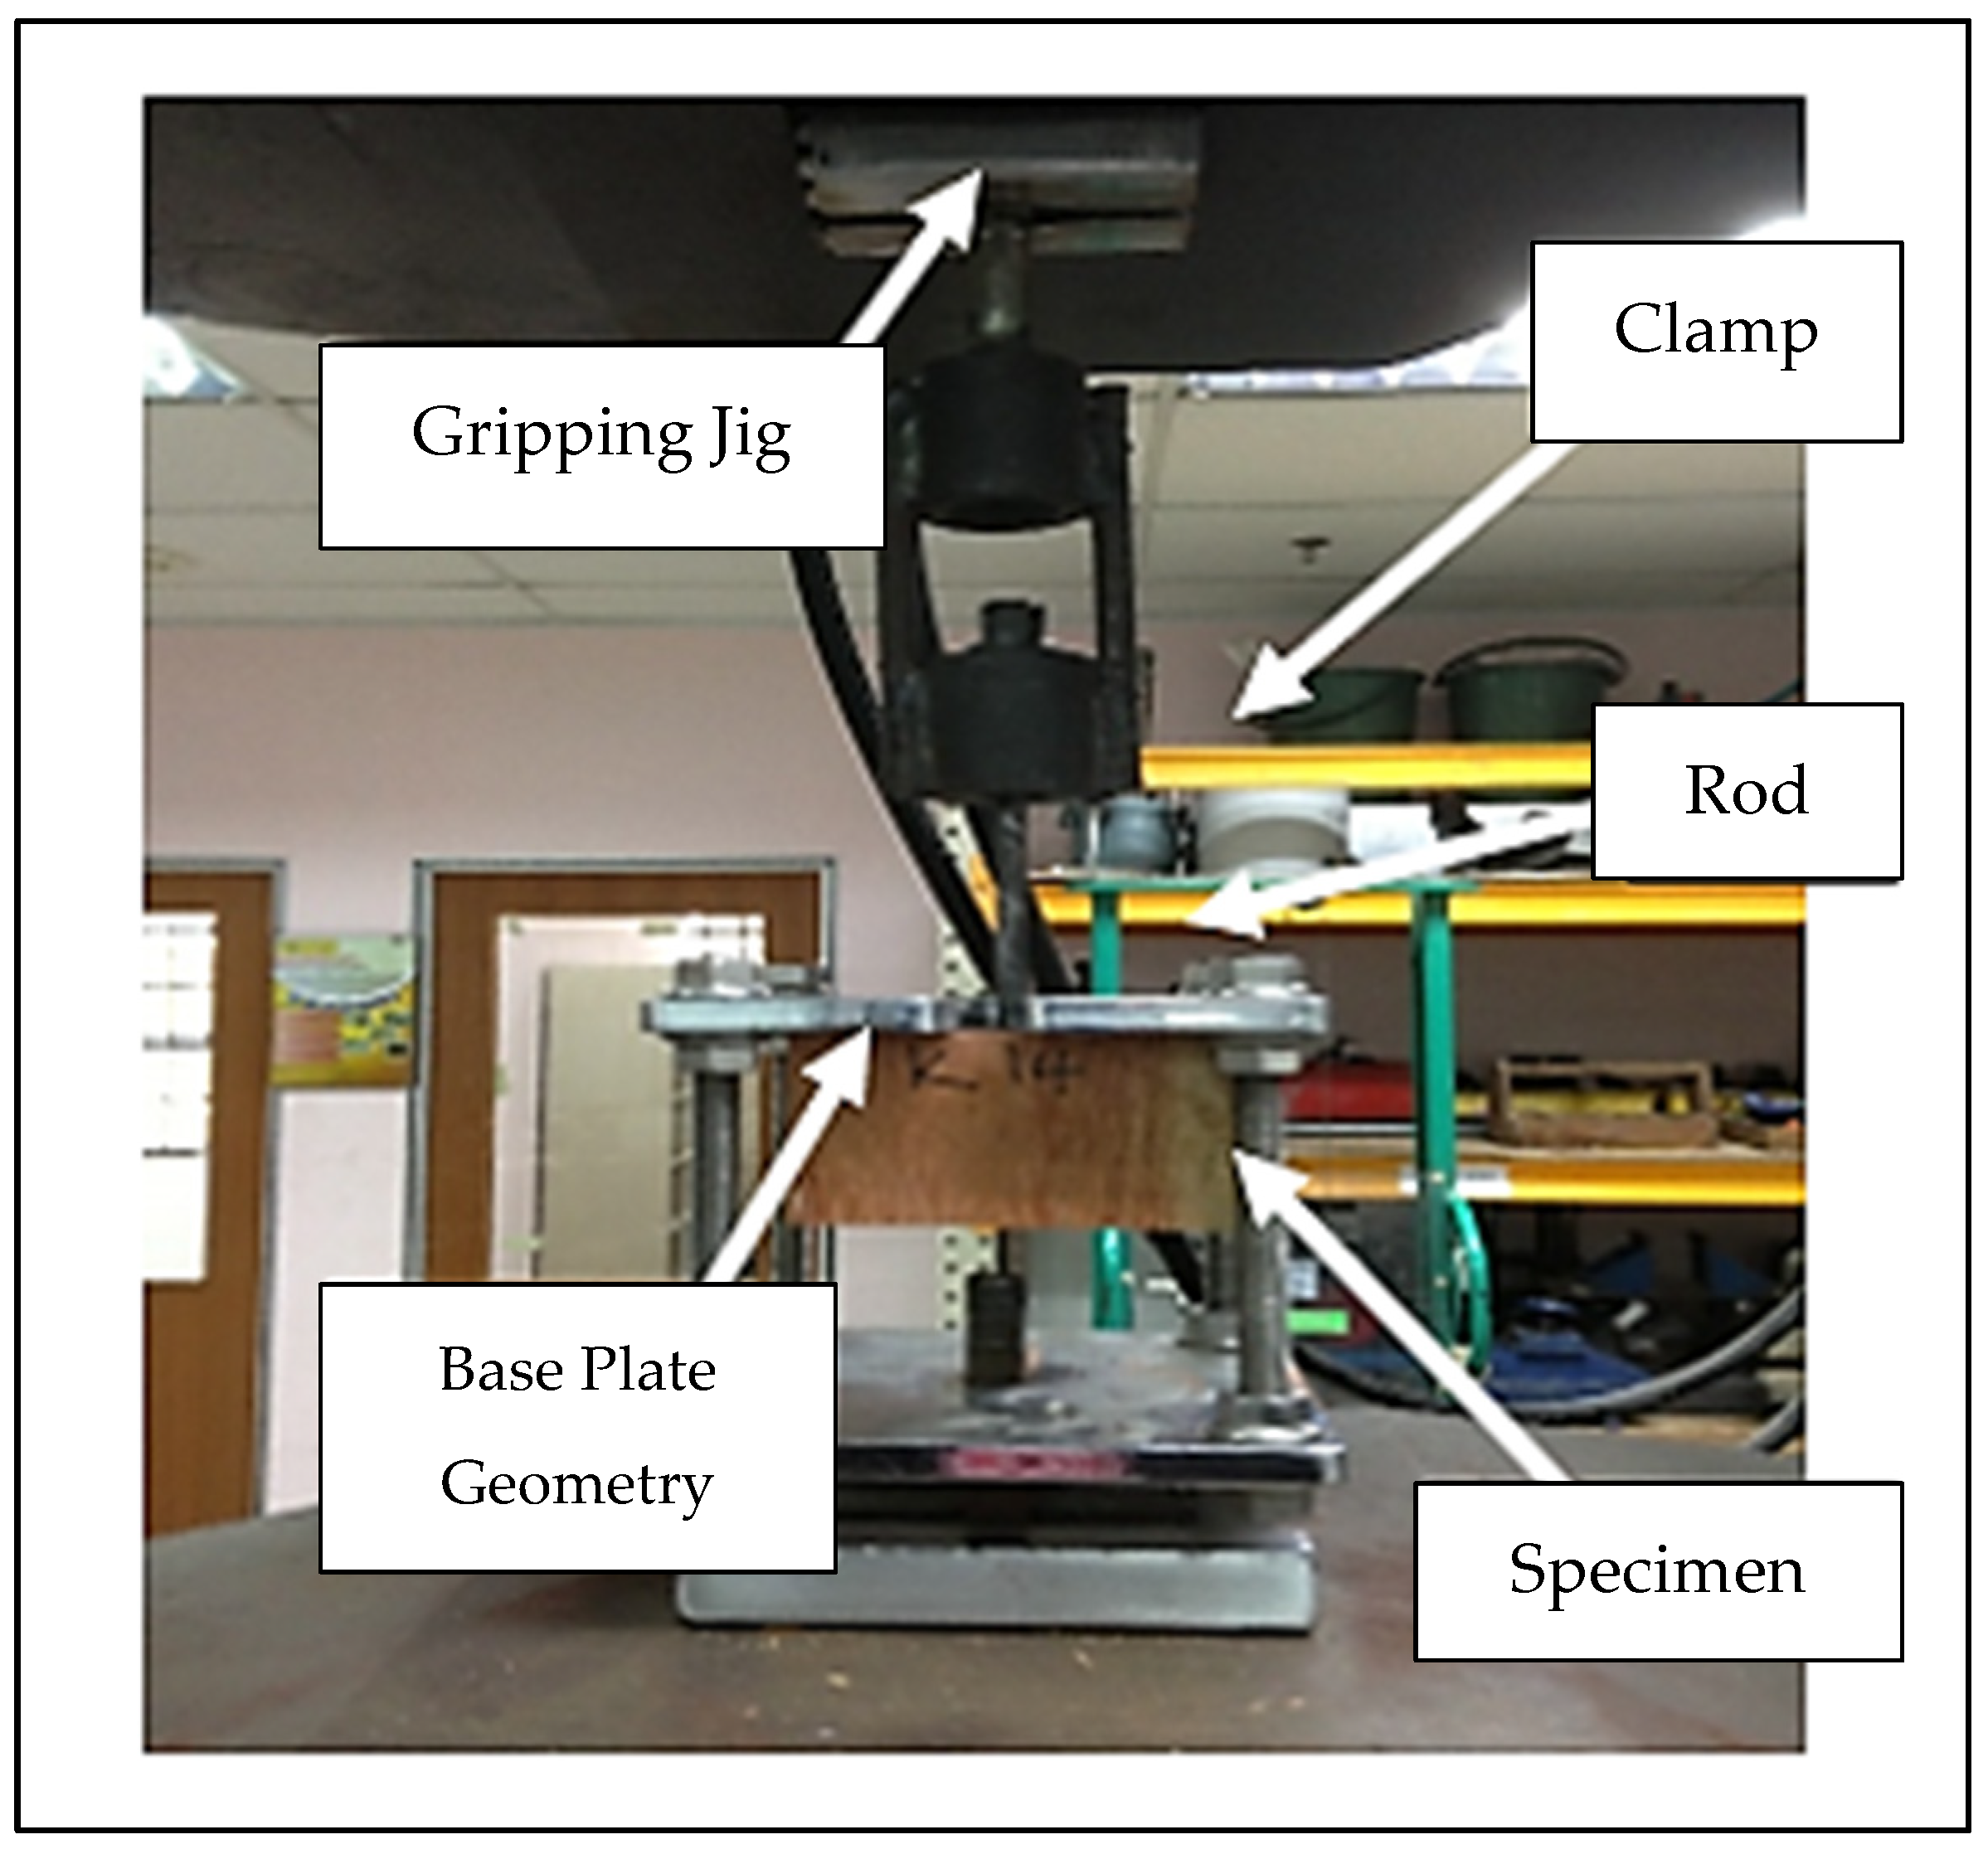
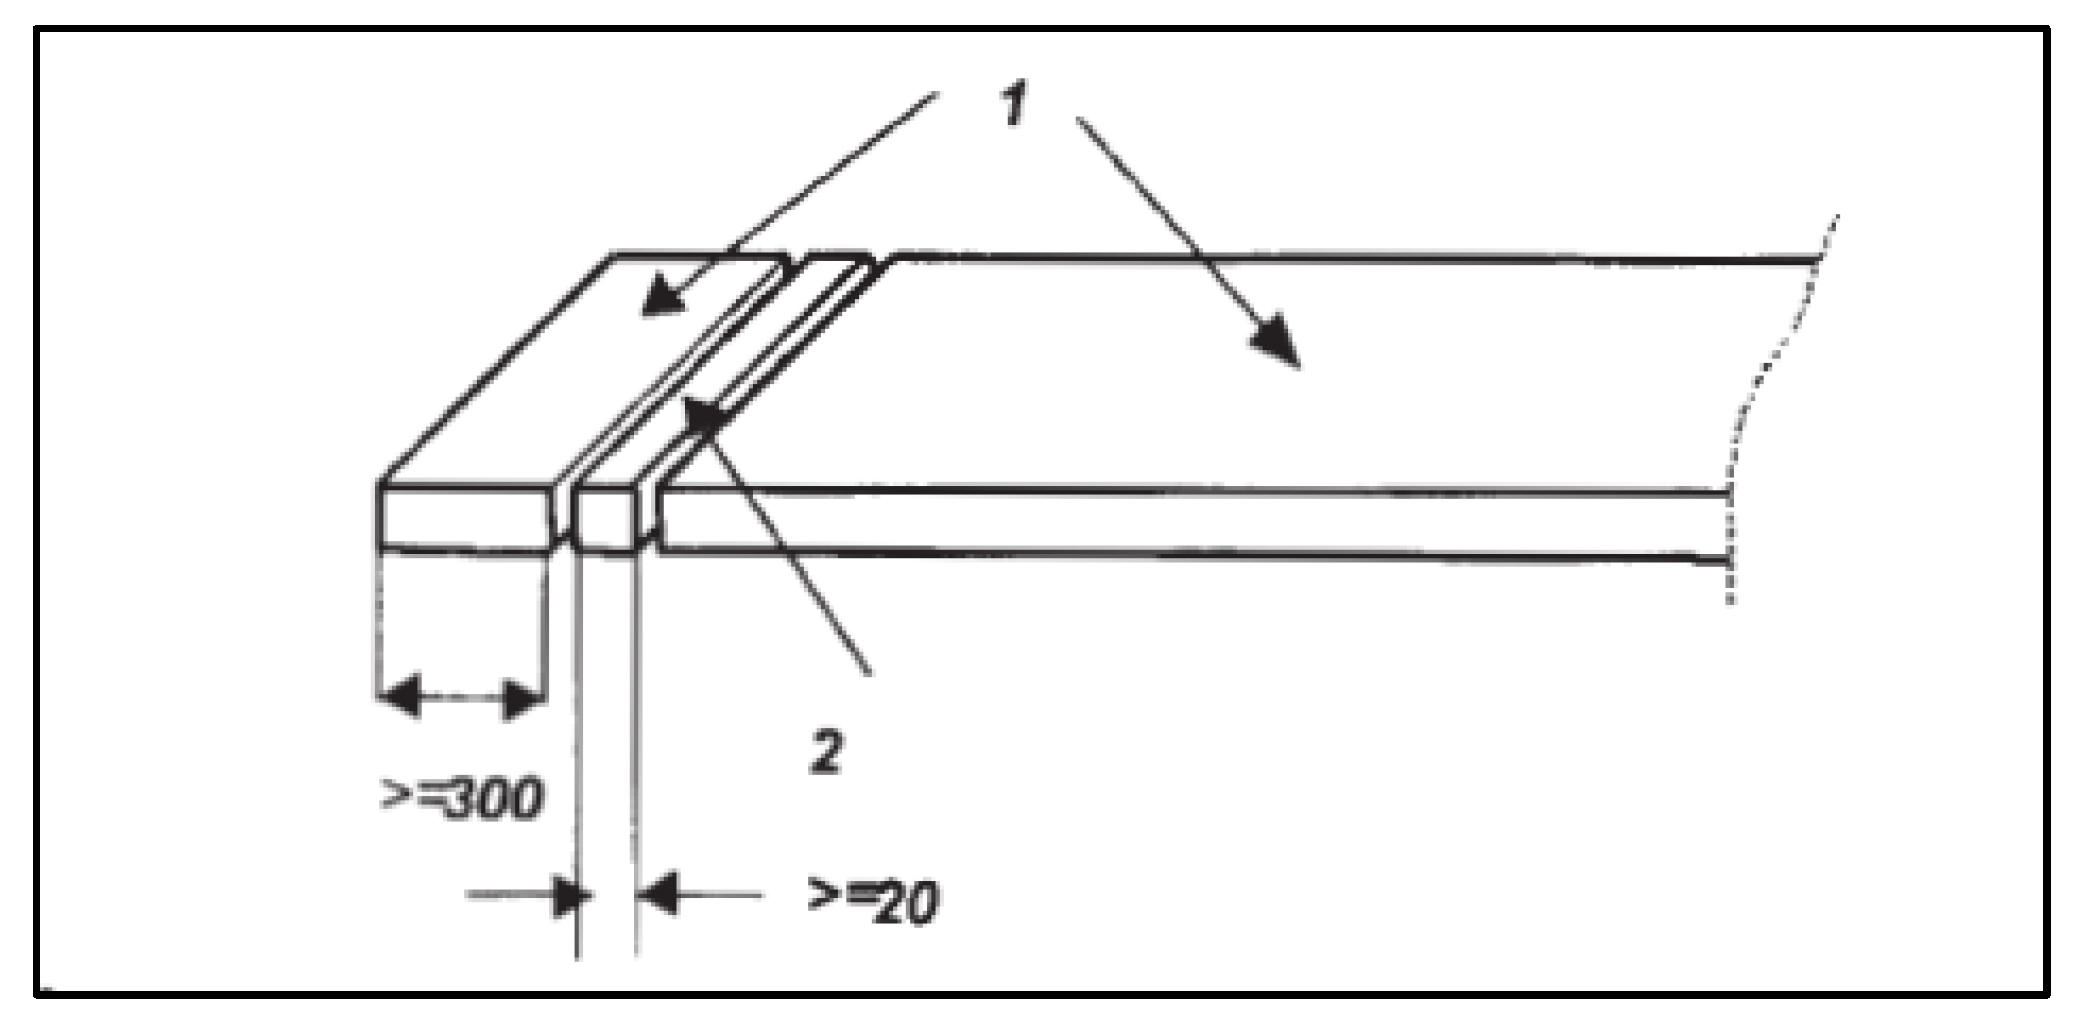
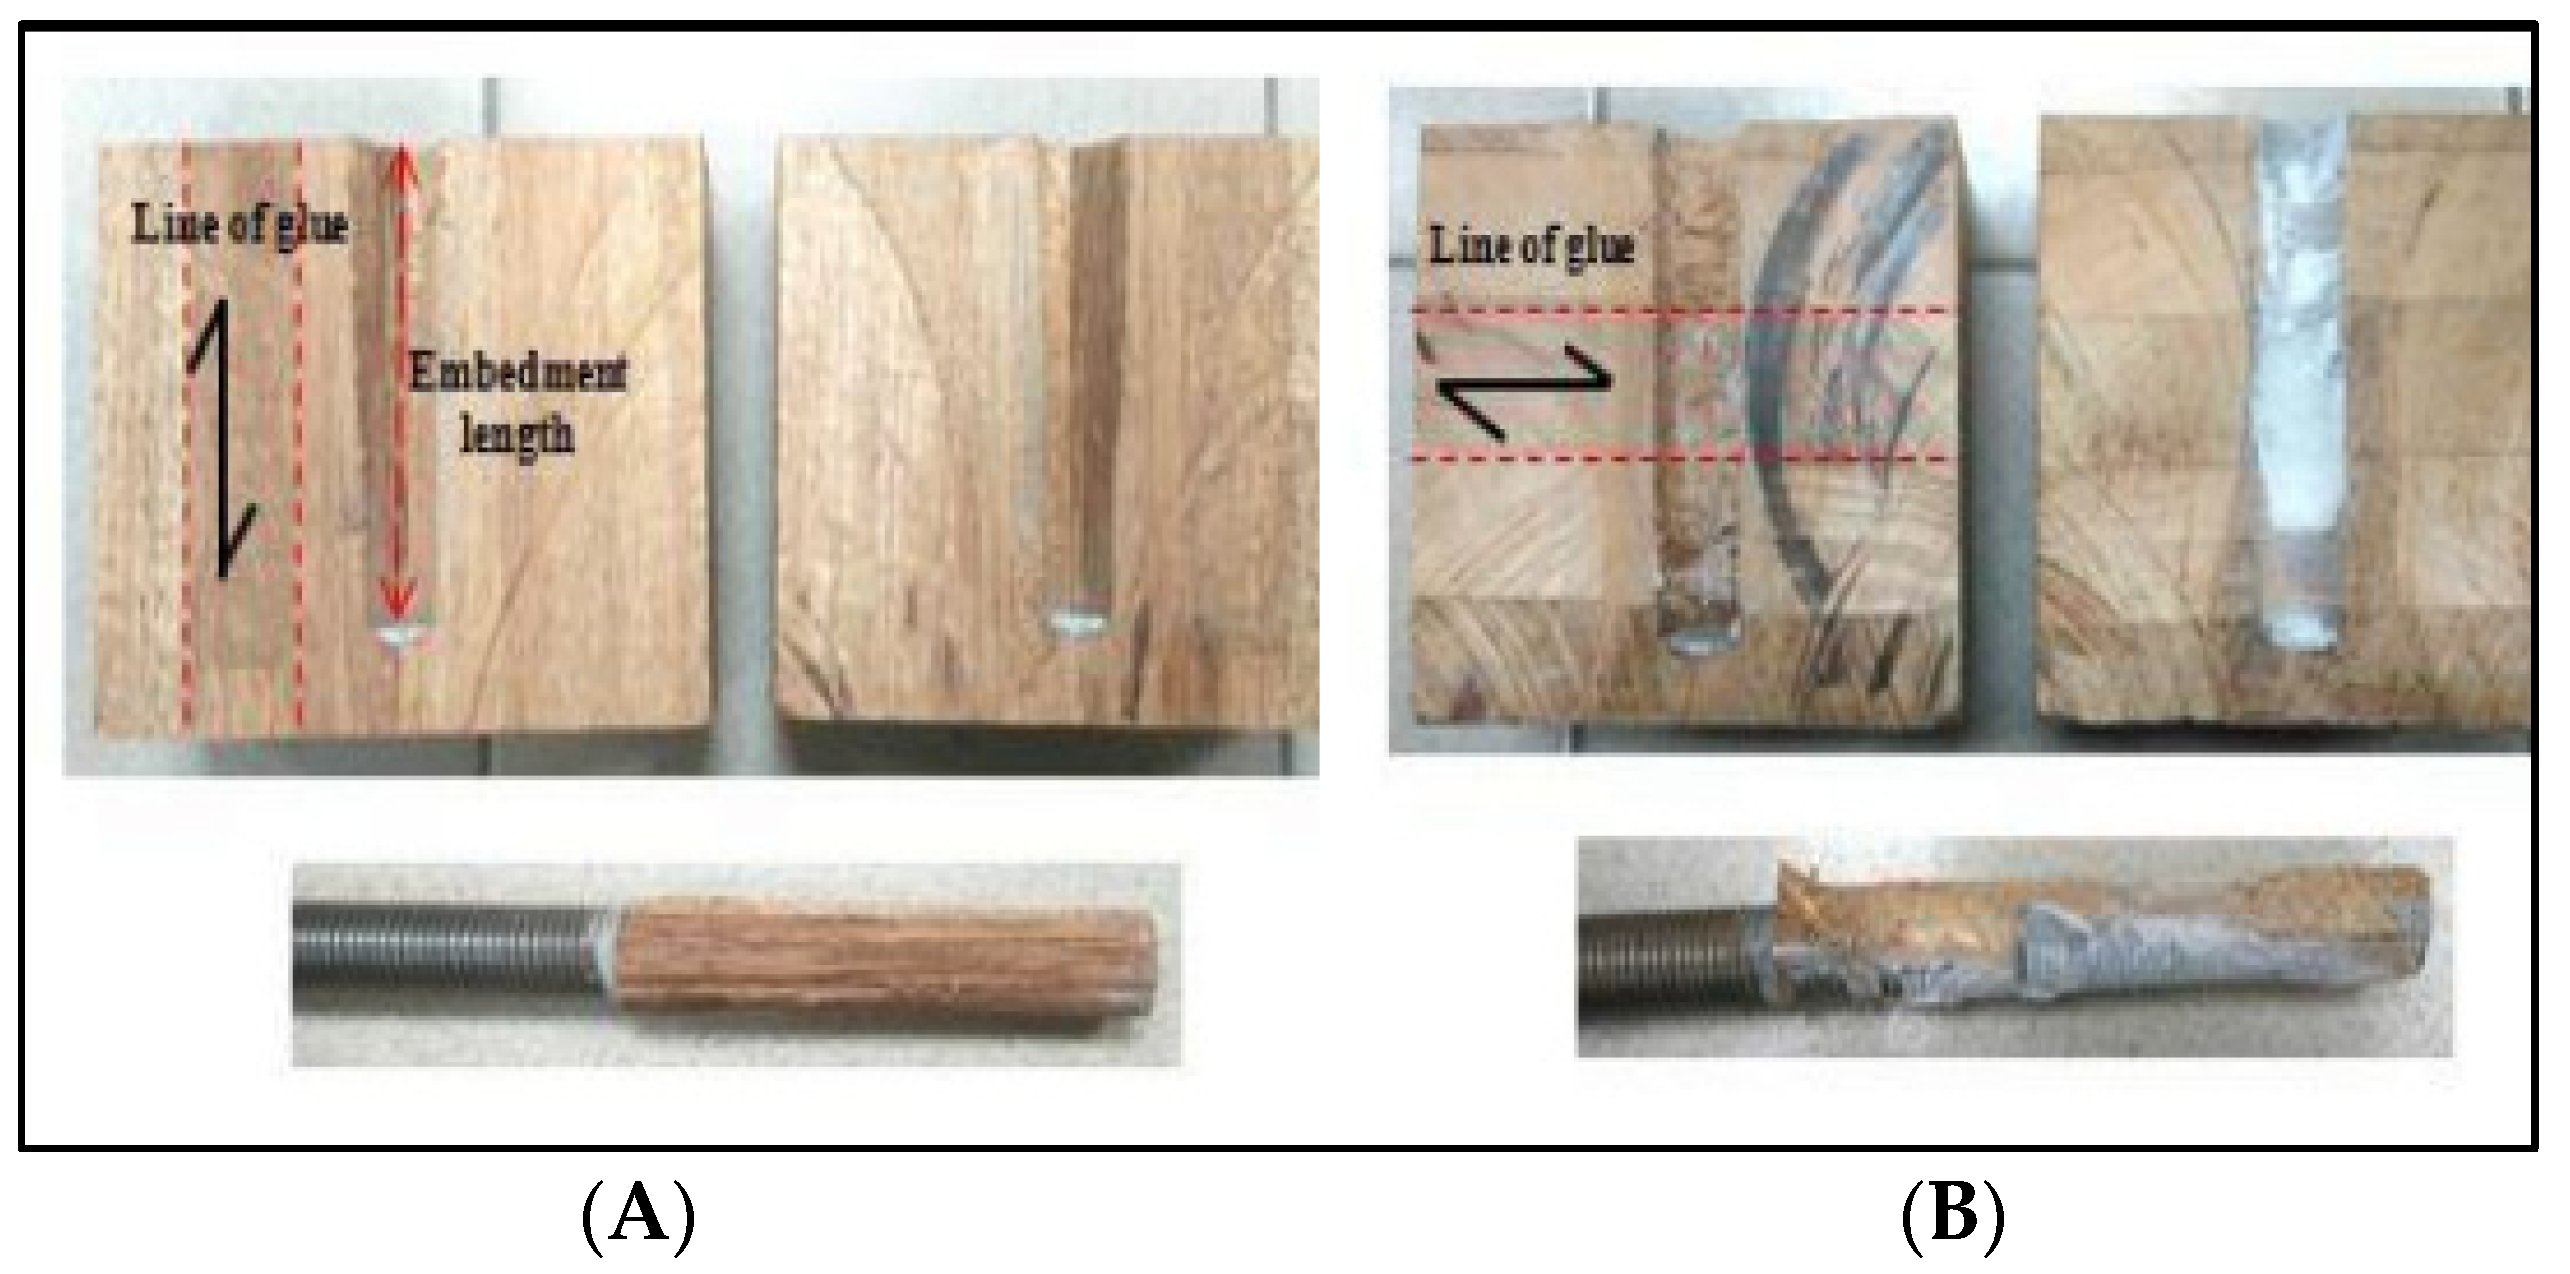
2.1. Glued-In Rods Preparation

The glued-in rod of glulam timber test and preparation of samples was conducted in Concrete Structure Laboratory, and a fabricated machine was used as the pull-out loading test at the Heavy Structure Laboratory, School of Civil Engineering, Universiti Teknologi Mara (UiTM) Shah Alam, Malaysia. The pull-out test was carried out using Universal Testing Machine (UTM) with a load cell of 1000 kN. The test and procedures were set up according to ASTM 5764: 1995 standard.
The pull-out tests were carried out for the rods inserted with glue, perpendicular (PP90°) and parallel (PR0°) to the grains of the glulam. Figure 1 shows the schematics diagram of the pull-out specimen for the PP90° and PR0° to the grain direction with the specification of the glulam block for the pull-out strength test. The blocks were cut in the form of a cuboid structure with the length and width of the timber at least 54 mm, and the depth or the thickness of the timber cuboid should be at least 60 mm [20].
Pull-out strength tests were tested with a single rod where only one hole was drilled in each specimen. For edge and end distance, Stepinac et al. [14] stated values of more than 2.5 d were presented in most design equations. EN 1995:2001: Eurocode 5 [21] recommended an edge distance of 2.5 d. One hundred seven data timber block specimens were prepared and measured to develop and validate the glued-in rod equation. Amongst them, 70% were used for equation development, while 30% were used for validation purposes. The timber block specimens of the pull-out test were divided into PR0° and PP90°, as shown in Table 1.
Timber blocks were cut parallel and perpendicular to the grain direction, where each direction consisted of 53 and 54 timber blocks, respectively. The analysis was performed to define the independent variables to the dependent variable, to test the uniformity of the dimension and selection of the most significant parameters concerning the pull-out test. The development of models started with the establishment of the parameters. The data analysed are based on the selected parameters influencing the GRPS model.
The Universal Testing Machine (UTM) with a load cell of 1000 kN was used to apply an axial load to the rods. The loading at a crosshead rate of 2 mm/min up to failure shear test duration was approximately six minutes following EN-26891 [22]. Then, the rigging plate was placed on the UTM machine and clamped from the bottom steel rod. The sample was inserted into the rigging plate and secured from the top jaw at the steel rod. The sample was placed so that it could not move in any direction. The test rig is shown in Figure 2.

2.2. Moisture Content Experimental Work

The test specimens for moisture content were obtained from sizeable solid timber blocks, which were subsequently cut to 20 mm × 130 mm × 150 mm dimensions and the longer length was cut along the grain direction. Cut a test of full cross-section and minimum 20 mm size in the direction of the grain, at a point of 300 mm from either end of the piece. The test slice shall be free from resin wood and features such as bark, knots and resin pockets. If such markers exist, cut the test slice from the nearest clear area towards the centre of the test piece, as shown in Figure 3.
The specific density, ρ as a percentage, has been calculated using Equation (1):
Density .   ρ = Mass Volume × 100

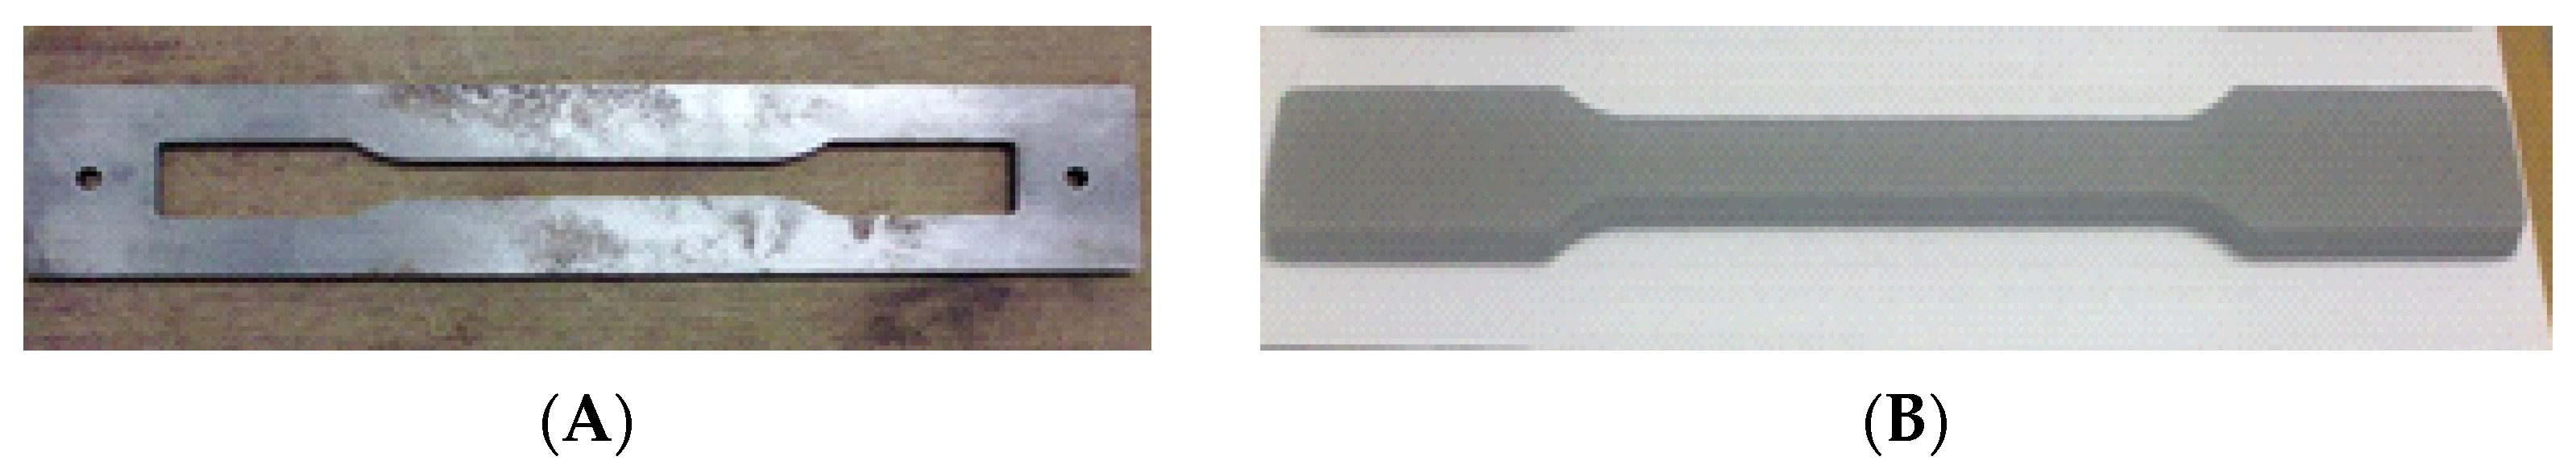
2.3. Glue Tensile Test

Sikadur is the glue used to strengthen the glulam laminate in this research. Tensile tests for the glue were used to determine the stress-strain relationship of the 2, 3, and 4 mm glue thickness tested for 12, 16, and 20 mm rod diameters parallel and perpendicular to the grain directions. Tensile testing utilises the classical coupon test geometry, as shown in Figure 4 and tensile testing machine, as shown in Figure 5. The main product of a tensile test is a load versus elongation curve, which is then converted into a stress versus strain curve.

2.4. Statistical Analysis

The “Statistical Package for the Social Sciences”, or SPSS, was utilised for data filtering, analysis, and the development of empirical equations. Multiple regression is a statistical method for creating a model for predicting the impact of several independent factors on the dependent variable. A few different modelling approaches can be used to simulate the behaviour of timber connections at ambient temperature. Before SPSS, the predicting relationship could either be linear or nonlinear, independent variables may be quantitative or qualitative, and one can examine the effects of a single variable or multiple variables with or without the impact of other variables [23].

2.4.1. Development of GRPS Models Equation

The correlation relationship among the selected parameters for equation development is based on Multiple Linear Regression Analysis (MLR). The analysis is carried out to define the independent variables to the dependent variable. The obtained equation’s notion and the relevant variables are displayed in Table 2. The embedding length, rod diameter, and glue line thickness determined the relationship between the pull-out strength of glued-in rods and the volume of the adhesive. The glue line thickness was crucial since it optimised the stress transfer from timber to the rod.
Stepinac et al. ([22] concluded earlier studies that the interface layer and shear strength parameter, determined by the mechanical and geometrical features of three different materials, are the main factors affecting pull-out capacity. Since Eurocode was the primary reference used by the majority of the researchers, therefore the Eurocode formula was selected for this study.
This GRPS model is developed from the original formula from the European Committee for Standardization CEN (1997) Eurocode 5 [24]. In the selection of the shear strength parameters, fv based on the compilation of formula from ENV 1995-2 [8], only fv was found independent, and another parameter was found dependent:
fv,k = Fax,k π × dequ × la
where:
{fax,k} = Characteristic axial resistance [N], [kN].
{la} = glued-in length/effective anchorage length [mm].
{dequ} = diameter of the hole [mm]
{fv,k} = shear strength of the wood at the angle between the rod and grain direction [N/mm2 ]
To verify the GRPS models, there were two (2) equations (Equations (3) and (4)) derived from the existing formula of ENV 1995-2, as follows:
GRPS0°: For a parallel to the grain direction
f ( f v , 0 ) = R a x , k π × d e q u × l a
GRPS90°: For a perpendicular to the grain direction
f ( f v , 90 ) = R a x , k π × d e q u × l a
The equations of GRPS for parallel and perpendicular grain directions were derived using Density (ρ), Moisture Content (ω), Area (A), Volume (v), Ratio between rod size and glue thickness (r) as the repeating variables.

2.4.2. Relationship between DV versus IVs

The relationship between the dependent variable (DV) and independent variables (IV). The related parameters are density, glue thickness, embedded length, rod diameter, moisture content, area, volume and ratio between the size of the rod and glue thickness for parallel and perpendicular to the grains. The model equations are shown on the individual graphs, obtained from linear regression directly using Excel. Figure 3 and Figure 4 establish the relationship between the dependent variable (DV) and independent variables (IV).
From Table 3, the model development clearly shows that most of the parameters achieved the coefficient of determination, R2 with more than 80% accuracy for both parallel (GRPS0°) and perpendicular (GRPS90°) directions. However, for embedded length and rod diameter, the value of R2 shows a lower than 30% accuracy of the relationship between the dependent and independent variables.

2.4.3. Correlation and Relationship among the Parameters

The correlation and relationship are checked to find the most influential parameter that controls the pull-out test’s shear strength. Correlation is a measure of the linear relationship between two random variables. The correlation between random variables X and Y, denoted by ρxy is defined as:
ρ x y = C O V   X , Y V X V Y 1 / 2
The value of the correlation coefficient ρxy lies between −1 to 1. The correlation is perfect if the ρxy = 1 or ρxy = −1. If −1 ≤ ρxy ≤ 1 and ρxy ≠ 0, a linear relationship exists between the two variables [28]. Three methods are commonly used in SPSS for calculating correlation depending on the data assumption:
(i)
Pearson’s product-moment correlation coefficient, r
(ii)
Kendall’s τ-b
(iii)
Spearman rank correlation test.
The general guideline from Cohen [20] is stated in the values in Table 4 for statistical correlation analysis.
The analysis is performed to define the independent variables to the dependent variable to test the uniformity of the dimension and selection of the most significant parameters about the pull-out test. Since the shear strength (fv) is measured in the glued-in rod for the pull-out test function, thus shear strength (fv) is denoted as the dependent variable while the rest is the independent variable. The scatter plot and correlation coefficient will evaluate the linear relationship between the dependent and independent variables.

2.4.4. Multiple Linear Regression Analysis

The Multiple Linear Regression technique was applied to investigate the relationship between the dependent (response) variable and several independent (explanatory) variables. The analysis, verification, and derivation of empirical equations of the experimental data were performed accordingly. The general linear regression theoretical derivation of the formula is as follows:
Y = β 0 + β 1 x 1 + β 2 x 2 + + β k x k + ε
where:
Y = dependent variables or responsive variables
X 1 , X 2 , X 3 , X k = independent variables or predictors
β 0 = intercept, the value of Y when all X are zero
β k = population regression coefficients
ε = random error term
The fitted equation is then,
y = b 0 + b 1 x 1 + b 2 x 2 + + b k x k + ( random error )
where:
y = predicted of the fitted value
b k = estimates of the population regression coefficients
ε = random error term
From Equation (6), Y was known as the dependent variable, x1, x2, and xk were independent variables, ε was the random error term, and the β0, β1, and βk were the parameters of the model and were estimated from the equation development data. The multicollinearity diagnostics were checked to identify the correlation between the independent variables. The variance inflation factors (VIF) test is used to detect multicollinearity where the value excess of 10 indicates that multicollinearity may influence the least squares estimates.
The best possible independent variables method used was fitting all possible regression equations. There were four criteria used to obtain the possible regression equations:
(i)
Based on the coefficient of determination or R2 values
(ii)
Mean square error MSE(p) for a p variable(s) equation
(iii)
model testing using new experimental data for verification

3. Results

3.1. Moisture Content, Density and Glue Tensile Strength

The moisture content of the specimens was averaged at 12.48%, and density was found at 754.58 kg/m3. The result was in the range stipulated in the MS 758: 2001 [23] for the glulam material.
Details performance of the tensile test for the three selected glue thicknesses for the 12, 16, and 20 mm rod diameters are summarised in Table 5 and Table 6.
As a conclusion for the glue tensile test, the stress-strain curve for Sikadur showed nonlinearity before reaching the maximum stress. Without apparent yield, a point was found in the stress-strain behaviour. The strength capacity of the Sikadur was found as 26.6 Mpa.

3.2. Pull-out Performance Behaviour after Testing

The shear-bond stress of the connection is at its highest strength when the load acts parallel to the grain (Mohamad, WNN 2018) [16]. It’s subjected to a pull-out test, particularly loose at the connection because the bond area is subjected to more layers and intersection points. While the load set perpendicular had the lowest shear strength when subjected to a pull-out test. Furthermore, the load perpendicular to the grain had the most insufficient shear strength when subjected to the pull-out test. The stiffness at the connection was loose as the bonding area was subjected to more layers and intersection points. The photos for the shear stress and bondability study are shown in Figure 6.

3.3. Accuracy and Validation of Developed GRPS Models

Three criteria were used before obtaining the best regression model: (i) coefficient of determination (R2), (ii) mean square error (MSE) and (iii) model testing using new experimental data for verification. The accuracy of the developed equations is measured based on three (3) elements. The MSE is the ratio of the % of error between values. It measures the accuracy of the developed model predicted to the estimated data perfectly. The correlation coefficient for both parallel and perpendicular is shown in Table 7.

3.4. Model Testing of Developed GRPS Models with New Experimental Data

From the results, the model was proven to have a significant relationship between the dependent parameter against the independent parameters. The equations for both grain directions are shown below.
The Model Equation (1) (parallel) is GRPS0°
fv,0 = −40393.583 − 34.966ρ + 6795.051ω − 55822578.801A + 278205137.279v + 353.101r
The Model Equation (1) (perpendicular) is GRPS90°
fv,90 = 30086.271 − 35.742ρ + 40.827ω −3352536.477A + 74077053.258v + 282.762r

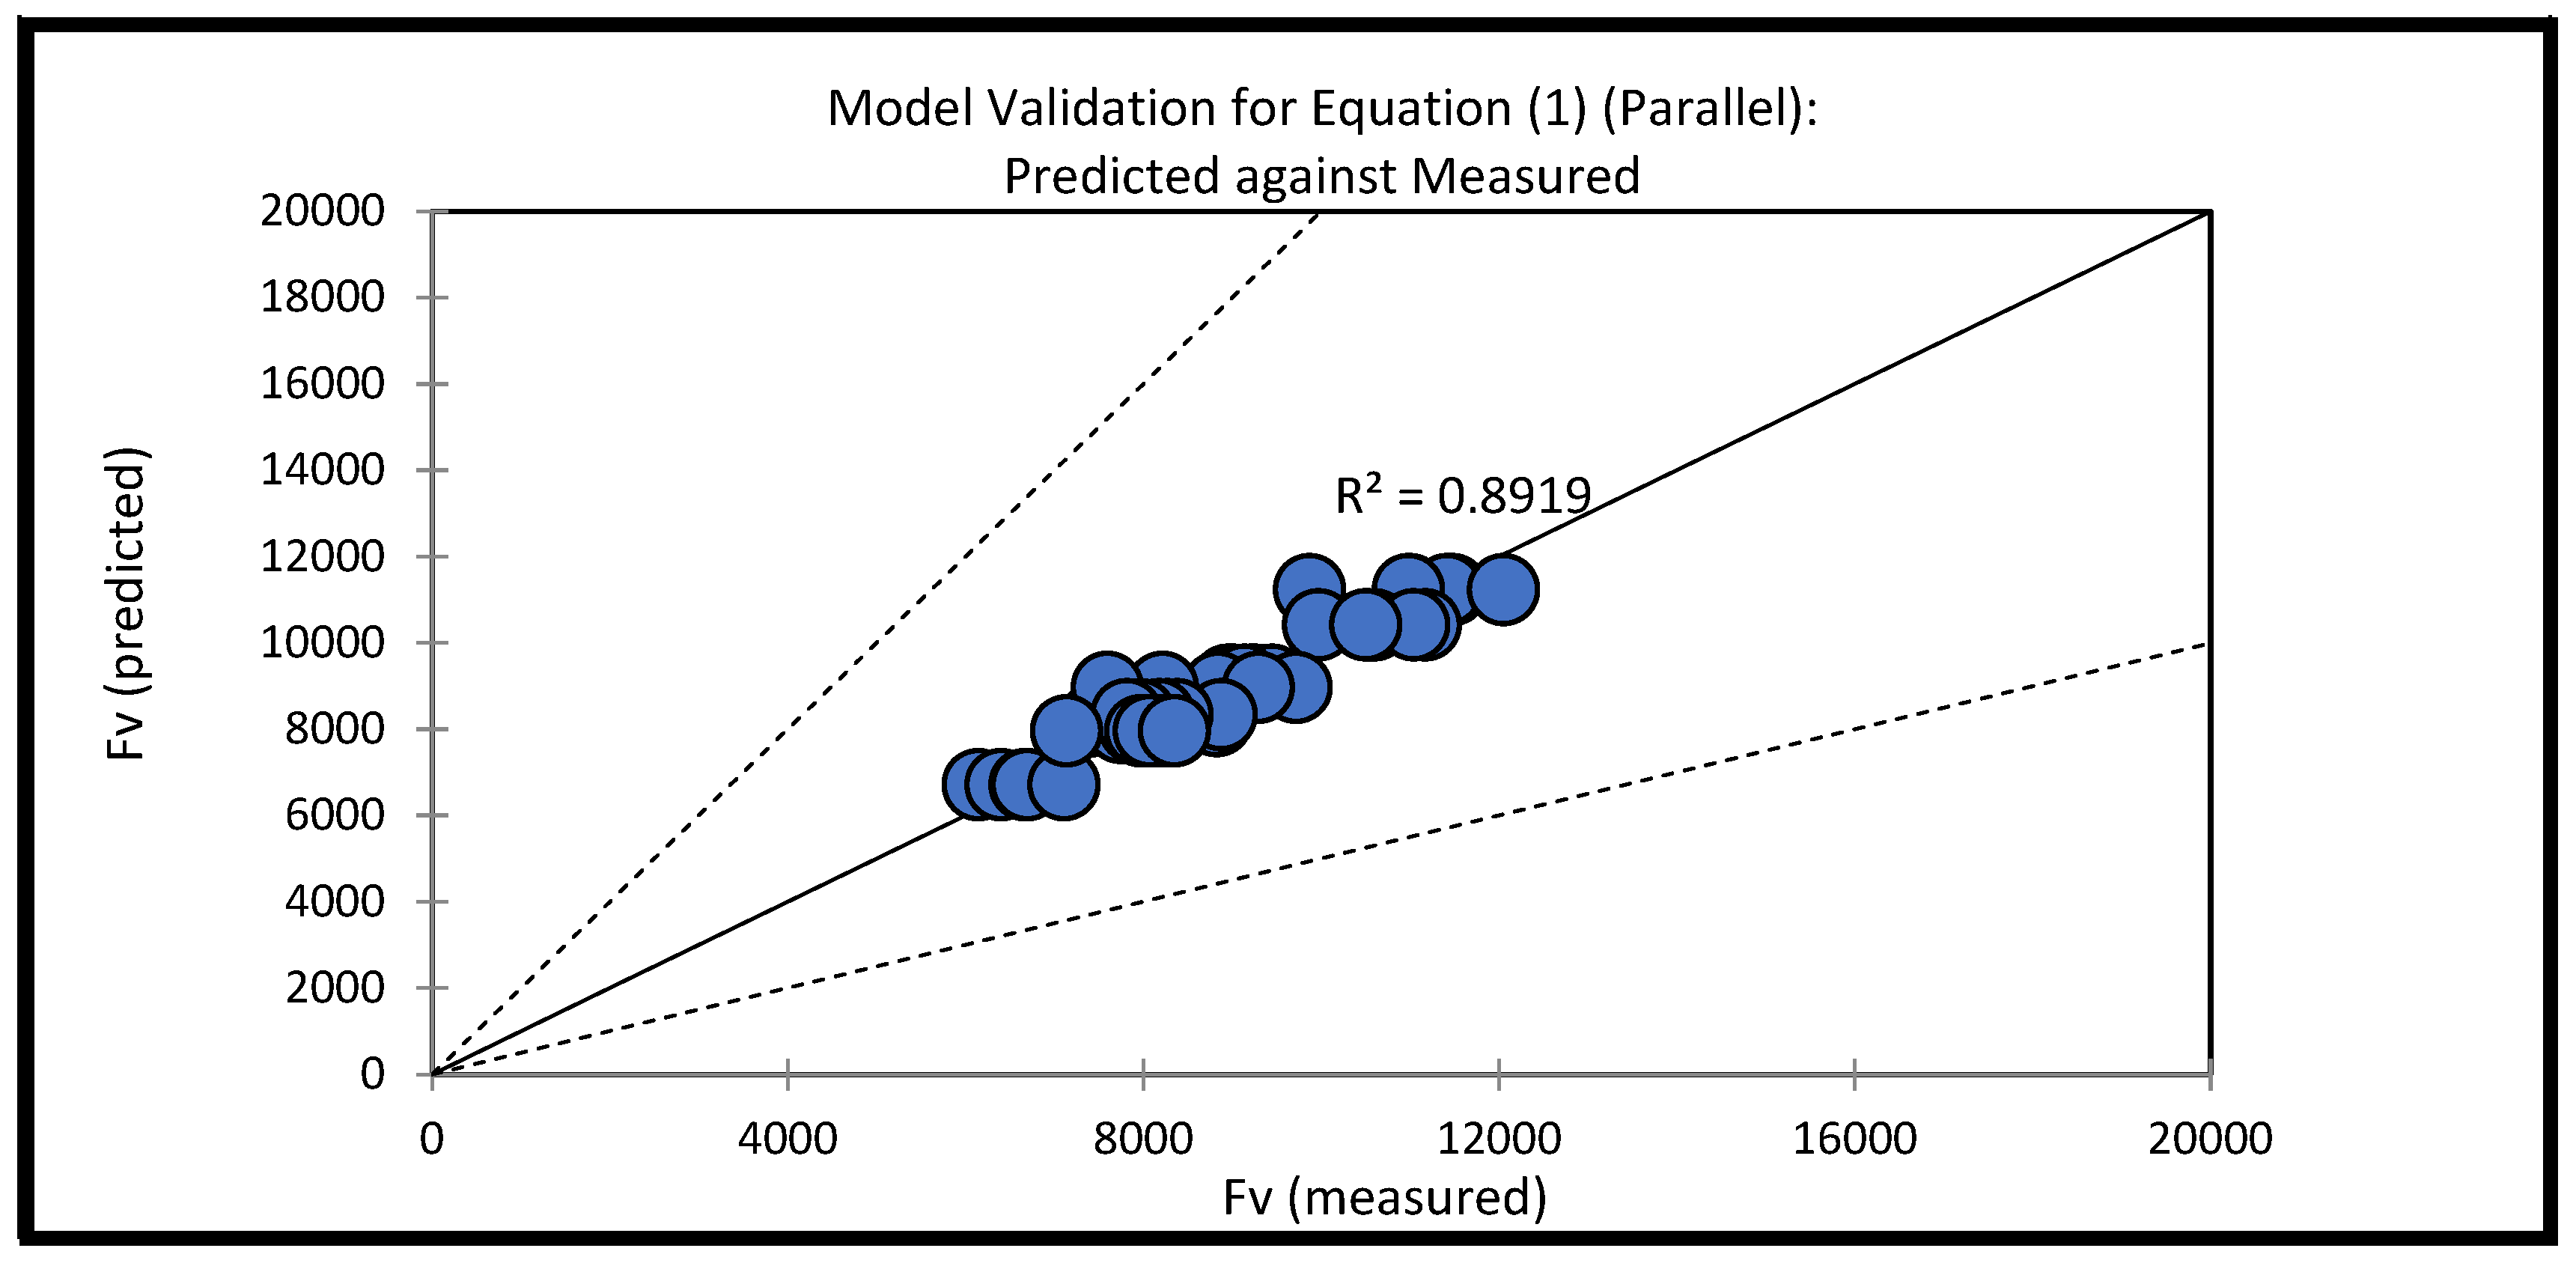
3.5. Validation Data Predicted against Measured Data for Parallel GRPS0° and Perpendicular GRPS90°

Validation of the newly developed shear strength equations (Equations (1) and (2)) has been conducted using data obtained from this study. There were 167 data collected from the experiment. Three (3) elements were used to measure the accuracy of the developed models; coefficient of determination (R2), mean square error (MSE) and model testing using new experimental data for verification. The MSE is the ratio of the % of error between values. Discrepancy ratio (DR) is the ratio of predicted values to the measured values, and these values are deemed accurate if the data lie between 0.5 to 2.
The discrepancy and percentage error were calculated from the model equation, GRPS0°-1 and GRPS0°-1. Figure 7 and Figure 8 shows the model validation was plotted and predicted against measurements for equations GRPS0°-1 and GRPS90°-1.
Validation for Model GRPS0° Equation, Equation (1) (GRPS0°−1) gives the best accuracy (DR = 89.19%) of the pull-out test results. The parameters included in the equation were Density (ρ), Moisture Content (ω), Area (A), Volume (v), and the ratio between rod size and glue thickness (r). These variables shown in Table 8 were evaluated for regression analysis to check the best-fitted regression equations.
Figure 5 and Figure 6 depict that most parameters have low correlation coefficients with the dependent variable. Therefore, the variable should be transformed to reduce the percentage of errors. The parameters with a high correlation coefficient (± 0.5–±1.0) will be selected for further equation development. As the data transform into the quadratic form, some of the parameters lay within the high range of correlation coefficient while some are not. The number of variables lay within the higher range coefficient, as suggested by Cohen et al. [20]. From the validated model, these findings show the equations are suitable to predict pull-out tests for 12, 16 & 20 mm for Mengkulang glulam timber.

4. Conclusions

It has been shown that extensive experimental work and theoretical analysis are vital in developing the new model equation. The reliability of sampling techniques must be consistent with the procedures proposed by past researchers. The parameters are carefully obtained and analysed with the study data. These parameters represent the behaviours of shear strength for the pull-out test and are significantly correlated with the sampled data.
From the modelling using SPSS for both parallel (GRPS0°) and perpendicular (GRPS90°), it can be concluded based on the observation using three criteria were used before obtaining the best regression model:
(i)
coefficient of determination (R2),
(ii)
mean square error (MSE) and
(iii)
model testing using new experimental data for verification.
The final GRPS formula, f v , k   :
f v , k = f Density ( ρ ) , Moisture   content ( ω ) ,   area ( A ) ,   volume ( v ) ,   the   ratio ( r )   between   rod   size   and   glue   thickness
GRPS0°(Parallel):
fv,0 = −40393.583 − 34.966ρ + 6795.051ω − 55822578.801A + 278205137.279v − 353.101r
And GRPS 90°(Perpendicular):
fv,90 = 30086.271 − 35.742ρ + 40.827ω − 3352536.477A + 74077053.258v + 282.762r

Author Contributions

Conceptualisation, R.H. and T.A.R.H.; methodology and investigation, T.A.R.H.; validation, formal analysis, T.A.R.H.; resources and data curation, B.A. and A.M.N.; writing—original draft preparation, T.A.R.H. and B.A.; writing—review and editing, S.M.S.; visualisation; supervision, R.H.; project administration, R.H.; funding acquisition, R.H. All authors have read and agreed to the published version of the manuscript.

Funding

This research was funded by the Ministry of Higher Education (MOHE) Malaysia, grant number (FRGS)FRGS/1/2018/TK01/UITM/02/21.

Data Availability Statement

Not applicable.

Acknowledgments

All authors would like to express utmost gratitude to Universiti Teknologi MARA, Malaysia, Centre of Infrastructure Geo-Hazards and Sustainable Materials (IGSM), SEGi University Kota Damansara, Petaling Jaya, Selangor, Malaysia.

Conflicts of Interest

The authors declare no conflict of interest.

References

  1. Kangas, J. Joints of Glulam Structures Based on Glued-In Ribbed Steel, 196; VTT Publications: Espoo, Finland, 1994. [Google Scholar]
  2. Riberholt, H. Glued bolts in glulam—Proposals for CIB code. In Proceedings of the 21st Conference of CIB-W18, Parksville, BC, Canada, September 1988. [Google Scholar]
  3. Ansell, M.P.; Smedley, D. Bonded-in technology for structural timber. Proc. ICE–Constr. Mater. 2007, 160, 95–98. [Google Scholar] [CrossRef]
  4. Itany, R.Y.; Faherty, K.F. Structural Wood Research, State-of-the-Art and Research Needs; ASCE: New York, NY, USA, 1984; p. 210. [Google Scholar]
  5. Bouchaīr, A.; Racher, P.; Bocquet, J.F. Analysis of dowelled timber to timber moment-resisting joints. Mater. Struct. 2007, 40, 1127–1141. [Google Scholar] [CrossRef]
  6. Bouchaïr, A. Modélisation non Linéaire du Comportement Local des Assemblages Bois. Ph.D. Thesis, Blaise Pascal University, Clermont-Ferrand, France, 1993. (Only Available In French). [Google Scholar]
  7. DS 413:1982; Code of Practice for The Structural Use of Timber. British Standards Institution (BSI): London, UK, 1982.
  8. EN 1995-2; (English): Eurocode 5: Design of timber structures—Part 2: Bridges [Authority: The European Union Per Regulation 305/2011, Directive 98/34/EC, Directive 2004/18/EC. European Committee for Standardization (CEN): Brussels, Belgium, 2004.
  9. MS 544-9; Fire-Resistance of Timber Structures: Section 1: Method of Calculating Fire Resistance of Timber Members. Department of Standards Malaysia, SIRIM: Shah Alam, Malaysia, 2001.
  10. EN 1995-1-1; Design of Timber Structures Part 1 (Vol. 144, Issue 6). European Committee for Standardization: Brussels, Belgium, 2004.
  11. EN 1995:1-2; Eurocode 5: Design of Timber Structures. European Committee for Standardization: Brussels, Belgium, 2004.
  12. Shakimon, M.N.; Hassan, R.; Malek, N.J.A.; Zainal, A.; Awaludin, A.; Hamid, N.H.A.; Lum, W.C.; Salit, M.S. European Yield Model Exponential Decay Constant Modification for Glulam after Fire Exposure. Forests 2022, 13, 2012. [Google Scholar] [CrossRef]
  13. Yeboah, D.; Taylor, S.; McPolin, D.; Gilfillan, R.; Gilbert, S. Behaviour of joints with bonded-in steel bars loaded parallel to the grain of timber elements. Constr. Build. Mater. 2011, 25, 2312–2317. [Google Scholar] [CrossRef]
  14. Stepinac, M.; Hunger, F.; Tomasi, R.; Serrano, E. Comparison of design rules for glued-in rods and design rule proposal for implementation in European standards. Working commision W18_timber structures comparison of design rules for glued-in rods and european standards. In Proceedings of the 46th Conference Of CIB-W18–Timber Structures of the International Council for Research and Innovation in Building and Construction, Vancouver, BC, Canada, 26–29 August 2013. [Google Scholar]
  15. Hussin, T.A.R.; Boss, S.; Hassan, R. Pull-out behaviour of two different glue lines thickness glued-in steel dowel for kempas species. Malays. Constr. Res. J. 2018, 25, 75–83. [Google Scholar]
  16. Mohamad, W.N.N.; Suliman, N.H.; Kamarudin, M.K.; Mohd-Amin, N.; Hassan, R. Pull-out strength steel rods bonded into mengkulang (Tarrietia Javanica) Glulam at five different angles to the grain. J. Trop. For. Sci. 2018, 30, 67–74. [Google Scholar]
  17. Kasim, M.; Quenneville, J.H.P. Effect of row spacing on the capacity of bolted timber connections loaded perpendicular-to-grain. In Proceedings of the CIBW18 Conference, Kyoto, Japan, September 2002. Paper 35-7-6. [Google Scholar]
  18. Gustafsson, P.J.; Serrano, E.; Aicher, S.; Johansson, C.J. A strength design equation for glued-in rods. Proc. Int. Relem’s 2001, 22, 324–327. [Google Scholar]
  19. Cohen, J.; Cohen, P.; West, S.G.; Aiken, L.S. Applied Multiple Regression/Correlation Analysis for the Behavioral Sciences, 3rd ed.; Lawrence Erlbaum: Mahwah, NJ, USA, 2003; 703p, ISBN 0-8058-2223-2. [Google Scholar]
  20. Faghani, P. Investigations on Pull-Out Strength of Timber Joints with Glued-In Rods. Master’s Thesis, University of British Columbia, Vancouver, BC, Canada, 2013. [Google Scholar]
  21. EN 1995:2001; Eurocode 5: Design of Timber Structures—Part 1-1: General-Common rules and rules for buildings. European Committee for Standardization (CEN): Brussels, Belgium, 2019.
  22. BS EN 26891; Timber Structures-Joints Made with Mechanical Fasteners–General Principles for the Determination of Strength and Deformation Characteristics. British Standards Institution: London, UK, 1991.
  23. MS758: 2001; Glued Laminated Timber. Performance Requirements and Minimum Production Requirements. Department of Standards Malaysia (SIRIM): Shah Alam, Malaysia, 2001.
  24. prEN 1995-2; Eurocode 5-Design of Timber Structures, Part 2: Bridges. Final Project Team Draft (Stage 34). Document CEN/TC 250/SC 5: N 198. European Committee for Standardization CEN: Brussels, Belgium, 2003.
  25. Feligioni, L.; Lavisci, P.; Duchanois, G.; De Ciechi, M.; Spinelli, P. Influence of glue rheology and joints thickness on the strength of bonded-in rods. Holz Als Roh-Und Werkst 2003, 61, 281–287. [Google Scholar]
  26. Steiger, R.; Serrano, E.; Stepinac, M.; Rajčić, V.; O’Neill, C.; McPolin, D.; Widmann, R. Strengthening of timber structures with glued-in rods. Constr. Build. Mater. 2015, 97, 90–105. [Google Scholar] [CrossRef] [Green Version]
  27. Rossignon, A.; Espion, B. Experimental assessment of the pull-out strength of single rods bonded in glulam parallel to the grain. Eur. J. Wood Wood Prod. 2008, 66, 419–432. [Google Scholar] [CrossRef]
  28. Hair, J.F.; Anderson, R.E.; Tatham, R.L.; Black, W.C. Multivariate Data Analysis; Prentice-Hall: Englewood Cliffs, NJ, USA, 1995. [Google Scholar]
Figure 1. Specification of Glulam Block for Pull-Out Strength Test; (A) Parallel (PR0°) and (B) Perpendicular (PP90°).
Forests 14 00491 g001
Figure 2. Pull-out Test Set Up.
Forests 14 00491 g002
Figure 3. Position of The Test Slice.
Forests 14 00491 g003
Figure 4. Dumbbell-Shape; (A) Aluminium Mould; (B) Specimen.
Forests 14 00491 g004
Figure 5. Tensile Testing Machine.
Forests 14 00491 g005
Figure 6. Sample of The Specimens of Glued-In Rod Tested for Both Directions: (A) Parallel and (B) Perpendicular to The Grain.
Forests 14 00491 g006
Figure 7. Model Validation for Equation (1) [GRPS0°-1].
Forests 14 00491 g007
Figure 8. Model Validation for Equation (1) [GRPS90°-1].
Forests 14 00491 g008
Table 1. Specimens Preparation.
Rod SizeGlue Line ThicknessNo of SamplesSample Size
ParallelPerpendicular
1221818100 × 100 × 100
1631718115 × 115 × 115
2041818170 × 170 × 170
Total samples5354
Table 2. The Concept of the Derived Equation and Variables Involved.
InvestigatorsMain EquationShear Strength/Additional Parameters
[2] R a x , m e a n   = f w s × ρ k ×   d × l a   ;   for   l a     200   mm
R a x , m e a n   = f w s × ρ k × d × l a   ;   for   l a     200   mm
f w s   a n d   f w s   are   equal   to   520   N / mm 2
[24] R a x , k   = π   × d e q u   ×   l a × f v , k   f v , k = 1.2 × 10 3 × d e q u 0.2 ×   ρ 1.5  
[25] R a x , k   = π     × l a     f v , k   ·   d e q u f a x , m e a n   = f v , 0 , m e a n     x     π   × ` O × l a
f v , k = 1.2 × 10 3 × d e q u 0.2 ×   ρ 1.5
[26] F a s , m e a n   = f v , 0 , m e a n     × π × d h   × l f v , 0 , m e a n     = 7.8 N mm 2 λ 10 1 / 3
[27] F a x , m e a n   = 0.15 λ 2 + 9.24 λ × d d 16 1.6 F v , 0 , m e a n   = 5.8 × λ 10 1.44
Table 3. Linear Relationships of DV and IVs for GRPS0° and GRPS90°.
ParametersCoefficient of Determination, R2
Parallel (GRPS0°)Perpendicular (GRPS90°)
Density0.86110.9457
Moisture Content0.86820.8682
Area0.86370.8447
Ratio0.8070.9464
Glue Thickness0.95840.8637
Embedded Length0.2550.1841
Rod Diameter0.28230.0925
Table 4. General Correlation Coefficients.
CorrelationNegativePositive
Small−0.29 to −0.100.10 to 0.29
Medium−0.49 to −0.300.30 to 0.49
Large−1.00 to −0.500.50 to 1.00
Table 5. GRPS0° of Glued-In Parallel to Grain Direction for Rod 12 mm, 16 mm and 20 mm Diameter.
Rod Diameter (mm)121620
Glue-Thickness (mm)Load Carrying CapacityStrengthLoad Carrying CapacityStrengthLoad Carrying CapacityStrength
Load (kN)Disp. (mm)Stress (MPa)Strain (%)Load (kN)Disp. (mm)Stress (MPa)Strain (%)Load (kN)Disp. (mm)Stress (MPa)Strain (%)
2Mean (kN)51.8213.365.650.1191.157.446.110.08121.868.204.960.05
351.526.436.220.0883.935.997.650.08120.498.715.750.05
447.255.725.570.0786.395.867.260.07152.527.225.820.05
Table 6. GRPS90° of Glued-In Perpendicular to Grain Direction for Rod 12 mm, 16 mm and 20 mm Diameter.
Rod Diameter (mm)121620
Glue-Thickness (mm)Load Carrying CapacityStrengthLoad Carrying CapacityStrengthLoad Carrying CapacityStrength
Load (kN)Disp. (mm)Stress (MPa)Strain (%)Load (kN)Disp. (mm)Stress (MPa)Strain (%)Load (kN)Disp. (mm)Stress (MPa)Strain (%)
2Mean (kN)42.935.804.680.0673.277.182.980.04120.047.414.890.05
3247.065.625.130.0665.776.252.670.04134.708.715.480.05
450.256.465.470.0775.137.253.060.04140.577.725.720.05
Table 7. Correlation Coefficients for Parallel and Perpendicular to the Grain Directions.
ModelRegression MethodEquation NoModel Performance
GRPS Equations% ErrorMSE (%)R2
GRPS0°Multiple LinearGRPS0°-1 fv,00.6720.1630.945
GRPS90°Multiple LinearGRPS90°-1 fv,900.6770.6100.250
where; fv,0 = −40393.583 − 34.966ρ + 6795.051ω − 55822578.801A + 278205137.279v − 353.101r; fv,90 = 30086.271 − 35.742ρ + 40.827ω − 3352536.477A + 74077053.258v + 282.762r.
Table 8. Discrepancy Data for Validation of Model Testing.
Model EquationsDiscrepancyPercentage (%) Different
GRPS0°-1 1.3020.32
GRPS0°-1 1.0212.33
Disclaimer/Publisher’s Note: The statements, opinions and data contained in all publications are solely those of the individual author(s) and contributor(s) and not of MDPI and/or the editor(s). MDPI and/or the editor(s) disclaim responsibility for any injury to people or property resulting from any ideas, methods, instructions or products referred to in the content.

