Article

Characterisation of Methane Production Pathways in Sediment of Overwashed Mangrove Forests †

1
Research Center for Oceanography, National Research and Innovation Agency (BRIN), Jl. Pasir Putih 1, Ancol Timur, Jakarta 14430, Indonesia
2
Research Center for Radiation Process Technology, National Research and Innovation Agency (BRIN), Jl. Lebak Bulus Raya No. 49, Cilandak, Jakarta 12440, Indonesia
3
Fenner School of Environment and Society, The Australian National University, B141, Linnaeus Way, Acton, Canberra 2601, Australia
4
Research School for Earth Science, The Australian National University, 142 Mills Rd, Acton, Canberra 0200, Australia
5
Faculty of Science and Technology, Islamic State University-Syarif Hidayatullah, Gedung FST, Jl. Lingkar Kampus UIN, Ciputat Timur, Kota Tangerang Selatan 15412, Indonesia
*
Author to whom correspondence should be addressed.
This manuscript is part of a Ph.D. thesis by the first author, available online https://openresearch-repository.anu.edu.au/handle/1885/173111 (accessed on 12 March 2022).
Forests 2023, 14(3), 564; https://doi.org/10.3390/f14030564
Submission received: 31 December 2022 / Revised: 27 February 2023 / Accepted: 9 March 2023 / Published: 13 March 2023
(This article belongs to the Special Issue Biodiversity, Health, and Ecosystem Services of Mangroves)

Abstract

:
Methane (CH4) emissions in mangrove ecosystems may complicate the ecosystem’s potential carbon offset for climate change mitigation. Microbial processes and the mass balance of CH4 in mangrove sediment are responsible for the emissions from the ecosystems. This is the follow up of our previous research which found the super saturation of CH4 in the pore water of mangrove sediment compared to atmospheric CH4 and the lack of a correlation between pore water sulphate and CH4 concentrations. This study is going to investigate methane production pathways in the sediment of overwashed mangrove forests. Two approaches were used to study methanogens here: (1) the spread plate count method and the quantitative polymerase chain reaction (qPCR) method, and (2) laboratory experiments with additional methanogenic substrates (methanol, acetate, and hydrogen) to determine which substrates are more conducive to methane production. According to the qPCR method, methanogen abundance ranged from 72 to 6 × 10⁵ CFU g−1 sediment, while SRB abundance ranged from 2 × 10² to 2 × 10⁵ CFU g−1 sediment. According to the plate count method, the abundance of methylotrophic methanogens (the only group of methanogens capable of competing with SRBs) ranged from 8.3 × 10² to 5.1 × 10⁴ CFU g−1, which is higher than the abundance of the other group of methanogens (0 to 7.7 × 10² CFU g−1). The addition of methanol to the sediment slurry, a substrate for methylotropic methanogens, resulted in a massive production of CH4 (up to 9 × 10⁴ ppm) and intriguingly the control treatments with autoclaving did not kill methanogens. These findings suggested that mangrove ecosystems in the marine environment provide favourable conditions for methanogens and further characterisation of the methanogen involved in the process is required. As a result, future research in this ecosystem should include methane production in carbon offset calculations, particularly due to methylotropic methanogenesis.

1. Introduction

Methanogenesis, or the production of methane in wetlands, is critical to the global carbon cycle. This is the final stage of anaerobic organic matter decomposition, producing methane (CH4), one of the most potent greenhouse gases. Methanogenesis, along with methanotrophy or CH4 oxidation in the aerobic zone of wetlands, regulates CH4 fluxes from the sediment to the atmosphere. Wetlands contribute 20%–40% of global CH4 emissions [1,2], which may increase as a result of climate change, resulting in increased inundation frequency and organic carbon supply, both of which are critical factors in CH4 production [3,4].
With climate change, the increase in the Earth’s surface temperature and CO2 could amplify the feedback of wetland sediment to climate change through controlling methanogenesis and methanotrophy. Warming temperatures cause more methanogens or methane-producing microorganisms to proliferate, resulting in faster methanogenesis [5], with an optimum temperature range from 35 °C to 42 °C [6]. This warming could also cause methanotrophs or methane-eating bacteria, such as those found in permafrost and alpine grass meadows, to oxidise CH4 [7,8]. Methanogenesis occurs in rice fields during the ripening stage, and warm temperatures may hasten this process [9]. Elevated CO2 concentrations in the atmosphere generally increase plant productivity, producing photosynthate and increasing root exudation, which increases the supply of organic substrates for consumption by methanogens [10,11,12,13]. The interaction of increased CO2 and warmer temperatures can stimulate more organic matter decomposition, reducing O2 and thereby inhibiting methanotrophs to oxidise CH4 [9,14,15].
Increased rainfall frequency and sea-level rise due to climate change also play an important role in wetland sediments. An increased frequency of heavy rainfall lengthens the period of soil submergence and should boost methanogenesis [5,16], but methanotrophy may also decrease [17]. A sea-level rise changes the extent and frequency of inundation in coastal wetlands [18], promoting new anoxic zones [19], which are ideal for methanogen growth [20]. However, the effects of sea-level rise on methanotrophy in coastal areas have not yet been studied [3].
In coastal wetlands, sulphate reduction complicates the CH4 cycle. Sulphate-reducing bacteria (SRBs) appear to outcompete methanogens for the same substrates of H2, CO2, and C2H3O2 (acetate), which are commonly found in marine environments [21]. These methanogens which use H2/CO2 and C2H3O2 substrates are known as hydrogenotrophic and acetotrophic methanogens, respectively. However, there is a methanogen group known as methylotrophic methanogen that can coexist with SRB. SRBs do not use methylated compounds (e.g., methanol, trimethylamine, and dimethylamine) as carbon sources, whereas this group does. Oremland and Polcin [22] discovered this phenomenon in laboratory studies and classified the compounds as non-competitive substrates. Numerous in situ studies have also shown that methylotrophic methanogens always coexist with the other methanogens and SRBs [23,24,25,26,27]. Nonetheless, under laboratory conditions, SRBs can oxidise some other methylated compounds (e.g., dimethyl sulphide and methanethiol) [28,29]. More intriguingly, SRBs may collaborate with methanotrophs to oxidise CH4 in anaerobic conditions.
Mangroves are coastal wetlands that produce less CH4 than freshwater wetlands due to SRBs’ high abundance in marine environments [30,31,32,33]. However, Ulumuddin et al. [34] discovered the super saturation of CH4 in the pore water of mangroves on Tanakeke Island, Indonesia, when compared to its equilibrium state with atmospheric CH4. Furthermore, Ulumuddin et al. [34] found that pore water sulphate did not correlate with CH4 concentrations. Ramamurthy et al. [35] initially described this phenomenon while looking into the prevalence of methanogens and SRBs in Indian mangrove sediment. Via substrate enrichment with methanol and methylamine on an isolated methanogen from mangrove sediment, Mohanraju et al. [36] further examined whether methanogens might compete with SRBs. Jing et al. [37] used a genetic technique to document the coexistence of methylotrophic, acetotrophic, and hydrogenotrophic methanogens in Singaporean mangrove sediment, with the latter being the major group. Yet, methanogens that are acetotrophic and methylotrophic outnumber hydrogenotrophic methanogens in sediment that has been contaminated with heavy metals. To explain the phenomenon outlined in Ulumuddin et al.’s work [34], therefore, we hypothesise that methylotrophic methanogens may play an important role in methanogenesis at our mangrove site in Tanakeke Island.
In this study, two approaches were conducted to investigate the occurrence of methylotrophic methanogenesis in mangrove sediment. To gain an insight into the dominant group of methanogens, the spread plate count method and qPCR method were used. Experiments with additional methanogenic substrates (i.e., methanol, acetate, and hydrogen) were carried out in the laboratory to determine which substrates are more conducive to methane production.

2. Methodology

2.1. Study Location and Sampling Site

The research was carried out in Dusun Lantangpeo, Tanakeke Island, South Sulawesi, Indonesia (5°70′ S and 119°170′ E) (Figure 1), as detailed in Ulumuddin et al. [34]. Tanakeke is a coralline island about 10 km from the Sulawesi mainland, located in the Takalar (administrative) District of the Province of South Sulawesi. It is about 40 km southwest of Makassar, the province’s capital. The island’s climate is tropical, with two distinct seasons. It has a wet season from November to April, and a dry season from May to October, characterised by occasional rainfalls. The annual average precipitation is around 3000 mm, with the wet season accounting for roughly 80% of the total. With the exception of minor diurnal or seasonal fluctuations, air temperature is relatively stable. The annual mean minimum and maximum air temperatures are around 25 and 32 °C, respectively, with an overall annual mean air temperature of around 28 °C.
In the sampling site, mangrove forests are overwashed mangroves, whereby mangrove vegetation grows in sandy sediments surrounded by seagrass beds and coral reefs [34]. As a result, the mangrove sediment’s surface is essentially flat. Tides inundate the mangrove vegetation on a daily basis, which is one low tide and one high tide per day, with a maximum difference of one metre between low and high tide. At the highest high tide, seawater covers the soil surface to a depth of about 0.5 m.
We used three sites from Ulumuddin et al. [34] who established nine study sites, including three new regeneration sites (5 years), three old regeneration sites (>10 years), and three natural sites as control sites. Here, sediment sampling for microbial enumeration and sediment slurry experiments was performed at only one site per site group, namely Sites 1, 2, and 3 (Figure 1). However, remember that Ulumuddin et al. [34] utilised distinct codes for these locations, specifically Sites 3, 5, and 8.

2.2. Sample Collection and Analytical Methods

The spread plate count method and qPCR method of extractable functional genes were used to count microbes. These methods were used in this study because they provided complementary results that demonstrated all possible processes in sediment respiration. The spread plate count method required 1 g of sediment, whereas the qPCR method required approximately 0.25 g.

2.2.1. Sample Collection

The sediment was sampled using the same technique for both the plate count and the qPCR method. For the qPCR method, sampling occurred during both the dry and wet seasons, but only during the dry season for the other method. Due to this study being intended to confirm the important role of methylotrophic methanogens found in previous research [34], each chosen site had only one sediment core collected (i.e., Sites 1, 2, and 3 using a 100 cm hand auger). The sediment core was sampled from the surface to a depth of 50 cm and then cut into five separate 10 cm sections. Each 10 cm slice was sub-sampled by scooping out the slice’s inner section with a spatula. After that, the sub-samples were placed in three sterile Eppendorf tubes until they were full. The sediment sample tubes were kept in a zip lock plastic bag. Before zipping the bag, the air inside was flushed with ultra-high-purity nitrogen (UHP N2) for about a minute and then squeezed out. The bag was sealed with sticky tape to reduce air exchange and placed in a cool box before being delivered to a laboratory. The sediment samples for the spread plate count method were processed as soon as possible in the laboratory, while the sediment samples for qPCR analysis were stored (at −4 °C) until further processing.

2.2.2. Microbial Enumeration

The sediment samples were inoculated into the selective agar medium, which is known as artificial saliva, for the spread plate counting by pouring the sediment slurry. The slurry was provided by diluting the sediment samples 10 times in a row. To begin, 1 g sediment was mixed with 0.85% NaCl to make a total solution volume of 5 mL. After vortexing the sediment suspension, 0.1 mL was transferred to the clean tube and diluted with 0.85% NaCl to a total volume of 1 mL. The dilution was then repeated ten times, and the last three dilutions (i.e., 10−8–10−10) were chosen to be poured into the agar medium for the isolation of methylotrophic methanogens. The dilutions chosen to isolate acetotrophic methanogens were 10−4 to 10−6. Hydrogenotrophic methanogens were excluded from this microbial enumeration because we isolated methanogens on the agar medium, which we found difficult to amend with CO2/H2 for hydrogenotrophic substrates. We also provided untreated agar media as a control to make sure that the isolated microorganisms were methanogens.
The selective agar medium used in this study for methanogen isolation was a recipe for rumen methanogens [38]. Aquadest in the volume of 250 mL, 30 mL macromineral, 0.15 mL micromineral, 30 mL buffer solution, 1.6 mL Resazurin, 20 mL reduction solution, and 10 g agarose were used to make it. The macrominerals were 5.7 g L−1 Na2HPO4, 6.2 g L−1 KH2PO4, and 1 g L−1 MgSO4.7H2O, while the microminerals were 132 g L−1 CaCl2.2H2O, 100 g L−1 MnCl2.4H2O, 10 g L−1 CaCl2.6H2O, and 10 g L−1 FeCl3. The buffer solution was made by diluting 35 g NaHCO3 and 4 g NH4HCO3 in 1 L aquadest. The resazurin solution was made by dissolving 1 g resazurin in 1 L aquadest, and the reduction solution was made by diluting 373 mg Na2S.H2O and 2.6 mL of 1 mol L−1 NaOH in 62 mL aquadest. The agar media for isolating methylotrophic methanogens contained 25 mL of 5% methanol, while the media for acetotrophs contained 25 mL of 25% acetate. The colony count of methanogens was performed after a 72 h incubation period in an anaerobic jar [39], and was expressed as colony form unit per gram of wet sediment (CFU g−1).
Prior to enumerating CFU g−1 using the qPCR method, bacterial or archaeal DNA were isolated using a MOBIO PowerSoil kit [25]. The DNA was extracted according to the kit’s instructions. To begin, 0.25 g samples were vortexed in Power Bead tubes before being centrifuged at 10,000× g for 30 s. The samples were then serially centrifuged with the provided solutions to obtain a 100 µL DNA solution. The DNA extracts were kept at −20 °C before being used to build the targeted genes and count their abundance.
The targeted genes were constructed using qPCR on a PCR, the LightCyler Nano Instrument (Roche). To detect methanogen populations, we used the methyl coenzyme M reductase (mcrA) gene. The genes for particulate methane monooxygenase (pmoA) and dissimilatory sulphite reductase beta subunit (dsrB) were used to identify methanotrophs and sulphite-reducing bacteria (SRBs). A µ1 L DNA extract was used as a template for PCR with a reaction mixture containing SYBR green I dye (Toyobo, Osaka, Japan) and the primers for the targeted genes are listed in Table 1. During pre-incubation, the temperature of the qPCR was set to 95 °C for 1 min. The PCR amplification took 45 cycles (denaturation at 95 °C for 5 s, annealing at 60 °C for 15 s, and elongation at 72 °C for 30 s).
The target genes were estimated using the cycle quantification value (Cq) generated via qPCR. A standard curve of Cq and gene copies were used to calculate the number of target gene copies, while the abundance of bacteria (CFU g−1) was estimated from the target gene copies. Ideally, a standard curve is generated via serial dilution of the pure target gene solution, but we did not have it. Thus, we created a standard curve using gene copies from a pure culture of Escherichia coli strain InaCC B5 to provide a relative abundance of bacteria groups (i.e., methanogens, SRBs, and methanotroph) based on the value of Cq. This approach is not precise at estimating the absolute abundance but it is useful to make a comparison between samples or bacteria groups, because there are linear relationships of CFU g−1 vs. gene copies and Cq vs. gene copies in the literature (Table 2). For the case of E. coli, Oliver et al. [43] noted that CFU g−1 samples are correlated with gene copy g−1 samples (R = 0.82), while Dong et al. (2019) created a standard curve of E. coli and the regression model between Cq and CFU g−1 with R2 = 0.99. Here, we also created the regression model of CFU g−1 of E. coli vs. Cq to estimate the relative abundance of bacteria groups (CFU g−1). To provide this model, ten standard E. coli DNA suspensions of varying concentrations were prepared from a 4.6 × 10¹⁰ CFU mL−1 (4.6 × 10¹⁰ CFU g−1) E. coli suspension diluted ten times. It should be noted, however, that the estimate using the regression model was not intended to show the absolute copy numbers of target genes, but rather to compare relative abundance among different bacteria/archaea groups (in CFU g−1 sediments) in this research.

2.2.3. Sediment Slurry Experiments

Replicate sediment slurry experiments were carried out in sterile 120 mL bottles in order to identify the major pathways of methanogenesis for CH4 production from mangrove sediment samples amended with methanol, acetate, and H2 substrates (Table 3). A 10 g sediment sample from each slice was weighed in the laboratory, stored in a 120 mL bottle, and then mixed with 10 mL seawater collected from the mangrove waters. Throughout this preparation, UHP N2 was continuously flushed inside the bottle to maintain a consistent low oxygen environment. Thirty mL of 10 mM liquid methanogenic substrates (i.e., methanol and acetate) were poured into the sediment slurry before the bottles were sealed with grey butyl rubber stoppers. H2 was added to the sediment slurry by flushing it with 100% H2 for about 1 min before sealing. There were two control treatments, as follows: (1) the sediments were autoclaved at 121 °C for 2 h and received no amendment of any of the three methanogenic substrates, and (2) untreated sediments that were not autoclaved and received no substrates. All bottles were kept in the dark and at room temperature. The gas headspace was sampled once a week, beginning 7 days after the preparation and lasting approximately 5 weeks. The autoclave treatments were sampled only on the last day of the experiment. On Days 0 and 28, all sediment slurries were microbially counted using the spread plate count method in units of CFU mL−1 slurry. On Day 28, during the peak of CH4 concentration, sediment slurries were collected using syringes to avoid gas contamination.
Gas headspace samples were collected using plastic syringes. A 20 mL gas sample was withdrawn from each bottle. The same volume of UHP N2 was injected into the experiment bottle to compensate for the gas pressure change. The gas samples were transferred into gas-tight aluminium bags (Shanghai Sunrise Instrument Co., Ltd., Shanghai, 15 × 15 cm2, 30 mL). These sample bags were sent to the Greenhouse Gases Laboratory of the Research Institute for Agricultural Environment of the Indonesian Agency for Agricultural Research and Development in Pati, Central Java, Indonesia, for further analysis. Shimadzu type 14A gas chromatography (GC) equipped with a flame ionisation detector and a Porapak Q packed column was used to analyse the gas samples. The GC was set to 25 °C (injector), 50 °C (column), and 300 °C (detector). For CH4, this instrument has a detection limit of 0.12 ppmv.

3. Results

3.1. Abundances of Methanogens, Methanotrophs, and SRBs

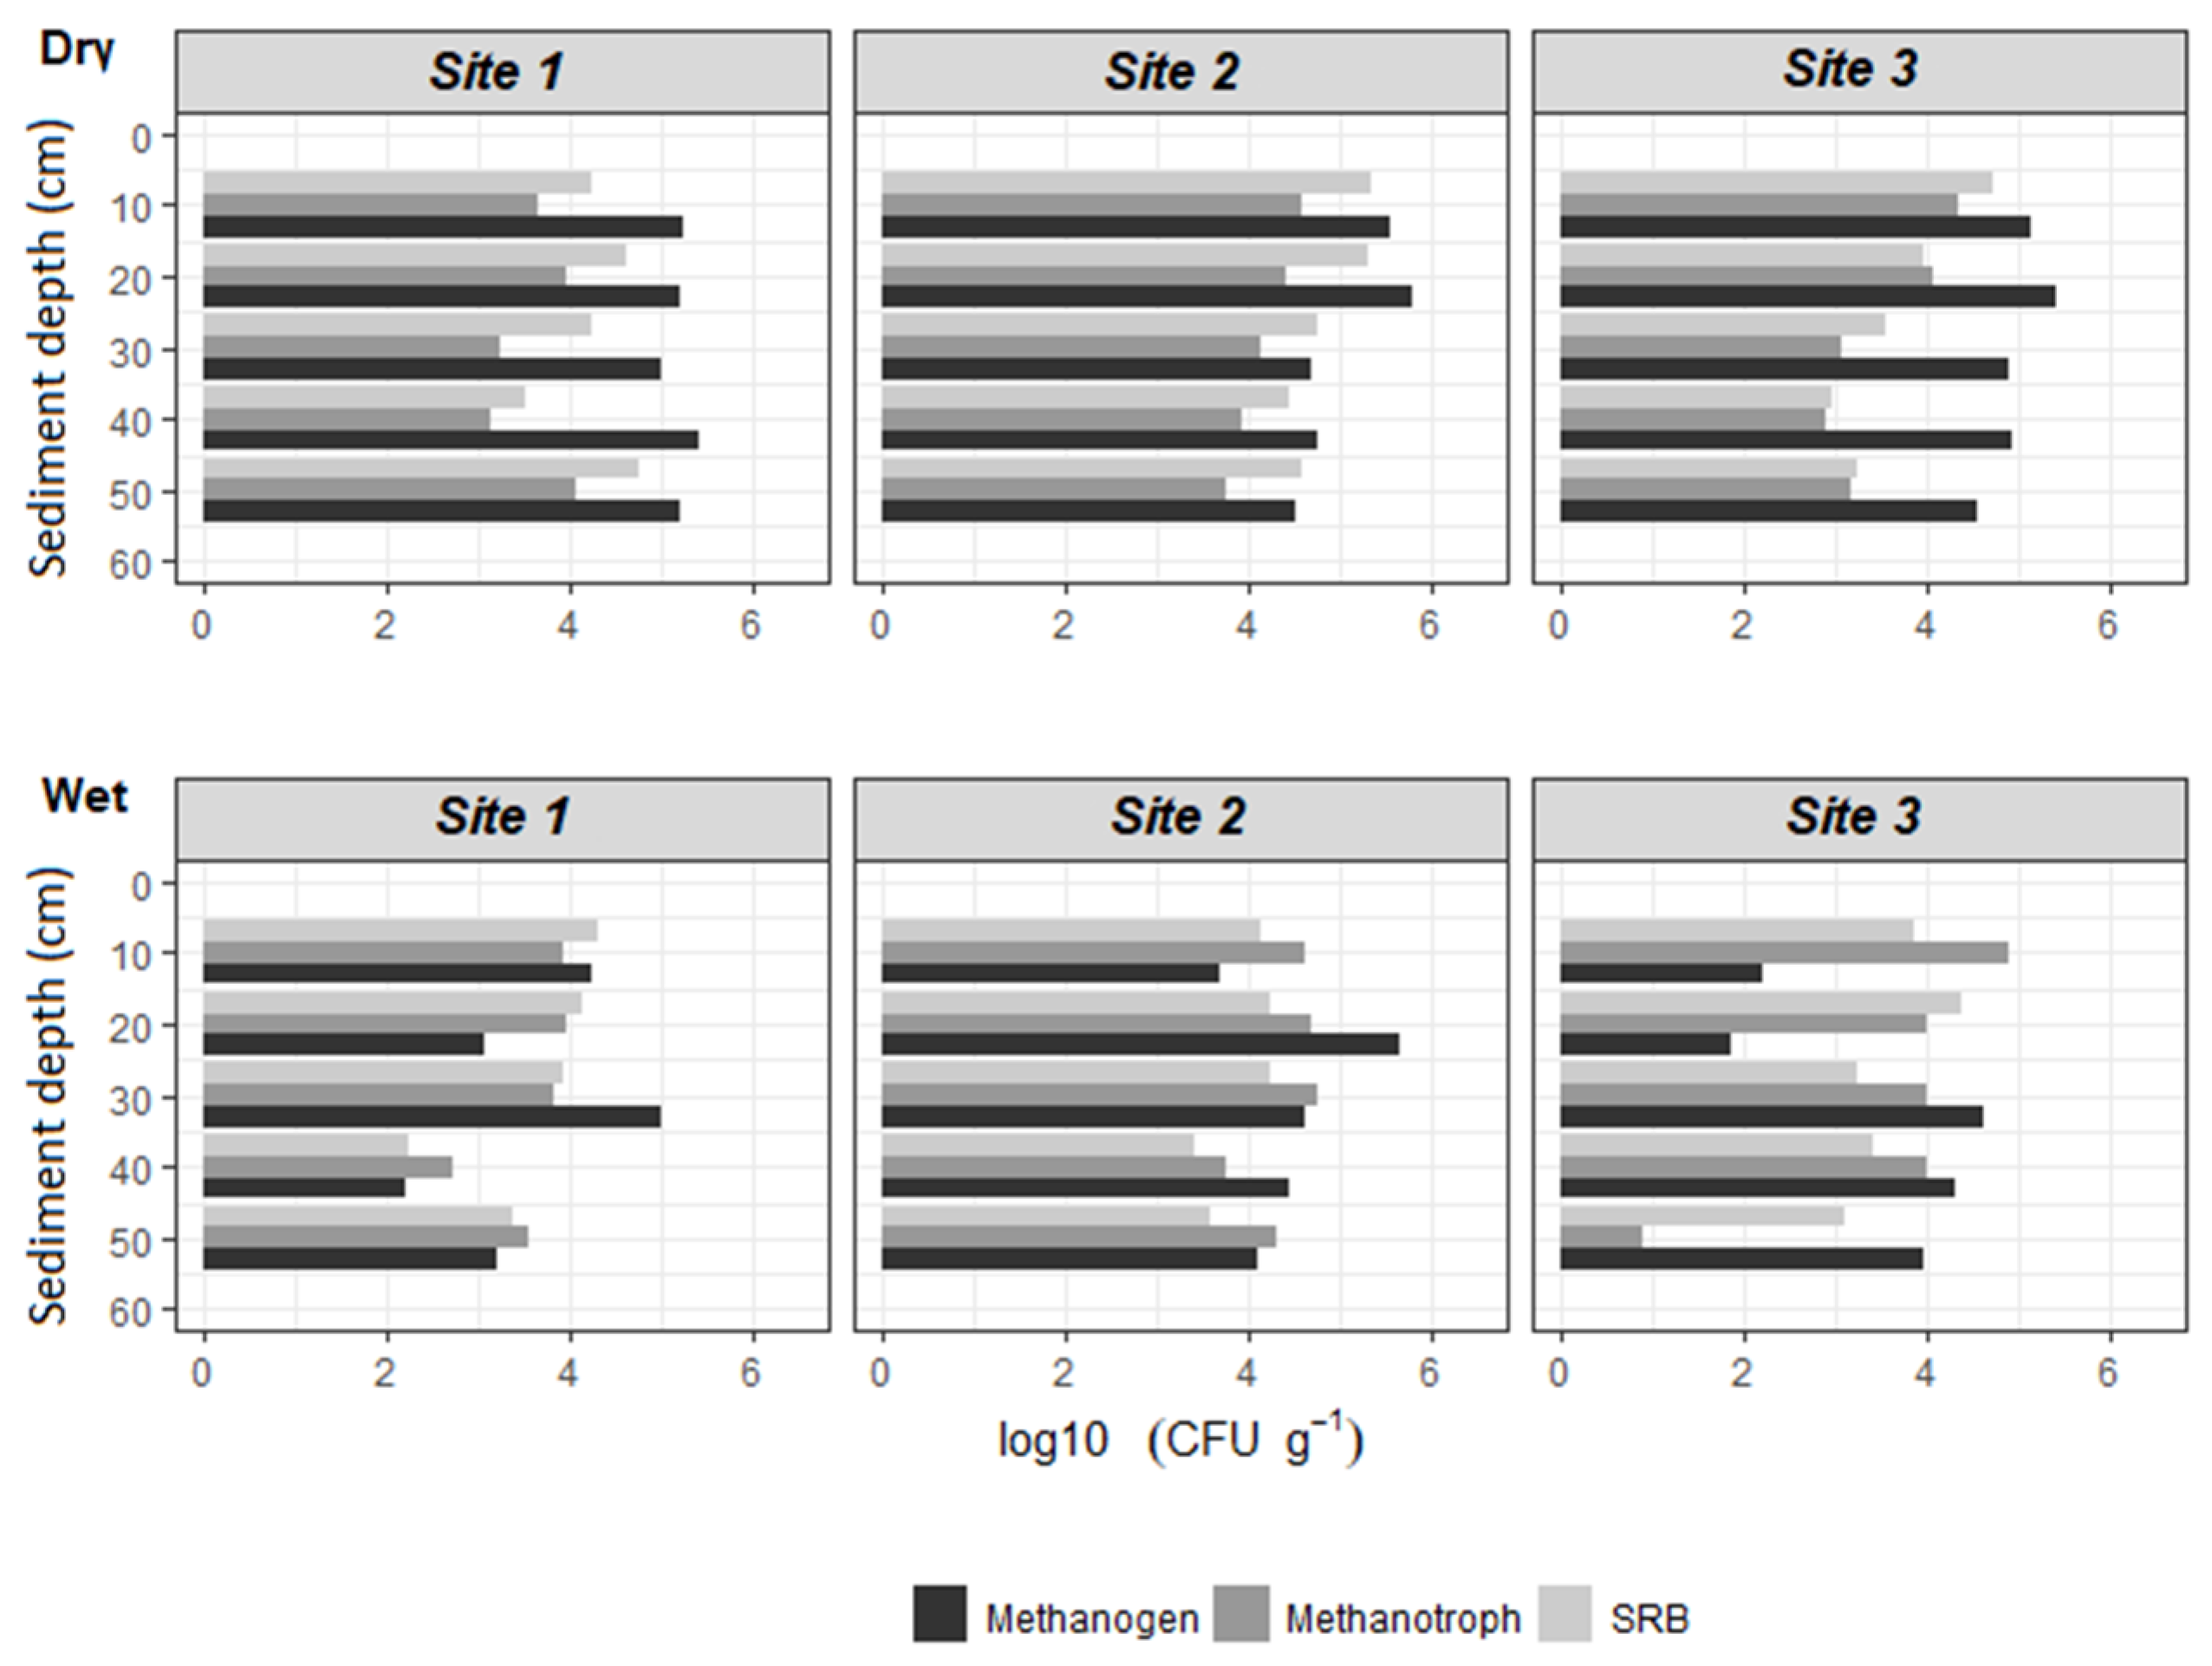
The estimation of relative abundance of methanogens, methanotrophs, and SRBs based on the qPCR method showed that methanogen abundance was generally higher than SRB abundance at the three sampling sites (Sites 1, 2, and 3). The relative abundance of methanogens in the sediment samples ranged between 72 and 6 × 10⁵ CFU g−1 sediment, while SRBs ranged from 2 × 10² to 2 × 10⁵ CFU g−1 sediment (Figure 2). During the wet season, however, the relative abundance of SRBs was greater than that of methanogens in the surface sediments (10–20 cm). The relative abundance of methanotrophs ranged between 7 and 8 × 10⁴ CFU g−1 sediment. The relative abundance of methanotrophs was found to be one order of magnitude lower than that of methanogens and SRBs.
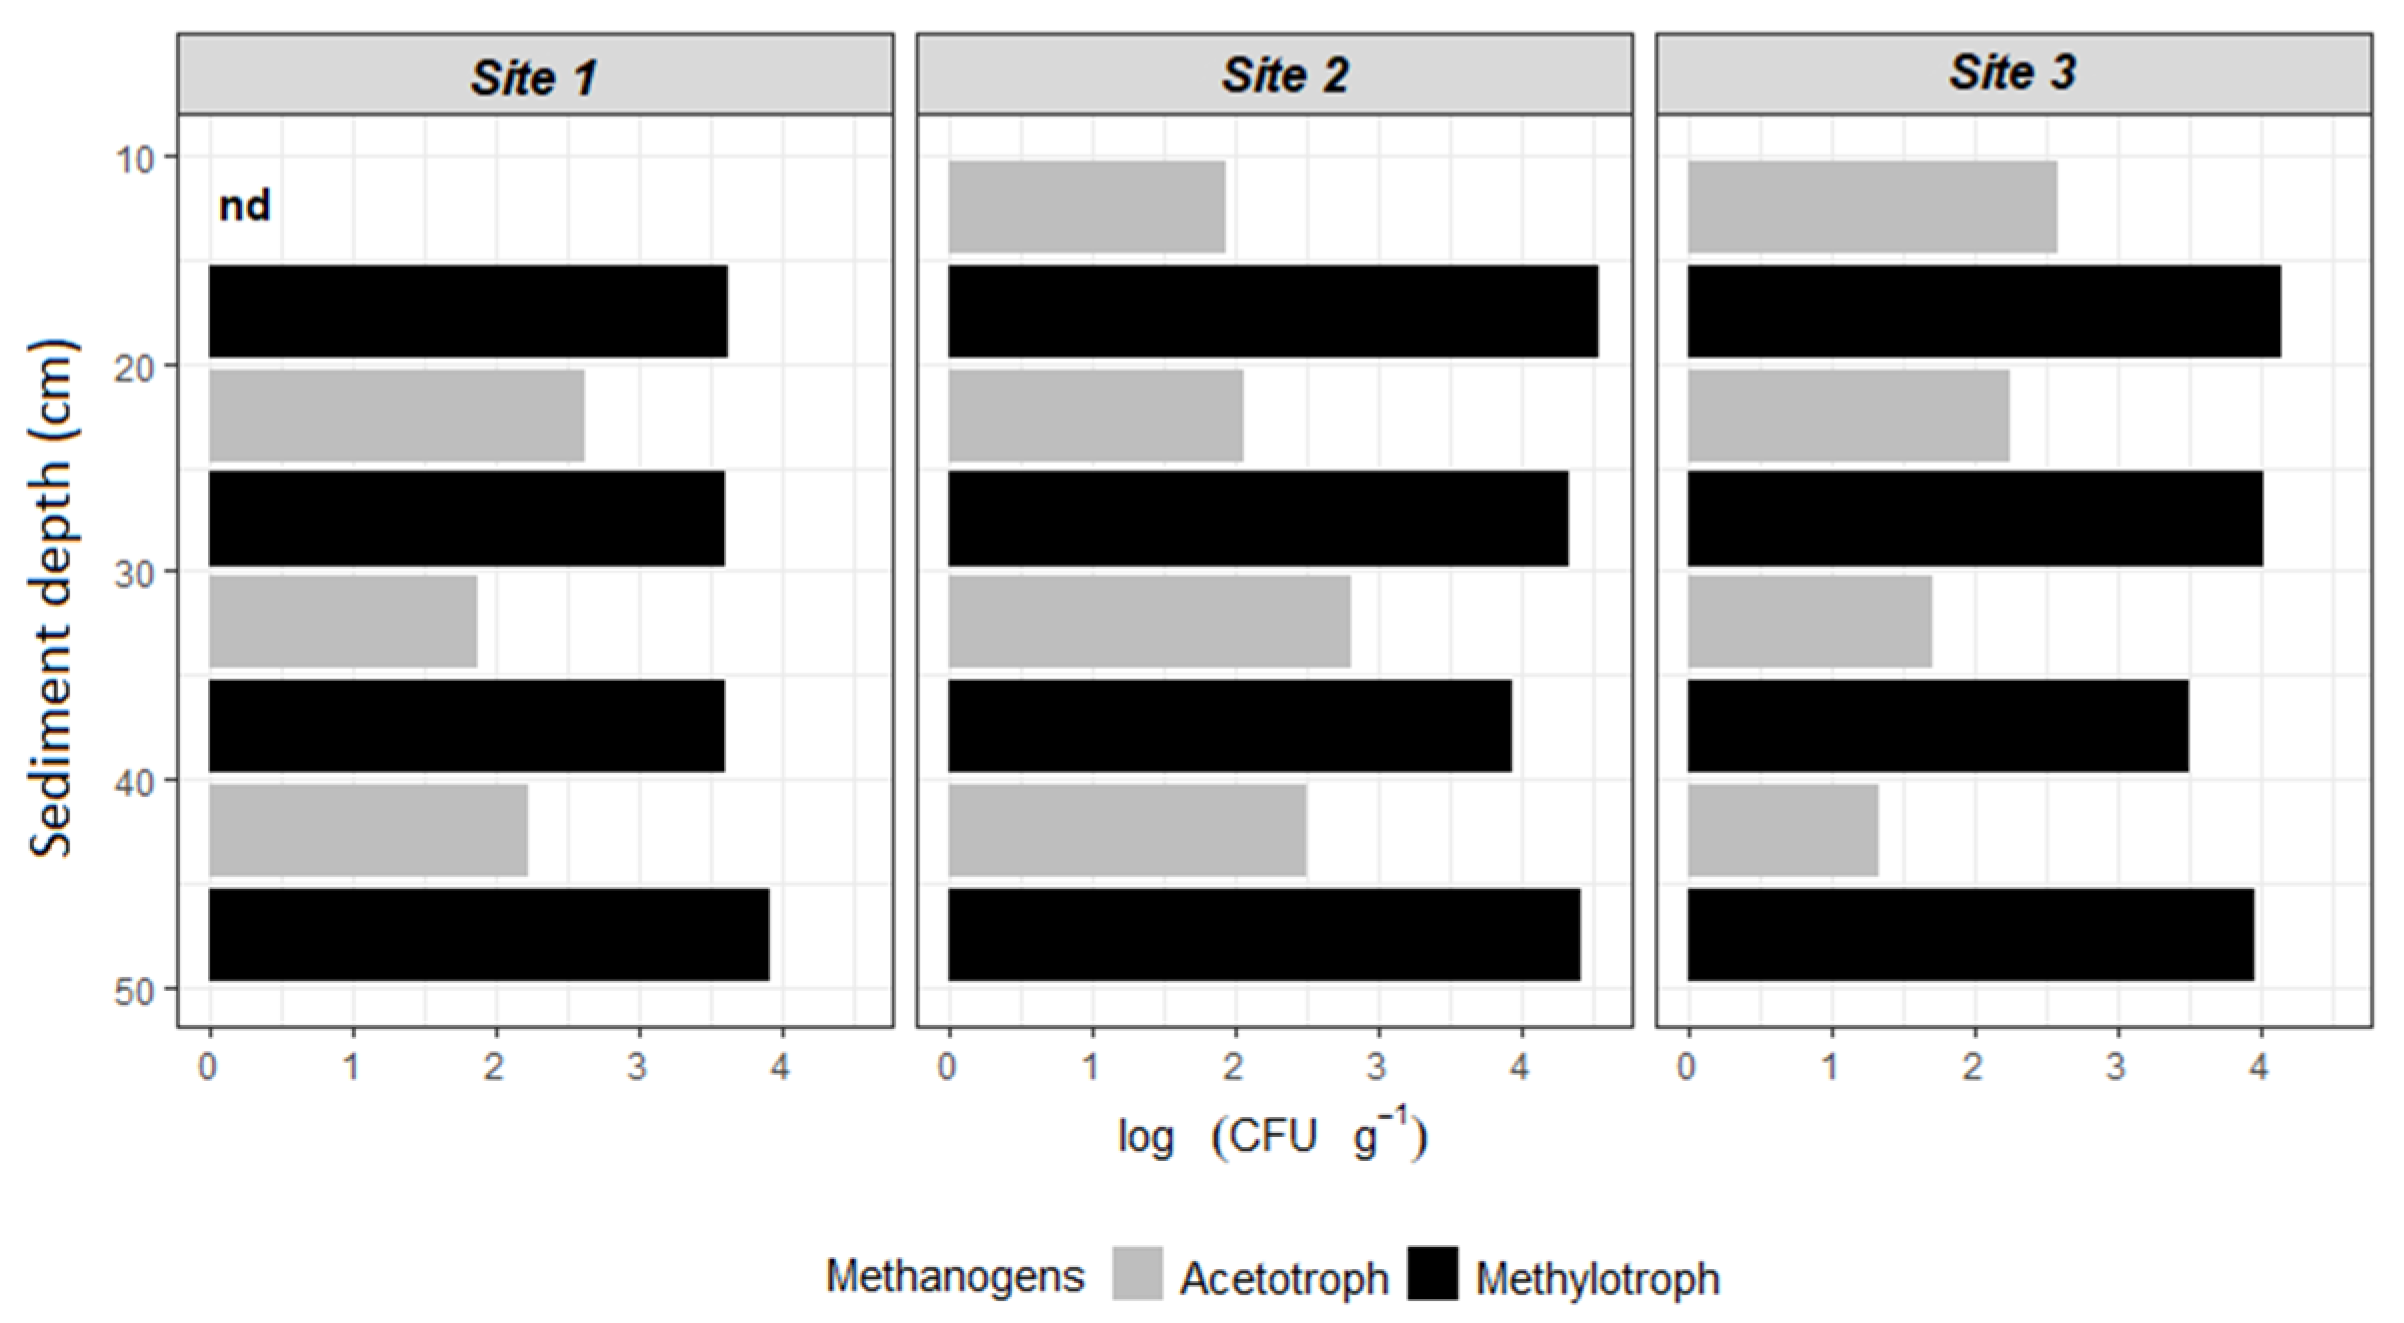
The abundance of methylotrophic and acetotrophic methanogens (CFU g−1) revealed by the plate count method is depicted in Figure 3. The abundances of methylotrophic methanogens ranged from 8.3 × 10² to 5.1 × 10⁴ CFU g−1, while the abundances of acetotrophs ranged from 0 to 7.7 × 10² CFU g−1. In other words, methylotrophic methanogens were two orders of magnitude more abundant than acetotrophs. Only during the dry season was this dominance observed in all 50 cm sediment depths at the three selected sites (i.e., Sites 1, 2, and 3). Here, we assumed that hydrogenotrophic methanogens were lower than methylotrophic methanogens, as evidenced by the high number of SRBs in qPCR results (Figure 2). SRBs outcompeted hydrogenotrophic methanogens, resulting in a low abundance of this methanogen. Therefore, the dominance of methylotrophic pathways is clear in the current study sites.

3.2. Potential CH4 Production

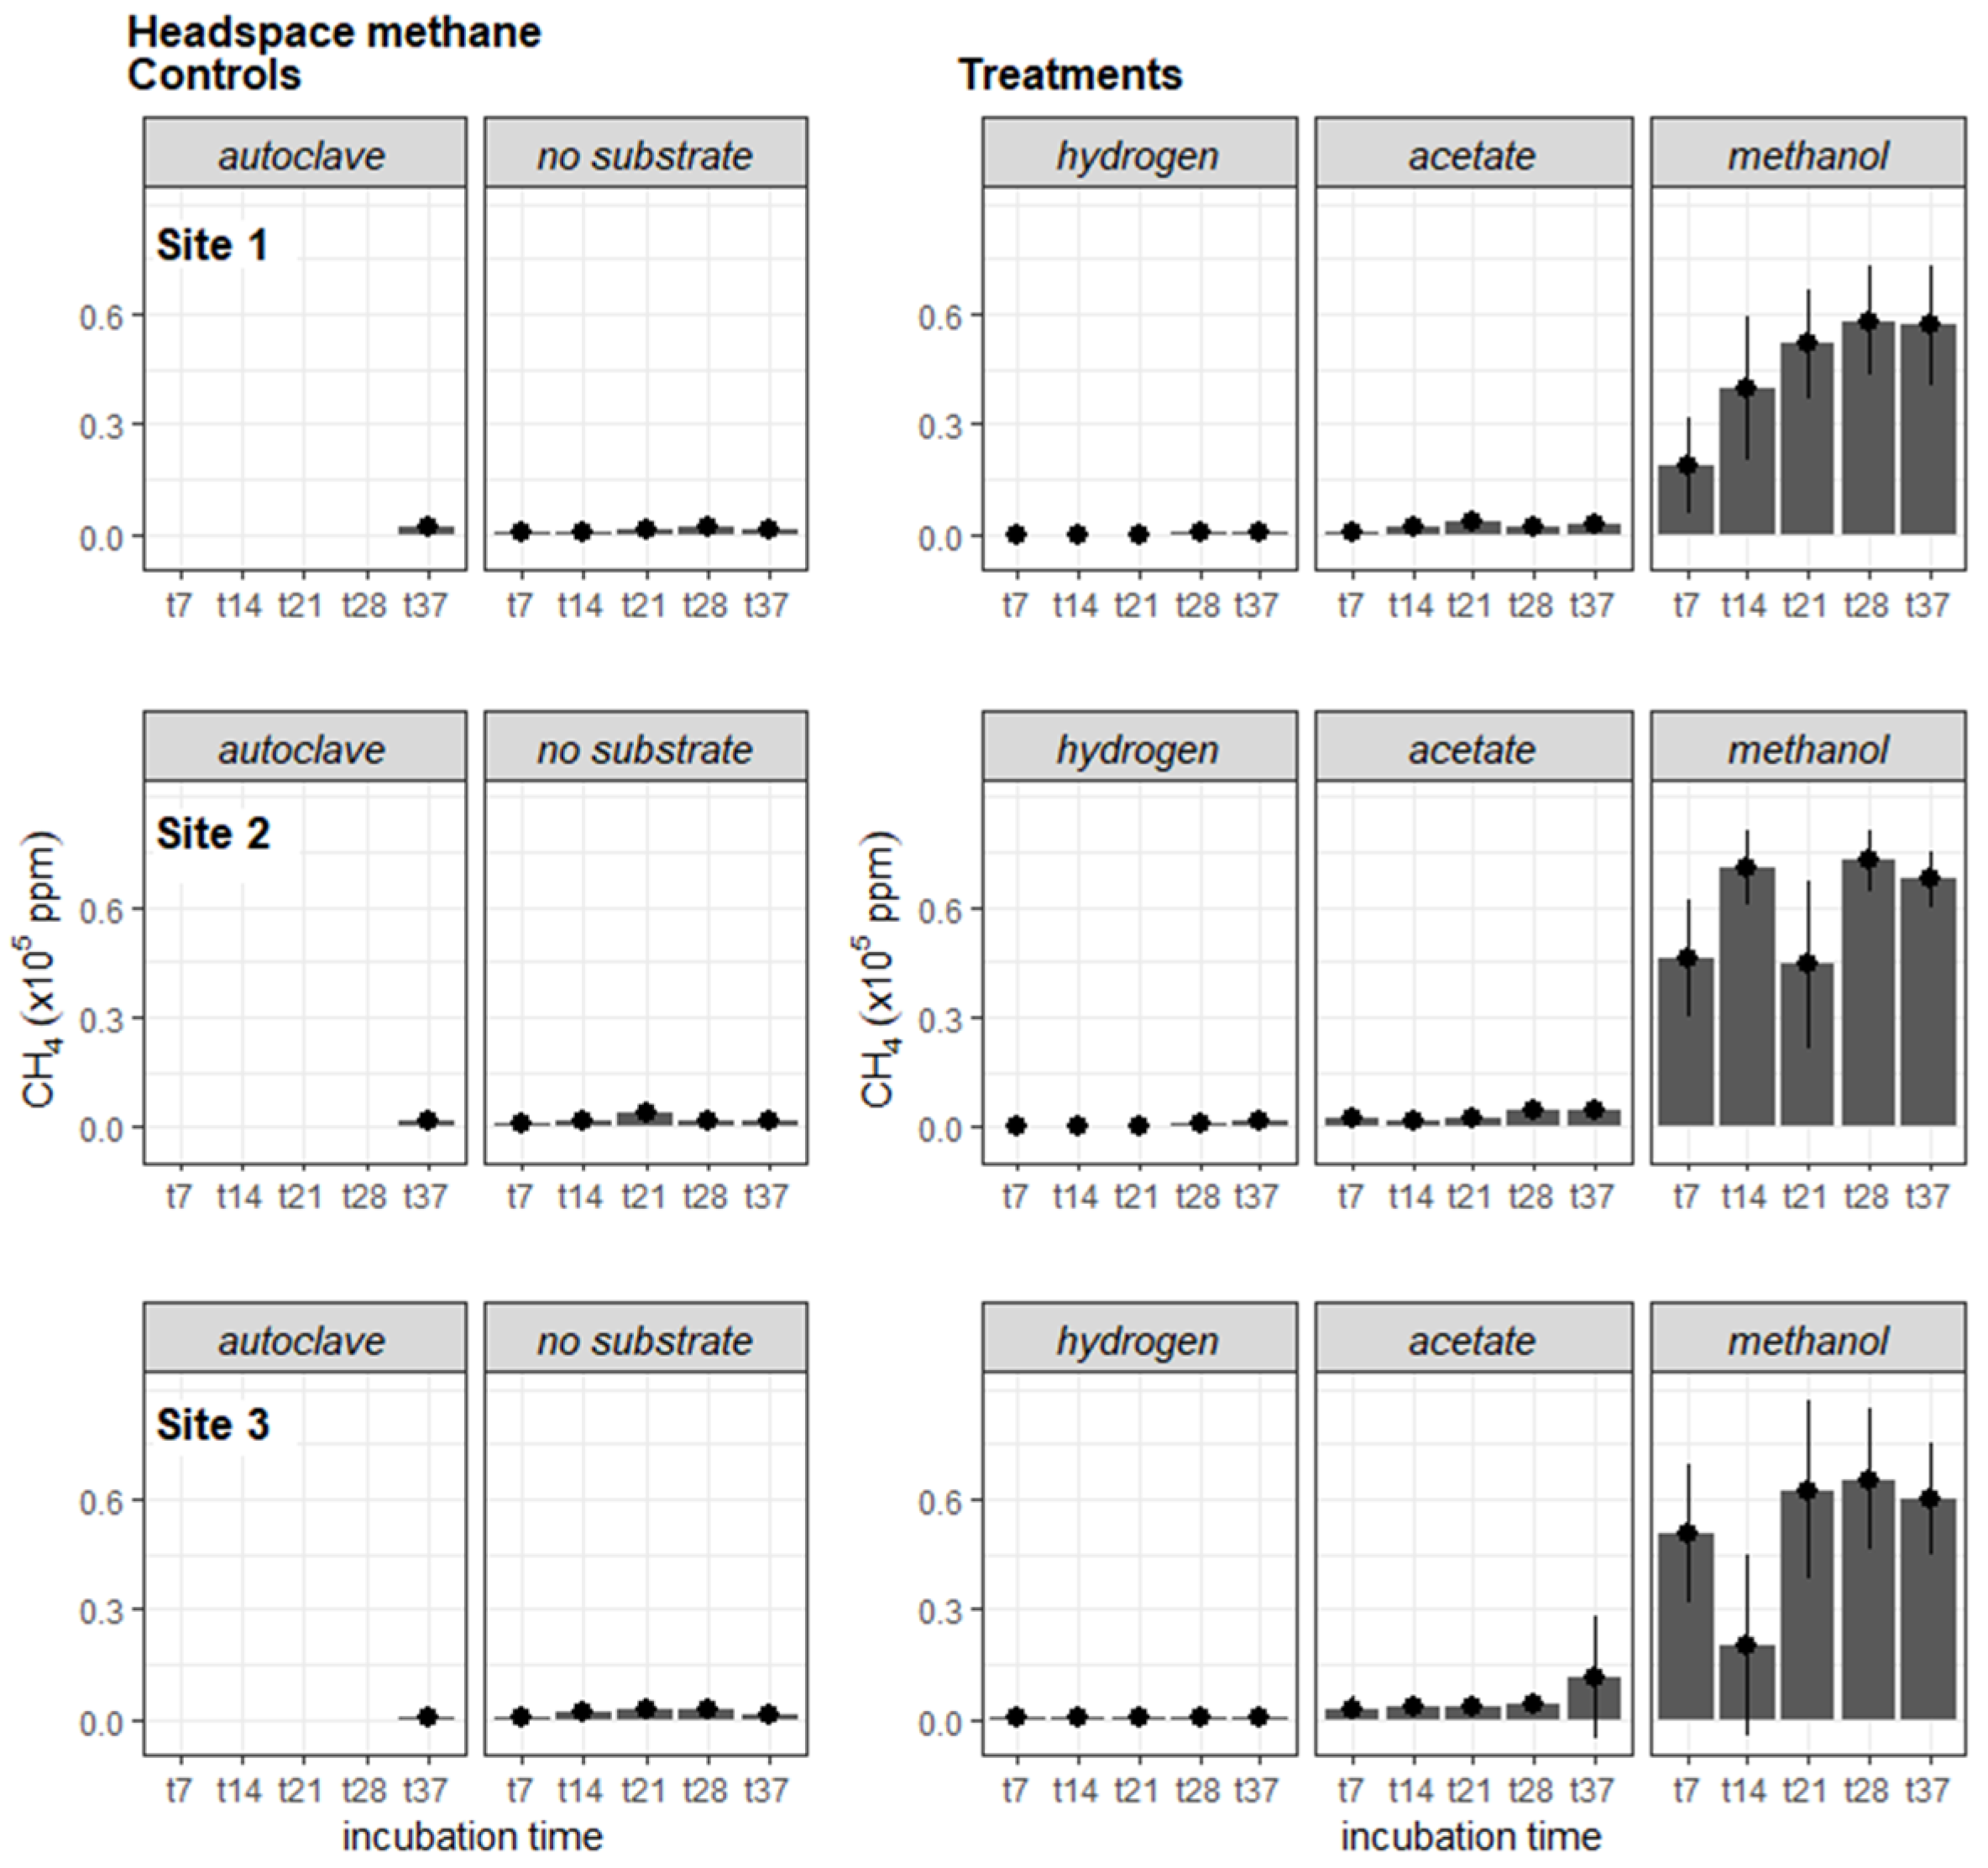
Methanol addition to sediment slurries resulted in a massive amount of CH4, up to 9 × 10⁴ ppm (Figure 4). Due to the lack of a clear pattern with sediment depth, the headspace CH4 was presented as an average of two replicates and five depths in this figure. The surge of CH4 in the methanol amendment occurred similarly in all three sites from the first measurement on Day 7 to the end on Day 37. On Day 7, the headspace CH4 concentration at Site 1 was 1.9 (±1.8) × 104 ppm and continued to rise. It peaked at 5.8 (±2.1) × 104 ppm on Day 28 and then began to fall slightly by Day 37. Similarly, on Day 28, Sites 2 and 3 showed peaks with values of 7.3 (±1.2) × 104 and 6.8 (±2.5) × 104 ppm, respectively. By Day 37, they had also shown a slight decrease. The minimum CH4 value at Site 2 was 4.4 (±3.2) × 104 ppm (Day 21), while it was 2 (±3.4) × 104 ppm at Site 3 (Day 14).
The headspace CH4 observed in the methanol amendment treatment was one to two orders of magnitude greater than that observed in the control experiments (Figure 4). The magnitudes for autoclaved sediments ranged from 3.3 (±8.1) × 102 to 1.9 (±2.1) × 103 ppm, while values for no substrate amendments ranged from 4 (±9) × 102 to 3.7 (±3.6) × 103 ppm. Meanwhile, the other two treatments had headspace CH4 levels on par with the controls.
The methanogen colonies on the selective agar media were counted on Days 0 and 28 of the incubation period, confirming that methylotrophic methanogens were important in methane production in the sediment samples (Figure 5). The methanol amendment treatment clearly demonstrated that the abundance of methylotrophs on Day 28 was approximately eight orders of magnitude greater than those on Day 0. Furthermore, similar results were obtained in the other treatments and controls, indicating that SRB did not inhibit methylotrophic methanogens. These figures were observed at all three of the sites chosen (i.e., Site 1, 2, and 3). Even though the sediment samples had been autoclaved, methylotrophic methanogens survived and were able to grow normally.
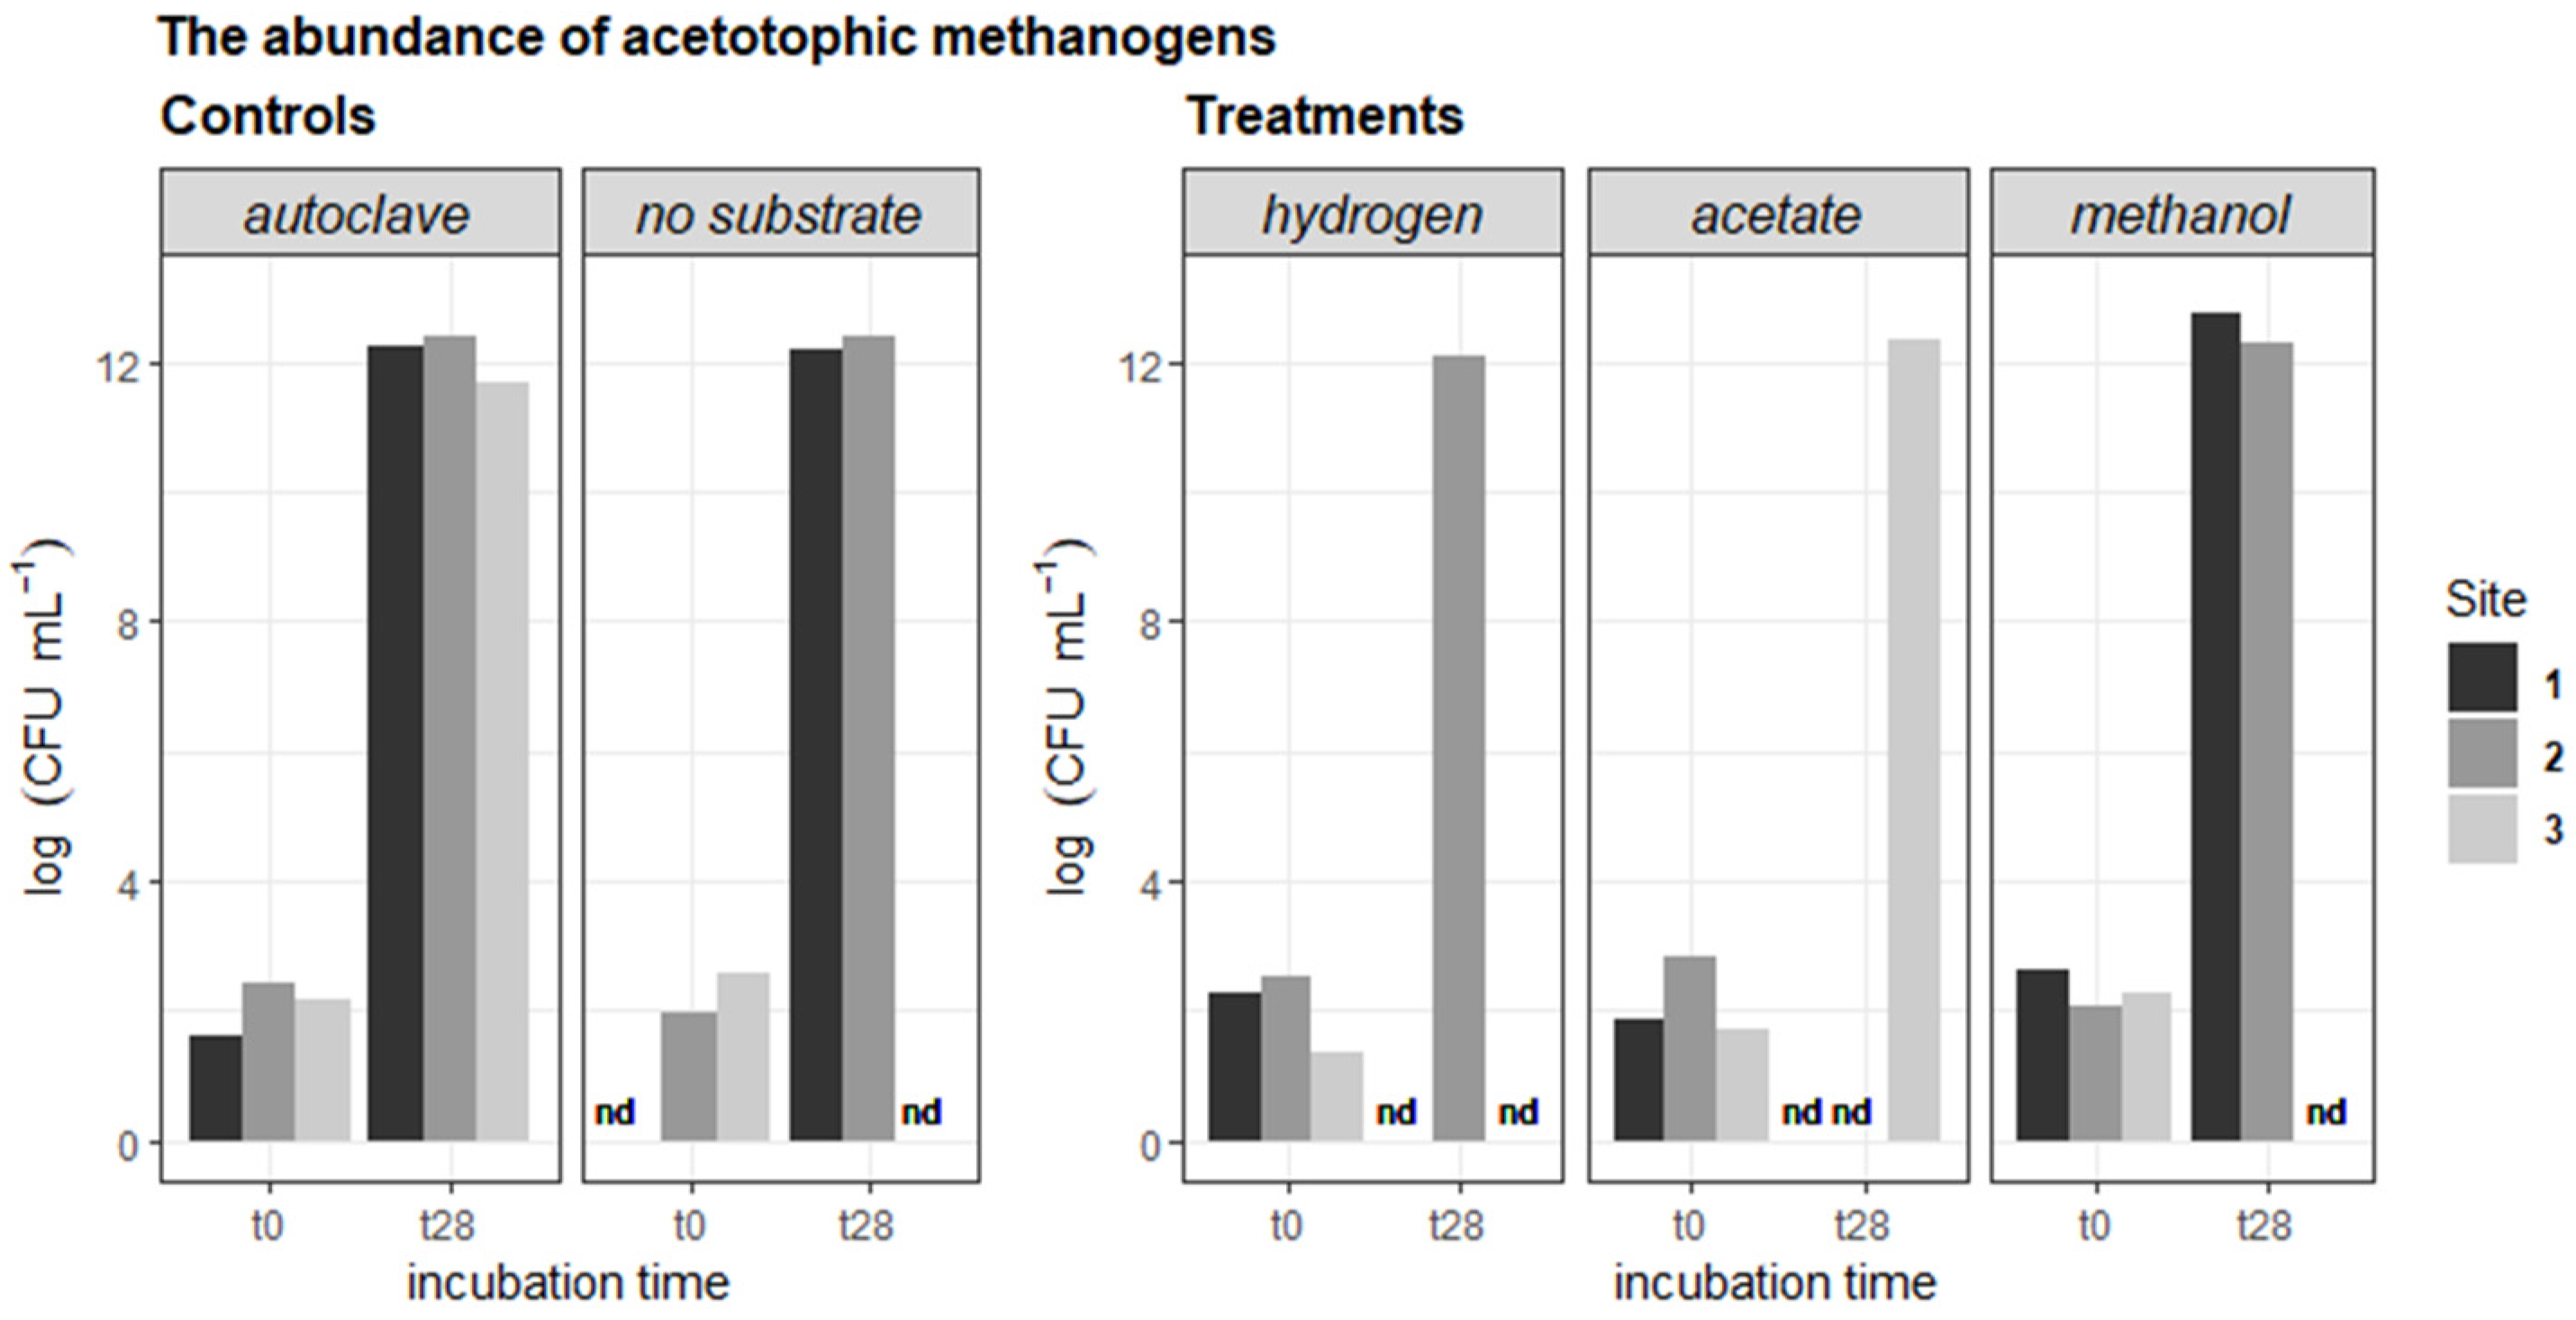
Acetotrophic methanogens, on the other hand, appear to have been outcompeted by SRBs in the slurry sediment experiments. The experiments showed that acetotrophs were not detected on Day 28 in several samples, despite being abundant on Day 0 (Figure 6). The autoclaved sediment experiments revealed that acetotrophic methanogens survived and could grow. Thus, the abundance of acetotrophs on Day 28 was 10 orders of magnitude greater than on Day 0. This suggested that SRBs were killed after autoclaving the sediments and thus did not inhibit the acetotrophic methanogens.

4. Discussion

We investigated microbial enumerations and potential methane production to determine the dominant pathway of methanogenesis at the study sites. This study was conducted to characterise the phenomenon of CH4 in the mangrove ecosystem, noted by Ulumuddin et al. [34]. They discovered that the CH4 in the pore water of mangroves on Tanakeke Island, Indonesia, was super saturated compared to the atmospheric CH4, and that pore water sulphate did not correlate with CH4 concentrations. The qPCR method confirmed that SRBs and methanogens coexist in the sediment samples. Indeed, the plate count method reveals that the abundance of methylotrophic methanogens was two orders of magnitude greater than that of acetotrophs. Furthermore, when methanol was added to sediment samples in the sediment slurry experiments, CH4 production increased rapidly (Figure 3). Overall, these findings indicate that methylotrophic methanogens are the dominant pathway for methane production at the study sites.

4.1. Microbial Enumerations

The relative abundance of methanogen ranged from 7.2 × 101 to 6 × 10⁵ CFU g−1, and the relative abundance of the functional gene of methanogens (mcrA) ranged from 72 to 6 × 10⁵ gene copies g−1 (see the Section 2 and Figure 2). This range was lower than previously reported values, such as 108 gene copies g−1 in river sediments, 2.5 × 10⁶–3.7 × 10⁹ gene copies g−1 in paddy soils, and 106 gene copies g−1 in saltmarshes [48,49,50,51,52]. However, it is comparable to those found in tidal flat subsurface (0–4 × 10⁵ gene copies g−1 sediments) and lake sediment (5 × 10⁶ gene copies g−1) [53,54]. The low population of methanogens in this study could be attributed to a scarcity of methanogenic substrates. The study sites have relatively poor organic carbon in their sediment (140 Mg C ha−1) [55], although Indonesia’s mangrove forests are typically high in sediment organic carbon (848.9 Mg C ha−1) [56]. This is because the study sites are overwashed mangrove forests which are located on a coral-filled island and rotational forest cutting takes place in the forests.
The abundance of SRBs appeared to indicate that sulphate reduction has less of an impact on methane production. It was generally less abundant than methanogens (Figure 2). During the wet season, it can be higher than methanogens, for example, in the top layer of sediments (10–20 cm). In such a case, we may conclude that SRBs can inhibit methanogens because of a shift in methanogenic communities caused by environmental changes. Reshmi et al. [57] noted, for example, that during the wet season, more organic matter is supplied from terrestrial ecosystems, which improves the metabolism of acetotrophic methanogens in estuarine sediments. Thus, this methanogen group was more abundant during the wet season than during the dry season, whereas methylotrophic methanogen abundance did not differ between seasons. In the meantime, Jing et al. [37] discovered that heavy metals shifted the methanogenic pathways in polluted mangrove sediments. Furthermore, this type of shift may occur as a result of wetland vegetation changes, which cause changes in methanogenic substrates [58]. SRBs were found to coexist with methanogens in the current study, but seasonal variations in geochemical pore water and sediment properties may alter the methanogenic communities at the top layer of sediments, causing SRBs to be more abundant in the wet season than the dry season.
The fact that methylotrophic methanogens were more abundant than acetotrophic methanogens in all samples supports the coexistence of SRBs and methanogens. The abundance of methylotrophic methanogens in our mangrove sediments ranged from 8.3 × 10² to 5.1 × 10⁴ CFU g−1, while the abundance of acetotrophs ranged from 0 to 7.7 × 10² CFU g−1. In comparison, Reshmi et al. [57] found that methylotrophs in estuarine sediments ranged from 1.9 × 10² to 103 CFU g−1, while acetotrophs ranged from 2 × 10² to 8.1 × 10² CFU g−1. According to Torres-Alvarado et al. [59], during the dry season, methylotrophs were the most abundant in estuarine sediments (106–2 × 10⁷ cells g−1), while acetotrophs accounted for between 3 × 10⁴ and 105 cells g−1. During the wet season, they discovered a similar abundance of acetotrophs (106–2 × 10⁷ cells g−1) and methylotrophic methanogens (107–2 × 10⁷ cells g−1).
To our knowledge, there have been only a few studies in mangrove sediments addressing methanogen enumeration in mangrove sediments. This makes comparing our research to previous studies difficult. Mohanraju and Natarajan [60] made an early attempt and found that the total abundance of methanogens ranged from 3.6 × 10² to 1.1 × 10⁵ cells g−1. They did not, however, mention the abundance of each group of methanogens. Jing et al. [37], on the other hand, presented a detailed study on methanogenic communities up to class-level taxonomic groups. They discovered that methylotrophic methanogens were prevalent in nearly all of their samples. This is consistent with our findings and may provide additional evidence to support the hypothesis that methylotrophic methanogenesis is the dominant pathway of methane production in the current study.

4.2. Potential CH4 Production

The control experiment with autoclaved sediments yielded an unexpected result that the sediments produced CH4 at roughly the same rate as the other control treatment on Day 37 (no additional substrates) (Figure 4). Furthermore, bacterial counts on Days 0 and 28 showed that methanogens survived and grew well (Figure 5 and Figure 6). These are fascinating findings because methanogen archaea has no spored forms and thus is not heat-resistant [61]. However, Otte et al. [62] noted that a few survivors remain in marine sediment samples after three-time autoclaving. Among the survivors are spore-forming bacteria, which is unusual for methanogens [63,64]. To the best our knowledge, only methanogen archaea found in thermal vents can survive at the autoclave temperature of 110 °C [65,66]. Otherwise, we may say that there was a contamination in the incubation bottles. Nevertheless, the CH4 concentration in control treatments (autoclaved and no substrate) was fairly low, compared to the treatments with additional substrates. Thus, it made no difference to the conclusion about the effect of additional substrates on CH4 production. More research is needed to characterise the methanogens in our study sites, whether there were contaminations or physiological methanogen characteristics under autoclaving treatments.
Meanwhile, the addition of methanol to the sediment slurry resulted in the rapid and high production of CH4 (Figure 4), which was observed in all three selected sites’ sediments (i.e., Site 1, 2, and 3). On Day 7 of Site 1, for example, CH4 concentrations in the bottle headspace with methanol amendment were two orders of magnitude higher (1.9 (±1.8) × 104 ppm) than the control (no additional substrates) (4 (±9.2) × 102 ppm). Following this, the amount of CH4 in the headspace increased gradually, reaching a peak on Day 28. This is consistent with the findings of Chuang et al. [67], Xiao et al. [68], and Lyimo et al. [23]. Even though the in situ concentrations were extremely low, they found that methylated compounds were more favourable for methanogens than competitive substrates (i.e., H2 and acetate). The experiments with hydrogen and acetate amendments, on the other hand, produced CH4 of the same order of magnitude as the controls. As a result, only the experiments with methanol amendment produced more CH4.
When the number of methanogens in the experiment’s sediment slurry was counted, methylotrophic methanogens were found in all treatments and controls (Figure 5). Furthermore, methylotrophic methanogens proliferate successfully in autoclaved sediments. Methanogen abundance was eight orders of magnitude higher on Day 28 than on Day 0. In contrast, acetotrophic methanogens did not survive until Day 28 in all treatment conditions, particularly those with acetate and H2 amendments (Figure 6). This suggests that SRBs inhibited acetotrophs by competing for the same substrates (acetate or H2) [22]. As a result, the slurry sediment experiments confirmed that methylotrophic methanogenesis is the dominant pathway in our study sites.

4.3. Synthesis

Despite the fact that sulphate (SO42−) was abundant in the pore water at the mangrove sites [34], it did not appear to reduce methane production. The presence of SO42− influences methane production via two possible mechanisms: (1) SRBs outcompete acetotrophic and hydrogenotrophic methanogens for common substrates [22], and (2) in order to oxidise methane, SRBs collaborate with anaerobic methanotrophs (ANMEs) [69,70].
First, we found that although SRBs outcompeted acetotrophic and hydrogenotrophic methanogens, methylotrophic methanogens played a major role in methane production. We discovered that methanogens were more abundant than SRBs. Furthermore, methylotrophic methanogens outnumbered acetotrophs in the methanogen community. The sediment slurry experiments also revealed that adding methanol to sediment samples resulted in the highest yield of headspace CH4. On Day 28 of incubation, investigations into the methanogens in the sediment samples revealed that methylotrophic methanogens grew well, while acetotrophic methanogens were undetected. H2 and acetate stimulation, on the other hand, produced CH4 in the same order of magnitude as those that were not stimulated or the experimental control.
Second, although SRBs may collaborate with anaerobic methanotrophs, their low abundance and the high abundance of SO42− (because of the marine environment) suggest that this pathway may be less important in controlling pore water CH4. In the sediment samples, we discovered the presence of methanotrophs. Because mangrove sediments were always anaerobic (i.e., a low ORP value), these methanotrophs were possibly anaerobic methanotrophs [34]. Methanotrophs were one order of magnitude less abundant than methanogens (7–8 × 10⁴ CFU g−1) (72 and 6 × 10⁵ CFU g−1). As a result, we may conclude that the rate of CH4 production was greater than the rate of CH4 oxidation. However, Tong et al. [49] cautioned that this interpretation should be used with caution because they discovered a weak correlation between methane production and methanogen abundance.

5. Conclusions

This study shows that although this is a marine environment and an overwashed mangrove forest with low soil organic matter, mangrove sediment is a suitable habitat for methanogens and producing high CH4. This also confirms the importance of the methylotrophic pathway in methane production in mangrove environments. The results of microbial enumerations and potential CH4 production all point to this pathway. In fact, the rate of in situ methane production would be primarily determined by the concentrations of methylated compounds introduced into the sediment. In addition, it is surprising that methanogens survived autoclaving treatments, thus requiring further investigation to confirm or characterise the surviving methanogens. Finally, future research should consider the supply of methylated compounds and the mass balance of methanogenesis in order to quantify the relative importance of methylotrophic methanogenesis in mangrove forests and how it controls methane emissions.

Author Contributions

Conceptualisation, Y.I.U., I.S., S.B., M.R. and S.E.; methodology, Y.I.U. and I.S.; validation, I.S., S.B., M.R. and S.E.; formal analysis, Y.I.U.; investigation, Y.I.U. and M.R.M.; resources, I.S, S.B., M.R. and S.E.; data curation, Y.I.U.; writing—original draft preparation, Y.I.U.; writing—review and editing, S.B., M.R. and S.E.; visualisation, Y.I.U.; supervision, I.S., S.B., M.R. and S.E. All authors have read and agreed to the published version of the manuscript.

Funding

This research was funded by Australia Award Scholarships OASIS ID ST000KMG7.

Informed Consent Statement

I, Yaya Ihya Ulumuddin, hereby consciously assure that the manuscript “Characterisation of Methane Production Pathways in Sediment of Overwashed Mangrove Forests” is the author’s own original work, which has not been previously published elsewhere.

Data Availability Statement

Derived data supporting the findings of this study are available from the corresponding author YIU on request.

Conflicts of Interest

The authors declare no conflict of interest.

References

  1. Kirschke, S.; Bousquet, P.; Ciais, P.; Saunois, M.; Canadell, J.G.; Dlugokencky, E.J.; Bergamaschi, P.; Bergmann, D.; Blake, D.R.; Bruhwiler, L.; et al. Three Decades of Global Methane Sources and Sinks. Nat. Geosci. 2013, 6, 813–823. [Google Scholar] [CrossRef] [Green Version]
  2. Saunois, M.; Bousquet, P.; Poulter, B.; Peregon, A.; Ciais, P.; Canadell, J.G.; Dlugokencky, E.J.; Etiope, G.; Bastviken, D.; Houweling, S.; et al. The Global Methane Budget 2000–2012. Earth Syst. Sci. Data 2016, 8, 697–751. [Google Scholar] [CrossRef] [Green Version]
  3. Dean, J.F.; Middelburg, J.J.; Röckmann, T.; Aerts, R.; Blauw, L.G.; Egger, M.; Jetten, M.S.M.; de Jong, A.E.E.; Meisel, O.H.; Rasigraf, O.; et al. Methane Feedbacks to the Global Climate System in a Warmer World. Rev. Geophys. 2018, 56, 207–250. [Google Scholar] [CrossRef] [Green Version]
  4. Reay, D.S.; Smith, P.; Christensen, T.R.; James, R.H.; Clark, H. Methane and Global Environmental Change. Annu. Rev. Environ. Resour. 2018, 43, 165–192. [Google Scholar] [CrossRef]
  5. Zhang, Z.; Zimmermann, N.E.; Calle, L.; Hurtt, G.; Chatterjee, A.; Poulter, B. Enhanced Response of Global Wetland Methane Emissions to the 2015–2016 El Niño-Southern Oscillation Event. Environ. Res. Lett. 2018, 13, 074009. [Google Scholar] [CrossRef] [PubMed] [Green Version]
  6. Zeikus, J.G.; Winfrey, M.R. Temperature Limitation of Methanogenesis in Aquatic Sediments. Appl. Environ. Microbiol. 1976, 31, 99–107. [Google Scholar] [CrossRef] [Green Version]
  7. Kao-Kniffin, J.; Woodcroft, B.J.; Carver, S.M.; Bockheim, J.G.; Handelsman, J.; Tyson, G.W.; Hinkel, K.M.; Mueller, C.W. Archaeal and Bacterial Communities across a Chronosequence of Drained Lake Basins in Arctic Alaska. Sci. Rep. 2015, 5, 18165. [Google Scholar] [CrossRef] [Green Version]
  8. He, R.; Wooller, M.J.; Pohlman, J.W.; Quensen, J.; Tiedje, J.M.; Leigh, M.B. Shifts in Identity and Activity of Methanotrophs in Arctic Lake Sediments in Response to Temperature Changes. Appl. Environ. Microbiol. 2012, 78, 4715–4723. [Google Scholar] [CrossRef] [Green Version]
  9. Liu, D.; Tago, K.; Hayatsu, M.; Tokida, T.; Sakai, H.; Nakamura, H.; Usui, Y.; Hasegawa, T.; Asakawa, S. Effect of Elevated CO2 Concentration, Elevated Temperature and No Nitrogen Fertilization on Methanogenic Archaeal and Methane-Oxidizing Bacterial Community Structures in Paddy Soil. Microbes Environ. 2016, 31, 349–356. [Google Scholar] [CrossRef] [Green Version]
  10. Gamage, D.; Thompson, M.; Sutherland, M.; Hirotsu, N.; Makino, A.; Seneweera, S. New Insights into the Cellular Mechanisms of Plant Growth at Elevated Atmospheric Carbon Dioxide Concentrations: Elevated CO2 Effect on Plant Growth and Development. Plant Cell Environ. 2018, 41, 1233–1246. [Google Scholar] [CrossRef]
  11. Ahmadi Lahijani, M.J.; Kafi, M.; Nezami, A.; Nabati, J.; Mehrjerdi, M.Z.; Shahkoomahally, S.; Erwin, J. Variations in Assimilation Rate, Photoassimilate Translocation, and Cellular Fine Structure of Potato Cultivars (Solanum tuberosum L.) Exposed to Elevated CO2. Plant Physiol. Biochem. 2018, 130, 303–313. [Google Scholar] [CrossRef] [PubMed]
  12. Chanton, J.P.; Bauer, J.E.; Glaser, P.A.; Siegel, D.I.; Kelley, C.A.; Tyler, S.C.; Romanowicz, E.H.; Lazrus, A. Radiocarbon Evidence for the Substrates Supporting Methane Formation within Northern Minnesota Peatlands. Geochim. Cosmochim. Acta 1995, 59, 3663–3668. [Google Scholar] [CrossRef]
  13. Kao-Kniffin, J.; Zhu, B. A Microbial Link between Elevated CO2 and Methane Emissions That Is Plant Species-Specific. Microb. Ecol. 2013, 66, 621–629. [Google Scholar] [CrossRef] [PubMed] [Green Version]
  14. Das, S.; Adhya, T.K. Dynamics of Methanogenesis and Methanotrophy in Tropical Paddy Soils as Influenced by Elevated CO2 and Temperature Interaction. Soil Biol. Biochem. 2012, 47, 36–45. [Google Scholar] [CrossRef]
  15. Kolb, S.; Carbrera, A.; Kammann, C.; Kämpfer, P.; Conrad, R.; Jäckel, U. Quantitative Impact of CO2 Enriched Atmosphere on Abundances of Methanotrophic Bacteria in a Meadow Soil. Biol. Fertil. Soils 2005, 41, 337–342. [Google Scholar] [CrossRef]
  16. Wei, D.; Wang, X. Recent Climatic Changes and Wetland Expansion Turned Tibet into a Net CH4 Source. Clim. Chang. 2017, 144, 657–670. [Google Scholar] [CrossRef]
  17. Ni, X.; Groffman, P.M. Declines in Methane Uptake in Forest Soils. Proc. Natl. Acad. Sci. USA 2018, 115, 8587–8590. [Google Scholar] [CrossRef] [Green Version]
  18. Grenfell, S.E.; Callaway, R.M.; Grenfell, M.C.; Bertelli, C.M.; Mendzil, A.F.; Tew, I. Will a Rising Sea Sink Some Estuarine Wetland Ecosystems? Sci. Total Environ. 2016, 554–555, 276–292. [Google Scholar] [CrossRef] [Green Version]
  19. Geselbracht, L.L.; Freeman, K.; Birch, A.P.; Brenner, J.; Gordon, D.R. Modeled Sea Level Rise Impacts on Coastal Ecosystems at Six Major Estuaries on Florida’s Gulf Coast: Implications for Adaptation Planning. PLoS ONE 2015, 10, e0132079. [Google Scholar] [CrossRef] [Green Version]
  20. Lu, X.; Zhou, Y.; Zhuang, Q.; Prigent, C.; Liu, Y.; Teuling, A. Increasing Methane Emissions from Natural Land Ecosystems Due to Sea-Level Rise. J. Geophys. Res. Biogeosci. 2018, 123, 1756–1768. [Google Scholar] [CrossRef] [Green Version]
  21. Ferry, J.G. (Ed.) Methanogenesis; Springer: Boston, MA, USA, 1993. [Google Scholar] [CrossRef]
  22. Oremland, R.S.; Polcin, S. Methanogenesis and Sulfate Reduction: Competitive and Noncompetitive Substrates in Estuarine Sediments. Appl. Environ. Microbiol. 1982, 44, 1270–1276. [Google Scholar] [CrossRef] [PubMed] [Green Version]
  23. Lyimo, T.J.; Pol, A.; Op den Camp, H.J.M. Sulfate Reduction and Methanogenesis in Sediments of Mtoni Mangrove Forest, Tanzania. AMBIO J. Hum. Environ. 2002, 31, 614–616. [Google Scholar] [CrossRef]
  24. Cadena, S.; García-Maldonado, J.Q.; López-Lozano, N.E.; Cervantes, F.J. Methanogenic and Sulfate-Reducing Activities in a Hypersaline Microbial Mat and Associated Microbial Diversity. Microb. Ecol. 2018, 75, 930–940. [Google Scholar] [CrossRef] [PubMed]
  25. Zhuang, G.-C.; Heuer, V.B.; Lazar, C.S.; Goldhammer, T.; Wendt, J.; Samarkin, V.A.; Elvert, M.; Teske, A.P.; Joye, S.B.; Hinrichs, K.-U. Relative Importance of Methylotrophic Methanogenesis in Sediments of the Western Mediterranean Sea. Geochim. Cosmochim. Acta 2018, 224, 171–186. [Google Scholar] [CrossRef]
  26. Zalman, C.A.; Meade, N.; Chanton, J.; Kostka, J.E.; Bridgham, S.D.; Keller, J.K. Methylotrophic Methanogenesis in Sphagnum-Dominated Peatland Soils. Soil Biol. Biochem. 2018, 118, 156–160. [Google Scholar] [CrossRef]
  27. Maltby, J.; Steinle, L.; Löscher, C.R.; Bange, H.W.; Fischer, M.A.; Schmidt, M.; Treude, T. Microbial Methanogenesis in the Sulfate-Reducing Zone of Sediments in the Eckernförde Bay, SW Baltic Sea. Biogeosciences 2018, 15, 137–157. [Google Scholar] [CrossRef] [Green Version]
  28. King, G.M.; Klug, M.J.; Lovley, D.R. Metabolism of Acetate, Methanol, and Methylated Amines in Intertidal Sediments of Lowes Cove, Maine. Appl. Environ. Microbiol. 1983, 45, 1848–1853. [Google Scholar] [CrossRef] [Green Version]
  29. Lyimo, T.J.; Pol, A.; Harhangi, H.R.; Jetten, M.S.M.; Op den Camp, H.J.M. Anaerobic Oxidation of Dimethylsulfide and Methanethiol in Mangrove Sediments Is Dominated by Sulfate-Reducing Bacteria. FEMS Microbiol. Ecol. 2009, 70, 483–492. [Google Scholar] [CrossRef] [Green Version]
  30. Alongi, D.M.; Sasekumar, A.; Chong, V.C.; Pfitzner, J.; Trott, L.A.; Tirendi, F.; Dixon, P.; Brunskill, G.J. Sediment Accumulation and Organic Material Flux in a Managed Mangrove Ecosystem: Estimates of Land–Ocean–Atmosphere Exchange in Peninsular Malaysia. Mar. Geol. 2004, 208, 383–402. [Google Scholar] [CrossRef]
  31. Alongi, D.M.; Pfitzner, J.; Trott, L.A.; Tirendi, F.; Dixon, P.; Klumpp, D.W. Rapid Sediment Accumulation and Microbial Mineralization in Forests of the Mangrove Kandelia Candel in the Jiulongjiang Estuary, China. Estuar. Coast. Shelf Sci. 2005, 63, 605–618. [Google Scholar] [CrossRef]
  32. Welti, N.; Hayes, M.; Lockington, D. Seasonal Nitrous Oxide and Methane Emissions across a Subtropical Estuarine Salinity Gradient. Biogeochemistry 2017, 132, 55–69. [Google Scholar] [CrossRef]
  33. Cabezas, A.; Mitsch, W.J.; MacDonnell, C.; Zhang, L.; Bydałek, F.; Lasso, A. Methane Emissions from Mangrove Soils in Hydrologically Disturbed and Reference Mangrove Tidal Creeks in Southwest Florida. Ecol. Eng. 2018, 114, 57–65. [Google Scholar] [CrossRef]
  34. Ulumuddin, Y.I.; Beavis, S.; Roderick, M.; Eggins, S.; Sugoro, I.; Sukardjo, S. Potential Carbon Loss in Sediment through Methane Production during Early Development Stage of Mangrove Regeneration in Restored Mangroves. In Dynamic Sedimentary Environments of Mangrove Coasts; Elsevier: Amsterdam, The Netherlands, 2021; pp. 415–445. [Google Scholar] [CrossRef]
  35. Ramamurthy, T.; Raju, R.; Natarajan, R. Distribution and Ecology of Methanogenic Bacteria in Mangrove Sediments of Pitchavaram, East-Coast Of India. Indian J. Mar. Sci. 1990, 19, 269–273. [Google Scholar]
  36. Mohanraju, R.; Rajagopal, B.G.; Daniel, L.; Natarajan, R. Isolation and Characterization of a Methanogenic Bacterium from Mangrove Sediments. J. Mar. Biotechnol. 1997, 5, 147–152. [Google Scholar]
  37. Jing, H.; Cheung, S.; Zhou, Z.; Wu, C.; Nagarajan, S.; Liu, H. Spatial Variations of the Methanogenic Communities in the Sediments of Tropical Mangroves. PLoS ONE 2016, 11, e0161065. [Google Scholar] [CrossRef] [Green Version]
  38. McDougall, E.I. Studies on Ruminant Saliva. 1. The Composition and Output of Sheep’s Saliva. Biochem. J. 1948, 43, 99–109. [Google Scholar] [CrossRef] [Green Version]
  39. Hanišáková, N.; Vítězová, M.; Rittmann, S.K.-M.R. The Historical Development of Cultivation Techniques for Methanogens and Other Strict Anaerobes and Their Application in Modern Microbiology. Microorganisms 2022, 10, 412. [Google Scholar] [CrossRef]
  40. Luton, P.E.; Wayne, J.M.; Sharp, R.J.; Riley, P.W. The McrA Gene as an Alternative to 16S RRNA in the Phylogenetic Analysis of Methanogen Populations in Landfill b BThe GenBank Accession Numbers for the McrA Sequences Reported in This Paper Are AF414034–AF414051 (See Fig. 2) and AF414007–AF414033 (Environmental Isolates in Fig. 3). Microbiology 2002, 148, 3521–3530. [Google Scholar] [CrossRef] [Green Version]
  41. Geets, J.; Borremans, B.; Diels, L.; Springael, D.; Vangronsveld, J.; van der Lelie, D.; Vanbroekhoven, K. DsrB Gene-Based DGGE for Community and Diversity Surveys of Sulfate-Reducing Bacteria. J. Microbiol. Methods 2006, 66, 194–205. [Google Scholar] [CrossRef]
  42. Holmes, A.J.; Costello, A.; Lidstrom, M.E.; Murrell, J.C. Evidence That Participate Methane Monooxygenase and Ammonia Monooxygenase May Be Evolutionarily Related. FEMS Microbiol. Lett. 1995, 132, 203–208. [Google Scholar] [CrossRef]
  43. Oliver, D.M.; Bird, C.; Burd, E.; Wyman, M. Quantitative PCR Profiling of Escherichia coli in Livestock Feces Reveals Increased Population Resilience Relative to Culturable Counts under Temperature Extremes. Environ. Sci. Technol. 2016, 50, 9497–9505. [Google Scholar] [CrossRef] [PubMed] [Green Version]
  44. Ilha, E.C.; Scariot, M.C.; Treml, D.; Pereira, T.P.; Sant′Anna, E.S.; Prudêncio, E.S.; Arisi, A.C.M. Comparison of Real-Time PCR Assay and Plate Count for Lactobacillus paracasei Enumeration in Yoghurt. Ann. Microbiol. 2016, 66, 597–606. [Google Scholar] [CrossRef]
  45. Anis, N.; Bonifait, L.; Quesne, S.; Baugé, L.; Chemaly, M.; Guyard-Nicodème, M. Simultaneous Detection of Salmonella Spp. and Quantification of Campylobacter Spp. in a Real-Time Duplex PCR: Myth or Reality? Pathogens 2023, 12, 338. [Google Scholar] [CrossRef]
  46. Dong, L.; Liu, H.; Meng, L.; Xing, M.; Lan, T.; Gu, M.; Zheng, N.; Wang, C.; Chen, H.; Wang, J. Short Communication: Quantitative PCR Coupled with Sodium Dodecyl Sulfate and Propidium Monoazide for Detection of Culturable Escherichia coli in Milk. J. Dairy Sci. 2019, 102, 6914–6919. [Google Scholar] [CrossRef] [PubMed]
  47. Gibbs, G.D.; Griffin, M.J.; Mauel, M.J.; Lawrence, M.L. Validation of a Quantitative PCR Assay for the Detection of 2 Flavobacterium columnare Genomovars. J. Vet. Diagn. Investig. 2020, 32, 356–362. [Google Scholar] [CrossRef]
  48. Chaudhary, P.P.; Rulík, M.; Blaser, M. Is the Methanogenic Community Reflecting the Methane Emissions of River Sediments?-Comparison of Two Study Sites. MicrobiologyOpen 2017, 6, e00454. [Google Scholar] [CrossRef]
  49. Tong, C.; Cadillo-Quiroz, H.; Zeng, Z.H.; She, C.X.; Yang, P.; Huang, J.F. Changes of Community Structure and Abundance of Methanogens in Soils along a Freshwater–Brackish Water Gradient in Subtropical Estuarine Marshes. Geoderma 2017, 299, 101–110. [Google Scholar] [CrossRef]
  50. Bao, Q.-L.; Xiao, K.-Q.; Chen, Z.; Yao, H.-Y.; Zhu, Y.-G. Methane Production and Methanogenic Archaeal Communities in Two Types of Paddy Soil Amended with Different Amounts of Rice Straw. FEMS Microbiol. Ecol. 2014, 88, 372–385. [Google Scholar] [CrossRef]
  51. Zeleke, J.; Sheng, Q.; Wang, J.-G.; Huang, M.-Y.; Xia, F.; Wu, J.-H.; Quan, Z.-X. Effects of Spartina Alterniflora Invasion on the Communities of Methanogens and Sulfate-Reducing Bacteria in Estuarine Marsh Sediments. Front. Microbiol. 2013, 4, 243. [Google Scholar] [CrossRef] [Green Version]
  52. Gao, G.F.; Li, P.F.; Shen, Z.J.; Qin, Y.Y.; Zhang, X.M.; Ghoto, K.; Zhu, X.Y.; Zheng, H.L. Exotic Spartina Alterniflora Invasion Increases CH4 While Reduces CO2 Emissions from Mangrove Wetland Soils in Southeastern China. Sci. Rep. 2018, 8, 9243. [Google Scholar] [CrossRef] [Green Version]
  53. Wilms, R.; Sass, H.; Köpke, B.; Cypionka, H.; Engelen, B. Methane and Sulfate Profiles within the Subsurface of a Tidal Flat Are Reflected by the Distribution of Sulfate-Reducing Bacteria and Methanogenic Archaea: Sulfate Reducers and Methanogens in Tidal Flats. FEMS Microbiol. Ecol. 2007, 59, 611–621. [Google Scholar] [CrossRef] [PubMed]
  54. Yang, Y.; Li, N.; Wang, W.; Li, B.; Xie, S.; Liu, Y. Vertical Profiles of Sediment Methanogenic Potential and Communities in Two Plateau Freshwater Lakes. Biogeosciences 2017, 14, 341–351. [Google Scholar] [CrossRef] [Green Version]
  55. Cameron, C.; Hutley, L.B.; Friess, D.A.; Brown, B. Community Structure Dynamics and Carbon Stock Change of Rehabilitated Mangrove Forests in Sulawesi, Indonesia. Ecol. Appl. 2019, 29, e01810. [Google Scholar] [CrossRef] [PubMed] [Green Version]
  56. Murdiyarso, D.; Purbopuspito, J.; Kauffman, J.B.; Warren, M.W.; Sasmito, S.D.; Donato, D.C.; Manuri, S.; Krisnawati, H.; Taberima, S.; Kurnianto, S. The Potential of Indonesian Mangrove Forests for Global Climate Change Mitigation. Nat. Clim. Chang. 2015, 5, 1089–1092. [Google Scholar] [CrossRef]
  57. Reshmi, R.R.; Deepa Nair, K.; Zachariah, E.J.; Vincent, S.G.T. Methanogenesis: Seasonal Changes in Human Impacted Regions of Ashtamudi Estuary (Kerala, South India). Estuar. Coast. Shelf Sci. 2015, 156, 144–154. [Google Scholar] [CrossRef]
  58. Yuan, J.; Ding, W.; Liu, D.; Kang, H.; Xiang, J.; Lin, Y. Shifts in Methanogen Community Structure and Function across a Coastal Marsh Transect: Effects of Exotic Spartina Alterniflora Invasion. Sci. Rep. 2016, 6, 18777. [Google Scholar] [CrossRef] [PubMed]
  59. Torres-Alvarado, M.d.R.; Fernández, F.J.; Ramírez Vives, F.; Varona-Cordero, F. Dynamics of the Methanogenic Archaea in Tropical Estuarine Sediments. Archaea 2013, 2013, 582646. [Google Scholar] [CrossRef] [Green Version]
  60. Mohanraju, R.; Natarajan, R. Methanogenic Bacteria in Mangrove Sediments. Hydrobiologia 1992, 247, 187–193. [Google Scholar] [CrossRef]
  61. Peters, V.; Conrad, R. Methanogenic and Other Strictly Anaerobic Bacteria in Desert Soil and Other Oxic Soils. Appl. Environ. Microbiol. 1995, 61, 1673–1676. [Google Scholar] [CrossRef] [Green Version]
  62. Otte, J.M.; Blackwell, N.; Soos, V.; Rughöft, S.; Maisch, M.; Kappler, A.; Kleindienst, S.; Schmidt, C. Sterilization Impacts on Marine Sediment—Are We Able to Inactivate Microorganisms in Environmental Samples? FEMS Microbiol. Ecol. 2018, 94, fiy189. [Google Scholar] [CrossRef]
  63. Setlow, P. Spores of Bacillus Subtilis: Their Resistance to and Killing by Radiation, Heat and Chemicals. J. Appl. Microbiol. 2006, 101, 514–525. [Google Scholar] [CrossRef] [PubMed]
  64. O’Sullivan, L.A.; Roussel, E.G.; Weightman, A.J.; Webster, G.; Hubert, C.R.; Bell, E.; Head, I.; Sass, H.; Parkes, R.J. Survival of Desulfotomaculum Spores from Estuarine Sediments after Serial Autoclaving and High-Temperature Exposure. ISME J. 2015, 9, 922–933. [Google Scholar] [CrossRef] [PubMed] [Green Version]
  65. Miller, J.F.; Shah, N.N.; Nelson, C.M.; Ludlow, J.M.; Clark, D.S. Pressure and Temperature Effects on Growth and Methane Production of the Extreme Thermophile Methanococcus jannaschii. Appl. Environ. Microbiol. 1988, 54, 3039–3042. [Google Scholar] [CrossRef] [PubMed] [Green Version]
  66. Takai, K.; Nakamura, K.; Toki, T.; Tsunogai, U.; Miyazaki, M.; Miyazaki, J.; Hirayama, H.; Nakagawa, S.; Nunoura, T.; Horikoshi, K. Cell Proliferation at 122 °C and Isotopically Heavy CH 4 Production by a Hyperthermophilic Methanogen under High-Pressure Cultivation. Proc. Natl. Acad. Sci. USA 2008, 105, 10949–10954. [Google Scholar] [CrossRef] [Green Version]
  67. Chuang, P.-C.; Young, M.B.; Dale, A.W.; Miller, L.G.; Herrera-Silveira, J.A.; Paytan, A. Methane and Sulfate Dynamics in Sediments from Mangrove-Dominated Tropical Coastal Lagoons, Yucatán, Mexico. Biogeosciences 2016, 13, 2981–3001. [Google Scholar] [CrossRef] [Green Version]
  68. Xiao, K.-Q.; Beulig, F.; Kjeldsen, K.U.; Jørgensen, B.B.; Risgaard-Petersen, N. Concurrent Methane Production and Oxidation in Surface Sediment from Aarhus Bay, Denmark. Front. Microbiol. 2017, 8, 1198. [Google Scholar] [CrossRef] [Green Version]
  69. Bebout, B.M.; Hoehler, T.M.; Thamdrup, B.; Albert, D.; Carpenter, S.P.; Hogan, M.; Turk, K.; Des Marais, D.J. Methane Production by Microbial Mats under Low Sulphate Concentrations. Geobiology 2004, 2, 87–96. [Google Scholar] [CrossRef]
  70. Avrahamov, N.; Antler, G.; Yechieli, Y.; Gavrieli, I.; Joye, S.B.; Saxton, M.; Turchyn, A.V.; Sivan, O. Anaerobic Oxidation of Methane by Sulfate in Hypersaline Groundwater of the Dead Sea Aquifer. Geobiology 2014, 12, 511–528. [Google Scholar] [CrossRef] [Green Version]
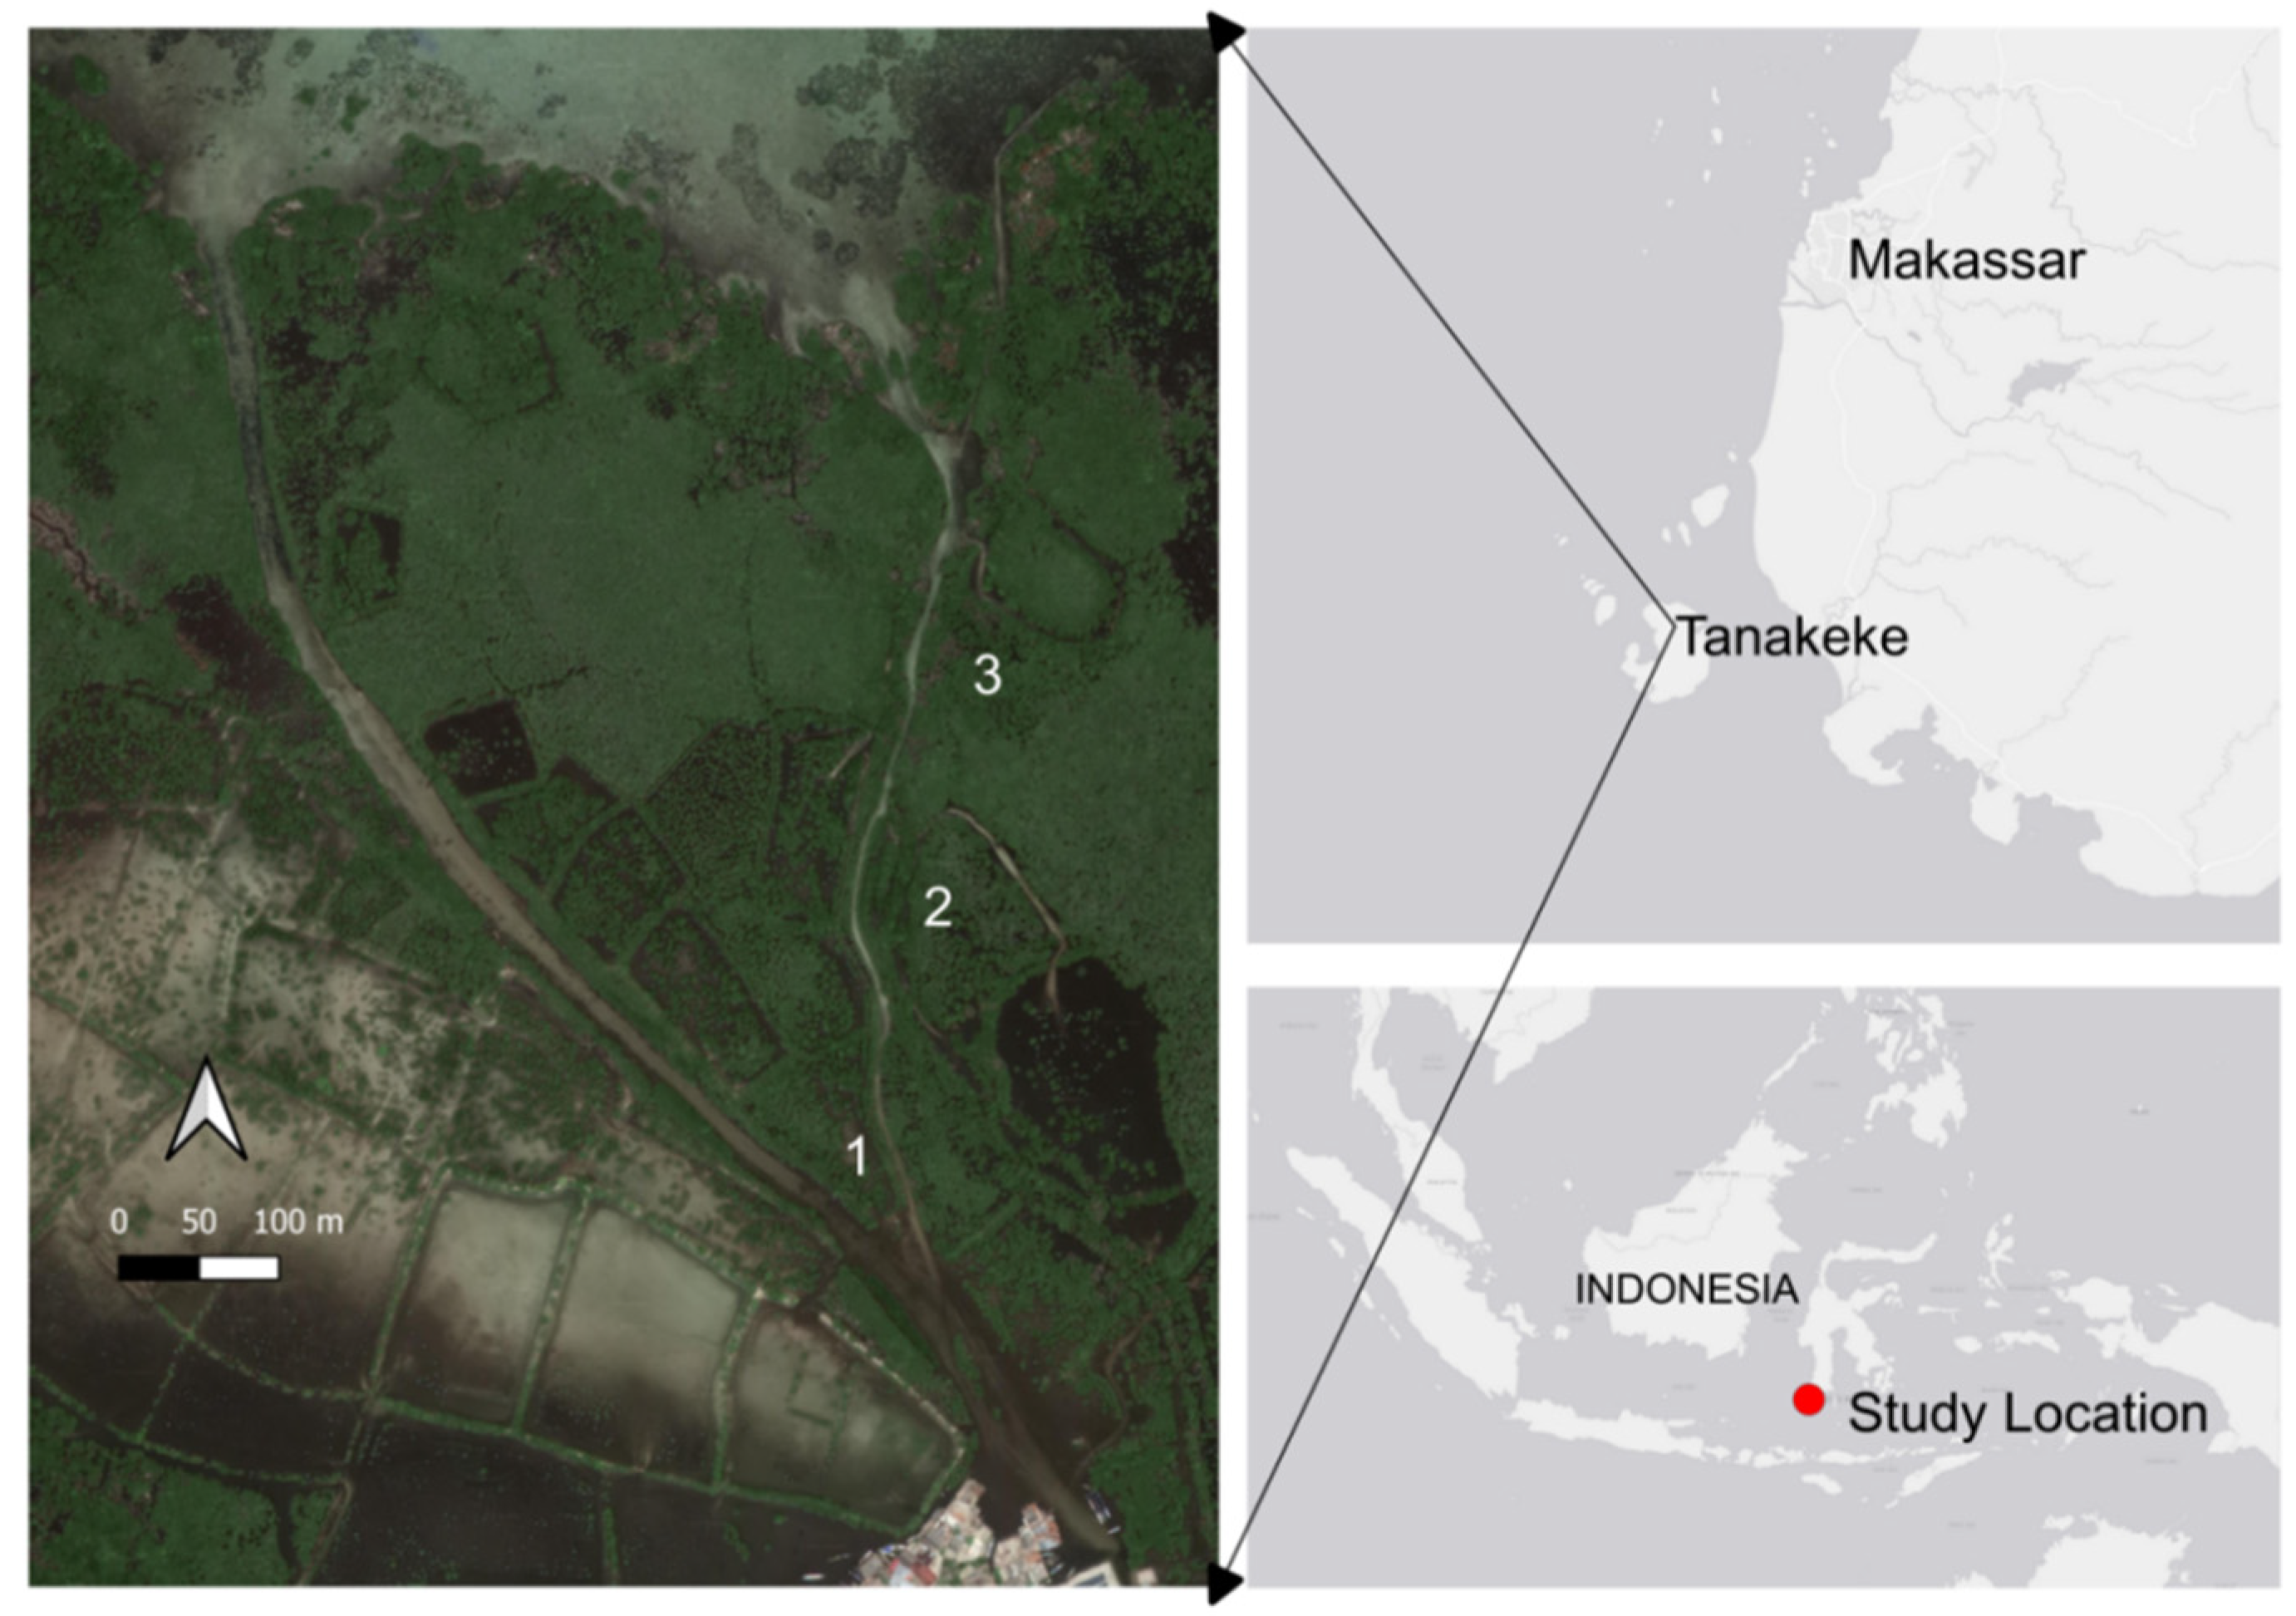
Figure 1. Study locations and the distribution of sampling sites (1–3) plotted using Google Earth imagery, depicting the landscape of aquaculture ponds and mangroves with two creeks splitting the landscapes. White and brown colour spotted by green (left section of figure) depicts recently abandoned ponds; patches of green colour surrounded by a brown line depicts long abandoned ponds; and the green-coloured blocks show undisturbed mangrove vegetation.
Forests 14 00564 g001
Figure 2. The relative abundances of archaea/bacteria groups (methanogens, methanotrophs, and SRBs) from the qPCR method. Panels represent the three selected sites. Sediment samples were collected in the dry and wet seasons.
Forests 14 00564 g002
Figure 3. The abundance of methylotrophic and acetotrophic methanogens via the spread plate count method. The number of panels represents the three sampling sites. Data were only collected in the dry season. The values are the average of two replicates. “nd” means “not detected”.
Forests 14 00564 g003
Figure 4. CH4 concentrations in the bottle headspace following the sampling times. Incubation times (t7–t37) denote sampling times from Day 7 to Day 37 on Days 7, 14, 21, 28, and 37 of incubation. Controls and treatments indicated at the top of each panel. The values are the average of two replicates and five depths and error bars represent 1 standard deviation.
Forests 14 00564 g004
Figure 5. The abundance of methylotrophic methanogens in the sediment slurries on Days 0 and 28, counted on the selective agar media. Treatment indicated at the top of each panel. The values are the average of two replicates and five depths.
Forests 14 00564 g005
Figure 6. The abundance of acetotrophic methanogens in the sediment slurries on Days 0 (t0) and 28 (t28), counted on the selective agar media. Treatment indicated at the top of each panel. The values are the average of two replicates and five depths. “nd” means “not detected”.
Forests 14 00564 g006
Table 1. Primers used for qPCR.
Oligo NameMicro-OrganismsSequenceReferences
mcrAmethanogensForward:
M13F (5′- TGTAAAACGACGGCCAGTGGTGGTGTMGGATTCACACARTAYGCWACAGC-3′)
Reverse:
M13R (5′-CA- GGAAACAGCTATGACCTTCATTGCRTAGTTWGGR- TAGTT-3′)
[40]
dsrBSRBsForward: DSRp2060F (5′-CAACATCGTYCAYACCCAGGG- 3′)
Reverse: DSR4R (5′- GTGTAGCAGTTACCGCA-3′)
[41]
pmoAmethanotrophsForward: A189 (5′-GGNGACTGGGACTTCTGG-3′)
Reverse: A682 (5′-GAASGCNGAGAAGAASGC-3′)
[42]
Table 2. Regression models of Cq vs. log10 CFU for various bacteria groups.
No.BacteriaSlopeRegression Model
Y = Cq and X = log10 CFU
R2References
1Lactobacillus paracasei FNU−3.24Y = −3.24 X + 43.250.97[44]
2Campylobacter spp.−3.3 1.00[45]
3Salmonella spp.−3.4 1.00[45]
4E. coli−3.3Y = −3.31 X + 34.180.99[46]
5Flavobacterium columnare ATCC 49512−2.8Y = −2.8 X + 41.380.97[47]
6Flavobacterium columnare ATCC 94-081−2.9Y = −2.9 X + 40.510.99[47]
7Escherichia coli strain InaCC B5−3.5Y = −3.52 X + 44.530.99This study
Table 3. Treatment conditions for sediment slurry experiments.
TreatmentsVolume, Duration, and ConcentrationExperiment Length (Days)ReplicatesNumber of SitesDepth Levels
ControlsNo additional substratesN2 headspace37235
AutoclavedN2 headspace37235
Treatments (methanogenic substrates)Methanol30 µL, 10 mM37235
Acetate30 µL, 10 mM37235
H2 gas100%, 1 min37235
Disclaimer/Publisher’s Note: The statements, opinions and data contained in all publications are solely those of the individual author(s) and contributor(s) and not of MDPI and/or the editor(s). MDPI and/or the editor(s) disclaim responsibility for any injury to people or property resulting from any ideas, methods, instructions or products referred to in the content.