Article

An Integrative Analysis of Metabolome and Transcriptome Reveals the Molecular Regulatory Mechanism of the Accumulation of Flavonoid Glycosides in Different Cyclocarya paliurus Ploidies

1
Co-Innovation Center for Sustainable Forestry in Southern China, Nanjing Forestry University, Nanjing 210037, China
2
Fishery College, Zhejiang Ocean University, Zhoushan 316022, China
*
Author to whom correspondence should be addressed.
Forests 2023, 14(4), 770; https://doi.org/10.3390/f14040770
Submission received: 7 March 2023 / Revised: 31 March 2023 / Accepted: 5 April 2023 / Published: 9 April 2023

Abstract

:
Cyclocarya paliurus (Batal) Iljinskaja is mainly used for harvesting leaves as materials for tea production and ingredients for the food industry. As its most important component, the contents of its total or specific flavonoids are supposed to vary at different ploidy levels. In the present study, two ploidy levels of C. paliurus are used to study their metabolome and transcriptome profiles. Though the total content of the flavonoids in leaves that were collected in September (the main harvesting season) presented insignificant differences between the two ploidies, flavonoid glucuronides were significantly accumulated in the tetraploid C. paliurus. Several structural genes related to the biosynthesis of these flavonoid glucuronides were expressed differentially, including PAL, 4CL, CHS, and CpUGTs. A weighted gene co-expression network analysis (WGCNA) revealed that nine genes were highly correlated with the flavonoid glucuronide contents. Furthermore, 3 CpMYB39 and 3 CpUGT71 were highly associated with this accumulation of flavonoid glucuronides in tetraploid C. paliurus. These results can provide a new perspective on how different polyploid levels alter the quantitative and qualitative patterns of the secondary metabolite production in C. paliurus.

1. Introduction

As a category of phenolic secondary metabolites, flavonoids are widely distributed in plants and protect them from reactive oxygen species (ROS) damage induced by abiotic stresses (such as UV-B radiation, temperature, and soil salinity) [1]. Flavonoids also influence the phytohormone signaling for controlling a plant’s growth and development processes [2]. In addition, some plant-derived flavonoids have been considered in the field to be bioactive ingredients, presenting pharmacological effects on anticancer, immunomodulatory, anti-inflammatory, anti-hyperlipidemic, and antioxidant activities [3,4,5,6]. For example, apigenin-7-O-β-D-glucuronide inhibits proinflammatory cytokine production to protect mice from lipopolysaccharide-induced endotoxin shock, and luteolin-7-O-glucuronide also exhibits the anti-inflammatory and anti-oxidative properties in murine macrophages [7,8]. In general, flavonoids undergo multiple chemical modifications in vivo, including glycosylation, methylation, and acylation. Following glycosylation, flavonoids can improve their stability, water solubility, and bioactivity properties [9,10]; thus, bioactive flavonoids are usually in the form of glycosides. Th glycosylation of natural flavonoids is mediated by uridine diphosphate (UDP) glycosyltransferases (UGTs) [11], which belong to the family of 1 glycosyltransferases (GT1) (www.cazy.org/fam/acc_GT.html, accessed on 8 March 2022). In the C-terminals of UGTs, a plant secondary product glycosyltransferase (PSPG) motif with highly conserved amino acid (aa) residues can directly interact with a sugar donor and impact the activity and specificity of the glycosylation reactions [12]. Therefore, most UGTs preferentially select one specific UDP donor (such as UDP glucose, galactose, glucuronic acid, xylose, or rhamnose) as the preferred sugar donor to catalyze the glycosylation reaction. For example, flavonoids were observed to specifically conjugate with UDP glucuronic acid (UDPGA) via flavonoid 7-O-glucuronosyltransferases (F7GATs) in Lamiales [13,14].
Cyclocarya paliurus (Batal.) Iljinskaja, usually called “sweet tea tree” because of the unique taste of its leaves, is mainly distributed in the subtropical mountainous areas of southern China. Its leaves are mainly used for tea production and as a health food ingredient [15]. Due to the abundance of the bioactive components in its leaves, such as flavonoids, triterpenoids, and glucosides [16,17,18], the cultivation of C. paliurus for its leaf production has been extensively popularized. Moreover, numerous studies on the accumulation of flavonoids in the leaves of C. paliurus have been published in the literature over recent years. For example, previous studies have reported that C. paliurus obtained from different locations (including information related to the provenance, population, and geographic variation) presented the accumulation ability of differential flavonoids [15,19]. Furthermore, light intensity, light quality, and nitrogen availability have also been considered to be the external factors influencing the biosynthesis of these flavonoids in C. paliurus [20,21]. Additionally, in a recent publication, two ploidy levels, including diploid (2n = 2x = 32) and autotetraploid (2n = 4x = 64), were highlighted as being present in this species in natural populations [22]. In polyploids, the sizes of their organs and their tolerance to biotic and abiotic stresses are often present in increased numbers [23]. Enzyme activity and the production of secondary metabolites can also be enhanced by polyploidy [24,25]. Xiang et al. [25] observed that the level of steviol glycosides present in the autotetraploid Stevia rebaudiana was much higher than that of diploids. In addition, the baicalin level present in the autotetraploid Scutellaria baicalensis increased by 4.6% in vitro [26]. As a form of nutraceutical tea for drinking, the types and contents of the bioactive ingredients in aqueous extracts of C. paliurus leaves determine their value. In comparison to flavonoid aglycons, flavonoid glycosides present higher water solubility and bioactivity characteristics. This leads us to focus on flavonoid glycosides’ differential accumulation of two ploidy levels in C. paliurus.
In the present study, transcriptomics and metabolomics, considered to be new “omics” research strategies, can provide a systematic biological insight into the mechanisms of gene expression and metabolite accumulation occurring in species with polyploids [25,27]. A multiple omics analysis is also effectively applied to study the environment-related response of C. paliurus [21,27] (Figure S1); however, it remains unclear if flavonoid accumulation differences occur in the two ploidy levels for this species. By integrating the transcriptomic and metabolomic data obtained from the two-ploidy C. paliurus, the aims of this study are to: 1. explore the total and specific flavonoids’ differential accumulation pattern in the two ploidy levels; 2. screen the candidate regulatory genes involved in the flavonoids’ biosynthesis pathway; and 3. construct the regulatory network of flavonoid biosynthesis and its related gene expression. This study can aid researchers in understanding the molecular mechanisms of flavonoids’ differential accumulation in different ploidies and build a theoretical basis for the efficient utilization of secondary metabolites in two polyploid C. paliurus.

2. Results

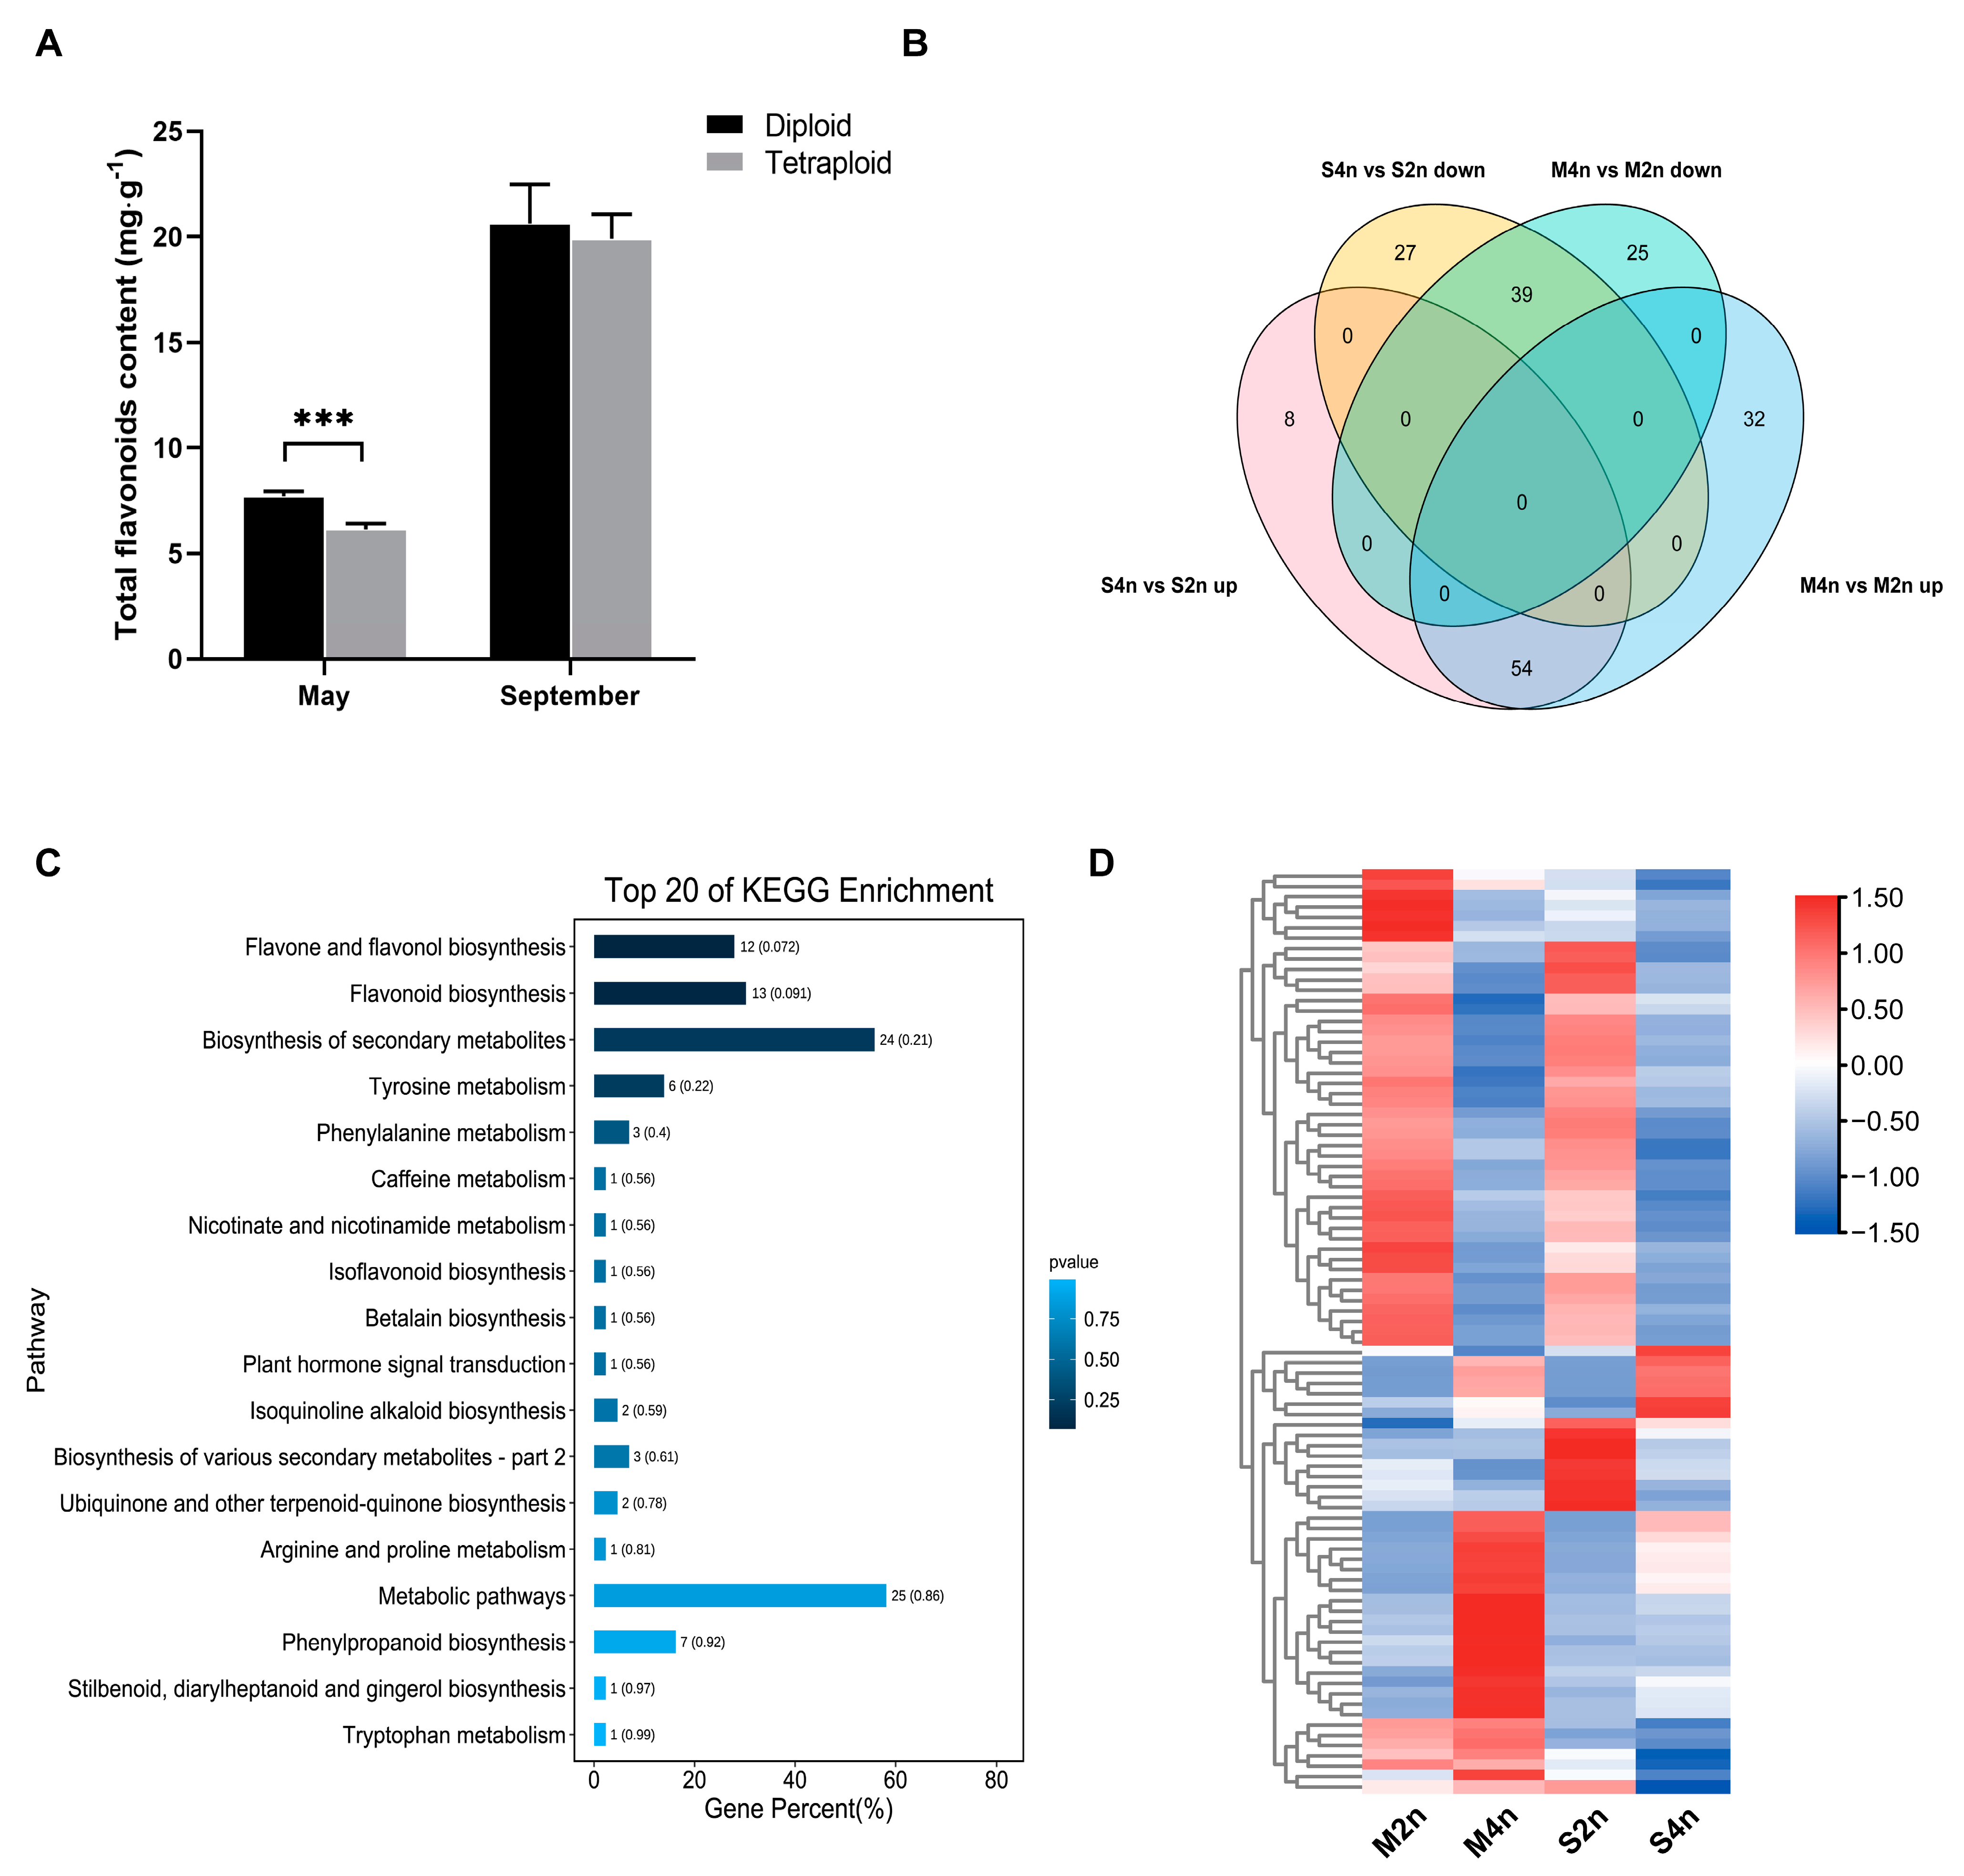
2.1. Accumulation Pattern of Flavonoids in Leaves Obtained from C. paliurus with Different Ploidies

Fang et al. [15] reported that the accumulating pattern of flavonoid content presented two peaks in the months of May and September, respectively. Thus, in this study, the total flavonoid content of the two-ploidy C. paliurus was measured only in May and September 2022. The content of the total flavonoids was significantly lower in the tetraploid when compared to the corresponding diploid in May (p ≤ 0.01). Although there was no significant difference exhibited in September, the flavonoid contents of two ploidies reached the maximum levels of up to 20.64 mg·g−1 (diploid) and 19.9 mg·g−1 (tetraploid), which were 2.67- and 3.25-fold the amount of those in May, respectively (Figure 1A).
To define the difference in the metabolite accumulation patterns of the di- and tetraploids, we created metabolite profiles using UPLC-MS/MS and multiple reaction monitoring (MRM) technologies. A total of 317 components were detected in the target metabolite analysis, including alkaloids (12), flavonoids (89), lignans and coumarins (16), phenolic acids (134), quinones (10), tannins (12), and terpenoids (33). Among these metabolites, 185 DAMs (non-redundant) (|Log2 fold change| > 1, FDR < 0.05) were detected, including 94 up- and 91 down-regulation values (Figure 1B).
To identify the rank of the metabolites with different accumulation levels between the different C. paliurus ploidies, we used the KEGG database to annotate the DAMs and analyze their metabolic pathways (Figure 1C). Among the pathways, the top three (ranked by p-value) included “Flavonoe and flavonol biosynthesis”, “Flavonoid biosynthesis”, and the “Biosynthesis of secondary metabolites” [28]. A further analysis showed that the flavonoids presented a multiple differential accumulation pattern between the di- and tetraploid C. paliurus (Figure 1D). A total of 72 flavonoids with differential accumulations were identified in the leaves obtained from the different ploidy leaves, including 24 up- and 48 down-regulated flavonoids. Flavonoid glycoside is the main component of total flavonoids. To present the specific flavonoid glycosides’ variations occurring between the two-ploidy C. paliurus, a heatmap was created using 58 metabolites (Figure 2), including arabinosides (3), galactosides (9), dirhamnosides (1), sophorotriosides (1), glucosides (24), glucuronides (6), sambubiosides (2), and rhamnosides (12). Among the flavonoid glycosides, we observed that the glucuronide content was significantly higher in the tetraploids (|log2 fold change| > 1 and FDR < 0.05), which indicated the presence of differential glucuronides’ accumulation levels in the different ploidies.

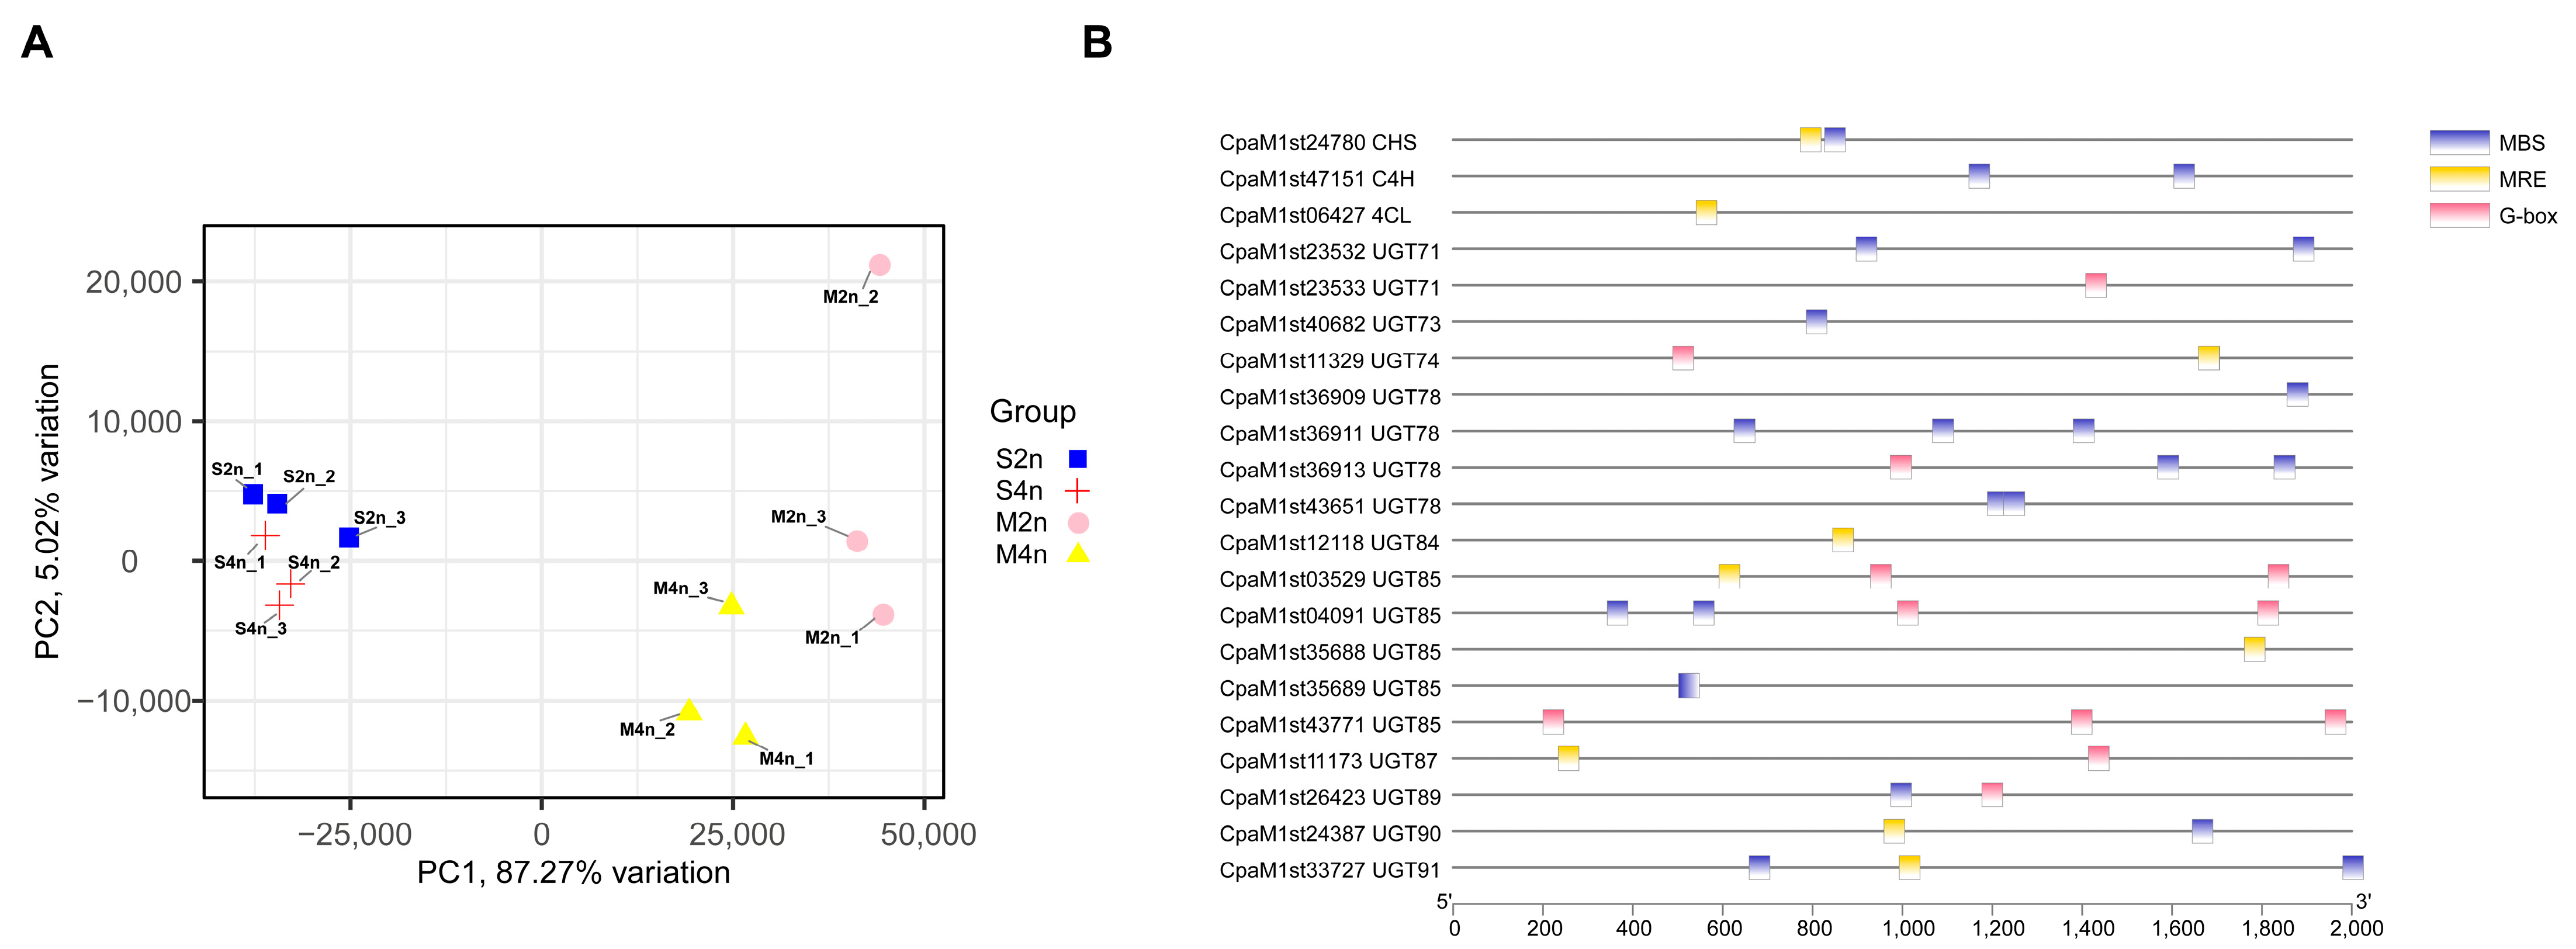
2.2. Differences in Flavonoid Glycosides in Two-Ploidy C. paliurus at the Transcriptome Level

In this study, 12 transcriptome libraries (RNA-seq) were constructed for the leaves collected in May and September, respectively. According to the reference genome [22], 34,699 genes were obtained. After filtering out the low-expression genes (TPM ≤ 1), 28,208 genes remained. The PCA score plot for the first two components (87.27% and 5.02%) shows that the samples were grouped by month and ploidy (Figure 3A). To screen the candidate genes related to the accumulation of the flavonoid glycosides, comparisons were performed between the different ploidies for each sampling month (May and September) to identify the differential expression genes (DEGs). This analysis yielded 1711 (1699 non-redundant) DEGs in the two comparisons between the di- and tetraploids (Figure S2). According to the variation in the number of DEG differences, the difference at the transcriptome level between the different ploidies in September was much greater than that in May.
A GO enrichment analysis was performed for the DEGs to identify the differences between the two ploidies. The significantly enriched GO terms were clustered and visualized. As shown in Figure 4A,B, the DEGs were mainly enriched during the cellular process, metabolic process, and catalytic activity. Their subset categories included “response to oxidative stress”, “secondary metabolic process”, and “oxidation-reduction process” at the biological process level, and “oxidoreductase activity”, “monooxygenase activity”, and “beta-glucosidase activity” at the molecular function level. Among the DEGs (Table S3), we also observed several key genes related to the flavonoid biosynthesis pathway, including PAL, 4CL, CHS, and UGTs. This suggested that polyploidization could influence the metabolic process by altering the expression levels of some key genes involving the flavonoid glycoside biosynthesis pathway in C. paliurus. Meanwhile, the expression levels of the genes mentioned above were detected using a real-time quantitative polymerase chain reaction (RT-qPCR); the majority of these levels were consistent with the RNA-seq results (Figure 5).
In addition, we performed a transcription factor (TF) prediction test to explore the differential expressions in the flavonoid glycoside accumulation. A total of 75 TFs were detected from the DEGs (Table S4) and were abundant in basic helix–loop–helix protein (bHLH), ethylene responsive factor (ERF), and MYB. In a previous study, MYB and bHLH were regarded by the authors as the most critical TFs for regulating flavonoid biosynthesis [29]. TFs regulate the expression of target genes by interacting with specific DNA cis-regulatory elements, which usually localize the upstream area of the transcribed region (within the promoters). For example, bHLH regulates its target genes by binding to E-box (usually CANNTG) or G-box (CACGTG) motifs, and MYB binds to MRE (AACCTAA) or MBS (CAACTG) motifs [30,31]. To explore the binding sites present between the gene structures and TFs, we searched for cis-regulator elements from upstream 2 kb promoter sequences. As Figure 3B shows, multiple bHLH and MYB binding sites are present within the promoters of UGTs. In Arabidopsis thaliana, the expression of biosynthetic genes involving flavonoid accumulation relies on the transcriptional activity of R2R3-MYB and bHLH proteins, forming ternary complexes (MBW) with TRANSPARENT TESTA GLABRA1 (TTG1) (WD repeat protein) [29]. As the proposed TFs have a close relationship with UGTs, they may be reliable candidate genes for flavonoid glycosides’ differential accumulation in different C. paliurus ploidies in future investigations.

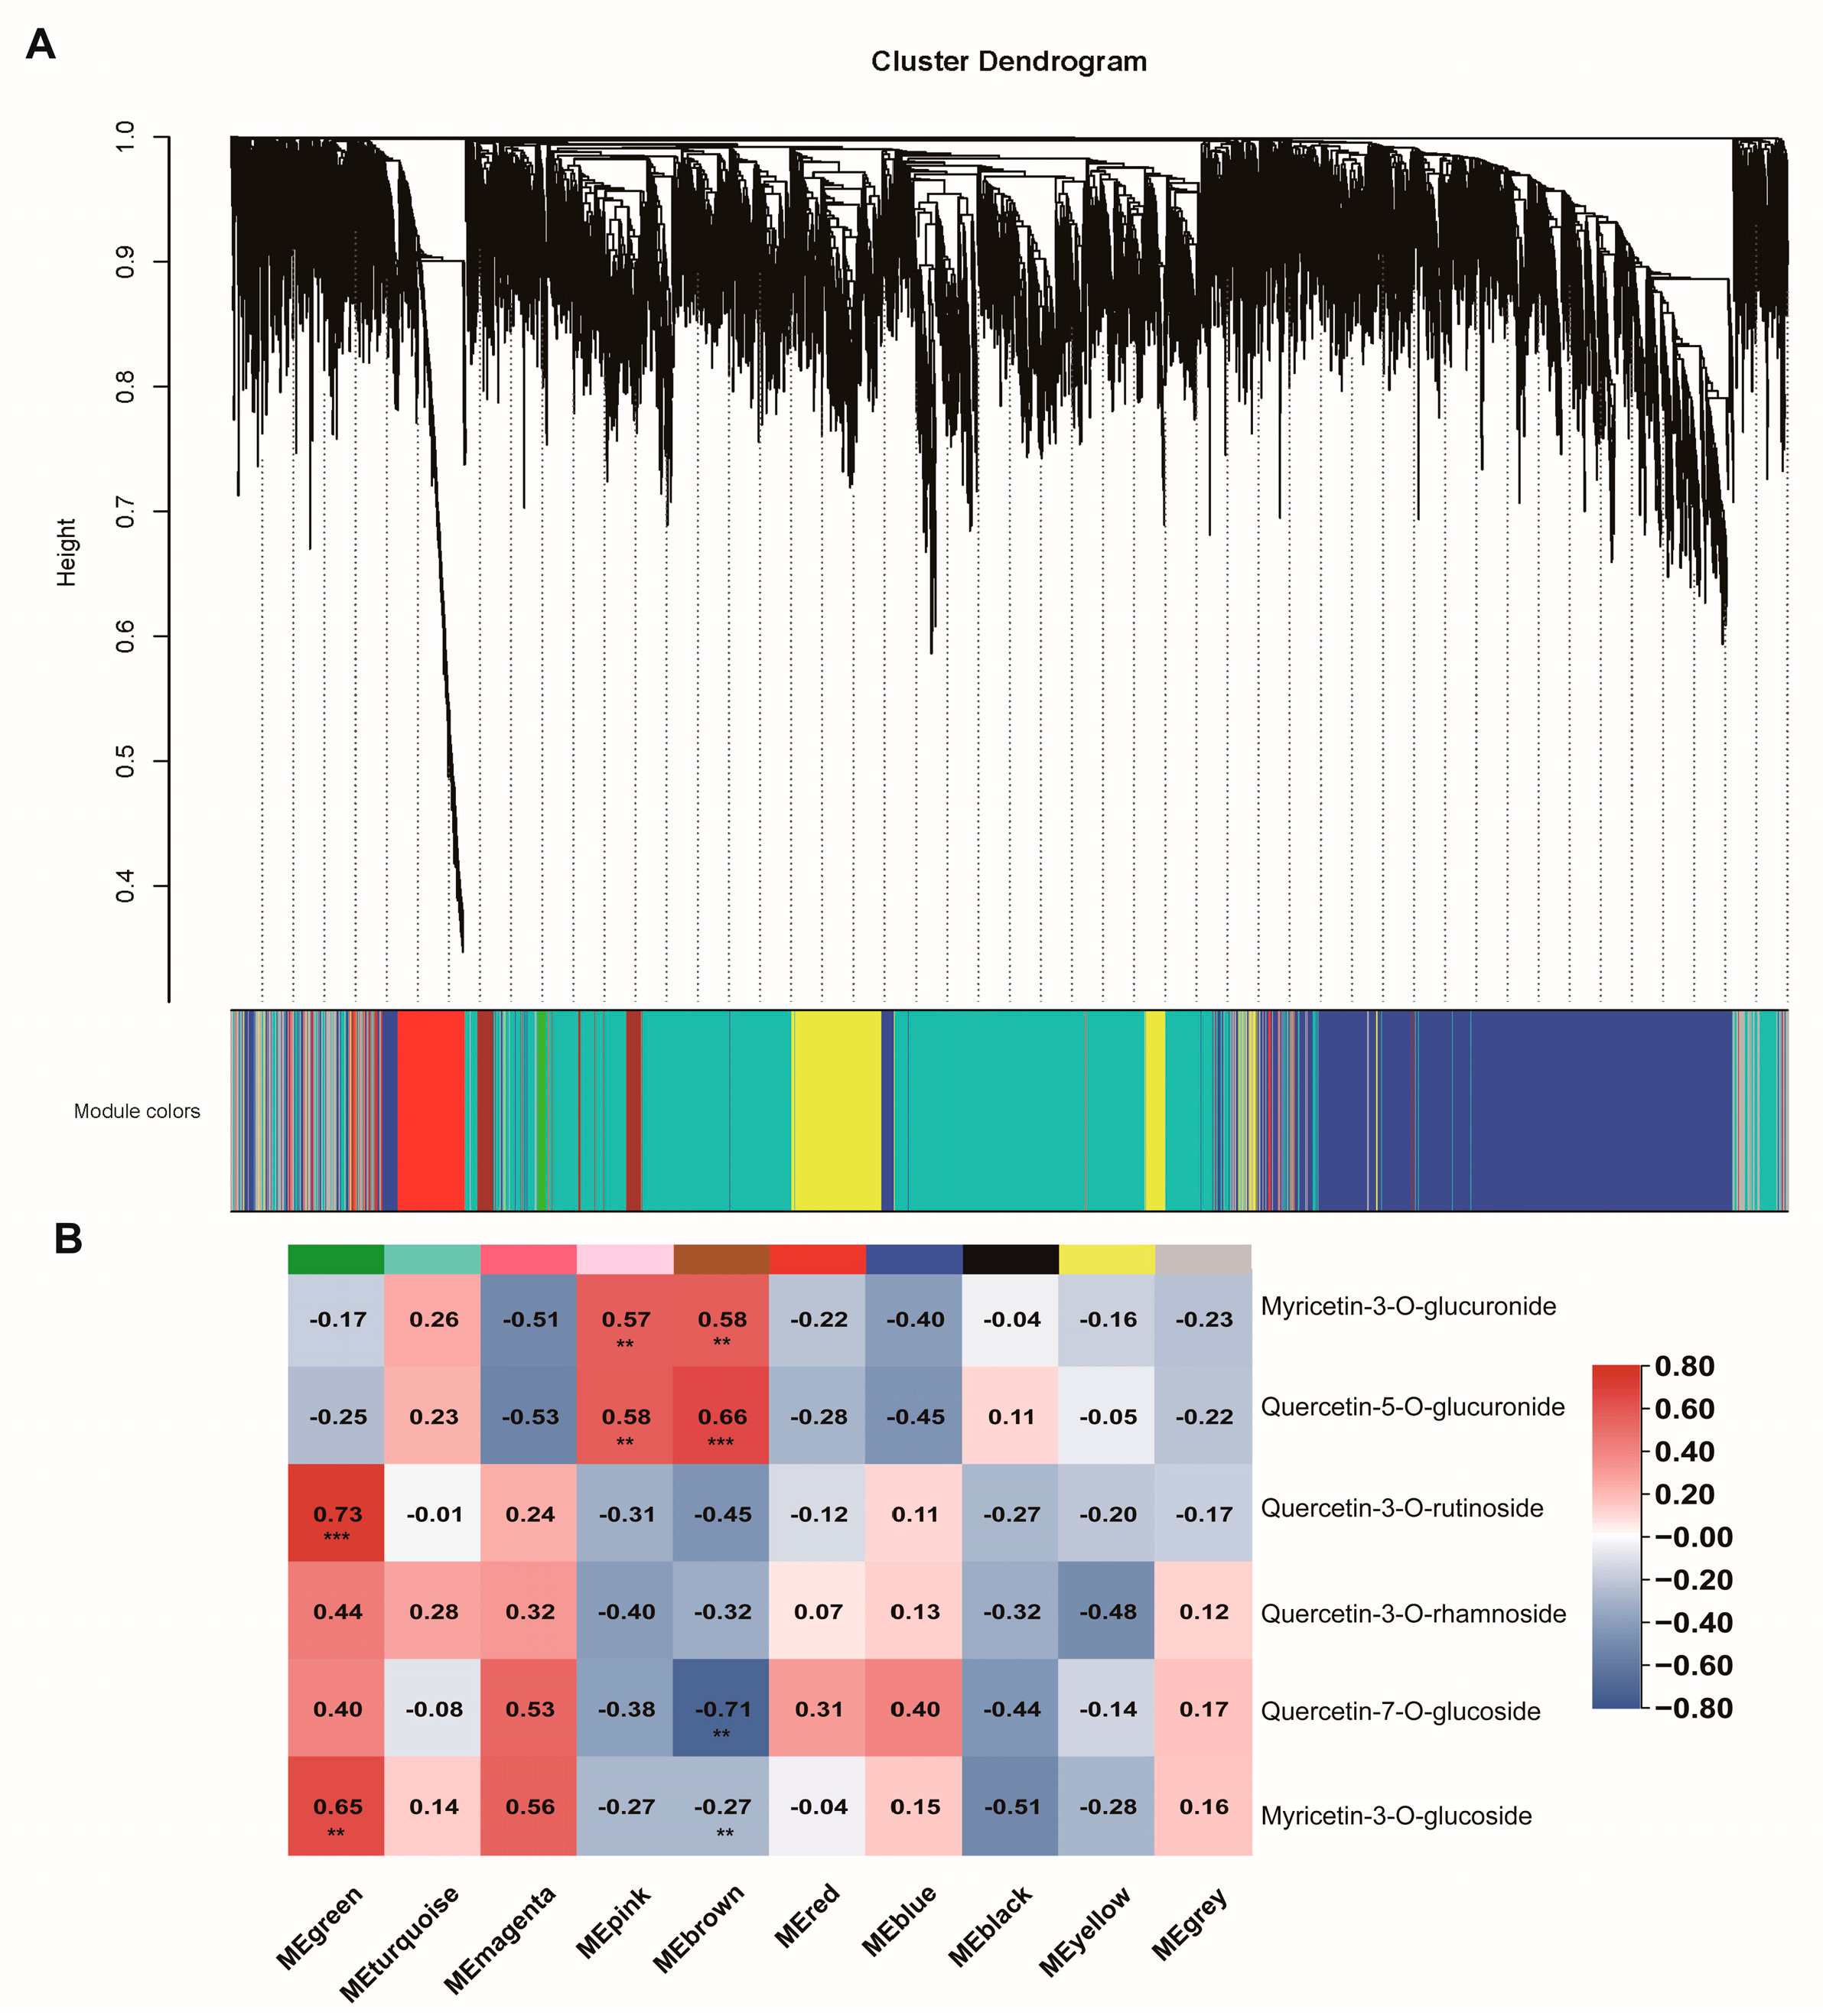
2.3. Co-Expression Network Analysis of Different C. paliurus Ploidies

A weighted gene co-expression network analysis (WGCNA) was performed using the 15,922 genes (FPKM > 1, top 60%). Based on a dynamic hierarchical tree cut, a total of 10 modules were classified with similar gene expression patterns (Figure 6A). The number of genes in each module ranged from 74 to 5157 and six of these modules comprised more than 1000 genes. We then performed a Pearson’s correlation analysis of the module eigengenes and contents of the six flavonoid compounds (Myricetin-3-O-glucuronide, Quercetin-5-O-glucuronide, Quercetin-3-O-rutinoside, Quercetin-3-O-rhamnoside, Quercetin-7-O-glucoside, and Myricetin-3-O-glucoside) (Figure 6B); two modules (“brown” and “pink”) were significantly positively correlated with the content of the flavonoid glucuronides, which suggested that the two modules’ eigengenes were relevant to the accumulation of the flavonoid glucuronides in the C. paliurus leaves.
A total of 26 hub genes were detected in the two correlation modules by their high KME values (|KME| > 0.6); the WGCNA gene significance (GS) for the glucuronides (Quercetin-5-O-glucuronide) (i.e. their correlation with the trait) was also examined. Finally, a total of nine hub genes (GS > 0.5, p < 0.05) were selected for subsequent analysis (Table 1).
TFs are important activators and repressors involved in a plant’s growth and metabolism processes. To distinguish the key regulatory TFs from the hub genes, the correlation of the hub genes with the sub-networks was established by using the Pearson’s correlation coefficient for each module. Finally, two positive sub-networks were constructed. In the “brown” module, six gene-encoding TFs (3 for MYB and 3 for bHLH) were positively correlated with UGTs; in the “pink” module, bHLH (CpaM1st47487) was positively correlated with UGT (CpaM1st23532) (Table 2).
The gene structures related to the flavonoid glycosides’ biosynthesis were selected according to the co-expression sub-network mentioned above and were shown to integrate with the flavonoid accumulation in the pathway (Figure 7). In this pathway, glucuronides presented high-level-accumulation activity in the autotetraploid C. paliurus and exhibited a similar pattern concerning UGTs. On the contrary, aglycones (kaempferol, quercetin, and luteolin) displayed an expression pattern different to the glucuronides; some aglycones’ accumulation levels in the diploids were higher than in the tetraploids, such as kaempferol and quercetin. This phenomenon indicates that there might be a form of UGT that specifically catalyzes the reaction for producing glucuronides in tetraploid C. paliurus. Simultaneously, UGTs obtained from the hub genes that exhibited high-level expressions in the tetraploids can support our theory.

3. Discussion

3.1. Differential Accumulation of Flavonoids between di- and Tetraploid C. paliurus

It is known in the field that medicinal plants possess a variety of secondary metabolites, while polyploidization may affect the accumulation pattern of these secondary metabolites. In our results, the levels of the total flavonoid content were significantly higher in the leaves of the diploid in May and only slightly higher in the diploid than the tetraploid in September (Figure 1A). To explore the rules of these changes occurring in the metabolite accumulation process in C. paliurus polyploidies, metabolome data were used in our study. The metabolite differences analyzed in this study showed that the DAMs were significantly enriched in the flavonoid biosynthesis pathway (Figure 1C). Noticeably, all six flavonoid glucuronides had remarkably higher accumulation levels in the tetraploid (Figure 2). It seems that the different metabolic processes occurring between the two ploidies were caused by the differential accumulations of flavonoids. In general, it has been reported in the literature that most polyploids outperform their diploid relatives, due to their larger-sized organs and greater cell volumes, referred to as the “Giga” effect [32]. Additionally, genome doubling reportedly influences the metabolite production in multi-polyploids. For example, Abdoli et al. [33] reported 71% and 45% increments in cichoric and chlorogenic acids, respectively, in the leaves of tetraploid Echinacea purpurea. However, a higher quality or yield of polyploids compared to their diploid relatives is not always the case. Tavan [34] reported that betulinic acid was significantly increased in the tetraploidy of Salvia officinalis, while rosmarinic and ursolic acids were significantly decreased. Park [35] showed that the contents of betulin in the leaves and fruits of diploids were higher than those in the tetraploid Morus alba.
Flavonoids, as antioxidants in plants, constitute a “secondary” antioxidant system that is activated to inhibit the generation of ROS and reduce the oxidative damage that is caused by the depletion of antioxidant enzyme activity. “Stress-sensitive” species or genotypes may synthesize higher levels of flavonoids to cope with the situation of not being able to maintain an efficient ROS scavenging system during prolonged stress [36,37]. This suggests a possible reason for the differential accumulation of flavonoids in different C. paliurus ploidy. C. paliurus is mainly distributed at altitudes ranging from 420 to 2500 m in the mountainous areas of south China [15], where the diploidy mainly occupies the higher-altitude area (>1400 m), as based on our previous survey. To cope with stress, e.g., high UV light levels and cold temperatures, etc., a greater flavonoid accumulation might be induced in diploid C. paliurus at higher altitudes [38]. The differential responses of diploid and autotetraploid organisms to abiotic and biotic stresses were verified in a low-altitude C. paliurus plantation in 2022, where the diploids suffered from increased insect attacks, fallen leaves, and partial death compared to the tetraploids. Integrated stress (i.e., drought, heat, and insect damage) could trigger an accumulation of increased flavonoids; however, a higher content of flavonoids usually accumulates at the expense of a reduction in growth, even reducing its survival rate. Therefore, diploids are more suited to higher altitudes, whereas tetraploids thrive at lower altitudes.

3.2. Differential Patterns of Gene Expressions between di- and Tetraploid C. paliurus

To investigate the potential molecular changes occurring during polyploidization, a transcriptome comparison between tetra- and diploid C. paliurus was performed using RNA-seq. Since the leaves serve as the main organs for the synthesis and primary accumulation of metabolites, we constructed transcript libraries for the leaves that were collected in May and September, respectively. A DESeq2 analysis showed that 151 DEGs (0.54%) in May and 1560 DEGs (5.53%) in September were detected by paired comparisons. In agreement with the medicinal plants Stevia rebaudiana (2.8%) [25] and Artemisia annua (8.8%) [39], only a small number of DEGs were observed for dip- and tetraploid C. paliurus. In addition, we observed that this number of DEGs was mainly present in September, in accordance with the high accumulation level in September [15]. A GO enrichment analysis showed that numerous DEGs were enriched in response to oxidative stress and the secondary metabolic process. This suggests that differentials at the transcriptional level provided an outstanding contribution to the flavonoid accumulation occurring in C. paliurus.
The flavonoid biosynthesis pathway and its regulation have been well-studied in the literature for Arabidopsis thaliana, Zea mays, Oryza sativa, and Salvia miltiorrhiza [40,41,42,43]. The three enzymes (PAL, C4H, and 4CL) during the first three stages are considered to be the general phenylpropanoid pathway [44]. The significant positive correlations between the relative gene expression (PAL, 4CL, and CHS) and flavonoid content, as well as PAL, C4H, and UFGT and the phenolic acid biosynthesis in C. paliurus, have been revealed in the literature [21,44]. In agreement with these studies, our study also determined that the same DEGs (PAL, 4CL, CHS, and UFGT) are involved in the synthesis of flavonoids. PAL, 4CH, and 4CL are often coordinately expressed to influence the flavonoid and anthocyanin levels when plants respond to stress [45,46,47]. As reported in the literature, most flavonoids are synthesized in the cytosol, then transported to the vacuole or other destinations for storage [48]. Goodman et al. [49] identified a multidrug-resistance-associated protein (MRP) in their study, ZmMrp3, which is required for the anthocyanin pigment transportation in Zea mays. In our study, an MRP gene (CpaM1st14494), a homologous gene of ZmMRP3 (65%) and VvABCC1 (78.4%), presented a high expression in the diploid as well. Plant metabolism is complex and non-transcription factors may affect the accumulation of secondary metabolites, which may not always be consistent with the transcription of related genes. For example, despite the absence of apparent differences in the expression of PAL, M4n had a bigger cinnamic acid content than M2n; similarly, the content of p-Coumaroy acid was the highest in M4n, while it had the lowest C4H expression. To resolve this contradiction between the transcription and metabolism data, further experimental data are necessary. For instance, measuring the levels of the subsequent substances, such as p-Coumaroy-CoA, and the substances involved in the lignin synthesis pathway would aid in the elucidation of how metabolites are consumed and the underlying mechanisms that are responsible for these observed discrepancies.

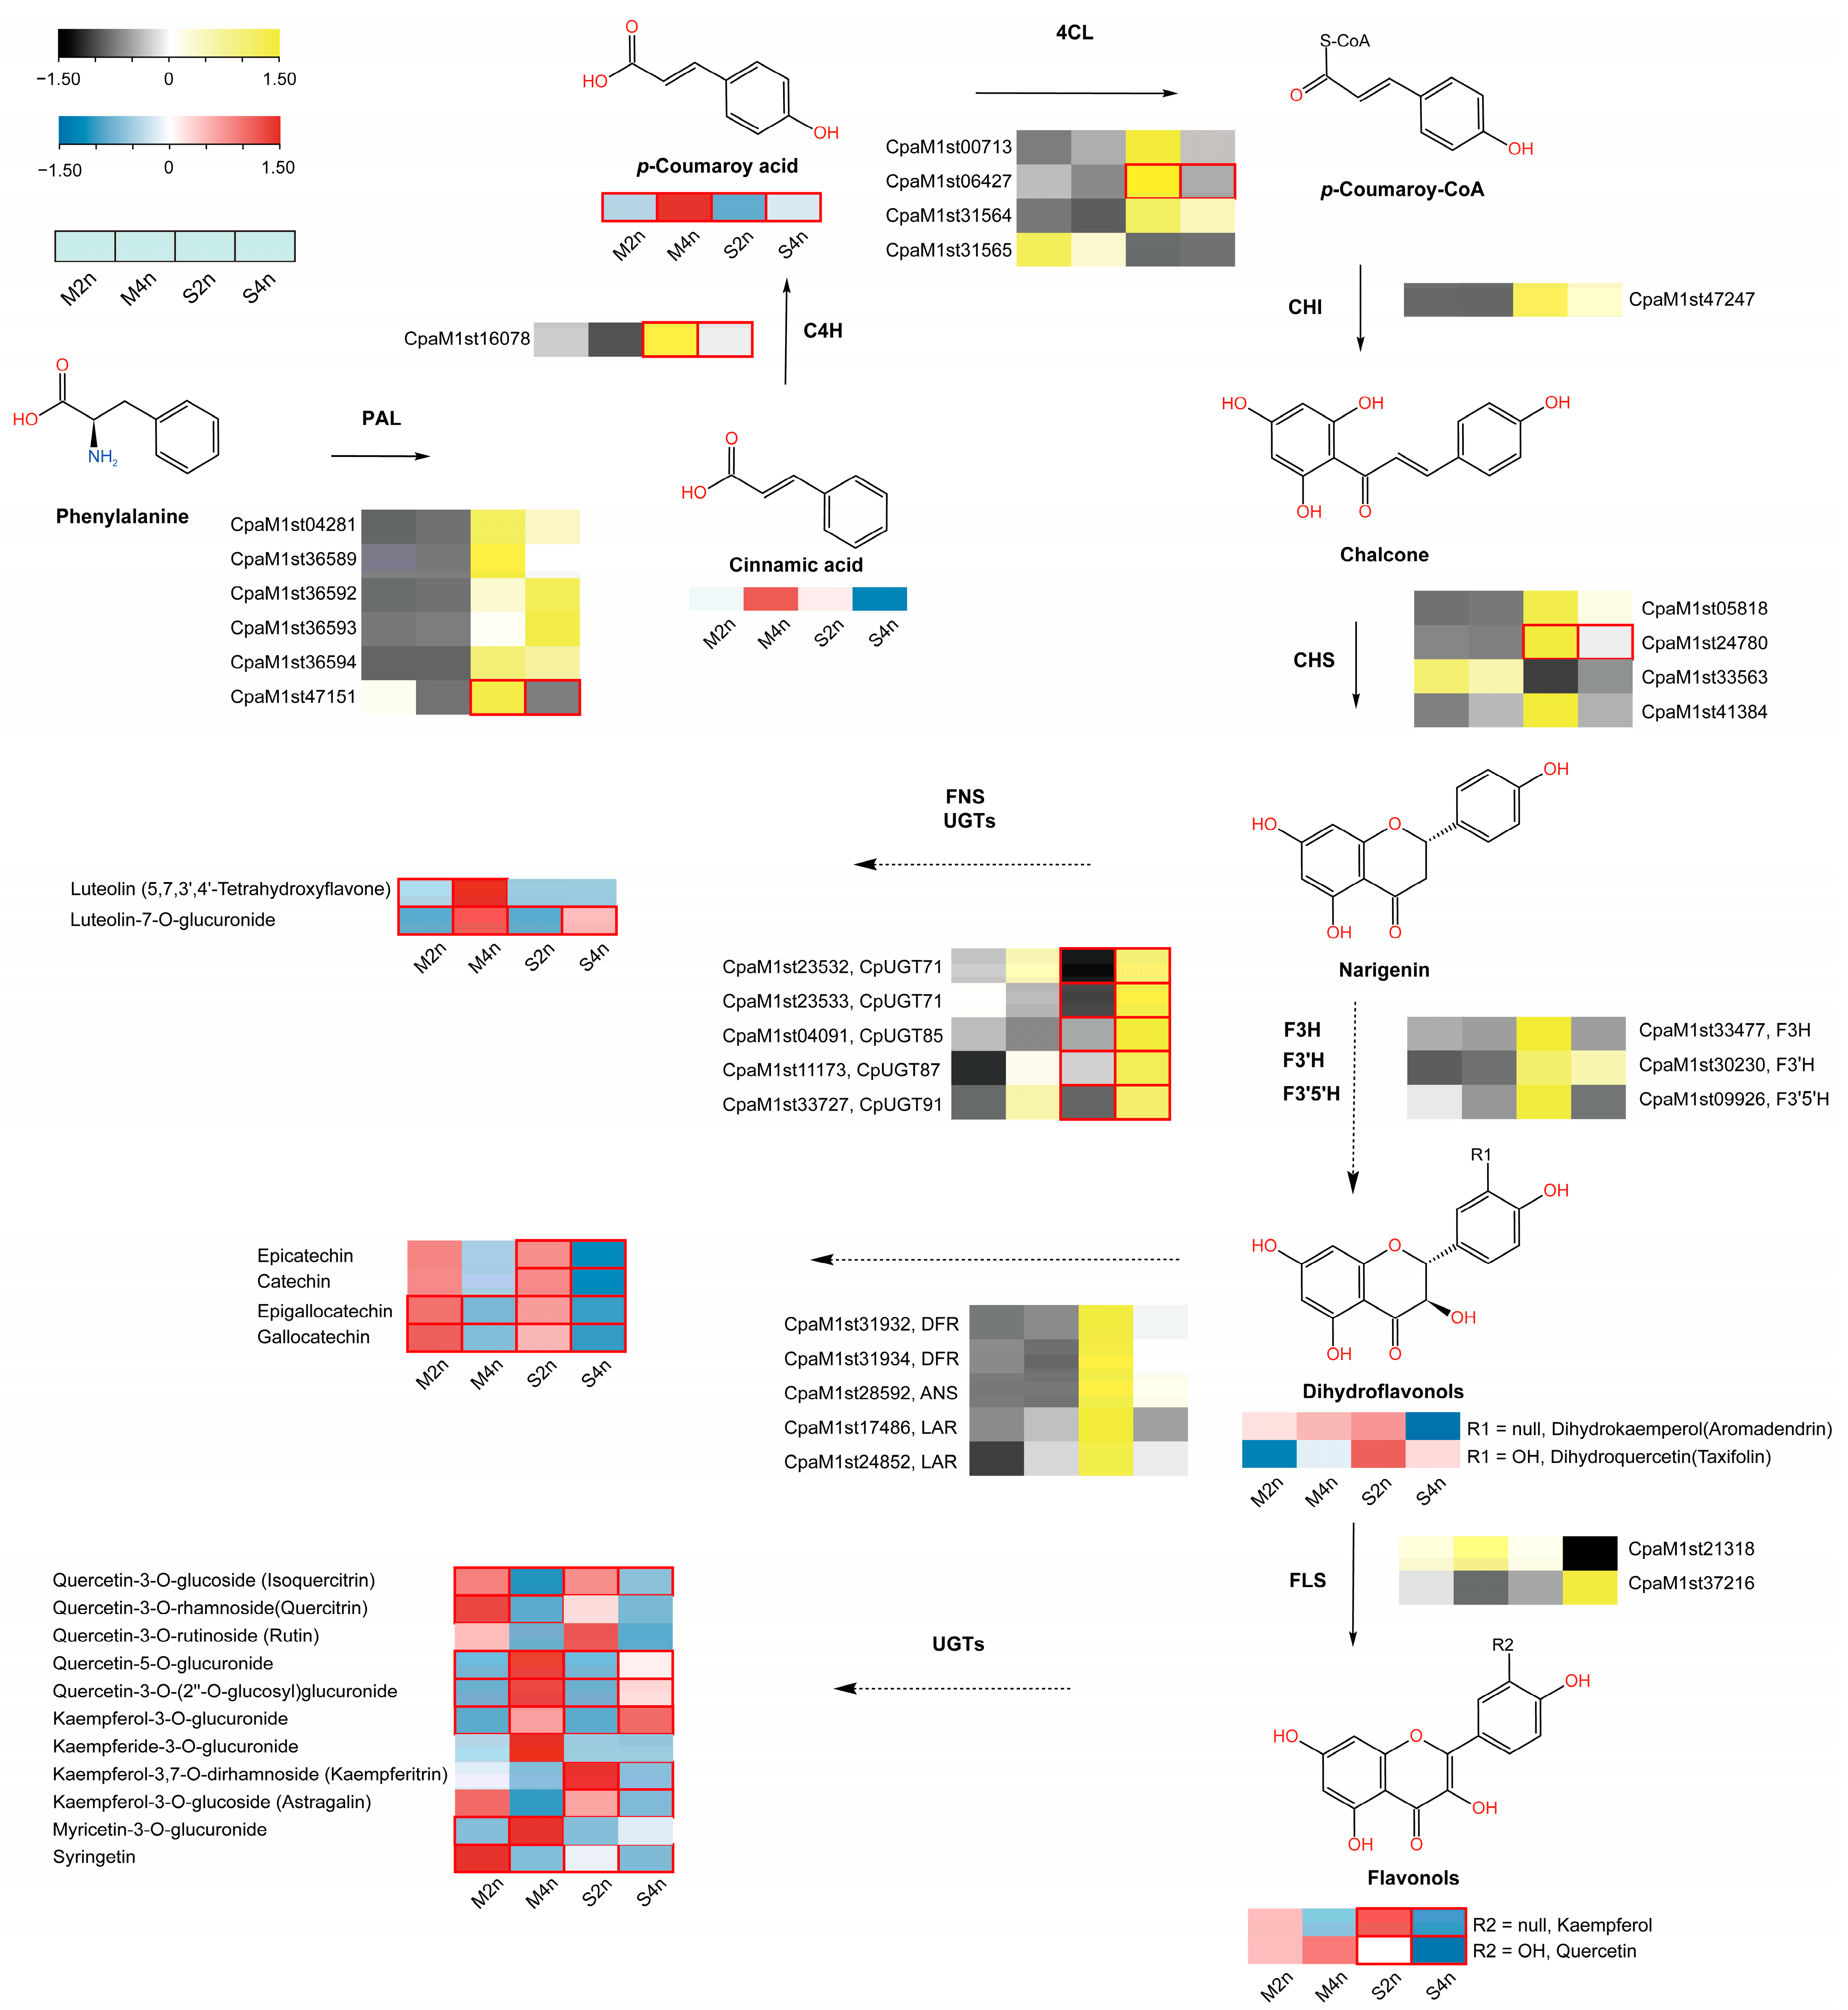
3.3. Ploidazation Can Affect Flavonoid Biosynthesis Occurring in C. paliurus

In addition to environmental factors, the expression of the genes related to flavonoid biosynthesis is also affected by several other factors, such as TFs and epigenetic factors [29,50]. In this study, the WGCNA analysis screened the modules related to the flavonoid accumulation, and obtained MYB TFs, bHLH TFs, and UGT genes. MYB TFs are key regulators for the synthesis of phenylpropanoid-derived compounds. Abiotic stress can affect anthocyanin synthesis via the MBW complex in A. thaliana [51]. Zhang [27] observed a correlation between bHLH TFs and the flavonoid content in C. paliurus under salt-stress conditions. Yu et al. [52] observed that the transcriptional regulation of taxol biosynthesis was mediated by a MYB-bHLH module consisting of TmMYB39 and bHLH13. In our study, three homologous genes of MYB39 were observed in the DEGs and the WGCNA module (CpaM1st08920, CpaM1st08932, and CpaM1st43861) (Figure S3). Moreover, UGT71A33, UGT71A34, and UGT71W2 obtained from strawberry (Fragaria × ananassa) plants could use kaempferol, quercetin, and ABA as substrates, and UGT71W2 in particular participated in the glycosylation of flavonols [53]. In this study, three UGTs (CpaM1st23532, CpaM1st23533, and CpaM1st33727), which were classified in the UGT71 subfamily, presented higher gene expression levels in the tetraploid C. paliurus.
Genome redundancy in polyploid plants is one reason for functional divergence, because the member of the duplicated gene pairs mutates and acquires a novel function without compromising any of the essential functions [54]. A previous study showed that the high expression level and affinity for the specific substrate of SbUGAT4 and the expansion of the UGT gene family contributed to the high accumulation level of baicalin in the root of Scutellaria baicalensis [55]. In Vitis vinifera, two UGT genes with a high similarity (91%), deriving from a tandem duplication, presented a diversification in their function; specifically, VvGT5 encoded flavonol-3-O-glucuronosyltransferase and VvGT6 encoded flavonol-3-O-glucosyltransferase/galactosyltransferase [56]. In conclusion, it was speculated that UGT genes in the module may gain a new function in the polyploidization process as a candidate glucuronide-specific glycosyltransferase, resulting in a sizeable difference in the glycoside-type accumulations occurring between the C. paliurus tetra- and diploids.

4. Materials and Methods

4.1. Materials and Samples

We referenced the germplasm bank for C. paliurus, including diploids (2n = 32) and autotetraploids (4n = 64), which is located in Baima, Nanjing, Jiangsu Province, China (119°09′ E, 31°35′ N). Fresh leaves from two ploidy plants were collected in May and September 2021, respectively. The collected samples were stored in liquid nitrogen and then transferred at −80 °C for further RNA and metabolite extractions.
Individuals from the plantation of C. paliurus, located in Liyang, Changzhou, Jiangsu Province, China (119°42′ E, 31°40′ N), were used to detect the total flavonoid content. The fresh leaves of two ploidy plants were collected each month from May to September 2022. The leaves used for determining the flavonoid content were dried at 70 °C until their weights no longer decreased, then they were pulverized and sieved through a 60-mesh sieve for the flavonoid content measurement.
The experimental forest was a mature plantation at the time of sampling and was planted in 2011. It was located in hilly mountainous areas with a slope of 30° and had acidic yellow-brown soil (pH 6.5). Its altitude was approximately 100 m, and the average annual temperature, sunshine, and precipitation duration were 17.5 °C, 2240 h, and 1143 mm, respectively.
The sampling was conducted in the early to mid-third week of each month in the morning, with the mature leaves from the sunny side of the canopy layer being collected. In total, three biological repeats were obtained for each ploidy, and the samples for each replica were harvested from three individuals.

4.2. Flavonoid Content Measurement

The prepared leaves were extracted using the reported method presented by Cao [57]. In brief, 10 mL of 70% (v/v) ethanol mixed with dry leaf powder (0.8 g) was ultrasonicated for 45 min at 70 °C (water bath). After being cooled to room temperature, the extraction was centrifuged at 10,000 rpm for 10 min. The total flavonoid content was measured by optimized colorimetry [27] and calculated based on the standard rutin curve (liner range: 0.71–23.35 mg/mL, R2 > 0.99).

4.3. Non-Targeted Metabolite Analysis Using the UPLC-MS/MS System

The UPLC-MS/MS system (UPLC, SHIMADZU Nexera X2; MS/MS, Applied Biosystems 4500 Q TRAP) was used to analyze the flavonoid accumulation levels in the leaves of the di- and tetraploid plants.
The vacuum-freeze dried leaves of C. paliurus were ground into a powder (30 Hz, 1.5 min), and 100 mg of this powder was extracted with 1.2 mL of a methanol solution (70%). The extract was vortexed for 30 s every 30 min and repeated in 6 sets, then stored at −20 °C overnight. After being centrifuged at 12,000 rpm for 10 min, the supernatant was filtered with a microporous membrane (0.22 µm pore size) and collected for the UPLC-ESI-MS/MS analysis.
The UPLC operation parameters were determined according to the method of Qu et al. (2022). A chromatographic separation was conducted using an Agilent SB-C18 HPLC analytical column (2.1 mm × 100 mm, 1.8 µm); the mobile phase consisted of ultrapure water (A) and acetonitrile (B), which both contained 0.1% formic acid. The gradient elutions were as follows: an original ratio of 5% B; the B ratio was linearly increased to 95% within 9 min and was maintained for 1 min; and the B ratio was decreased to 5% during 10 to 11.1 min and kept for 14 min. The flow rate was kept at 0.35 mL/min at 40 °C, and the injection volume was 4 µL. The electrospray ionization (ESI)-triple quadrupole-linear ion trap (Q TRAP)-MS system was utilized for the subsequent MS experiment.

4.4. Transcriptomic Analysis and Co-Expression Network Construct

The leaves, which had been frozen in liquid nitrogen, were ground into a fine powder (nitrogen-frozen) and the total RNA was extracted using the E.Z.N.A.® Plant RNA Kit (Omega Bio-tek, Norcross, CA, USA), followed by a purification with RNase-Free Dnase I (TaKaRa, Tokyo, Japan). A total of 1% agarose gel was used to evaluate the RNA contamination and degradation properties. The purity factor was monitored further using an ultraviolet spectrophotometer (Implen, Westlake Village, CA, USA). The samples with RIN > 8 were used for the downstream cDNA library preparation. The cDNA libraries’ construction was performed with a NEBNext® UltraTM RNA Library Prep Kit, according to the manufacturer’s instructions. The Agilent Bioanalyzer 2100 system was used for the library quality assessment, and short paired-end reads were generated from the library preparations based on the Illumina Novaseq sequencing platform. The value of the TPM from the row counts was calculated using StringTie software [58], and the DEseq2 package in R [59] was used to identify the DEGs (|Log2 fold change| > 1, FDR < 0.05) occurring between the samples. For the assessment of the metabolic pathways and related gene functions, the DEGs were used for the KEGG pathway enrichment and Gene Ontology (GO) enrichment analyses by using OmicsShare tools (https://www.omicsmart.com/, accessed on 8 March 2022) (FDR < 0.05). PlantCARE was used to search for the cis-regulator elements from the upstream 2 kb promoter sequences (https://bioinformaics.psb.ugent.be/webtools/plantcare/html/, accessed on 8 March 2022) [60].
To identify the candidate genes in the flavonoid biosynthesis pathway, which regulate the flavonoid glucuronide accumulation levels, a weighted gene co-expression network analysis (WGCNA) was performed by using the R package WGCNA [61,62]. The WGCNA network construction and model detection were conducted with an unsigned type of topological overlap matrix (TOM) (threshold power = 18; minimal module size = 40; branch merge cut height = 0.35). The module eigengene (the first principal component of a given module) value was calculated for evaluating the association of the modules with the abundance of flavonoid glucuronides in the leaves. The most significant model was defined as a gene cluster correlation with a flavonoid glucuronide accumulation. The genes within the correlation network that had a high KME (eigengene connectivity) value (|KME| > 0.6) were defined as hub genes.

4.5. RT-qPCR Analysis

The total RNA was extracted from the leaves using an E.Z.N.A.® Plant RNA Kit (Omega Bio-tek, Norcross, CA, USA) and 1 μg of mRNA was used to synthesize the cDNA, using a PrimeScriptTM RT reagent Kit (TaKaRa, Tokyo, Japan). The RT-qPCR analysis was conducted using a SYBR Green Realtime PCR Master Mix Kit (TOYOBO CO., LTD, Tokyo, Japan) and Applied BiosystemsTM 7500 Real-Time PCR Systems (Thermo Fisher Scientific, Waltham, MA, USA). The primers were designed by the Primer Premier 5 (United States) and these primer sequences are presented in Table 3; the 18s rRNA gene was selected as the internal standard. The relative transcript abundance was calculated using the 2−ΔΔCT method [63]. In total, three biological and three technical replicates were used for all the RT-qPCR reactions.

4.6. Phylogenic Tree Construct

Based on the amino acid sequences, the phylogenetic trees of the MYBs, bHLHs, and UGTs that were obtained from C. paliurus and A. thaliana were constructed using MAFFT 7.505 [64] and FastTree 2.1 [65], and then visualized using iTOL (https://itol.embl.de, accessed on 8 March 2022) [66]. The gene family sequences of A. thaliana were obtained from PlantRegMap (http://plantregmap.gao-lab.org/, accessed on 8 March 2022) [67].

4.7. Statistical Analyses

All the statistical analyses were performed using R package models, GraphPad Prism (Version 8.0), and TBtools software (Version 1.0986732) [68]. The mean value of all the samples from the same treatment was used for the statistical analysis. The correlations between 2 variables were tested with Pearson correlation coefficients. We utilized Student’s t-tests to compare the two groups and the p-values were derived accordingly. The heatmap data were scaled using the min–max scaling method.

5. Conclusions

The total contents of the flavonoids present in the leaves of the diploid C. paliurus collected in May were significantly higher than those in the autotetraploid, whereas no significant difference between the two specimens was observed in September. However, the total content in September was much higher than that in May. A comparative metabolome analysis revealed that the accumulation of flavonoid glucuronides was much higher in the tetraploids than in the diploids. At the transcriptome level, the differences in the gene expressions between the two ploidies mainly occurred during the processes of some responses to the environment, such as secondary metabolic biosynthesis and oxidation reduction. Based on the co-expression network constructed using the metabolome and transcriptome databases, the difference between the two ploidies was a consequence of the collective contribution of several genes, including three CpMYB39 and three CpUGT71, which was highly associated with flavonoid glucuronides. Our results are not only helpful for understanding the molecular mechanism of the polyploidization in differential flavonoid glycosides’ biosynthesis activity, but also provide important information for the rational and efficient utilization of C. paliurus. Furthermore, the functions of CpUGT71 and CpMYB39 in the accumulation of glucuronides should be considered in future research.

Supplementary Materials

The following supporting information can be downloaded at: https://www.mdpi.com/article/10.3390/f14040770/s1, Table S1: Raw data for Figure 1D; Table S2: Raw data for Figure 2; Table S3: Gene structures obtained from DEGs; Table S4: TFs obtained from DEGs; Figure S1. Framework and analytical process for this study, presents the technical roadmap and analytical process that will be followed in this article; Figure S2. Column plot showing the number of DEGs; Figure S3. Phylogenic tree of MYBs and bHLH obtained from C. paliurus and A. thaliana, the neighbor-joining method was used to construct the bootstrap (n = 1000). The DEGs mentioned in the manuscript are highlighted in red, while the evolutionary branches of genes not discussed in this study have been simplified as gray triangles; Figure S4. Phylogenic tree of UGTs obtained from C. paliurus and A. thaliana, the neighbor-joining method was used to construct the bootstrap (n = 1000). The DEGs mentioned in the manuscript are highlighted in red, while the evolutionary branches of genes not discussed in this study have been simplified as gray triangles. UGTs are divided into 15 subgroups, as outlined in Ross et al.’s [11] research.

Author Contributions

Conceptualization, Y.Y. and X.F.; methodology, Y.Y. and S.W.; software, Y.Y.; validation, Y.Q., S.W., X.S. and Q.W.; investigation, Y.Q. and X.S.; resources, Y.Q. and X.S.; writing—original draft preparation, Y.Y.; writing—review and editing, X.F.; visualization, Y.Y.; funding acquisition, X.F. All authors have read and agreed to the published version of the manuscript.

Funding

This work was funded by the National Natural Science Foundation of China (project number: 32271859). The funding bodies had no role in the design of the study and collection, analysis, and interpretation of the data in writing the manuscript.

Data Availability Statement

The transcriptome data have been submitted to the Genome Sequence Archive at the National Genomics Data Center (NGDC), Beijing Institute of Genomics (BIG), Chinese Academy of Sciences (CAS)/China National Center for Bioinformation (CNCB) (GSA: CRA016444 and BioProject: PRJCA016102), and are publicly accessible at https://ngdc.cncb.ac.cn/gsa/.

Acknowledgments

We would like to thank Shengzuo Fang for providing the sequencing materials.

Conflicts of Interest

The authors declare no conflict of interest. The founding sponsors had no role in the design of the study; in the collection, analysis, or interpretation of the data; in the writing of the manuscript; or in the decision to publish the results.

References

  1. Nakabayashi, R.; Yonekura-Sakakibara, K.; Urano, K.; Suzuki, M.; Yamada, Y.; Nishizawa, T.; Matsuda, F.; Kojima, M.; Sakakibara, H.; Shinozaki, K.; et al. Enhancement of Oxidative and Drought Tolerance in Arabidopsis by Overaccumulation of Antioxidant Flavonoids. Plant J. 2014, 77, 367–379. [Google Scholar] [CrossRef] [PubMed] [Green Version]
  2. Brunetti, C.; Fini, A.; Sebastiani, F.; Gori, A.; Tattini, M. Modulation of Phytohormone Signaling: A Primary Function of Flavonoids in Plant–Environment Interactions. Front. Plant Sci. 2018, 9, 1042. [Google Scholar] [CrossRef] [Green Version]
  3. Van Hung, P. Phenolic Compounds of Cereals and Their Antioxidant Capacity. Crit. Rev. Food Sci. Nutr. 2016, 56, 25–35. [Google Scholar] [CrossRef] [PubMed]
  4. Peluso, I.; Miglio, C.; Morabito, G.; Ioannone, F.; Serafini, M. Flavonoids and Immune Function in Human: A Systematic Review. Crit. Rev. Food Sci. Nutr. 2015, 55, 383–395. [Google Scholar] [CrossRef]
  5. Maleki, S.J.; Crespo, J.F.; Cabanillas, B. Anti-Inflammatory Effects of Flavonoids. Food Chem. 2019, 299, 125124. [Google Scholar] [CrossRef]
  6. Kopustinskiene, D.M.; Jakstas, V.; Savickas, A.; Bernatoniene, J. Flavonoids as Anticancer Agents. Nutrients 2020, 12, 457. [Google Scholar] [CrossRef] [PubMed] [Green Version]
  7. Hu, W.; Wang, X.; Wu, L.; Shen, T.; Ji, L.; Zhao, X.; Si, C.-L.; Jiang, Y.; Wang, G. Apigenin-7-O-β-d-Glucuronide Inhibits LPS-Induced Inflammation through the Inactivation of AP-1 and MAPK Signaling Pathways in RAW 264.7 Macrophages and Protects Mice against Endotoxin Shock. Available online: https://pubmed.ncbi.nlm.nih.gov/26750400/ (accessed on 20 January 2023).
  8. Cho, Y.-C.; Park, J.; Cho, S. Anti-Inflammatory and Anti-Oxidative Effects of Luteolin-7-O-Glucuronide in LPS-Stimulated Murine Macrophages through TAK1 Inhibition and Nrf2 Activation. Int. J. Mol. Sci. 2020, 21, 2007. [Google Scholar] [CrossRef] [Green Version]
  9. De Bruyn, F.; Maertens, J.; Beauprez, J.; Soetaert, W.; De Mey, M. Biotechnological Advances in UDP-Sugar Based Glycosylation of Small Molecules. Biotechnol. Adv. 2015, 33, 288–302. [Google Scholar] [CrossRef]
  10. Xiao, J. Dietary Flavonoid Aglycones and Their Glycosides: Which Show Better Biological Significance? Crit. Rev. Food Sci. Nutr. 2015, 57, 1874–1905. [Google Scholar] [CrossRef]
  11. Ross, J.; Li, Y.; Lim, E.-K.; Bowles, D.J. Higher Plant Glycosyltransferases. Genome Biol. 2001, 2, 1–6. [Google Scholar] [CrossRef] [PubMed]
  12. Wang, X. Structure, Mechanism and Engineering of Plant Natural Product Glycosyltransferases. FEBS Lett. 2009, 583, 3303–3309. [Google Scholar] [CrossRef] [PubMed] [Green Version]
  13. Noguchi, A.; Horikawa, M.; Fukui, Y.; Fukuchi-Mizutani, M.; Iuchi-Okada, A.; Ishiguro, M.; Kiso, Y.; Nakayama, T.; Ono, E. Local Differentiation of Sugar Donor Specificity of Flavonoid Glycosyltransferase in Lamiales. Plant Cell 2009, 21, 1556–1572. [Google Scholar] [CrossRef] [PubMed] [Green Version]
  14. Yue, T.; Chen, R.; Chen, D.; Liu, J.; Xie, K.; Dai, J. Enzymatic Synthesis of Bioactive O-Glucuronides Using Plant Glucuronosyltransferases. J. Agric. Food Chem. 2019, 67, 6275–6284. [Google Scholar] [CrossRef] [PubMed]
  15. Fang, S.; Yang, W.; Chu, X.; Shang, X.; She, C.; Fu, X. Provenance and Temporal Variations in Selected Flavonoids in Leaves of Cyclocarya paliurus. Food Chem. 2011, 124, 1382–1386. [Google Scholar] [CrossRef]
  16. Ma, Y.; Jiang, C.; Yao, N.; Li, Y.; Wang, Q.; Fang, S.; Shang, X.; Zhao, M.; Che, C.; Ni, Y.; et al. Antihyperlipidemic Effect of Cyclocarya paliurus (Batal.) Iljinskaja Extract and Inhibition of Apolipoprotein B48 Overproduction in Hyperlipidemic Mice. J. Ethnopharmacol. 2015, 166, 286–296. [Google Scholar] [CrossRef]
  17. Liu, Y.; Cao, Y.; Fang, S.; Wang, T.; Yin, Z.; Shang, X.; Yang, W.; Fu, X. Antidiabetic Effect of Cyclocarya paliurus Leaves Depends on the Contents of Antihyperglycemic Flavonoids and Antihyperlipidemic Triterpenoids. Molecules 2018, 23, 1042. [Google Scholar] [CrossRef] [Green Version]
  18. Yang, H.-M.; Yin, Z.-Q.; Zhao, M.-G.; Jiang, C.-H.; Zhang, J.; Pan, K. Pentacyclic Triterpenoids from Cyclocarya paliurus and Their Antioxidant Activities in FFA-Induced HepG2 Steatosis Cells. Phytochemistry 2018, 151, 119–127. [Google Scholar] [CrossRef]
  19. Zhou, M.; Lin, Y.; Fang, S.; Liu, Y.; Shang, X. Phytochemical Content and Antioxidant Activity in Aqueous Extracts of Cyclocarya paliurus Leaves Collected from Different Populations. PeerJ 2019, 7, e6492. [Google Scholar] [CrossRef] [Green Version]
  20. Deng, B.; Shang, X.; Fang, S.; Li, Q.; Fu, X.; Su, J. Integrated Effects of Light Intensity and Fertilization on Growth and Flavonoid Accumulation in Cyclocarya paliurus. J. Agric. Food Chem. 2012, 60, 6286–6292. [Google Scholar] [CrossRef] [PubMed]
  21. Liu, Y.; Fang, S.; Yang, W.; Shang, X.; Fu, X. Light Quality Affects Flavonoid Production and Related Gene Expression in Cyclocarya paliurus. J. Photochem. Photobiol. B Biol. 2018, 179, 66–73. [Google Scholar] [CrossRef]
  22. Qu, Y.; Shang, X.; Zeng, Z.; Yu, Y.; Bian, G.; Wang, W.; Liu, L.; Tian, L.; Zhang, S.; Wang, Q.; et al. Whole-Genome Duplication Reshaped Adaptive Evolution in a Relict Plant Species, Cyclocarya paliurus. Genom. Proteom. Bioinform. 2023. [Google Scholar] [CrossRef] [PubMed]
  23. Sattler, M.C.; Carvalho, C.R.; Clarindo, W.R. The Polyploidy and Its Key Role in Plant Breeding. Planta 2016, 243, 281–296. [Google Scholar] [CrossRef]
  24. De Jesus-Gonzalez, L.; Weathers, P.J. Tetraploid Artemisia Annua Hairy Roots Produce More Artemisinin than Diploids. Plant Cell Rep. 2003, 21, 809–813. [Google Scholar] [CrossRef]
  25. Xiang, Z.; Tang, X.; Liu, W.; Song, C. A Comparative Morphological and Transcriptomic Study on Autotetraploid Stevia rebaudiana (Bertoni) and Its Diploid. Plant Physiol. Biochem. 2019, 143, 154–164. [Google Scholar] [CrossRef] [PubMed]
  26. Gao, S.L.; Chen, B.J.; Zhu, D.N. In Vitro Production and Identification of Autotetraploids of Scutellaria baicalensis. Plant Cell Tissue Organ. Cult. 2002, 70, 289–293. [Google Scholar] [CrossRef]
  27. Zhang, L.; Zhang, Z.; Fang, S.; Liu, Y.; Shang, X. Integrative Analysis of Metabolome and Transcriptome Reveals Molecular Regulatory Mechanism of Flavonoid Biosynthesis in Cyclocarya paliurus under Salt Stress. Ind. Crops Prod. 2021, 170, 113823. [Google Scholar] [CrossRef]
  28. Kanehisa, M.; Furumichi, M.; Tanabe, M.; Sato, Y.; Morishima, K. KEGG: New Perspectives on Genomes, Pathways, Diseases and Drugs. Nucleic Acids Res. 2017, 45, D353–D361. [Google Scholar] [CrossRef] [Green Version]
  29. Xu, W.; Dubos, C.; Lepiniec, L. Transcriptional Control of Flavonoid Biosynthesis by MYB–BHLH–WDR Complexes. Trends Plant Sci. 2015, 20, 176–185. [Google Scholar] [CrossRef] [PubMed]
  30. Hao, Y.; Zong, X.; Ren, P.; Qian, Y.; Fu, A. Basic Helix-Loop-Helix (BHLH) Transcription Factors Regulate a Wide Range of Functions in Arabidopsis. Int. J. Mol. Sci. 2021, 22, 7152. [Google Scholar] [CrossRef] [PubMed]
  31. Liu, J.; Osbourn, A.; Ma, P. MYB Transcription Factors as Regulators of Phenylpropanoid Metabolism in Plants. Mol. Plant 2015, 8, 689–708. [Google Scholar] [CrossRef] [PubMed] [Green Version]
  32. Comai, L. The Advantages and Disadvantages of Being Polyploid. Nat. Rev. Genet. 2005, 6, 836–846. [Google Scholar] [CrossRef]
  33. Abdoli, M.; Moieni, A.; Naghdi Badi, H. Morphological, Physiological, Cytological and Phytochemical Studies in Diploid and Colchicine-Induced Tetraploid Plants of Echinacea purpurea (L.). Acta Physiol. Plant 2013, 35, 2075–2083. [Google Scholar] [CrossRef]
  34. Tavan, M.; Sarikhani, H.; Mirjalili, M.H.; Rigano, M.M.; Azizi, A. Triterpenic and Phenolic Acids Production Changed in Salvia Officinalis via in Vitro and in Vivo Polyploidization: A Consequence of Altered Genes Expression. Phytochemistry 2021, 189, 112803. [Google Scholar] [CrossRef] [PubMed]
  35. Park, C.H.; Park, Y.E.; Yeo, H.J.; Yoon, J.S.; Park, S.-Y.; Kim, J.K.; Park, S.U. Comparative Analysis of Secondary Metabolites and Metabolic Profiling between Diploid and Tetraploid Morus alba L. J. Agric. Food Chem. 2021, 69, 1300–1307. [Google Scholar] [CrossRef]
  36. Agati, G.; Brunetti, C.; Fini, A.; Gori, A.; Guidi, L.; Landi, M.; Sebastiani, F.; Tattini, M. Are Flavonoids Effective Antioxidants in Plants? Twenty Years of Our Investigation. Antioxidants 2020, 9, 1098. [Google Scholar] [CrossRef]
  37. Agati, G.; Brunetti, C.; Di Ferdinando, M.; Ferrini, F.; Pollastri, S.; Tattini, M. Functional Roles of Flavonoids in Photoprotection: New Evidence, Lessons from the Past. Plant Physiol. Biochem. 2013, 72, 35–45. [Google Scholar] [CrossRef] [PubMed]
  38. Du, Z.; Lin, W.; Yu, B.; Zhu, J.; Li, J. Integrated Metabolomic and Transcriptomic Analysis of the Flavonoid Accumulation in the Leaves of Cyclocarya paliurus at Different Altitudes. Front. Plant Sci. 2022, 12, 794137. [Google Scholar] [CrossRef]
  39. Xia, J.; Ma, Y.J.; Wang, Y.; Wang, J.W. Deciphering Transcriptome Profiles of Tetraploid Artemisia Annua Plants with High Artemisinin Content. Plant Physiol. Biochem. 2018, 130, 112–126. [Google Scholar] [CrossRef] [PubMed]
  40. Saito, K.; Yonekura-Sakakibara, K.; Nakabayashi, R.; Higashi, Y.; Yamazaki, M.; Tohge, T.; Fernie, A.R. The Flavonoid Biosynthetic Pathway in Arabidopsis: Structural and Genetic Diversity. Plant Physiol. Biochem. 2013, 72, 21–34. [Google Scholar] [CrossRef] [PubMed] [Green Version]
  41. Wen, W.; Li, D.; Li, X.; Gao, Y.; Li, W.; Li, H.; Liu, J.; Liu, H.; Chen, W.; Luo, J.; et al. Metabolome-Based Genome-Wide Association Study of Maize Kernel Leads to Novel Biochemical Insights. Nat. Commun. 2014, 5, 3438. [Google Scholar] [CrossRef] [Green Version]
  42. Chen, W.; Gao, Y.; Gong, L.; Lu, K.; Wang, W.; Li, Y.; Liu, X.; Zhang, H.; Dong, H.; Zhang, W.; et al. Genome-Wide Association Analyses Provide Genetic and Biochemical Insights into Natural Variation in Rice Metabolism. Nat. Genet. 2014, 46, 714–721. [Google Scholar] [CrossRef] [PubMed]
  43. Deng, C.; Wang, Y.; Huang, F.; Lu, S.; Zhao, L.; Ma, X.; Kai, G. SmMYB2 Promotes Salvianolic Acid Biosynthesis in the Medicinal Herb Salvia miltiorrhiza. J. Integr. Plant Biol. 2020, 62, 1688–1702. [Google Scholar] [CrossRef] [PubMed]
  44. Lin, W.; Li, Y.; Lu, Q.; Lu, H.; Li, J. Combined Analysis of the Metabolome and Transcriptome Identified Candidate Genes Involved in Phenolic Acid Biosynthesis in the Leaves of Cyclocarya paliurus. Int. J. Mol. Sci. 2020, 21, 1337. [Google Scholar] [CrossRef] [PubMed] [Green Version]
  45. Lv, M.; Su, H.-Y.; Li, M.-L.; Yang, D.-L.; Yao, R.-Y.; Li, M.-F.; Wei, J.-H. Effect of UV-B Radiation on Growth, Flavonoid and Podophyllotoxin Accumulation, and Related Gene Expression in Sinopodophyllum hexandrum. Plant Biol. J. 2021, 23, 202–209. [Google Scholar] [CrossRef] [PubMed]
  46. Ren, T.; Zheng, P.; Zhang, K.; Liao, J.; Xiong, F.; Shen, Q.; Ma, Y.; Fang, W.; Zhu, X. Effects of GABA on the Polyphenol Accumulation and Antioxidant Activities in Tea Plants (Camellia sinensis L.) under Heat-Stress Conditions. Plant Physiol. Biochem. 2021, 159, 363–371. [Google Scholar] [CrossRef] [PubMed]
  47. Wang, C.; Chen, L.; Cai, Z.; Chen, C.; Liu, Z.; Liu, S.; Zou, L.; Tan, M.; Chen, J.; Liu, X.; et al. Metabolite Profiling and Transcriptome Analysis Explains Difference in Accumulation of Bioactive Constituents in Licorice (Glycyrrhiza uralensis) Under Salt Stress. Front. Plant Sci. 2021, 12, 727882. [Google Scholar] [CrossRef]
  48. Pucker, B.; Selmar, D. Biochemistry and Molecular Basis of Intracellular Flavonoid Transport in Plants. Plants 2022, 11, 963. [Google Scholar] [CrossRef]
  49. Goodman, C.D.; Casati, P.; Walbot, V. A Multidrug Resistance–Associated Protein Involved in Anthocyanin Transport in Zea mays. Plant Cell 2004, 16, 1812–1826. [Google Scholar] [CrossRef] [PubMed] [Green Version]
  50. Ma, D.; Constabel, C.P. MYB Repressors as Regulators of Phenylpropanoid Metabolism in Plants. Trends Plant Sci. 2019, 24, 275–289. [Google Scholar] [CrossRef]
  51. Dubos, C.; Stracke, R.; Grotewold, E.; Weisshaar, B.; Martin, C.; Lepiniec, L. MYB Transcription Factors in Arabidopsis. Trends Plant Sci. 2010, 15, 573–581. [Google Scholar] [CrossRef]
  52. Yu, C.; Huang, J.; Wu, Q.; Zhang, C.; Li, X.-L.; Xu, X.; Feng, S.; Zhan, X.; Chen, Z.; Wang, H.; et al. Role of Female-Predominant MYB39-BHLH13 Complex in Sexually Dimorphic Accumulation of Taxol in Taxus Media. Hortic Res. 2022, 9, uhac062. [Google Scholar] [CrossRef] [PubMed]
  53. Song, C.; Gu, L.; Liu, J.; Zhao, S.; Hong, X.; Schulenburg, K.; Schwab, W. Functional Characterization and Substrate Promiscuity of UGT71 Glycosyltransferases from Strawberry (Fragaria × ananassa). Plant Cell Physiol. 2015, 56, 2478–2493. [Google Scholar] [CrossRef] [Green Version]
  54. Adams, K.L.; Wendel, J.F. Polyploidy and Genome Evolution in Plants. Curr. Opin. Plant Biol. 2005, 8, 135–141. [Google Scholar] [CrossRef] [PubMed]
  55. Pei, T.; Yan, M.; Li, T.; Li, X.; Yin, Y.; Cui, M.; Fang, Y.; Liu, J.; Kong, Y.; Xu, P.; et al. Characterization of UDP-Glycosyltransferase Family Members Reveals How Major Flavonoid Glycoside Accumulates in the Roots of Scutellaria baicalensis. BMC Genom. 2022, 23, 169. [Google Scholar] [CrossRef]
  56. Ono, E. Functional Differentiation of the Glycosyltransferases That Contribute to the Chemical Diversity of Bioactive Flavonol Glycosides in Grapevines (Vitis vinifera). Available online: https://pubmed.ncbi.nlm.nih.gov/20693356/ (accessed on 9 November 2022).
  57. Cao, Y.; Fang, S.; Yin, Z.; Fu, X.; Shang, X.; Yang, W.; Yang, H. Chemical Fingerprint and Multicomponent Quantitative Analysis for the Quality Evaluation of Cyclocarya paliurus Leaves by HPLC–Q–TOF–MS. Molecules 2017, 22, 1927. [Google Scholar] [CrossRef] [Green Version]
  58. Pertea, M.; Pertea, G.M.; Antonescu, C.M.; Chang, T.-C.; Mendell, J.T.; Salzberg, S.L. StringTie Enables Improved Reconstruction of a Transcriptome from RNA-Seq Reads. Nat. Biotechnol. 2015, 33, 290–295. [Google Scholar] [CrossRef] [PubMed] [Green Version]
  59. Love, M.I.; Huber, W.; Anders, S. Moderated Estimation of Fold Change and Dispersion for RNA-Seq Data with DESeq2. Genome Biol. 2014, 15, 550. [Google Scholar] [CrossRef] [PubMed] [Green Version]
  60. Lescot, M. PlantCARE, a Database of Plant Cis-Acting Regulatory Elements and a Portal to Tools for in Silico Analysis of Promoter Sequences. Nucleic Acids Res. 2002, 30, 325–327. [Google Scholar] [CrossRef] [PubMed]
  61. Langfelder, P.; Horvath, S. WGCNA: An R Package for Weighted Correlation Network Analysis. BMC Bioinform. 2008, 9, 559. [Google Scholar] [CrossRef] [Green Version]
  62. Langfelder, P.; Horvath, S. Fast R Functions for Robust Correlations and Hierarchical Clustering. J. Stat. Soft. 2012, 46, i11. [Google Scholar] [CrossRef] [Green Version]
  63. Livak, K.J.; Schmittgen, T.D. Analysis of Relative Gene Expression Data Using Real-Time Quantitative PCR and the 2−ΔΔCT Method. Methods 2001, 25, 402–408. [Google Scholar] [CrossRef] [PubMed]
  64. MAFFT-DASH: Integrated Protein Sequence and Structural Alignment|Nucleic Acids Research|Oxford Academic. Available online: https://academic.oup.com/nar/article/47/W1/W5/5486273?login=true (accessed on 18 January 2023).
  65. Price, M.N.; Dehal, P.S.; Arkin, A.P. FastTree: Computing Large Minimum Evolution Trees with Profiles Instead of a Distance Matrix. Mol. Biol. Evol. 2009, 26, 1641–1650. [Google Scholar] [CrossRef] [PubMed]
  66. Interactive Tree Of Life (ITOL) v5: An Online Tool for Phylogenetic Tree Display and Annotation|Nucleic Acids Research|Oxford Academic. Available online: https://academic.oup.com/nar/article/49/W1/W293/6246398?login=true (accessed on 18 January 2023).
  67. Tian, F.; Yang, D.-C.; Meng, Y.-Q.; Jin, J.; Gao, G. PlantRegMap: Charting Functional Regulatory Maps in Plants. Nucleic Acids Res. 2020, 48, D1104–D1113. [Google Scholar] [CrossRef] [PubMed]
  68. Chen, C.; Chen, H.; Zhang, Y.; Thomas, H.R.; Frank, M.H.; He, Y.; Xia, R. TBtools: An Integrative Toolkit Developed for Interactive Analyses of Big Biological Data. Mol. Plant 2020, 13, 1194–1202. [Google Scholar] [CrossRef]
Figure 1. (A) Total flavonoid content in the leaves obtained from a diploid and autotetraploid of C. paliurus harvested in May and September, respectively; *** indicates significant difference at p < 0.01; (B) Venn diagrams show differential accumulation metabolites (DAMs) in leaves of di- and tetraploid C. paliurus collected in May and September, respectively. Circles and rectangles in the same color represent the same comparison group; (C) KEGG pathway enrichment results of DAMs between tetra- and diploid C. paliurus; and (D) heatmap of 89 flavonoids from metabolism data: yellow indicates high-abundant metabolites, whereas low-abundant metabolites are shown in black. The complete list of compounds and concentrations are provided in Table S1 from Supplementary Material.
Forests 14 00770 g001
Figure 2. Heatmap of differentially accumulated flavonoid glycosides in different C. paliurus ploidies. Each sample is represented by a column and each metabolite is represented by a row. The abundance of each metabolite is represented by a different color. Yellow indicates high-abundant metabolites, whereas low-abundant metabolites are presented in black. The complete list of compounds and concentrations are provided in Supplementary File Table S2.
Forests 14 00770 g002
Figure 3. (A) PCA score plot of RNA-seq data in the leaf obtained from different C. paliurus ploidies, and each point in the PCA score plot represents an independent biological replicate; and (B) cis-regulatory element analysis of key genes involving flavonoid glycoside biosynthesis.
Forests 14 00770 g003
Figure 4. (A) GO terms enrichment results for DEGs of tetra- and diploids C. paliurus at the biological process level; and (B) GO terms enrichment results for DEGs of tetra- and diploid C. paliurus at the molecular function level.
Forests 14 00770 g004
Figure 5. RT-qPCR detection of candidate genes related to flavonoid biosynthesis in C. paliurus. RT-qPCR shows the relative gene expression in September, obtained via RT-qPCR. The RNA-seq shows gene read counts obtained from the transcriptome data.
Forests 14 00770 g005
Figure 6. (A) The dendrogram shows modules identified by WGCNA and clustering dendrogram of expressed genes; and (B) heatmap of correlation coefficients for flavonoids content and module eigengenes. The blocks in red and blue represent positive and negative correlations, respectively. ** and *** indicate significant differences at p < 0.05 and p < 0.01, respectively.
Forests 14 00770 g006
Figure 7. Pathway view heatmap of metabolites and gene expressions in different C. paliurus ploidies. Each sample is represented by a column, and each metabolite/gene is represented by a row. The abundance of each metabolite/gene expression profile is represented by a different color. Red and yellow indicate highly abundant metabolites and high gene expression levels, whereas low-abundant metabolites are presented in blue and low gene expression levels are presented in black, with marked treatments with statistical differences represented by red rectangles.
Forests 14 00770 g007
Table 1. List of member genes in the WGCNA module; “brown” and “pink” are highly associated with glucuronide content.
ModuleGene IDGene NameKMEGene Significance (GS)
Glucuronidesp
BrownCpaM1st09750 *bHLH122-10.63380.61640.0328
BrownCpaM1st14736bHLH122-20.61140.54320.0680
BrownCpaM1st30271bHLH720.90940.51880.0839
BrownCpaM1st33475bHLH1210.82370.56380.0562
BrownCpaM1st39770bHLH1050.62080.53580.0726
BrownCpaM1st43854 *bHLH1070.61260.68750.0135
BrownCpaM1st44522 *bHLH420.86500.60170.0385
BrownCpaM1st08920 *MYB39-10.87790.60440.0374
BrownCpaM1st08932 *MYB39-20.80250.70020.0112
BrownCpaM1st43861 *MYB39-30.87560.67570.0159
BrownCpaM1st04091 *UGT850.69570.79300.0021
BrownCpaM1st11173UGT870.73220.54720.0655
BrownCpaM1st33727UGT71-10.84090.49610.1009
PinkCpaM1st47487 *bHLH510.80400.80400.0061
PinkCpaM1st22888bHLH150.72330.72330.1003
PinkCpaM1st23532UGT71-20.84870.84870.0525
PinkCpaM1st23533 *UGT71-30.78770.78770.0397
* Indicates selected hub genes.
Table 2. Edge information for brown and pink modules’ positive regulatory networks.
ModulePairCorrelation Coefficientp-Value
Structure GenesTFs
BrownCpaM1st04091CpaM1st089200.720.01
BrownCpaM1st04091CpaM1st089320.830
BrownCpaM1st04091CpaM1st334750.570.05
BrownCpaM1st04091CpaM1st438540.690.01
BrownCpaM1st04091CpaM1st438610.710.01
BrownCpaM1st04091CpaM1st445220.690.01
BrownCpaM1st11173CpaM1st089200.70.01
BrownCpaM1st11173CpaM1st089320.620.03
BrownCpaM1st11173CpaM1st097500.620.03
BrownCpaM1st11173CpaM1st302710.620.03
BrownCpaM1st11173CpaM1st334750.620.03
BrownCpaM1st11173CpaM1st438540.850
BrownCpaM1st11173CpaM1st438610.610.04
BrownCpaM1st11173CpaM1st445220.730.01
BrownCpaM1st33727CpaM1st089200.770
BrownCpaM1st33727CpaM1st089320.760
BrownCpaM1st33727CpaM1st097500.970
BrownCpaM1st33727CpaM1st147360.710.01
BrownCpaM1st33727CpaM1st302710.830
BrownCpaM1st33727CpaM1st334750.770
BrownCpaM1st33727CpaM1st397700.610.04
BrownCpaM1st33727CpaM1st438610.750.01
BrownCpaM1st33727CpaM1st445220.620.03
PinkCpaM1st23532CpaM1st228880.610.03
PinkCpaM1st23532CpaM1st474870.700.01
PinkCpaM1st23533CpaM1st228880.670.02
PinkCpaM1st23533CpaM1st474870.660.02
Table 3. Primers used for the quantification of screened genes’ expression levels by qRT-PCR.
Gene IDGene NamesPrimer Sequence (5′—3′)
PAL1-FCpaM1st04281PAL1TGCGTAAACACCGACCCTT
PAL1-R PAL1CTCCGACAGCTCCACCTTC
C4H-FCpaM1st16078C4HACCTCGTGGTGGTGTCGTC
C4H-R C4HTTCCCAACCGAATCTGTGC
4CL2-FCpaM1st064274CL2ACAGAGCAGCGGGGAGAAC
4CL2-R 4CL2ATGCCGAGCCTGTTGAGAC
4CL3-FCpaM1st315644CL3AGTGATAACGACTGCTAACCCAT
4CL3-R 4CL3GAAATGCAACAAGCCCTCC
CHS2-FCpaM1st24780CHS2ATCTCCCAAACTGATTTTCCTG
CHS2-R CHS2GCAACTCGACCACCGCTAT
F3′H-FCpaM1st30230F3′HTCGCTGTCTTCCTCTTTTACC
F3′H-R F3′HCAAGAACTGGGAGGCTACG
Disclaimer/Publisher’s Note: The statements, opinions and data contained in all publications are solely those of the individual author(s) and contributor(s) and not of MDPI and/or the editor(s). MDPI and/or the editor(s) disclaim responsibility for any injury to people or property resulting from any ideas, methods, instructions or products referred to in the content.

