Abstract
The spatial pattern of coarse woody debris (CWD) within the surrounding forest changes continuously during the expansion of Moso bamboo (Phyllostachys edulis), which partly reflects the death process of trees within the community. In this paper, we sampled an area of 0.72 hm2 within the transition zone of Moso bamboo expansion, which included continuous secondary coniferous and broad-leaved mixed forest (SF), transitional forest (TF), and Moso bamboo forest (MF) in Wuxie National Forest Park, Zhejiang Province. The spatial pattern and spatial correlation of CWD with different diameter classes, different decay classes, and different types in the three forests were analyzed using Ripley’s L function. The results showed that, with the expansion of Moso bamboo, the volume of CWD in TF was higher than those in SF and MF, and the total density of CWD in the three forests varied, with a decreasing order of MF > TF > SF. The spatial pattern of CWD in the three forests was aggregated on a relatively small scale, but the pattern changed from aggregated to random distribution with the increase in scale. Moreover, the CWD of Moso bamboo in TF showed aggregated distribution, and the aggregation intensity increased with the increase in scale. With the expansion of Moso bamboo, the spatial pattern and spatial correlation of CWD with different diameter classes, decay classes, and types have changed significantly in the three forests. Our study suggests that the expansion of Moso bamboo is increasingly strengthening the intraspecific and interspecific competition and accelerating the death of neighboring trees.
1. Introduction
The death of trees is an important process within a forest ecosystem [1] and plays an important role in forest succession [2]. Understanding and predicting the process of tree death is an important topic in ecological research [3,4]. Coarse woody debris (CWD) refers to fallen dead trees, dead standing trees (snags), and other large woody debris in forest ecosystems. CWD is an important part of forest ecosystems as it is of great significance to the carbon balance, nutrient cycling, soil and water conservation, forest regeneration, and the habitats of other organisms within the forest [2,5,6,7,8]. CWD is added to the forest ecosystem through numerous mechanisms, including competition, self-thinning, disease, pests, natural disturbances (e.g., wind, wildfire, snow, etc.) human disturbance, etc. [4,7]. For a forest ecosystem without human disturbance, the physiological death of trees is a relatively uniform and slow process. However, the process is accelerated when plants (e.g., bamboo) expand into or invade the surrounding forests [9,10].
Moso bamboo is native to subtropical regions of China, and was introduced to Japan and South America, among other countries and regions [10,11]. Moso bamboo is a typical clonal plant, which usually colonizes adjacent habitats through bamboo rhizomes [12]. Moso bamboo grows so rapidly that it can complete a high growth process within 2–3 months after shooting and occupy the canopy layer to achieve rapid expansion [13,14]. Many studies have found that Moso bamboo is expanding into neighboring communities, causing a series of ecological and environmental problems. This phenomenon is particularly prominent in nature reserves where cutting is prohibited [15,16,17]. During the expansion of Moso bamboo to the surrounding forest, many native trees in the forest die. The death of trees directly affects the quantitative characteristics of the population and changes the spatial position of the species [18]. The spatial distribution pattern within a forest is one of the important characteristics of the forest community, which can reflect ecological processes, such as community succession, interspecific and intraspecific competition, and the effects of spatial heterogeneity on forest communities [19,20,21]. Traditional spatial pattern analysis is limited by population density and spatial scale [22,23,24]. However, the point pattern method is not affected by population density and can show all scales of a spatial pattern. Thus, it has been widely used in recent years [25,26,27]. The structure and spatial distribution patterns were usually studied using standing trees in previous studies in order to indirectly determine their regeneration and succession [28]. However, dead trees, which can be directly studied to reveal the process of population development and can directly determine regeneration and succession, were often ignored in these studies, which may result in errors caused by indirect inference [29]. Their inclusion may be important in revealing the process of population expansion.
In recent years, the impact of bamboo expansion on the structure and composition of forest communities has attracted more and more attention [10,13,14,30,31], but only a few articles have addressed the impact of bamboo expansion on the spatial distribution pattern of invaded populations [32,33], and the impact of bamboo expansion on the spatial pattern of CWD in the forest is still unknown. Subtropical coniferous and broad-leaved mixed forest is a unique vertical zone forest type in the humid subtropical mountains of China. The forest ecosystem is characterized by high gross productivity, rich biodiversity, and complexity. The ecosystem has played a very important role in maintaining ecological security in the region. At present, the expansion of Moso bamboo into mixed coniferous and broad-leaved forests has become increasingly problematic in the subtropical region [34]. During the expansion of Moso bamboo into the surrounding forests, the distribution patterns of CWD within the forests are constantly changing, which will inevitably have an important impact on the stability and development of the forest ecosystem. However, few studies on this topic have been conducted. Will the expansion of Moso bamboo increase the intraspecies and interspecies competition and accelerate the death of neighboring trees? What changes will occur in the spatial distribution pattern of CWD with different characteristics, and what will be the correlation between their changes? Aiming at these research questions, we set up a 0.72 hm2 permanent plot in the transition zone in the Moso bamboo to coniferous and broad-leaved mixed forest expansion in Wuxie National Forest Park in order to study the spatial distribution pattern of CWD and its correlation with different diameter sizes, different decay classes, and different forms. The goals of this research were as follows: clarify the dynamic changes in dead wood during the expansion of Moso bamboo and provide a theoretical basis for the rational regulation of Moso bamboo forest expansion and operational management of CWD within the forest.
2. Materials and Methods
2.1. Study Site
The study was conducted in Wuxie National Forest Park, Zhuji City, Zhejiang Province, China (29°43′ N, 120°03′ E). The area is within the northeast extension branch of the Longmen Mountains, which has the characteristics of a subtropical humid monsoon climate. The region has four distinct seasons, with an annual average temperature of 16.3 °C and an average annual rainfall of 1573 mm. The soil type can be described as hilly red soil with good soil fertility. The study site is in Tieyaping of Wuxie, a flat area of land between mountains, with a total area of about 4 hm2 and an average altitude of 530 m. The existing forest types within this site are mainly secondary coniferous and broad-leaved mixed forest and Moso bamboo forest. The dominant species in this forest are Pinus massoniana, Liquidambar formosana, Schima superba, etc. Due to its strong whip-expanding ability, Moso bamboo has invaded the coniferous and broad-leaved mixed forest to form a transition forest. There are no obvious pests, diseases, wind damage, or human interference within the forests included in the study area.
2.2. Sampling Design
In April 2022, we established a 120 × 60 m sample plot containing the secondary coniferous and broad-leaved mixed forest (SF), the transition zone forest (TF), and the Moso bamboo forest (MF). SF represented the forest before Moso bamboo invasion. The average diameter at breast height (DBH) was 22.9 cm, and the stand density was 358 trees per hectare. TF represented the forest that was moderately invaded by Moso bamboo, with a ratio of bamboo to wood in this forest of about 4:1. The average DBH was 13.4 cm, and the stand density was 1779 trees per hectare. MF represented the forest that was heavily invaded by Moso bamboo, where the bamboos were the dominant species. The average DBH was 12.7 cm, and the stand density was 2592 trees per hectare. The length of the sample plot of 120 m was determined by the length of the TF. Then, the sample plot was divided into 72 small quadrats (10 m × 10 m). There were 24 small quadrats in each forest. Each CWD with a large end diameter ≥10 cm in the sample plot was numbered, and then identified by species and type of CWD (e.g., fallen tree, snag, and stump) (Table 1). The length (height) and diameter of the large and small end of the CWD were recorded. In addition, the coordinates of the CWD in the 10 × 10 m small quadrats were recorded. For each fallen tree, a decay class was assigned based on the decay condition. In this study, we used the five-decay class classification system of CWD. The detailed classification of the system was adapted from [35]. We used the large end diameter of CWD as the standard to divide CWD into three diameter classes: diameter class I, 10 ≤ D < 20 cm (small tree), diameter class II, 20 ≤ D < 30 cm (medium-sized tree), and diameter class III, D ≥ 30 cm (large tree).

Table 1.
Classification of CWD type.
2.3. Statistical Analysis
The CWD volume of Moso bamboo was calculated as a function of the diameter at breast height (D) and slubby length at breast height (L): [36]. Other volumes of fallen tree and stump were calculated as a function of the length (L) and diameter of the large and small ends (d1, d2): ) [37]. Then, the snag volume of the other trees was estimated according to the Chinese standing volume table [38].
The spatial pattern analysis of CWD was conducted on the basis of Ripley’s K function [39]. Ripley’s K function analyzes plant numbers in the circle with a certain point as the center and a certain length r as the radius in the study area: , where K(r) is Ripley’s K function, r is the scale, A is the area of the quadrat, n is the number of individuals, uij is the distance between two points i and j, Ir (uij) is the indicator function, (when uij ≤ r, Ir (uij) = 1, when uij > r, Ir (uij) = 0), and wij is the weight value used for edge correction. Converting K(r) to L(r) can more intuitively reflect the calculation results on the graph. The calculation formula of Ripley’s L function is as follows: [40]. Monte Carlo simulations were used to calculate the upper and lower envelope traces of Ripley’s L function, denoting the confidence interval. Assuming that the population was randomly distributed, a random model was used to fit the coordinate values of a group of points, and L(r) was calculated for each r value. Similarly, the random model was used to fit a new group of point coordinate values, and the L(r) on different r scales was calculated. A total of 99 randomizations were generated that provided a 95% confidence envelop [41]. When L(r) is greater than the upper envelope trace, it is an aggregated distribution, when L(r) is between the upper and lower envelope traces, it is a random distribution, and when L(r) is less than the lower envelope trace, it is a uniform distribution.
The bivariate paired correlation function L12(r) was used to analyze the spatial correlation of CWDtree species, diameter classes, decay classes, and types of CWD. The basic formula is as follows: [42]. After square root conversion, we get . We adopted a 95% confidence envelop from the Monte Carlo random simulation. When the L12(r) value falls within the envelope trace, it indicates that the distributions are independent of each other and have no spatial correlation. When the L12(r) value falls above the upper envelope trace, the two are spatially positively correlated. When the L12(r) value falls below the lower envelope trace, the two are spatially negatively correlated. All analyses were completed using the spatstat package in R 4.1.3 [40].
3. Results
3.1. Basic Characteristics of CWD
The spatial pattern of CWD in three forests was directly shown in 72 small quadrats (Figure 1). The volume of CWD in SF was 26.09 m3/hm2 and the volume distribution in 24 small quadrats was relatively uniform (Figure 2). The density of CWD in SF was 204.2 pieces/hm2, and most of the CWD constituted fallen trees (Figure 3), while the diameter class structure showed an inverted J-shaped distribution. Moreover, the decay class showed a negative skew distribution in SF. The volume of CWD in TF was 44.78 m3/hm2, and the volume distribution in 24 small quadrats showed aggregation characteristics. The density of CWD in TF was 562.5 pieces/hm2, including 237.5 pieces/hm2 of Moso bamboo and 325 pieces/hm2 of other trees; the proportion of snag and stump in CWD increased, while the diameter class structure showed an obvious inverted J-shaped and uneven distribution. Moreover, the decay class showed a normal distribution in TF. The volume of CWD in MF was 28.93 m3/hm2, and the volume distribution was relatively uniform. The density of CWD in MF was 670.8 pieces/hm2, including 600 pieces/hm2 of Moso bamboo and 70.8 pieces/hm2 of other trees, while most of the CWD constituted small fallen trees. Moreover, the decay class showed a negative skew distribution in MF.
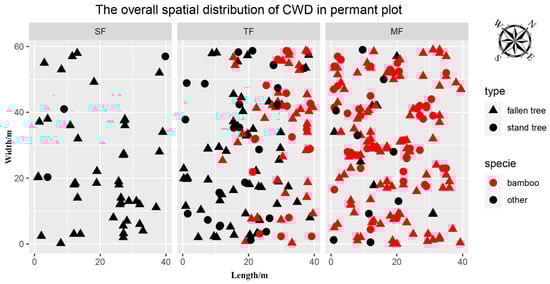
Figure 1.
The overall spatial distribution of coarse woody debris. Triangles represent fallen trees, dots represent standing trees (snag and stump), red colors represent Moso bamboo, and black colors represent other trees.
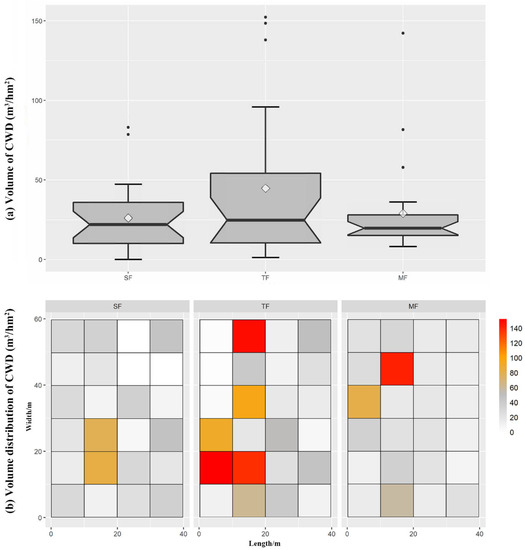
Figure 2.
Volume of coarse woody debris in three forests (a) and volume distribution of 24 small quadrats (10 m × 10 m) in each forest (b).
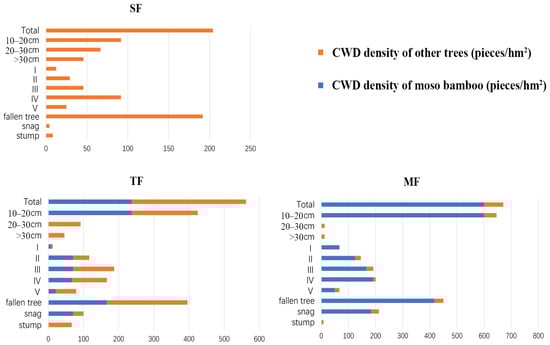
Figure 3.
Basic statistical characteristics for coarse woody debris in three forests (SF, TF, and MF). The horizontal coordinate is the density distribution of CWD (pieces/hm2). The vertical ordinate is data type which represent the total, the diameter class (10 ≤ D < 20 cm, 20 ≤ D < 30 cm, D ≥ 30 cm), decay class (I–V), and the existing type (fallen tree, snag, and stump) of CWD, respectively.
3.2. Spatial Pattern of CWD in Three Forests
CWD in SF showed an aggregated distribution on the scale of 0–3 m. However, the aggregated distribution became a random distribution with the increase in scale (Figure 4a). CWD in TF showed an aggregated distribution on the scale of 0–6 m, and the aggregated distribution became a random distribution with the increase in scale (Figure 4b). Among them, the CWD of Moso bamboo showed a random distribution on the scale of 0–1 m. However, the random distribution became an aggregated distribution with the increase in scale (Figure 4d). CWD in MF showed an aggregated distribution on the scale of 1–5 m, and the aggregated distribution became a random distribution with the increase in scale (Figure 4c). Among them, the CWD of the Moso bamboo spatial pattern was similar to the overall distribution of CWD in MF (Figure 4e). The results confirmed that CWD in different forest types showed aggregation characteristics on some scales. With the increase in scale, the aggregated distribution basically became a random distribution. However, the CWD of Moso bamboo in TF basically showed an aggregated distribution.
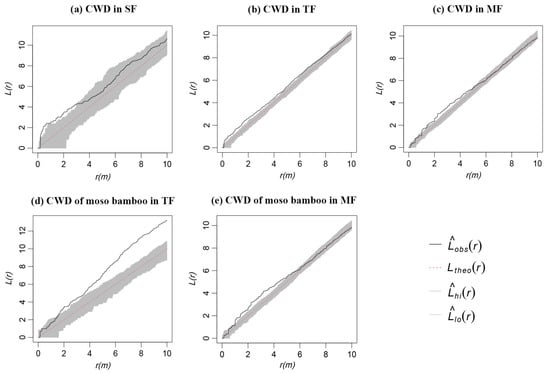
Figure 4.
Overall spatial point pattern of CWD in three forests. The black solid line represents the observed pattern, the red dotted lines is the theoretical value, and the gray shadow is the upper and lower 95% confidence intervals, the same below.
The small diameter CWD in SF and TF showed aggregation characteristics at all scales (Figure 5a,d), while the CWD of medium diameter and large diameter mainly showed a random distribution (Figure 5b,c,e,f). The small diameter CWD in MF showed an aggregated distribution on the scale of 1–5 m, and the aggregated distribution became a random distribution with the increase in scale (Figure 5g). Due to the very low number of medium diameter and large diameter CWD, no separate analysis for these trees could be conducted.
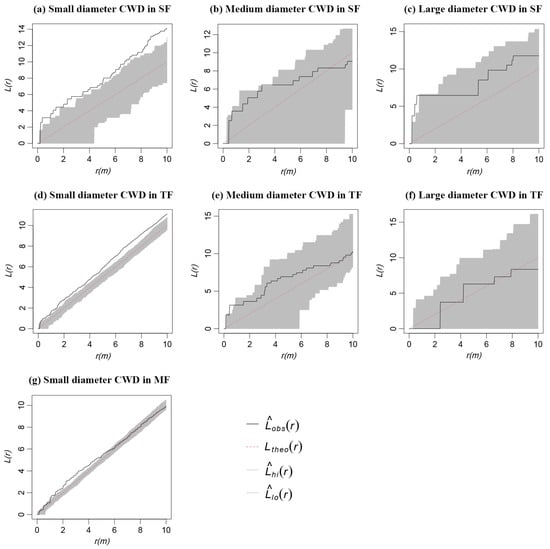
Figure 5.
Spatial distribution pattern of CWD with different diameter classes in three forests.
CWD in SF mainly showed random characteristics regardless of decay classes (Figure 6a,d). The CWD of decay classes I–III in TF showed a random distribution at all scales (Figure 6b), while that of the decay classes IV–V mainly showed an aggregated distribution (Figure 6e). Among them, decay classes IV–V of Moso bamboo showed a random distribution on the scale of 0–2 m; however, the random distribution became an aggregated distribution and increased with the increase in scale (Figure 6g). Decay classes IV–V of other trees mainly showed an aggregated distribution on the scale of 0–6 m, and the aggregated distribution became a random distribution with the increase in scale (Figure 6h). The CWD of decay classes I–III in MF mainly showed an aggregated distribution (Figure 6c), where decay classes IV–V showed a random distribution at any scales (Figure 6f).
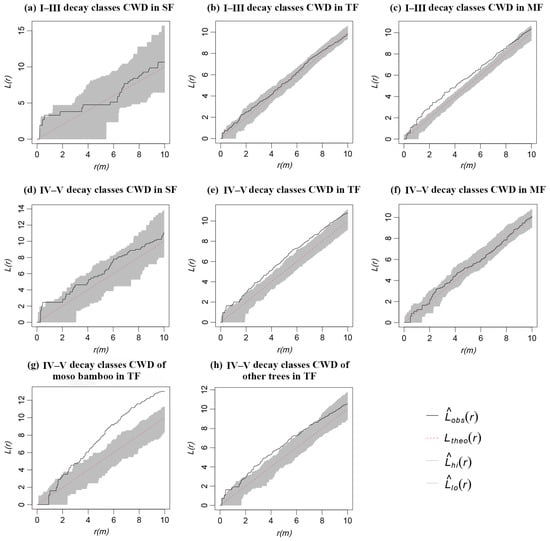
Figure 6.
Spatial distribution pattern of CWD with different decay classes in three forests.
The main type of CWD in SF was fallen trees; thus, the spatial pattern was similar to the overall distribution of CWD in SF (Figure 7a). Snags and stumps in TF mainly showed random characteristics (Figure 7b). Fallen trees in TF showed an aggregated distribution on the scale of 0–3 m, however, the aggregated distribution became a random distribution with the increase in scale (Figure 7c). Among them, the fallen trees of Moso bamboo showed a random distribution on the scale of 0–2 m; however, the random distribution became an aggregated distribution with the increase in scale (Figure 7f). Fallen trees of other trees showed an aggregated distribution on the scale of 0–2 m, and the aggregated distribution became a random distribution with the increase in scale (Figure 7g). Snags and stumps in MF mainly showed an aggregated distribution on the scale of 3–7 m (Figure 7d), and fallen trees in MF showed an aggregated distribution on the scale of 1–4 m; however, the aggregated distributions became random with the increase in scale (Figure 7e).
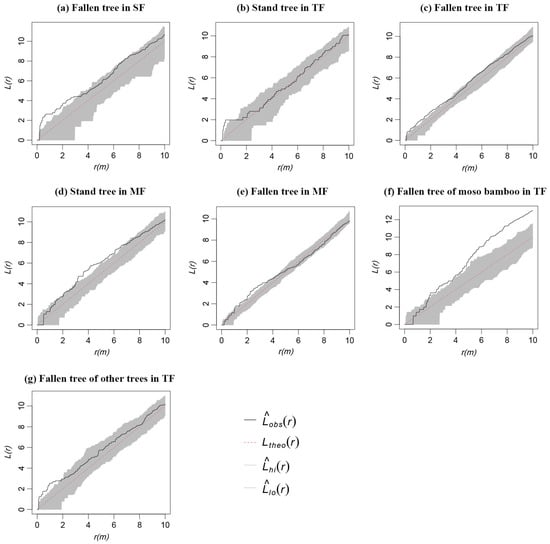
Figure 7.
Spatial distribution pattern of CWD with different types in three forests.
3.3. Spatial Association of CWD in Three Forests
The Moso bamboo and other trees in TF were independent within the scale of 0–7 m. However, a negative spatial correlation existed when the scale was greater than 7 m (Figure 8g). The Moso bamboo and other trees in MF were independent of any spatial scales (Figure 8h).
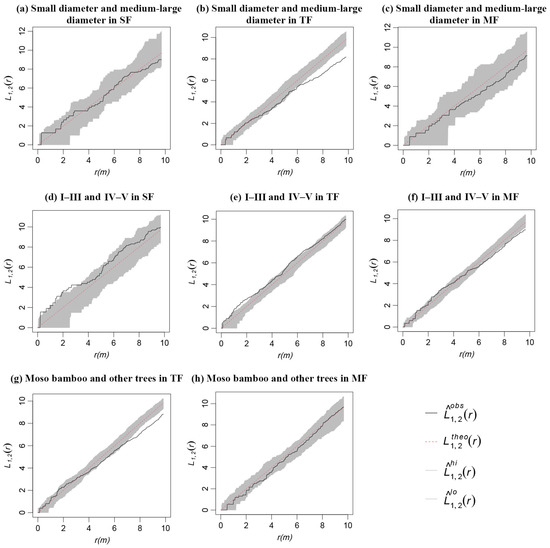
Figure 8.
Spatial association of CWD in three forests.
The CWD with different diameter classes in SF and MF had no spatial association (Figure 8a,c). The CWD of small diameter and medium–large diameter in TF were independent within the scale of 0–6 m, and there was a negative spatial correlation when the scale was greater than 6 m (Figure 8b).
The CWD of decay classes I–III and IV–V in SF and TF approached or reached a positive association on the scale of 0–3 m, and there was no spatial association when the scale was greater than 3 m (Figure 8d,e). The CWD of decay classes I–III and IV–V in MF were independent within the scale of 0–7 m, and a negative association existed when the scale was greater than 7 m (Figure 8f).
There was no obvious spatial association of CWD with different types in the three forests.
4. Discussion
4.1. Spatial Distribution Pattern of CWD
Since the change in terrain of a forest site is very small across three adjacent forests, the successional stage of the forest, the forest’s history, and exogenic disturbances are the primary factors explaining the variation in CWD [43]. The higher volume of CWD in TF than SF and MF may have been due to the expansion of Moso bamboo, which accelerates the death of native trees in SF (Figure 2). Similarly, the density of CWD in the forest and the proportion of snags density to the total density of CWD increased after the continuous expansion of Moso bamboo (Figure 3). The increase in CWD density in TF and MF may have been due to the rising intraspecific and interspecific competition. Moreover, these forests have many young bamboos with immature rhizomes, whereby the root system is shallow in the soil and the forests are more susceptible to wind damage. In addition, the proportion of snag density of CWD was higher in TF and MF than SF (Figure 3). Our results are consistent with the findings of a previous study [44]. The increase in proportion of snags suggests that the expansion of Moso bamboo led to the rising intraspecific and interspecific competition.
Among the three forests, the overall spatial pattern analysis of CWD showed aggregation characteristics on a relatively small scale; however, the aggregated distribution became a random distribution with the increase in scale (Figure 4a–c). On a small scale, factors such as intraspecific and interspecific competition play a leading role. On a large scale, environmental factors such as terrain, soil, water, and light have a great impact on the distribution of CWD [45,46]. Our results are consistent with the findings on the distribution patterns of CWD in the Dongling Mountains of Beijing, China. Ma et al. [26] indicated that CWD tended to be aggregated on a small scale and be more randomly distributed on a large scale. However, the CWD of Moso bamboo in TF mainly showed aggregation distribution regardless of scale, and the aggregation intensity increased with the increase in scale (Figure 4d). This may have been due to the fact that the demand of Moso bamboo for environmental resources has intensified with its increase. The aggregation degree of Moso bamboo in MF decreased (Figure 4e). The reduction in aggregation intensity was conducive to obtaining sufficient environmental resources. After intraspecific and interspecific competition and environmental screening, many Moso bamboos and the original trees in the forest die. The competition between Moso bamboo and the original trees eases and reaches a mature and stable stage. At this time, the distribution pattern of Moso bamboo is mainly determined by the death of individuals [47]. This change in aggregation intensity may be a strategy or adaptation mechanism of Moso bamboo expansion. Of course, the spatial pattern of CWD in MF does not fully reflect the competitive relationship during the entire life history of Moso bamboo because the competitive intraspecies relationship varies over the lives of the individual trees [48,49]. Several studies have shown that with forest succession, the increase in the number and size of individual trees in the community may lead to more intense competition for limited space and resources in the community [50,51]. Hence, after the successful expansion of Moso bamboo, multiple life stage analyses should be conducted to evaluate the intraspecific competition relationship of Moso bamboo.
The CWD with a small diameter in SF and TF showed aggregation characteristics; however, the aggregated distribution became a random distribution with the increase in diameter class (Figure 5a,d). This result is consistent with the findings of Lu et al. [52]. They reported that small diameter dead trees in the Badagong Mountains of Hunan Province of China tended to be aggregated, while larger diameter dead trees were more randomly distributed. This distribution pattern may be explained by the clustered pattern of tree regeneration [53], with the young trees growing with age, intraspecies and interspecies competition increasing, and individuals’ requirements for environmental resources intensifying. In the end, many young trees die, and a few trees grow into medium and large trees. Their relationship gradually eases and reaches a mature and stable state. In MF, the spatial pattern of small diameter CWD was similar to the overall distribution trend which may be related to the small number of medium and large diameter CWDs (Figure 5g). After bamboo becomes the dominant species in the invaded ecosystem, it continues to hinder tree regeneration and inhibit community replacement through various competitive ways [13,54,55]. In addition, Moso bamboo is a monocotyledonous plant without a vascular cambium; hence, the diameter of bamboo does not increase with age unlike other woody plants. Therefore, most CWDs in MF had a small diameter, and their spatial distribution pattern could not be explained by the agglomeration mode of tree regeneration.
In this study, the spatial distribution of CWD with different decay classes varied with different forests. In SF, the CWD of each decay class was distributed randomly as a whole (Figure 6a,d). For a stable community without human disturbance, the formation of CWD is likely the result of natural thinning of forests, abnormal weather, and physiological death [26]. Self-thinning and physiological death are stable and long processes, and the resulting CWD distribution pattern is closely related to living trees. Only abnormal weather likely results in large CWDs in a short time [56]. The CWD of decay classes IV–V in TF (Figure 6e,g,h) and the CWD of decay classes I–III in MF (Figure 6c) mainly showed an aggregated distribution. The fallen bamboos in TF showed strong aggregation distribution (Figure 7f). These results suggest trees in TF and MF were more susceptible to forming fallen trees, especially in TF which had more young expanded bamboos, with immature root growth and development, shallow distribution, and poor anchorage ability. Meanwhile, this is also a result of more severe intraspecific and interspecific competition in the forest due to the expansion of Moso bamboo. Moso bamboo expansion may have a negative effect; therefore, measures such as digging shoots and cutting bamboo could control its expansion in protected areas to favor the conservation of the surrounding forests.
4.2. Spatial Association of CWD
Spatial correlation analysis is used to describe the spatial relationship of the population. The positive and negative correlation characteristics may be the result of the interaction between species, or it may be a result of species’ habitat convergence or divergence [57,58,59]. The significantly negative correlation between the CWD of Moso bamboo and other trees in TF under the > 7 m scale (Figure 8g) suggests that Moso bamboo and other trees compete strongly [23,60]. However, the lack of a significant correlation between Moso bamboo and other trees in MF (Figure 8h) indicates no obvious competition between Moso bamboo and other trees. Moso bamboo did not compete with other trees in MF, but there was strong competition in TF. The reason may be that TF represents the transitional period of Moso bamboo expansion. By this time, Moso bamboo is competing for the canopy layer with other living trees, and the weak trees naturally die due to a lack of sunlight. MF is the late stage of succession, during which Moso bamboo has an absolute advantage, as most of the other species have died, and the competition between species in the forest has weakened.
The significantly positive correlation among CWDs of different decay classes in SF and TF under a small scale (0–3 m) (Figure 8d,e) suggests that CWD originating from early death had a certain impact on the density and pattern distribution of late death trees, likely related to the spatial distribution pattern of living trees [61,62]. The death of trees provides better nutrients and space for the growth of trees. The density of new trees around them increases, the competition for resources is severe, and the death rate increase. As the scale increases, the competition of trees for resources weakens, and the influence of the early dead individuals on later dead individuals decreases. However, at a small scale, there was no significant correlation among CWDs of different decay classes in MF (Figure 8f). This suggests that the early dead individuals had less of an impact on the later dead individuals, which may have been due to the higher density of MF and the original trees leaving less space for other trees after death. The specific reasons need to be further analyzed, along with the spatial distribution of living trees. In addition, in the area where the expansion of Moso bamboo has been completed, its strong vitality makes it difficult to completely eradicate it. At this time, we should pay more attention to the study of ecological influence. Therefore, it is necessary to conduct quantitative research on the advantages and disadvantages of CWD cleaning or retention to promote the healthy growth and regeneration of forests.
5. Conclusions
The expansion of Moso bamboo increases intraspecific and interspecific competition and accelerates the death of neighboring trees. The competition between Moso bamboo and other tree species is severe in the transition period, tending to ease at the later stage.
Moso bamboo expansion has seriously affected the death process of surrounding trees, thus changing the spatial distribution pattern and spatial association of CWD, which is likely to have a negative impact on the function of the forest ecosystem.
In order to maintain the stability and development of the natural forest ecosystem, more targeted measures such as shoot digging and bamboo cutting should be undertaken in protected areas to control the expansion of Moso bamboo in this region. More studies over a larger area and longer time span are needed to elucidate the effect of Moso bamboo expansion on the spatial pattern of CWD in surrounding forests.
Author Contributions
Conceptualization, X.C. and S.B.; methodology, X.C. and S.B.; software, X.C.; validation, X.C. and S.B.; formal analysis, X.C.; investigation, X.C.; resources, X.C.; data curation, X.C.; writing—original draft preparation, X.C.; writing—review and editing, X.C. and S.B.; visualization, X.C.; supervision, X.C. and S.B.; project administration, S.B.; funding acquisition, S.B. All authors have read and agreed to the published version of the manuscript.
Funding
This research was funded by the Talent Project of Jiyang College of Zhejiang A&F University (grant number: 05251700035) and National Natural Science Foundation of China (grant number: 32171786 and 31770680).
Data Availability Statement
The data presented in this study are available on request from the corresponding author.
Acknowledgments
The authors are thankful to Haochen Di, Ziqi Wang, and Yuxuan Hu for their help in field measurement.
Conflicts of Interest
The authors declare no conflict of interest.
References
- Bin, Y.; Lian, J.; Wang, Z.; Ye, W.; Cao, H. Tree mortality and recruitment in a subtropical broadleaved monsoon forest in South China. J. Trop. For. Sci. 2011, 23, 57–66. [Google Scholar]
- Romero, L.M.; Smith III, T.J.; Fourqurean, J.W. Changes in mass and nutrient content of wood during decomposition in a south Florida mangrove forest. J. Ecol. 2005, 93, 618–631. [Google Scholar] [CrossRef]
- Condit, R.; Hubbell, S.P.; Foster, R.B. Mortality rates of 205 neotropical tree and shrub species and the impact of a severe drought. Ecol. Monogr. 1995, 65, 419–439. [Google Scholar] [CrossRef]
- Franklin, J.; Shugart, H.; Harmon, M. Tree death as an ecological process: The causes, consequences, and variability of tree mortality. BioScience 1987, 37, 550–556. [Google Scholar] [CrossRef]
- Hilger, A.; Shaw, C.; Metsaranta, J.; Kurz, W. Estimation of snag carbon transfer rates by ecozone and lead species for forests in Canada. Ecol. Appl. 2012, 22, 2078–2090. [Google Scholar] [CrossRef]
- Jomura, M.; Kominami, Y.; Dannoura, M.; Kanazawa, Y. Spatial variation in respiration from coarse woody debris in a temperate secondary broad-leaved forest in Japan. For. Ecol. Manag. 2008, 255, 149–155. [Google Scholar] [CrossRef]
- Metcalf, C.J.E.; Horvitz, C.C.; Tuljapurkar, S.; Clark, D.A. A time to grow and a time to die: A new way to analyze the dynamics of size, light, age, and death of tropical trees. Ecology 2009, 90, 2766–2778. [Google Scholar] [CrossRef] [PubMed]
- Sturtevant, B.R.; Bissonette, J.A.; Long, J.N.; Roberts, D.W. Coarse woody debris as a function of age, stand structure, and disturbance in boreal Newfoundland. Ecol. Appl. 1997, 7, 702–712. [Google Scholar] [CrossRef]
- Garrott, R.A.; White, P.; White, C.A.V. Overabundance: An issue for conservation biologists? Conserv. Biol. 1993, 7, 946–949. [Google Scholar] [CrossRef]
- Lima, R.A.; Rother, D.C.; Muler, A.E.; Lepsch, I.F.; Rodrigues, R.R. Bamboo overabundance alters forest structure and dynamics in the Atlantic Forest hotspot. Biol. Conserv. 2012, 147, 32–39. [Google Scholar] [CrossRef]
- Wang, X.; Sasaki, A.; Toda, M.; Nakatsubo, T. Changes in soil microbial community and activity in warm temperate forests invaded by moso bamboo (Phyllostachys pubescens). J. For. Res. 2016, 21, 235–243. [Google Scholar] [CrossRef]
- Shi, J.; Ye, X.; Chen, F.; Yang, Q.; Li, Z.; Fang, K.; Yang, G.Y. Adaptation of bamboo to heterogeneous habitat: Phenotypic plasticity. Acta Ecol. Sin. 2014, 34, 5687–5695. [Google Scholar]
- Griscom, B.W.; Ashton, P.M.S. Bamboo control of forest succession: Guadua sarcocarpa in Southeastern Peru. For. Ecol. Manag. 2003, 175, 445–454. [Google Scholar] [CrossRef]
- Okutomi, K.; Shinoda, S.; Fukuda, H. Causal analysis of the invasion of broad-leaved forest by bamboo in Japan. J. Veg. Sci. 1996, 7, 723–728. [Google Scholar] [CrossRef]
- Bai, S.; Conant, R.T.; Zhou, G.; Wang, Y.; Wang, N.; Li, Y.; Zhang, K. Effects of moso bamboo encroachment into native, broad-leaved forests on soil carbon and nitrogen pools. Sci. Rep. 2016, 6, 1–8. [Google Scholar] [CrossRef]
- Larpkern, P.; Moe, S.R.; Totland, Ø. Bamboo dominance reduces tree regeneration in a disturbed tropical forest. Oecologia 2011, 165, 161–168. [Google Scholar] [CrossRef]
- Zhang, C.; Xie, G.; Fan, S.; Zhen, L. Variation in vegetation structure and soil properties, and the relation between understory plants and environmental variables under different Phyllostachys pubescens forests in southeastern China. Environ. Manag. 2010, 45, 779–792. [Google Scholar] [CrossRef]
- Wang, B.; Huang, Y.; Li, X.; Xiang, W.; Ding, T.; Huang, F.; Lu, S.; Han, W.; Wen, S.; He, L. Species composition and spatial distribution of a 15 ha northern tropical karst seasonal rain forest dynamics study plot in Nonggang, Guangxi, southern China. Biodivers. Sci. 2014, 22, 141–156. [Google Scholar]
- Busing, R.; White, P. Effects of area on old-growth forest attributes: Implications for the equilibrium landscape concept. Landsc. Ecol. 1993, 8, 119–126. [Google Scholar] [CrossRef]
- Condit, R.; Ashton, P.S.; Baker, P.; Bunyavejchewin, S.; Gunatilleke, S.; Gunatilleke, N.; Hubbell, S.P.; Foster, R.B.; Itoh, A.; LaFrankie, J.V. Spatial patterns in the distribution of tropical tree species. Science 2000, 288, 1414–1418. [Google Scholar] [CrossRef]
- Duncan, R.P.; Stewart, G.H. The temporal and spatial analysis of tree age distributions. Can. J. For. Res. 1991, 21, 1703–1710. [Google Scholar] [CrossRef]
- Hadly, E.A.; Maurer, B.A. Spatial and temporal patterns of species diversity in montane mammal communities of western North America. Evol. Ecol. Res. 2001, 3, 449–463. [Google Scholar]
- Miyadokoro, T.; Nishimura, N.; Yamamoto, S. Population structure and spatial patterns of major trees in a subalpine old-growth coniferous forest, central Japan. For. Ecol. Manag. 2003, 182, 259–272. [Google Scholar] [CrossRef]
- Toft, C.A.; Fraizer, T. Spatial dispersion and density dependence in a perennial desert shrub (Chrysothamnus nauseosus: Asteraceae). Ecol. Monogr. 2003, 73, 605–624. [Google Scholar] [CrossRef]
- Gu, L.; Gong, Z.; Li, W. Spatial patterns and storage composition of woody debris in a natural secondary forest dominated by Pinus tabulaeformis on Loess Plateau, China. J. Mt. Sci. 2017, 14, 1839–1851. [Google Scholar] [CrossRef]
- Ma, F.; Zhuang, L.; Wang, S.; Sang, W. Coarse woody debris features of a warm temperate deciduous broad-leaved forest, northern China. J. For. Res. 2021, 32, 1105–1114. [Google Scholar] [CrossRef]
- Travaglini, D.; Paffetti, D.; Bianchi, L.; Bottacci, A.; Bottalico, F.; Giovannini, G.; Maltoni, A.; Nocentini, S.; Vettori, C.; Calamini, G. Characterization, structure and genetic dating of an old-growth beech-fir forest in the northern Apennines (Italy). Plant Biosyst. Int. J. Deal. All Asp. Plant Biol. 2012, 146, 175–188. [Google Scholar] [CrossRef]
- Li, M.; He, F.; Liu, Y.; Pan, C. Spatial distribution pattern of tree individuals in the Schrenk spruce forest, Northwest China. Acta Ecol. Sin. 2005, 25, 1000–1006. [Google Scholar]
- von Oheimb, G.; Westphal, C.; Härdtle, W. Diversity and spatio-temporal dynamics of dead wood in a temperate near-natural beech forest (Fagus sylvatica). Eur. J. For. Res. 2007, 126, 359–370. [Google Scholar] [CrossRef]
- Touyama, Y.; Yamamoto, T.; Nakagoshi, N. Myrmecofaunal change with bamboo invasion into broadleaf forests. J. For. Res. 1998, 3, 155–159. [Google Scholar] [CrossRef]
- Wang, Y.; Shi, X.; Peng, Y.; Zhong, Z.; Tao, J. Effects of fine-scale pattern of dwarf bamboo on understory species diversity in Abies faxoniana forest, southwest, China. Sains Malays. 2012, 41, 649–657. [Google Scholar]
- Huang, R.; Qi, D.; Tao, J.; Jiang, H.; Hao, Y.; He, Y. Effects of bamboo-invasion disturbance on the spatial distribution of Alsophila spinulosa population. J. Sichuan Norm. Univ. Nat. Sci. 2009, 32, 106–111. [Google Scholar]
- Zhang, H.; Xue, J. Spatial pattern and competitive relationships of moso bamboo in a native subtropical rainforest community. Forests 2018, 9, 774. [Google Scholar] [CrossRef]
- Bai, S.; Zhou, G.; Wang, Y.; Liang, Q.; Chen, J.; Cheng, Y.; Shen, R. Plant species diversity and dynamics in forests invaded by Moso bamboo (Phyllostachys edulis) in Tianmu Mountain Nature Reserve. Biodivers. Sci. 2013, 21, 288–295. [Google Scholar]
- Yan, E.; Wang, X.; Huang, J. Concept and classification of coarse woody debris in forest ecosystems. Acta Ecol. Sin. 2005, 25, 158–167. [Google Scholar] [CrossRef]
- Shen, Q.; Tang, M. Stem volume models of Phyllostachys edulis in Zhejiang Province. Sci. Silvae Sin. 2020, 56, 89–96. [Google Scholar]
- Fraver, S.; Ringvall, A.; Jonsson, B.G. Refining volume estimates of down woody debris. Can. J. For. Res. 2007, 37, 627–633. [Google Scholar] [CrossRef]
- Zeng, W. Validation of two-variable tree volume tables for main tree species in China. For. Resour. Manag. 2018, 5, 37–43. [Google Scholar]
- Ripley, B.D. Modelling spatial patterns. J. R. Stat. Soc. Ser. B Methodol. 1977, 39, 172–192. [Google Scholar] [CrossRef]
- Baddeley, A.; Rubak, E.; Turner, R. Spatial Point Patterns: Methodology and Applications with R; CRC Press: Boca Raton, FL, USA, 2015. [Google Scholar]
- Stoyan, D.; Stoyan, H. Fractals, Random Shapes and Point Fields: Methods of Geometrical Statistics; John Wiley & Sons Incorporated: Hoboken, NJ, USA, 1994; Volume 302. [Google Scholar]
- Lotwick, H.; Silverman, B. Methods for analysing spatial processes of several types of points. J. R. Stat. Soc. Ser. B Methodol. 1982, 44, 406–413. [Google Scholar] [CrossRef]
- Frelich, L.E.; Calcote, R.R.; Davis, M.B.; Pastor, J. Patch formation and maintenance in an old-growth hemlock-hardwood forest. Ecology 1993, 74, 513–527. [Google Scholar] [CrossRef]
- Qi, Y.; Zhang, G.; Xiong, Z.; Yang, T. Spatial point pattern analysis for coarse woody debris in karst mixed evergreen and deciduous broadleaved forest. Acta Ecol. Sin. 2019, 39, 4933–4943. [Google Scholar]
- Harms, K.E.; Wright, S.J.; Calderón, O.; Hernandez, A.; Herre, E.A. Pervasive density-dependent recruitment enhances seedling diversity in a tropical forest. Nature 2000, 404, 493–495. [Google Scholar] [CrossRef]
- Wiegand, T.; Moloney, K.A. Rings, circles, and null-models for point pattern analysis in ecology. Oikos 2004, 104, 209–229. [Google Scholar] [CrossRef]
- Boyden, S.; Binkley, D.; Shepperd, W. Spatial and temporal patterns in structure, regeneration, and mortality of an old-growth ponderosa pine forest in the Colorado Front Range. For. Ecol. Manag. 2005, 219, 43–55. [Google Scholar] [CrossRef]
- Zhang, H.; Chen, S.; Xia, X.; Ge, X.; Zhou, D.; Wang, Z. The competitive mechanism between post-abandonment Chinese fir plantations and rehabilitated natural secondary forest species under an in situ conservation policy. For. Ecol. Manag. 2021, 502, 119725. [Google Scholar] [CrossRef]
- Zhu, Y.; Comita, L.S.; Hubbell, S.P.; Ma, K. Conspecific and phylogenetic density-dependent survival differs across life stages in a tropical forest. J. Ecol. 2015, 103, 957–966. [Google Scholar] [CrossRef]
- Getzin, S.; Dean, C.; He, F.; Trofymow, J.A.; Wiegand, K.; Wiegand, T. Spatial patterns and competition of tree species in a Douglas-fir chronosequence on Vancouver Island. Ecography 2006, 29, 671–682. [Google Scholar] [CrossRef]
- Pommerening, A.; Särkkä, A. What mark variograms tell about spatial plant interactions. Ecol. Model. 2013, 251, 64–72. [Google Scholar] [CrossRef]
- Lu, Z.; Liu, F.; Wu, H.; Jiang, M. Species composition, size class, and spatial patterns of snags in the Badagongshan (BDGS) mixed evergreen and deciduous broad-leaved forest in central China. Biodivers. Sci. 2015, 23, 167. [Google Scholar] [CrossRef]
- Rouvinen, S.; Kouki, J. Spatiotemporal availability of dead wood in protected old-growth forests: A case study from boreal forests in eastern Finland. Scand. J. For. Res. 2002, 17, 317–329. [Google Scholar] [CrossRef]
- Griscom, B.W.; Ashton, P.M.S. A self-perpetuating bamboo disturbance cycle in a neotropical forest. J. Trop. Ecol. 2006, 22, 587–597. [Google Scholar] [CrossRef]
- Kudo, G.; Amagai, Y.; Hoshino, B.; Kaneko, M. Invasion of dwarf bamboo into alpine snow-meadows in northern Japan: Pattern of expansion and impact on species diversity. Ecol. Evol. 2011, 1, 85–96. [Google Scholar] [CrossRef]
- Ren, Y.; Luo, D.; Zhou, Y.; Fang, J.; Lu, J. Spatial distribution patterns of coarse woody debris in the Abies georgei var. smithii pristine forest in the Sejila Mountain. Acta Ecol. Sin. 2019, 39, 8048–8057. [Google Scholar]
- Chu, C.J.; Maestre, F.T.; Xiao, S.; Weiner, J.; Wang, Y.S.; Duan, Z.H.; Wang, G. Balance between facilitation and resource competition determines biomass–density relationships in plant populations. Ecol. Lett. 2008, 11, 1189–1197. [Google Scholar] [CrossRef]
- Lin, Y.; Berger, U.; Grimm, V.; Ji, Q.R. Differences between symmetric and asymmetric facilitation matter: Exploring the interplay between modes of positive and negative plant interactions. J. Ecol. 2012, 100, 1482–1491. [Google Scholar] [CrossRef]
- Waterman, J.M.; Roth, J.D. Interspecific associations of Cape ground squirrels with two mongoose species: Benefit or cost? Behav. Ecol. Sociobiol. 2007, 61, 1675–1683. [Google Scholar] [CrossRef]
- Manabe, T.; Nishimura, N.; Miura, M.; Yamamoto, S. Population structure and spatial patterns for trees in a temperate old-growth evergreen broad-leaved forest in Japan. Plant Ecol. 2000, 151, 181–197. [Google Scholar] [CrossRef]
- Pedlar, J.H.; Pearce, J.L.; Venier, L.A.; McKenney, D.W. Coarse woody debris in relation to disturbance and forest type in boreal Canada. For. Ecol. Manag. 2002, 158, 189–194. [Google Scholar] [CrossRef]
- Siitonen, J.; Martikainen, P.; Punttila, P.; Rauh, J. Coarse woody debris and stand characteristics in mature managed and old-growth boreal mesic forests in southern Finland. For. Ecol. Manag. 2000, 128, 211–225. [Google Scholar] [CrossRef]


Disclaimer/Publisher’s Note: The statements, opinions and data contained in all publications are solely those of the individual author(s) and contributor(s) and not of MDPI and/or the editor(s). MDPI and/or the editor(s) disclaim responsibility for any injury to people or property resulting from any ideas, methods, instructions or products referred to in the content. |
© 2023 by the authors. Licensee MDPI, Basel, Switzerland. This article is an open access article distributed under the terms and conditions of the Creative Commons Attribution (CC BY) license (https://creativecommons.org/licenses/by/4.0/).