Abstract
Rapid global urbanization has inevitably led to habitat fragmentation, and much research has focused on responding by building ecological networks and improving connectivity. The construction of such post-event ecological networks is sometimes not effective, and the identification and protection of important patches in the early urbanization period is more significant. Based on the redundancy theory, this paper explores the method of identifying potential critical habitat patches after future urban development. The paper takes the Longxing area of Chongqing city as an example and uses the cumulative current value results of circuit theory model simulations and patch characteristic attribute information as sample data, introduces a combination of the minimal-redundancy-maximal-relevance criterion and a support vector machine (mRMR + SVM) to discriminate the redundancy of patches in ecological networks, and ranks the importance of source patches. The results show that the mRMR criterion can exhibit a more realistic ranking of patch importance, allowing patches with better quality to achieve a higher ranking. Compared to the patch importance determined based on the magnitude of the cumulative current value, 66.34% of the patch importance order changed in the mRMR criterion ranking results. The mRMR + SVM method was effective in identifying individuals with redundancy from the set of source-site patches. The test found that ecological corridors still passed through or occurred near these redundant patches after their removal, demonstrating the substitutability of patches identified as redundant. The results of the study can help improve the knowledge of ecological networks and provide quantitative methodological support and decision-making reference for urban development and ecological conservation.
1. Introduction
Habitat fragmentation, as an important consequence of urbanization, is a serious threat to the health of urban ecosystems. As a result, habitat fragmentation has also received a great deal of attention from the community [1,2]. Connecting habitat patches through slow walking trails [3], protective hedges [4], and wildlife corridors [5] to build ecological networks is considered an important way to cope with urban habitat fragmentation [6,7,8]. However, most of the existing ecological network analyses are centered around areas within built-up urban areas that have already developed habitat fragmentation results. The results of such analyses help to identify important patches and corridors and give recommendations for their protection and optimization [3]. However, it is very difficult to add new green space patches or ecological corridors in built-up areas to optimize the overall structure of the ecological network. If important habitat patches worth preserving can be accurately identified in the planning stage before urban development, it will be of great significance to maximize the function of the ecological network after urban development. When urban construction faces the dilemma of conservation and development, which habitat patches need to be preserved? How can one avoid accidental loss of key habitat patches? Finding answers to these questions does not only signify how many native species can be preserved, but more importantly, they may determine the future state of the entire urban ecosystem.
The discrimination about the importance of habitat patches is mainly achieved by four methods: (1). Graph theory + a gravity modeling approach based on the abstract graphical structure of ecological networks [9]; (2). A Morphological Spatial Pattern Analysis (MSPA) approach based on the geometry of patches [10,11]; (3). An overlay analysis approach based on GIS procedures considering ecological and environmental quality of patches [12]; (4). A circuit theory modeling method that integrates animal migration and landscape resistance [13]. These methods constitute a relatively systematic pathway for habitat patch identification, responding to the need for ecological network construction based on actual observed data or abstract mathematical models, respectively. In fact, an ecological network is a complex system [14], in which habitat patches are equivalent to nodes and the contribution of each node to the overall network varies. When the role of patches in the ecological network can be replaced by other patches with similar or better conditions, these patches can be defined as redundant patches. These redundant patches can mitigate the impact of the urban development process on the ecological network, and their accurate identification can help to protect the effectiveness of the ecological network as a whole.
There are more studies on redundant corridors in ecological networks [15,16], but there are few studies on the identification of redundant patches. The minimal-redundancy-maximal-relevance criterion (mRMR) is a filtering algorithm logic that aims to find the subset of elements that have the maximum correlation with the desired object and the minimum redundancy with other similar elements [17]. The algorithm allows patches with less redundancy and greater relevance to be ranked as high as possible in the importance ranking, while patches with greater redundancy are ranked lower. The method makes it so that the important and redundant patches tend to be polarized in the ranking results, respectively, but further analysis is needed if each individual object is to be identified as redundant or not. A support vector machine (SVM) is a class of generalized linear classifier that performs binary classification of data in a supervised learning manner, learning from classified samples and forming a trained model for the classification and identification of objects to be evaluated [18]. It has been shown that the mRMR + SVM method can achieve the identification of redundancy and importance ranking of research objects through the comprehensive analysis of multiple characteristic attributes of research objects, and the method has been widely used in various fields such as biological detection [19], habitat protection [20], and power system maintenance [21]. Given the advantages of the mRMR + SVM method, its application to urban pre-development may provide important support for the identification and conservation of potential ecological network structures.
In this study, a new urban development area in Chongqing, the Longxing area, was selected as the study area, and the mRMR + SVM method was used to analyze the potential ecological network structures in it. The main research objectives of the paper include (1) exploring the identification method for redundant patches of ecological networks in urban development zones; (2) verifying the accuracy of the method against actual conditions; and (3) proposing policy management recommendations by combining the results of both redundancy and importance. The research results will provide support and reference for urban ecological network conservation decisions.
2. Materials and Methods
2.1. Overview of the Study Area
The study area, Longxing area (29°38′30′′–29°44′0′′ N, 106°43′30′′–106°53′0′′ E), is a new urban area set up during the rapid urbanization of the main city of Chongqing to the east, covering an area of 111.31 km2. The study area is located in the parallel ridge valley belt, sandwiched between Tongluo Mountain and Mingyue Mountain, and the Yulin River traverses the site from north to south (Figure 1). The study area is 36 km from the center of Chongqing city, with a resident population of about 100,000, a well-developed transport network, and excellent natural conditions. The planning objective of the area is to build a new highland for industry and a new urban–rural integration city by taking advantage of the mountains, rivers, and valleys and adhering to the urban–rural integration development concept of “half landscape, half city”. The Longxing area has basically completed the relocation of the indigenous people and is currently undergoing a rapid urbanization process. As shown in Figure 2, the urban green space rate in Longxing area has been decreasing year by year, and the percentage of built-up area has been increasing continuously, with an urban green space rate of about 56.97% as of 2021 (the year of remote sensing data used in this paper), which has not yet exceeded the policy standard of an urban green space rate of no less than 40% as stipulated in the Work Plan for Creating a National Ecological Garden City in Chongqing, and is in the preliminary stage of not-yet-complete urbanization. The landscape pattern before urbanization is characterized by woodland as the substrate, with irrigation and grassland, farmland, and settlements as the main patches scattered among them, and the Yulin River is the main corridor of the area. After the urbanization of Longxing area, the original woodland and farmland substrate will be replaced by hardened concrete substrate, and a large number of habitat-quality irrigated grassland and woodland will be divided, resulting in fragmentation or disappearance. The connection relationship between habitat patches is not optimistic. “The Chongqing Work Programme for the Creation of a National Ecological Garden City” is an important document guiding the planning and management of urban green space in Chongqing, with the aim of building Chongqing into a city where the total amount of green space, the quality of green space, and ecological security are significantly improved, and the layout of green space is more reasonable. It is clearly stated in the document that we should follow the inherent laws of ecosystems, focus on improving the ecosystem’s self-repair capacity and stability, scientifically build an ecological network system, and enhance the ecological functions of urban and rural green spaces. At the same time, the document also puts forward the demand for management programs, requiring management departments to scientifically formulate spatial management policies to protect the natural ecological environment of cities. Identifying the redundancy and importance of patches in the potential ecological network based on the current green space status of the region is crucial to conserve biodiversity and promote sustainable urban development.
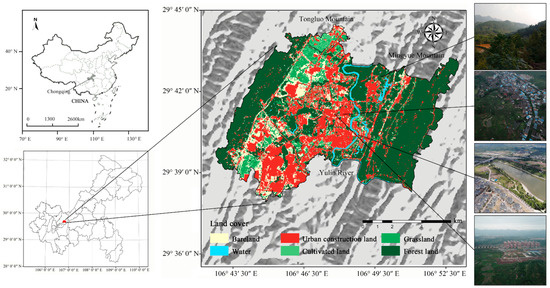
Figure 1.
Study area, land cover, and field images.
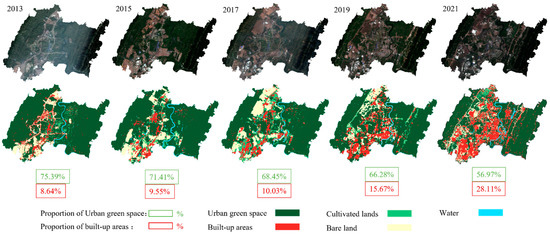
Figure 2.
Year-to-year change in green space ratio in the study area.
2.2. Research Methodology
To identify redundant patches in the ecological network and rank the importance of ecological source patches, this paper will carry out research along the following lines: (1). Obtaining the set of potential ecological source patches through MSPA analysis; (2). Constructing a comprehensive landscape resistance surface using land use data, elevation data, remote sensing image data, and road network data, and executing the mRMR algorithm, which requires multiple runs of the circuit theory model to obtain the cumulative current values of each patch under multiple scenarios; (3). Ranking the importance of patches and adding classification labels to each patch based on the codified mRMR algorithm; (4). Identifying redundant patches in the collection based on support vector machines, and finally forming the classification results for all patches. The technical route is shown in Figure 3.
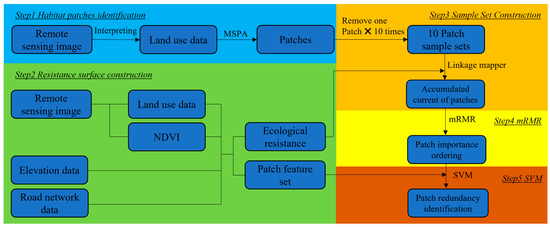
Figure 3.
Technical route.
2.2.1. Circuit Theory Simulation
Exploring the redundancy and importance of source patches requires the construction of ecological networks, and this study simulates the ecological network structure based on a circuit theoretical model, which first requires the determination of a vector map of source patches. Because the scale of plant communities is a key element in judging habitat quality [22], this study used the MSPA method [23] to consider woodlands and grasslands within the study area as foreground data that comprise ecological habitat and extract the core area in the results as the original set of potential ecological habitat patches.
In terms of constructing an integrated landscape resistance surface, the efficiency of species migration at the surface depends on the land cover type, environmental conditions, and anthropogenic disturbances of the surface raster [24,25,26]. However, a specific set of impedance values cannot characterize the dispersal efficiency of multiple species simultaneously because the effects of the same land cover type on the mobility of different species can vary greatly. Due to the difficulty of observing and investigating species-specific survival conditions in urban areas and the paucity of available data, plant community quality can be used as a proxy for habitat value [22]. For these reasons, this study used the ecological suitability of habitat patches as a measurement condition for constructing a comprehensive landscape resistance surface [3] and selected six influencing factors to construct a comprehensive landscape resistance surface, which was divided into three categories according to their different ways of influencing the ecological suitability of patches, representing the relative influence of different influencing factors on the ecological suitability of patches and also reflecting people’s resistance to species movement in patches estimates [27]. The first category is topography, which includes three influencing factors of elevation, slope, and topographic relief [28]; the second category is environmental conditions, which includes two influencing factors of land cover condition and vegetation factor (NDVI) [29]; and the third category is anthropogenic disturbance, which includes one influencing factor of road network [30]. Resistance values were assigned to the different influencing factors according to the available literature and expert judgment [3,30,31]. The resistance values of each influence factor are shown in Table 1. The cumulative current values of patches and the ecological network structures were subsequently calculated in the ArcGIS 10.2—Linkage Mapper plug-in tool (https://linkagemapper.org/about-the-team/, accessed on 14 July 2023).

Table 1.
Landscape resistance values for each factor.
2.2.2. Patch Importance Ranking Based on mRMR
The mRMR criterion can accomplish a more compact importance ranking by arranging the elements with less redundancy and greater importance in front and those with greater redundancy in the back [17]. The algorithm requires counting the probability that the cumulative current values between the compared patches are similar, thus calculating the mutual information value (1) and finally comparing and ranking them one by one by the mRMR formula (2) to obtain the patch importance ranking results. The calculation of the mutual information is very critical and is obtained by dividing the probability that the cumulative current values of two patches are similar by the probability that they take these similar values separately. According to the rules of the mRMR algorithm, multiple simulations are required to obtain the sample data by simulating node failures in the ecological network by removing one patch at a time from the patch vector map [32] and repeating 10 times to record the results of different cumulative current values obtained for each patch for each simulation. In addition, multiple simulations can exclude the possible chance errors in single simulations and increase the reliability of the ranking.
The mRMR criterion is coded based on the python language to calculate the set S of ranked patches that are more correlated with the target patch c and less redundant with other patches to be evaluated in the screened set. mRMR’s basic formula is Equation (2), and the mutual information formula Equation (1) needs to be added to complete the calculation:
where I(X,Y) is the mutual information between variables x and y, p(x,y) is the joint probability density of variable x and variable y, and p(x) and p(y) are the probability densities of x and y, respectively. They are defined as: p(x,y) is the number of times the cumulative current values of the two patches for comparison are similarly divided by the total number of simulations; p(x) and p(y) are the number of times the x and y patches obtain similar values divided by the total number of simulations.
where the original set is X and the screened set is S. The formula means that xj in the set X − Sm−1, which has the maximum correlation with the target node c and the minimum redundancy with the elements in the screened set Sm−1, is selected. The process of set change based on the mRMR algorithm is shown in Figure 4.
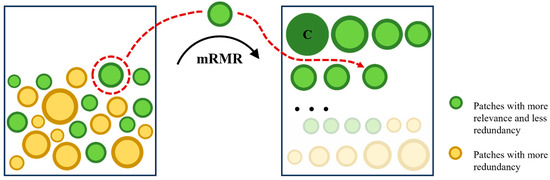
Figure 4.
The change process of set elements based on mRMR algorithm.
2.2.3. SVM-Based Redundant Patch Recognition
Support vector machines (SVMs) can train recognition rules for target objects based on the classification results of a given label in a sample set for redundant patch recognition, and are often used in conjunction with mRMR criteria [17]. Two types of data are required to construct the feature dataset for SVM training, testing, and recognition: (1), the classification labels of all patches; and (2), the individual feature values of all patches. The top 66.7% of the mRMR ranking results are labeled as “important” patches (label 0), and the rest of the patches are labeled as “unimportant” patches (label 1) for SVM training. Through testing, it was discovered that changing the ratio of the two labels would have almost no effect on the final recognition results for each individual but would affect the number of redundant patches in the final results, so the division ratio of 2/3 and 1/3 was chosen to make the results consistent with reality. The feature attributes involved in training in this study include five items: patch area, forest area (summed value), grassland area (summed value), NDVI (summed value), and dPC. These features are key factors in determining the ecological suitability of patches [8,33,34,35,36], and in support vector machines, these factors will directly affect whether patches are identified as having redundancy.
The support vector machine code was constructed based on the python language by using the SVM model of the sklearn library, placing the feature dataset, and training the model with 60% of all samples as the training set and 40% as the test set. The redundant patches in the ecological network can be obtained by identifying all patches again with the SVM training results. The mRMR + SVM method’s data transformation logic is shown in Figure 5.
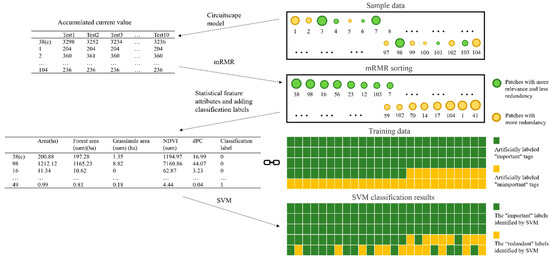
Figure 5.
Data transformation logic.
2.3. Data Sources
Land cover data are needed to construct the patch vector map, which were obtained by interpreting the 2021 remote sensing image data in ENVI5.3, and the remote sensing image data were downloaded from the Geospatial Data Cloud website (http://www.gscloud.cn/, accessed on 10 April 2023). To construct the integrated landscape resistance surface, land cover data (obtained in the same way as above), DEM data (downloaded from the Geospatial Data Cloud at http://www.gscloud.cn/, accessed on 10 April 2023), NDVI (normalized difference vegetation index), and road network data (downloaded from the OpenStreetMap website http://www.openstreetmap.org/, accessed on 10 April 2023) are needed. All the required data can be obtained through the internet. The DEM data were processed in ArcGIS10.2 to obtain slope, elevation, and relief amplitude. The NDVI was calculated from remote sensing image data by multi-band calculation in ENVI5.3 software. Road network data were used to construct multi-level buffers in ArcGIS10.2 using the Multiple Ring Buffer tool to characterize the impacts caused by human activities.
3. Results
3.1. Urban Green Space Ecological Network and Cumulative Current Values
The construction of an urban ecological network is the basic context for extracting and identifying the redundancy of habitat patches. A total of 261 patches with potential to become ecological source sites were obtained through MSPA analysis, and 157 invalid patches with too small areas were excluded (the individual areas of these patches were all less than 8100 m2, accounting for 60.2% of the total number of patches, but only 0.77% of the total patch area), and finally, the original set X consisting of 104 patches was obtained, which had a total area of about 4761 ha, accounting for 42.77% of the total area of the study area, with an average patch size of 45.78ha and a patch density (PD) of 0.93 (pcs/km2). The potential ecological habitat patches (Figure 6) show the distribution characteristics of complete morphology on the east and west sides and sparse fragmentation in the middle. The ecological background of patch 98 (1212.12 ha, ranking second in area) on the west side and patch 103 (2238.84 ha, ranking first in area) on the east side is a large area of forest on the topography of the mountain range, and both large patches are in a north-south direction with a long contact surface with the central patch. The ecological background of the central patch 38 (200.88 ha, area ranked third) is a large area of forest along the river, which is a rare large natural green area in the urban area and forms the main relay station role between the two major ecological sources in the east and west. According to the results of the circuit theory model runs, it can be seen that the current state of urban development has created large ecological networks without coverage areas in the central and southern part of the study area, relying only on a few small source patches to maintain the ecological network structure, and the problem of habitat fragmentation has become apparent. The ecological corridors with high current density are mainly found in urban spaces based on road greenery, greenery next to settlements, and open space to be developed.
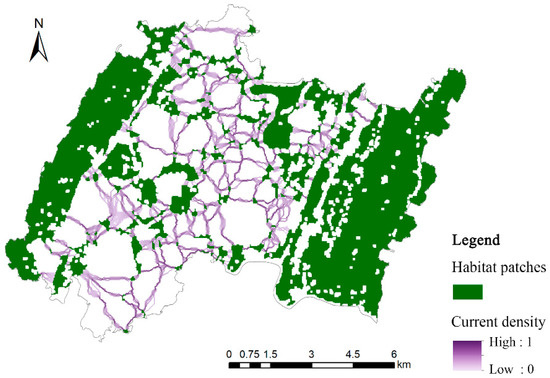
Figure 6.
Distribution of patches and corridors in the study area.
3.2. Ranking the Importance of Source Patches
After the mRMR criterion treatment, the order of 66.34% of the patches changed, the ranking of some patches changed significantly, the ranking of patches that increased (No. 53 (moved up 27 places in the rankings), No. 96 (moved up 14 places in the rankings), No. 46 (moved up 10 places in the rankings), and No. 80 (moved up 10 places in the rankings)) had a greater increase in ranking, and the quality of the actual characteristic attributes of the above patches (area, forest area, grassland area, NDVI, dPC) became better. At the same time, among the patches with decreasing ranking, No. 32 (dropped by 35 places in the rankings), No. 78 (dropped by 14 places in the rankings), and No. 65 (dropped by 9 places in the rankings) had a large decrease in ranking.
3.3. Patch Redundancy Identification
The training sample set with aggregated classification labels and patch feature values was placed into a support vector machine for training and testing, and the trained model was used again to identify the entire set and obtain the identification results for all patches. The results showed that there were 84 “important” patches that should be used as ecological sources and 20 “redundant” patches that have redundant attributes and do not have major node responsibilities in the ecological network. Combined with the actual map, it can be seen that the 84 “important” patches retain the main components of the ecological network, the main skeleton is intact, and patches with high-quality features (area, NDVI, etc.) or occupying key locations are included. Among the 35 patches originally marked as “unimportant”, 15 patches were re-identified by SVM as “important” patches. These patches have small cumulative current values, but in fact they have moderate feature values, are located in locations that play a large connecting role in the network, have few patches of similar quality around them, are irreplaceable, and should be considered to be important patches.
4. Discussion
4.1. Effectiveness of mRMR + SVM Redundancy Identification Method
After comparing the two methods of traditional cumulative current value size ranking and mRMR ranking, it can be found that the order of the top 13 (top 12.5%) patch rankings is the same for both sets of results, indicating that both methods have an extremely high correct rate in identifying patches with absolute dominance. Comparing the ranking results obtained by the two methods, 66.34% of the patches changed their ranking, with the majority of the changes ranging from 1 to 3 places. In the ranking results based on the magnitude of cumulative current values, some patches with good environmental conditions in reality are ranked later, which indicates that the ranking results based on cumulative current values are not compact, and some low-quality patches receive a higher ranking than their actual role in this circuit theory analysis by virtue of the advantage of individual attributes (e.g., zone), and in addition, some patches with similar effects cannot be distinguished from each other. After processing by the mRMR algorithm, there is a tendency for high-quality patches to be clustered in a better order; for example, patches 61 and 93 are highlighted patches with better eigenvalues, and their rankings are improved by 43 and 16 places, respectively, and patches 57 and 66 are patches with better geographical locations, and their rankings are improved by 50 and 20 places, respectively. In the processed importance ranking set S, patches with less redundancy and more importance ranked higher and patches with more redundancy ranked lower, and the randomness of patches performing poorly in a particular operation was avoided.
The redundant patches obtained after mRMR + SVM screening need to be verified against the actual maps. In terms of distribution location, there are several redundant patches with similar or more advantageous areas in the vicinity of the redundant patches, and removing these redundant patches will not fundamentally affect the overall ecological network corridor distribution. After removing these 20 “redundant” patches from the original set, the circuit theory model was run again to obtain the ecological network distribution shown in Figure 7, in which the corridor structure, trend, and flow did not change subversively, and the results were similar to the original results. Fifteen of the patches (Nos. 4, 5, 15, 20, 30, 44, 59, 65, 70, 75, 82, 88, 89, 94, 101) were removed, and the ecological corridors still passed through the areas where these patches were located; five patches (Nos. 29, 42, 49, 52, 104) were removed and their areas no longer formed corridors. Although other corridors existed in their vicinity, the loss of corridors caused by the removal of these five patches reduced the stability of the surrounding ecological network, so it is recommended that these five patches be identified as mildly important patches of higher importance than the redundant patches, assuming a similar role to that of the stepping-stone patches [37], and that they are not prioritized for development when not necessary. In the south of the study area, the removal of patch 104 caused the complete disappearance of the ecological corridor in this area, but the actual situation is that this patch was a small component of a large green area outside the study area and was identified as redundant because the area left after being cut by the administrative boundaries was too small, and this result is consistent with the logic of the whole test. Based on the above analysis, it is clear that the mRMR criterion algorithm can produce ranking results, with more important patches ranking higher and redundant patches ranking lower; compared with the traditional simple classification results based on the cumulative current value, the patch classification results based on SVM identification are more comprehensive in terms of the data involved in the evaluation, the fact that each individual is evaluated independently, and the fact that the results are more relevant. The mRMR + SVM method’s path is able to accomplish the goal of ranking the importance of patches and identifying redundant individuals among them.
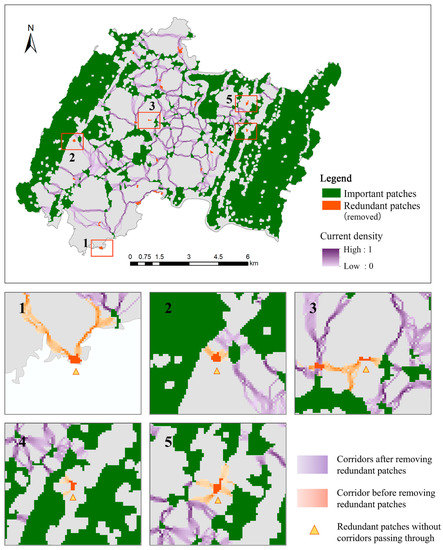
Figure 7.
Ecological network distribution after removal of redundant patches.
Based on the order of the mRMR ranking results, the “minimum-redundancy-maximum-correlation” values of the patches generated by the mRMR algorithm were accumulated one by one from front to back. Then, using the natural breakpoint method, all nodes were classified into five categories: the patches ranked 1–9 are overwhelmingly important; the patches ranked 10–14 are highly important; the patches ranked 15–41 are moderately important; the patches ranked 42–104 (excluding redundant patches) are slightly important; the 15 redundant patches are redundant. The final hierarchical classification results are shown in Figure 8.
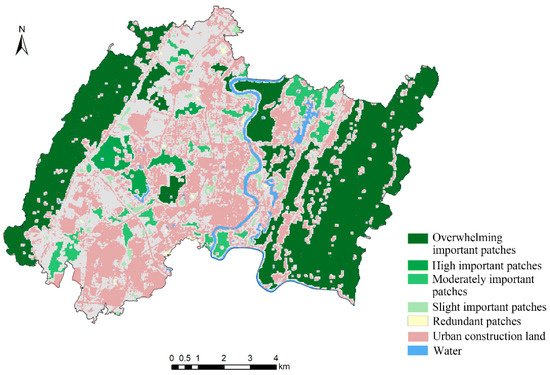
Figure 8.
Results of patch classification.
4.2. Spatial Management Policy Response Based on Patch Redundancy and Importance
Based on the results of the patch classification identified above, hierarchical and differentiated conservation measures were implemented for the patches. Source patches are the backbone of the ecological network, and corridors are similar to blood vessels. Maintaining a sizable total number of source patches is essential for increasing the resilience of the ecological network. Therefore, targeted management policies are needed to achieve differentiated spatial control. The results of source patch identification can provide a basis for developing a hierarchical list of source-patch protection. As mentioned above, source patches can be classified into five categories: overwhelmingly important, highly important, moderately important, slightly important, and redundant. Different implementation lists and prohibition lists are developed for different types of source land patches to clarify the scope of authority and spatial extent of anthropogenic activities (Table 2).
Table 2.
Implementation list and prohibition list for different levels of patches.
4.3. Advantages and Limitations of mRMR + SVM Method
The mRMR + SVM method is a reliable way to analyze redundancy in the field of complex systems, consisting of a two-part algorithm of minimum redundancy maximum correlation criterion and support vector machine. The application of this method to the study of ecological network patch importance and redundancy identification shows three advantages: first, in the patch importance ranking results, it can make the order of patches with better comprehensive quality more concentrated in the front; second, in the identification of patch redundancy, we can determine whether the patches are redundant or not on a case-by-case basis; third, both mRMR and SVM can theoretically incorporate as many data types as possible into the analysis and maintain high computational efficiency. The above three features make the classification results highly accurate and can be more easily used by researchers and planning workers. The method can also overcome the problems of traditional importance ranking methods, e.g., the problem of chance based on the results of one analysis and the problem of one-sidedness based on one indicator. In general, the mRMR + SVM path can achieve the importance ranking and redundancy identification of source patches accurately and efficiently, but there are some limitations. Commonly, the number of source patches is limited, and there will be the problem of insufficient samples when training the SVM model. For example, in this study, there were only 104 valid patches after screening, and it was difficult for the support vector machine to train a high-quality recognition model. In addition, due to the lack of a referenceable basis for classifying the importance of ecological networks, labels were only added to the patches with simple scaling rules before the mRMR ranking results were placed into the SVM. Although the recognition results of SVM restored the valuable “redundant” patches to “important” labels, the inaccurate labeling of the training dataset still had some temporary unaccountable effects on the final recognition results. Therefore, in future research, we can consider collecting and producing a sample database of ecological network patches from different geographical areas, which will provide strong support for a larger scale and longer time span of research by containing patch characteristics and identification results. In addition, the potential of support vector machines applied to ecological network research is not explored enough in this paper, and better use of support vector machines can be achieved by debugging the kernel function and improving the accuracy of label classification.
5. Conclusions
This paper introduces the mRMR + SVM method to the study of ecological network source patches and explores the source patch redundancy identification method and importance ranking method with the direct participation of diverse indicators in the evaluation. After identifying the potential ecological source patches of the ecological network in Longxing area of Chongqing, this paper uses mRMR criteria to rank and classify the importance of source patches and SVM to identify the redundant patches. Finally, a hierarchical classification and management list design of source land patches according to their importance were carried out. The main conclusions of the study are as follows: (1) mRMR criteria can achieve an importance ranking that is in closer alignment with the real situation. Compared with the ranking results based on the cumulative current value size of the patches, the ranking of 66.34% of the patches in the mRMR criteria ranking results changed, the patches with better realistic quality were ranked higher, and the redundant patches were ranked lower. (2) The mRMR + SVM method can identify individuals with redundancy from the set of source site patches. Among the 20 patches identified as redundant, circuit theory simulations were performed again after removal: 15 patches where the ecological corridor still passes through its area, and 5 patches where the ecological corridor no longer passes through but where there are similar patches nearby to assume its function. Finally, 104 source patches were classified into: overwhelmingly important patches (9), highly important patches (5), moderately important patches (27), slightly important patches (48), and redundant patches (15), and policy management measures including implementation lists and prohibition lists were proposed. The method proposed in this paper has the ability to identify the redundancy and importance of source patches. The results of the study can help improve the knowledge of ecological networks and provide quantitative methodological support and decision-making reference for urban development and ecological conservation.
Author Contributions
Conceptualization, B.L.; methodology, X.Z.; software, X.Z.; validation, B.L. and H.X.; investigation, X.Z.; resources, H.X.; data curation, M.H.; writing—original draft preparation, X.Z.; writing—review and editing, B.L.; visualization, M.H.; funding acquisition, C.D. All authors have read and agreed to the published version of the manuscript.
Funding
This study was funded by the National Natural Science Foundation of China (52078074 and 52238003).
Data Availability Statement
The data presented in this study are available in the article.
Acknowledgments
The authors thank all the members who participated in the writing of the paper. The authors greatly appreciate the thorough review and valuable comments of the anonymous reviewer that helped improve this manuscript.
Conflicts of Interest
The authors declare no conflict of interest.
References
- Luo, Y.; Wu, J.; Wang, X.; Wang, Z.; Zhao, Y. Can policy maintain habitat connectivity under landscape fragmentation? A case study of Shenzhen, China. Sci. Total Environ. 2020, 715, 136829. [Google Scholar] [CrossRef] [PubMed]
- Li, S.; Yang, B. Introducing a new method for assessing spatially explicit processes of landscape fragmentation. Ecol. Indic. 2015, 56, 116–124. [Google Scholar] [CrossRef]
- Kong, F.; Yin, H.; Nakagoshi, N.; Zong, Y. Urban green space network development for biodiversity conservation: Identification based on graph theory and gravity modeling. Landsc. Urban Plan. 2010, 95, 16–27. [Google Scholar] [CrossRef]
- Ignatieva, M.; Stewart, G.H.; Meurk, C. Planning and design of ecological networks in urban areas. Landsc. Ecol. Eng. 2011, 7, 17–25. [Google Scholar] [CrossRef]
- Travers, E.; Härdtle, W.; Matthies, D. Corridors as a tool for linking habitats—Shortcomings and perspectives for plant conservation. J. Nat. Conserv. 2021, 60, 125974. [Google Scholar] [CrossRef]
- Jordán, F.; Baldi, A.; Orci, K.-M.; Rácz, I.; Varga, Z. Characterizing the importance of habitat patches and corridors in maintaining the landscape connectivity of a Pholidoptera transsylvanica (Orthoptera) metapopulation. Landsc. Ecol. 2003, 18, 83–92. [Google Scholar] [CrossRef]
- Parker, K.; Head, L.; Chisholm, L.A.; Feneley, N. A conceptual model of ecological connectivity in the Shellharbour Local Government Area, New South Wales, Australia. Landsc. Urban Plan. 2008, 86, 47–59. [Google Scholar] [CrossRef]
- Esbah, H.; Cook, E.A.; Ewan, J. Effects of Increasing Urbanization on the Ecological Integrity of Open Space Preserves. Environ. Manag. 2009, 43, 846–862. [Google Scholar] [CrossRef]
- Linehan, J.; Gross, M.; Finn, J. Greenway planning: Developing a landscape ecological network approach. Landsc. Urban Plan. 1995, 33, 179–193. [Google Scholar] [CrossRef]
- Soille, P.; Vogt, P. Morphological segmentation of binary patterns. Pattern Recognit. Lett. 2009, 30, 456–459. [Google Scholar] [CrossRef]
- Wickham, J.D.; Riitters, K.H.; Wade, T.G.; Vogt, P. A national assessment of green infrastructure and change for the conterminous United States using morphological image processing. Landsc. Urban Plan. 2010, 94, 186–195. [Google Scholar] [CrossRef]
- Yu, K. Ecological Security Patterns in Landscapes and GIS Application. Ann. GIS 1995, 1, 88–102. [Google Scholar] [CrossRef]
- McRae, B.H.; Dickson, B.G.; Keitt, T.H.; Shah, V.B. Using circuit theory to model connectivity in ecology, evolution, and conservation. Ecology 2008, 89, 2712–2724. [Google Scholar] [CrossRef] [PubMed]
- Wu, J.; David, J.L. A spatially explicit hierarchical approach to modeling complex ecological systems: Theory and applications. Ecol. Model. 2002, 153, 7–26. [Google Scholar] [CrossRef]
- Pinto, N.; Keitt, T.H. Beyond the least-cost path: Evaluating corridor redundancy using a graph-theoretic approach. Landsc. Ecol. 2009, 24, 253–266. [Google Scholar] [CrossRef]
- Luo, Y.; Wu, J. Linking the minimum spanning tree and edge betweenness to understand arterial corridors in an ecological network. Landsc. Ecol. 2021, 36, 1549–1565. [Google Scholar] [CrossRef]
- Peng, H.; Long, F.; Ding, C. Feature selection based on mutual information criteria of max-dependency, max-relevance, and min-redundancy. IEEE Trans. Pattern Anal. Mach. Intell. 2005, 27, 1226–1238. [Google Scholar] [CrossRef]
- Yang, Q.; Li, X.; Shi, X. Cellular automata for simulating land use changes based on support vector machines. Comput. Geosci. 2008, 34, 592–602. [Google Scholar] [CrossRef]
- Luo, J.; Liu, A.; Yap, P.; Liedberg, B. An mRMR-SVM Approach for Opto-Fluidic Microorganism Classification. In Proceedings of the 2018 40th Annual International Conference of the IEEE Engineering in Medicine and Biology Society (EMBC), Honolulu, HI, USA, 18–21 July 2018; Volume 2018, pp. 666–669. [Google Scholar]
- Wu, J.; Zhang, S.; Luo, Y.; Wang, H.; Zhao, Y. Assessment of risks to habitat connectivity through the stepping-stone theory: A case study from Shenzhen, China. Urban For. Urban Green. 2022, 71, 127532. [Google Scholar] [CrossRef]
- Gomez, F.; Rajapakse, A.; Annakkage, U.; Fernando, I. Support vector machine-based algorithm for post-fault transient stability status prediction using synchronized measurements. In Proceedings of the 2011 IEEE Power and Energy Society General Meeting, Detroit, MI, USA, 24–29 July 2011; p. 1. [Google Scholar] [CrossRef]
- Cook, E. Ecological Networks in Urban Landscapes; Wageningen Universiteit: Wageningen, The Netherlands, 2000; ISBN 90-5808-271-7. [Google Scholar]
- Vogt, P.; Riitters, K.H.; Iwanowski, M.; Estreguil, C.; Kozak, J.; Soille, P. Mapping landscape corridors. Ecol. Indic. 2007, 7, 481–488. [Google Scholar] [CrossRef]
- Adriaensen, F.; Chardon, J.; De Blust, G.; Swinnen, E.; Villalba, S.; Gulinck, H.; Matthysen, E. The application of ‘least-cost’ modelling as a functional landscape model. Landsc. Urban Plan. 2003, 64, 233–247. [Google Scholar] [CrossRef]
- Forman, R.T.T. Corridors in a landscape: Their ecological structure and function. Ecology (CSSR) 1983, 2, 375–387. [Google Scholar]
- Jim, C.; Liu, H. Species diversity of three major urban forest types in Guangzhou City, China. For. Ecol. Manag. 2001, 146, 99–114. [Google Scholar] [CrossRef]
- Knaapen, J.P.; Scheffer, M.; Harms, B. Estimating habitat isolation in landscape planning. Landsc. Urban Plan. 1992, 23, 1–16. [Google Scholar] [CrossRef]
- Singleton, P.H.; Gaines, W.L.; Lehmkuhl, J.F. Landscape Permeability for Large Carnivores in Washington: A Geographic Information System Weighted-Distance and Least-Cost Corridor Assessment; U.S. Department of Agriculture, Forest Service, Pacific Northwest Research Station: Corvallis, OR, USA, 2002.
- Zhang, L.; Peng, J.; Liu, Y.; Wu, J. Coupling ecosystem services supply and human ecological demand to identify landscape ecological security pattern: A case study in Beijing–Tianjin–Hebei region, China. Urban Ecosyst. 2017, 20, 701–714. [Google Scholar] [CrossRef]
- Liu, S.; Dong, Y.; Cheng, F.; Zhang, Y.; Hou, X.; Dong, S.; Coxixo, A. Effects of road network on Asian elephant habitat and connectivity between the nature reserves in Xishuangbanna, Southwest China. J. Nat. Conserv. 2017, 38, 11–20. [Google Scholar] [CrossRef]
- Zhou, D.; Song, W. Identifying Ecological Corridors and Networks in Mountainous Areas. Int. J. Environ. Res. Public Health 2021, 18, 4797. [Google Scholar] [CrossRef]
- Wang, T.; Li, H.; Huang, Y. The complex ecological network’s resilience of the Wuhan metropolitan area. Ecol. Indic. 2021, 130, 108101. [Google Scholar] [CrossRef]
- Matthews, M.J.; O’Connor, S.; Cole, R.S. Database for the New York State urban wildlife habitat inventory. Landsc. Urban Plan. 1988, 15, 23–37. [Google Scholar] [CrossRef]
- Sandström, U.; Angelstam, P.; Mikusiński, G. Ecological diversity of birds in relation to the structure of urban green space. Landsc. Urban Plan. 2006, 77, 39–53. [Google Scholar] [CrossRef]
- Oliver, I.; Smith, P.L.; Lunt, I.; Parkes, D. Pre-1750 vegetation, naturalness and vegetation condition: What are the implications for biodiversity conservation? Ecol. Manag. Restor. 2002, 3, 176–178. [Google Scholar] [CrossRef]
- Carter, G.M.; Stolen, E.D.; Breininger, D.R. A rapid approach to modeling species–habitat relationships. Biol. Conserv. 2006, 127, 237–244. [Google Scholar] [CrossRef]
- Dickson, B.G.; Albano, C.M.; McRae, B.H.; Anderson, J.J.; Theobald, D.M.; Zachmann, L.J.; Sisk, T.D.; Dombeck, M.P. Informing Strategic Efforts to Expand and Connect Protected Areas Using a Model of Ecological Flow, with Application to the Western United States. Conserv. Lett. 2017, 10, 564–571. [Google Scholar] [CrossRef]


Disclaimer/Publisher’s Note: The statements, opinions and data contained in all publications are solely those of the individual author(s) and contributor(s) and not of MDPI and/or the editor(s). MDPI and/or the editor(s) disclaim responsibility for any injury to people or property resulting from any ideas, methods, instructions or products referred to in the content. |
© 2023 by the authors. Licensee MDPI, Basel, Switzerland. This article is an open access article distributed under the terms and conditions of the Creative Commons Attribution (CC BY) license (https://creativecommons.org/licenses/by/4.0/).