Article

Facial Expressions of Urban Forest Visitors Jointly Exposed to Air Pollution and Regional Climate

1
Northeast Institute of Geography and Agroecology, Chinese Academy of Sciences, Changchun 130102, China
2
University of Chinese Academy of Sciences, Beijing 100049, China
3
College of Forestry, Shenyang Agricultural University, Shenyang 110866, China
*
Author to whom correspondence should be addressed.
Forests 2023, 14(8), 1571; https://doi.org/10.3390/f14081571
Submission received: 4 July 2023 / Revised: 27 July 2023 / Accepted: 28 July 2023 / Published: 31 July 2023
(This article belongs to the Section Forest Economics, Policy, and Social Science)

Abstract

:
Urban forests have important functions to alleviate air pollution, adjust the regional climate, and promote visitors’ mental health and well-being. Humans’ perceptions towards both atmospheric particulate matter (PM) and meteorological factors can be a gauge for assessing the functional services of urban forests. The geographical locations of host cities experiencing urbanization could take part in effects on emotional states of forest visitors. In this study, a total of 6309 facial photos of urban forest visitors were obtained from social networks in 42 cities of mainland China. Happy, sad, and neutral emotions were rated as percent scores in 2020, when the same-day air pollutants, meteorological factors, and socioeconomic indicators were recorded. The positive emotional index (PEI) was calculated as the difference between happy scores and sad scores. The results reveal that severe air pollutants (jointly PM2.5 > 75 μg/m3, PM10 > 150 μg/m3, and AQI > 150) were more frequently found in cities in the northeastern and northern areas of China. The forest visitors in the northeastern cities showed higher happiness scores compared to the visitors in other regions. The Quasi-Poisson regression suggested that high scores of happiness were frequently disclosed in weathers with low PM10. High scores of sadness were regressed on exposure to cities with a low GDP per capita and low total retail sales but with a high GDP at low-longitudinal and high-latitudinal locations with low levels of PM2.5 pollution, relative humidity, and wind velocity and a high temperature. The happiness score and PEI showed high-value aggregations in mega-sized cities (population over 10 million), such as Beijing and Zhengzhou, and in a metro-sized city (population of 5–10 million in Langfang) from climate regions of China.

1. Introduction

Industrialization and urbanization can result in air pollution, which has become an inevitable environmental problem in many developing countries [1,2]. Exposure to air pollution may increase the frequency of diseases and mortality in humans [3]. A long-term exposure to air pollution also triggers perceptions of negative emotions by city dwellers, which may further result in psychological disorders [4,5,6]. Air pollution is composed of gaseous, volatile, semi-volatile, and particulate matter, which can be totally measured in terms of particulate matter (PM) concentration and categorized by the air quality index (AQI) [7]. Common metrics used for measuring PM include PM in aerodynamic diameters no higher than 10 µm (PM10) or 2.5 µm (PM2.5) [8]. The AQI is also a composite indicator used for assessing the air quality categorized for a city based on daily concentrations of PM2.5, PM10, SO2, NO2, O3, and CO [4]. Air pollution in an urban environment is governed by regional meteorological factors [9,10,11]. Preliminary findings suggested that people who are exposed to chronic PM2.5 pollution can accumulate and express negative emotions, but the responses to combined air pollution parameters (e.g., PM10 and AQI) with regional meteorology are currently inadequately known. More research is needed to fill this knowledge gap [12].
Urban forests are an infrastructure that have functions of PM removal and AQI reduction [13,14]. Urban forests also induce positive impacts on emotional perceptions of their visitors [15]. The current methods for investigating emotional perceptions of urban forests upon people using data include not only self-reported scores on questionnaires, but also emotional scores that are disclosed on social media [16,17]. Using social media to study emotional perception has mainly used semantic analysis and face reading [4,18,19]. Technically, it is still difficult to identify tweeted words against daily air pollution, because perceived emotions may not always be expressed through written-down semantic wording [5]. Recently, studies using face-reading techniques have been accumulating evidence with how emotional responses to forest experiences related to geographical distributions and climatic variations [20,21,22,23]. It was determined that visitors’ facial expression scores are a sensitive responder to air pollution in different cities with varied urbanization levels [24]. These, together, suggest a new interest that deserves to be tested with the involvement of regional meteorological factors in groups of driving forces for inducing the facial expressions of forest visitors.
Meteorological conditions are the main factors accounting for over 70% of a short-term change in air pollutants [25,26,27]. The relationship between the PM2.5 concentration in the air and regional meteorology reveals a spatiotemporal variation [26,27]. A winter PM2.5 outburst was reported to be a severe pollutant event in cities in the central and eastern regions of China, which resulted from both local emissions and weather with combined low wind velocity and high relative humidity [28]. In cities in South China, a high wind velocity in the winter reduces the PM2.5 concentration in the air in the near-ground atmospheric layer [29]. The distribution of PM10 shows temporally higher concentrations in the winter than in the summer and is geographically higher in cities in the northern region of China than in the southern region of China [30,31]. Likewise, AQI can also be modified in different cities where the local meteorological parameters are different. For example, a positive correlation was found between the AQI and temperature in cities under different levels of population [32]. In addition, socioeconomic indicators also play an important role in predicting PM and AQI concentrations [2,33]. Regional meteorological and socioeconomic factors are both important to include in models to predict the perceived emotions of urban forest visitors. Again, relevant evidence is limited and more research is essential to fill this knowledge gap.
In this study, we evaluate the public emotional perceptions of urban forest visitors through facial expressions and also asked how varying ambient air pollution might affect their emotions. Urban forest parks were selected from cities with different urbanization levels at varied socioeconomic states. The study is concerned with a scientific question that asks what visitors’ emotional perceptions are in response to the joint effects of air pollution, meteorological conditions, and population urbanization. Based on current knowledge, it was hypothesized that air pollution increased in cities with (1) a higher population urbanization level, but (2) low levels of temperature, air humidity, and wind velocity, as well as (3) a higher regional economic state. It was also hypothesized that (4) the air pollution factors (e.g., temperature, air humidity, and wind velocity) together when contributing to a higher air pollution level led to a reduction of visitors’ emotional perceptions of urban forests and offers suggestions for future urban planning research.

2. Materials and Methods

2.1. Study Area

A total of 59 urban forests were randomly chosen from 42 cities of 20 provincial areas across mainland China (Figure 1). Urban forests were selected from geographical ranges of fully urbanized regions of a host city from downtown to remote rural areas. Nature reserves were excluded from our study areas because they were mostly too remote from built-up regions to attract people for frequent visits. Sina Weibo was used as the source of facial data as a social network service (SNS) platform. It can also be identified as Sina Micro-blog or Chinese Twitter. Facial photos were collected from daily records of urban forest visitors in four seasons across the year 2020. Chosen forests were targeted as the check-in locations for geography-relevant information collection. Urban forests were selected under a rule that each targeted the location of an objective forest park and had to attract more than 40 photos from a year-long timeframe. Because the year 2020 still fell in the COVID pandemic, a considerable number of forest visitors wore masks while taking photos. Hence, any photos not showing a face were excluded from our data pool. People with makeup that affected facial recognition or modified facial images were also excluded, as they would affect the accuracy of expression analysis. A total of 6309 facial images met the study requirements and they were included for further analysis.

2.2. Data Collection

Cities’ socioeconomic dimensions were obtained from statistical yearbooks from the 2020 edition. Cities were categorized into different urbanization levels according to their inhabitant populations [34]. That is, cities with a population under five hundred thousand were categorized as “small-sized”. The “medium-size” cities were those with population that ranged between five hundred thousand and 1 million; cities with population ranging from 1 to 5 million were defined as “large-sized”. Finally, the “metro-size” cities referred to cities with populations in a range from 5 to 10 million; cities with population of more than 10 million were termed “mega-sized”. Socioeconomic indicators of host cities where urban forests were located are shown in Table S1.
Facial expression data were obtained from human subjects who posted their facial photos to Sina Weibo under an agreement to the open policy. The study approach and ethics statement have been reviewed and approved by the Experimental Animal Welfare Ethics Committee of Northeast Institute of Geography and Agroecology, Chinese Academy of Sciences, on 3 November 2022 (reference code: ERC-2022-UFW-002). Emotional perceptions were analyzed and quantified using FireFACE ver. 1.0 software (Guanzhong A&F S&T Inc., Sanya, Hainan, China). Happy, sad, and neutral emotions were recognized to rate their scores as a percentage. Positive emotion index (PEI) was calculated by happy score minus sad score. The PEI has a psychological meaning, revealing net positive emotions without all the involved negative expressions when people were exposed to perceived stimuli [35].
Air quality data and geo-meteorological data were collected on the same days when at least one visitor checked in targeted forest parks and posted photos. Atmospheric parameters of PM2.5, PM10, and AQI were used as variables to reflect the quality of weather for days when photos were taken. These three parameters were obtained from the neighboring China General Environmental Monitoring Station [36]. Maximum temperature, minimum temperature, average temperature, average relative humidity, and average wind velocity were chosen as meteorological variables in this study. Data were obtained from the Climate Data Center of the National Meteorological Information Center of China [37].

2.3. Statistical Analysis

Data were analyzed using R software (version 4.0.3, R Foundation for Statistical Computing, Vienna, Austria). The spatial interpolation was implemented using ArcGIS (version 10.3, Environmental Systems Research Institute, Inc., New York, NY, USA). Since none of data followed the normal distribution, the Kruskal–Wallis (K-W) test was used to detect differences in factors among socioeconomic dimensions, air pollutants, emotional perceptions, and urbanization levels [38]. When a significant effect was indicated, data were arranged and compared by the Wilcoxon rank-sum test [39]. Bonferroni adjustment was employed to adjust significance from the baseline of 0.05 levels to a final level in accordance with degrees of freedom (df) [40]. Spearman correlation was used to analyze the relationship between environmental factors and socioeconomic dimensions. Spatial interpolation was used to represent the spatiotemporal distributions. Quasi-Poisson regression model was used to detect the contribution of socioeconomic indicators and environmental factors to visitors’ emotional perceptions.

3. Results

3.1. Socioeconomic Dimensions and Air Pollution among Cities at Varied Urbanization Levels

The K-W test indicated that there were significant differences between urban socioeconomic factors and different urbanization levels (p < 0.0001). Mega-size cities had the highest average GDP at CNY 18,964.05 hundred million, GDP per capita at CNY 114,362.87, total retail sales of social consumer goods at CNY 7719.62 hundred million, and population at five hundred thousand people.
Significant differences in air pollutants were observed based on different levels of urbanization. Among the three city levels, large-size cities had the lowest averages for three air pollutants, with a PM2.5 of 31.96 μg/m3, a PM10 of 60.08 μg/m3, and an AQI value of 67.13. Metro-size cities had the highest average for two air pollutants, with a PM2.5 of 38.02 μg/m3 and a PM10 of 73.20 μg/m3. Mega-size cities had the highest average value of AQI of 79.47.
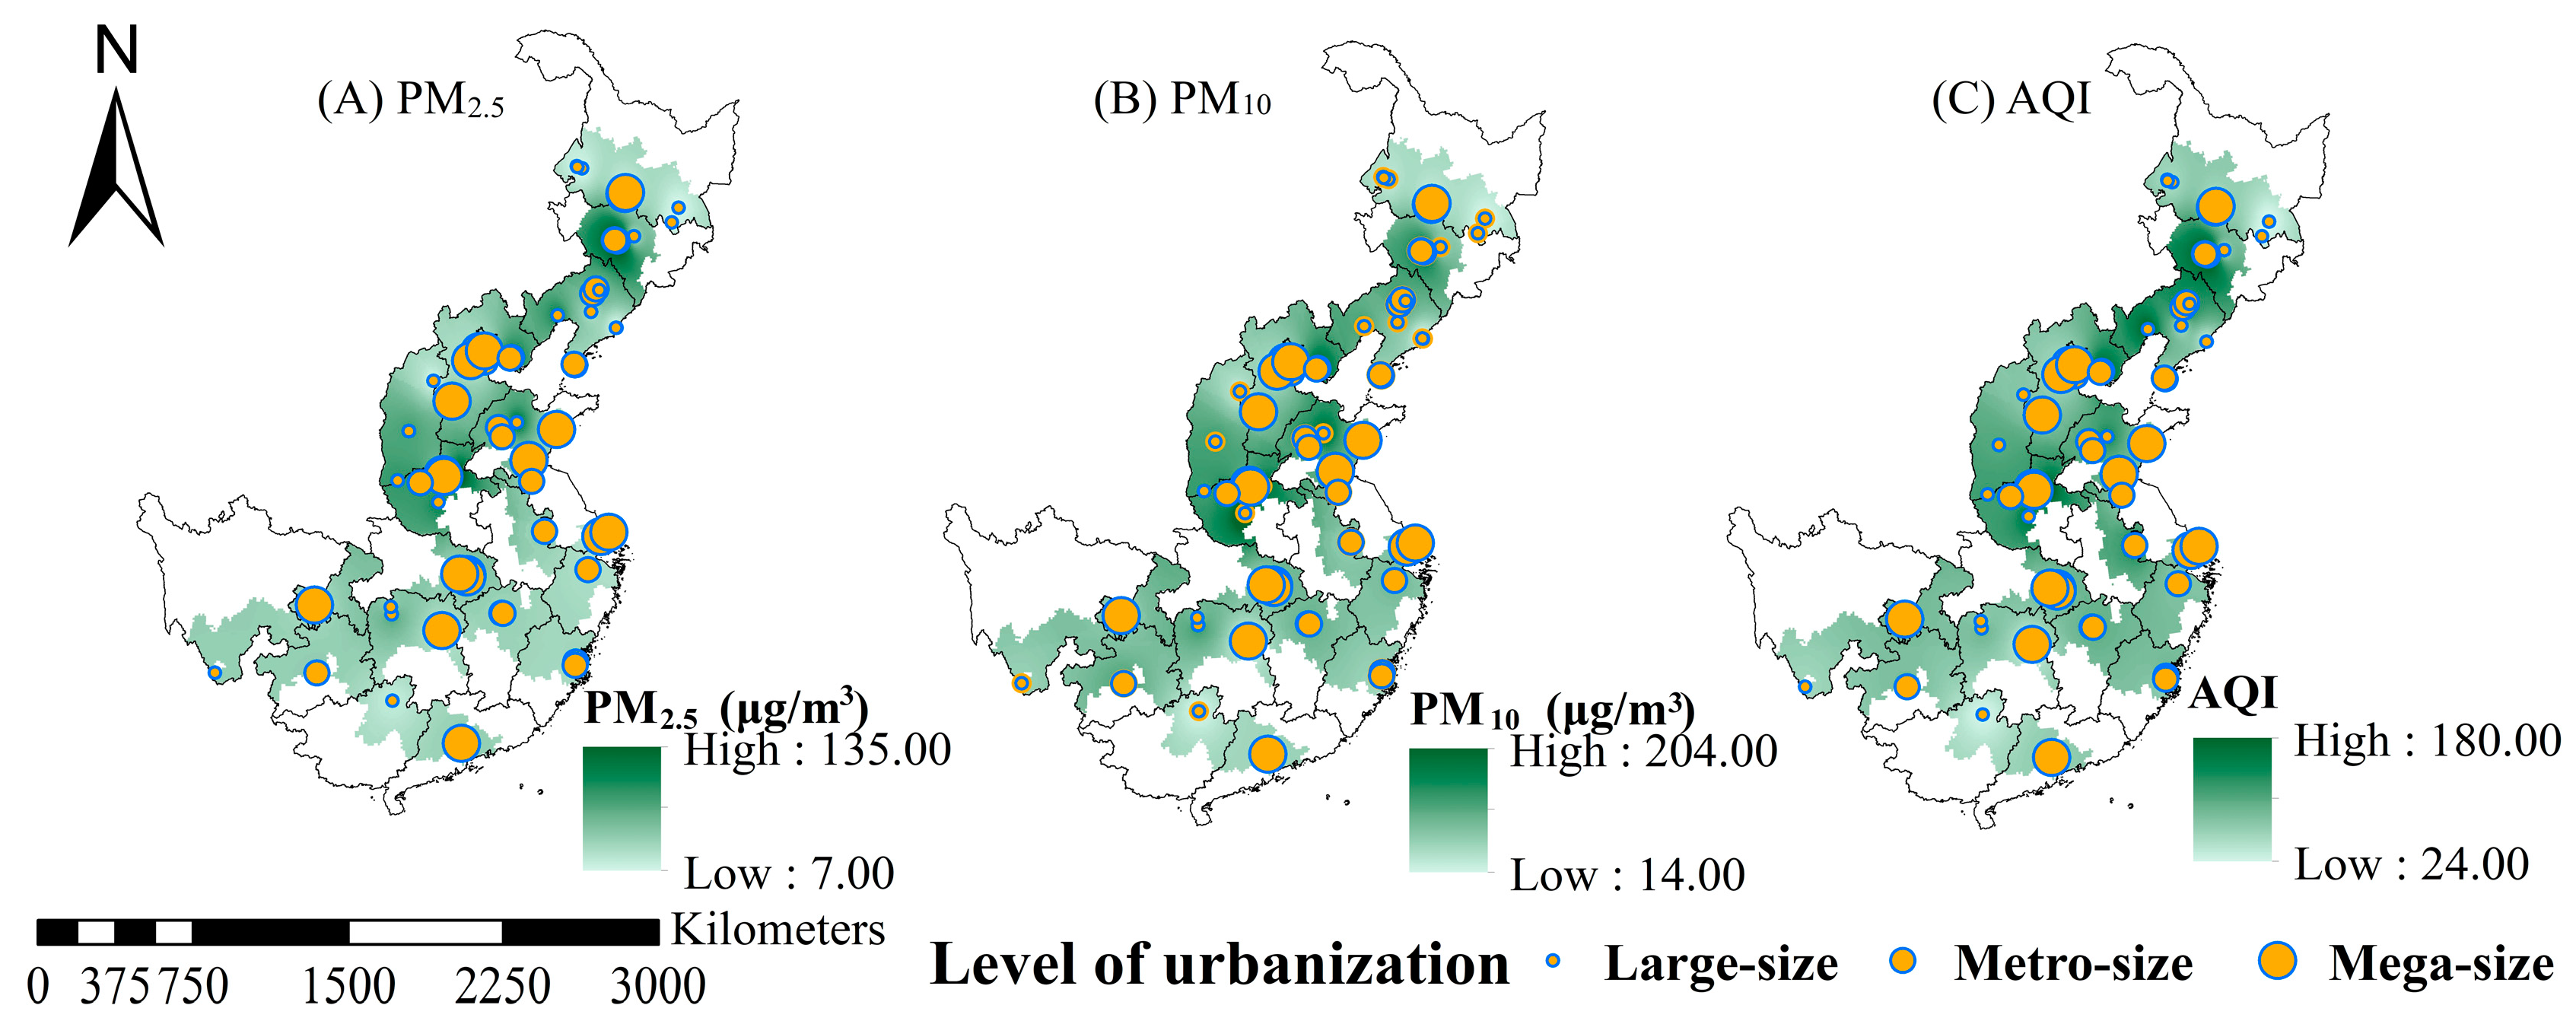
PM2.5 distribution showed obvious regional variation between cities with different urbanization levels (Figure 2). The aggregation of high values in PM2.5 was mainly found in the metro-size city of Changchun and the mega-size city of Harbin in Northeast China (Figure 2A). The aggregation of high values in PM10 was mainly found in the metro-size cities of Jinan and Tangshan in northern regions of China (Figure 2B). The aggregation of high values in AQI was mainly found in the metro-size city of Changchun and the mega-size city of Harbin in Northeast China (Figure 2C). Severe levels of air pollutants (concentrations over 75 μg/m3 for PM2.5, over 150 μg/m3 for PM10, and over 150 for AQI) were found to be more frequent in cities at Northeastern and Northern China.

3.2. Spatial Distributions of Meteorological Factors

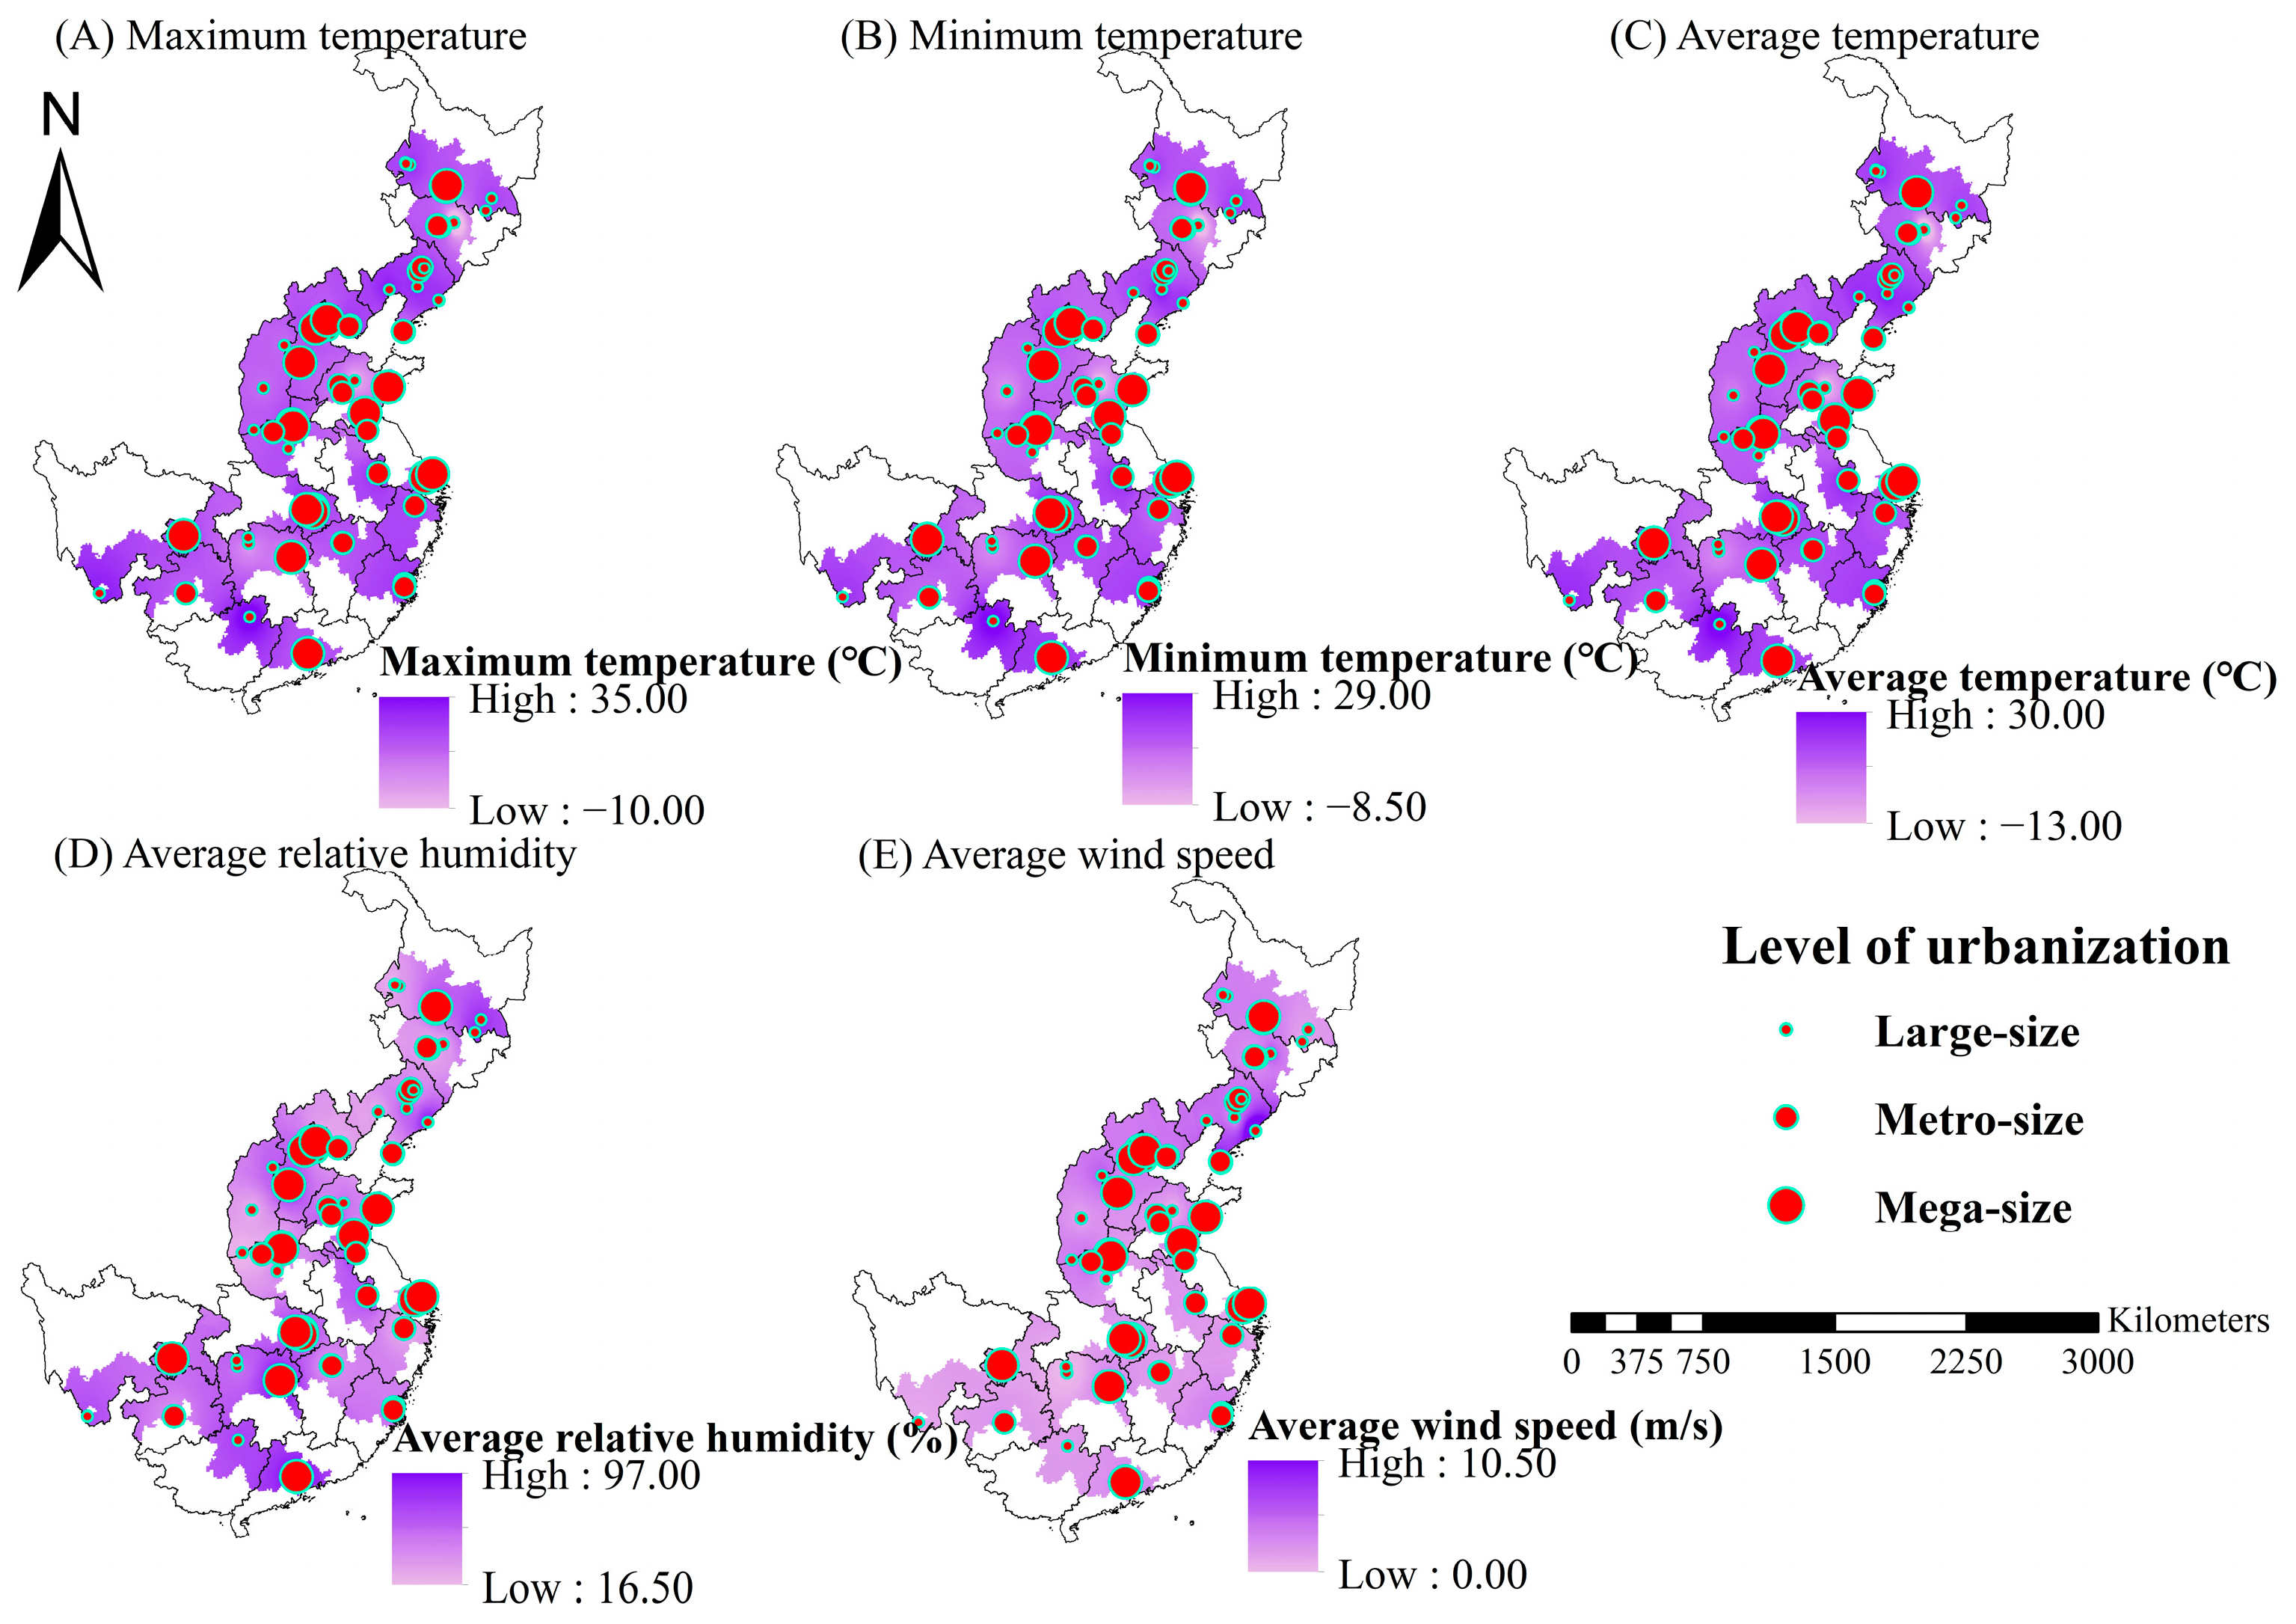
Meteorological factors also had obvious regional variations (Figure 3). Specifically, the high values of temperature were clustered in regions around the mega-size city of Chongqing and the metro-size city of Fuzhou in South China (Figure 3A–C). The high values of relative humidity were clustered in the mega-size cities of Suzhou and Shanghai in eastern regions (Figure 3D). High wind velocities were mainly clustered in regions around the large-size city of Dandong and the metro-size city of Dalian in northeastern regions (Figure 3E).

3.3. Correlations between Pairs of Variables in Air Quality, Climate, and Socioeconomics

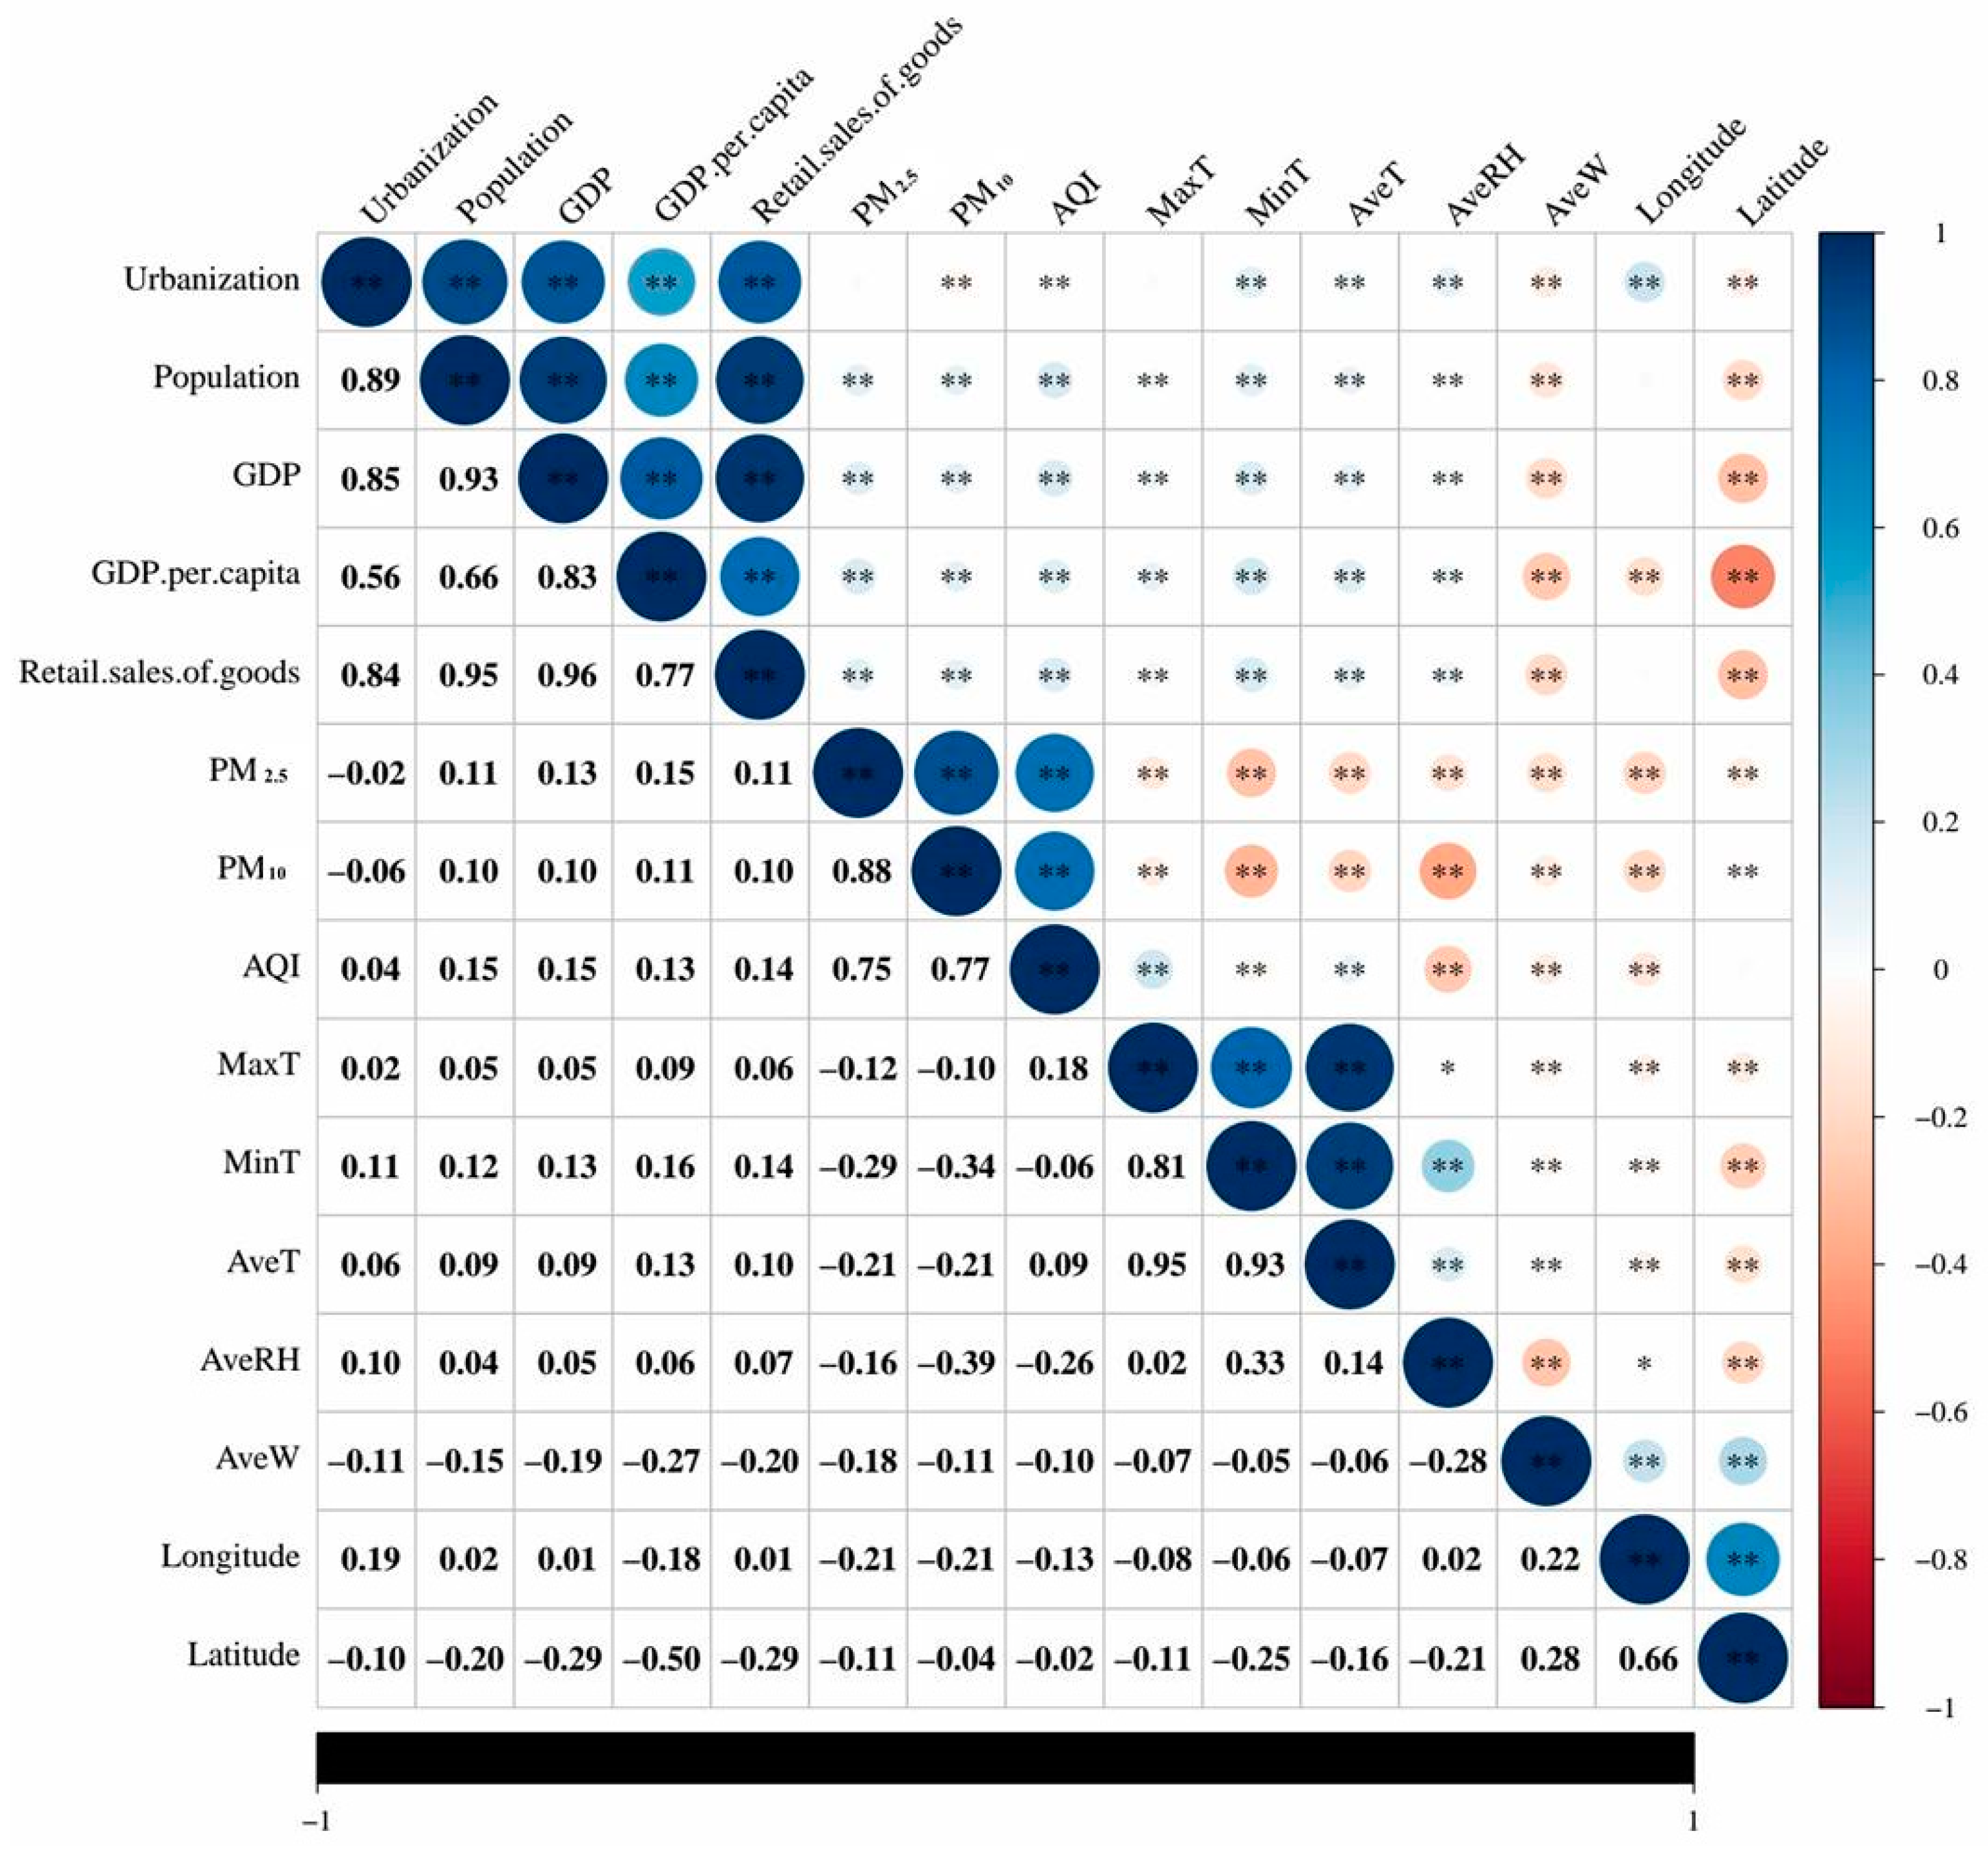
A positive correlation was found between any paired parameters among air pollutants and socioeconomic indicators (Figure 4). There was a positive correlation between pairs among four socioeconomic indicators. Among air pollutant variables, GDP had positive correlations with PM2.5 (r = 0.13, p < 0.01), PM10 (r = 0.10, p < 0.01), and AQI (r = 0.17, p < 0.01). Among meteorological parameters, GDP was positively correlated with maximum temperature (r = 0.08, p < 0.01), minimum temperature (r = 0.17, p < 0.01), average temperature (r = 0.13, p < 0.01), and average relative humidity (r = 0.07, p < 0.01). However, GDP also showed a negative correlation with average wind velocity (r = −0.29, p < 0.01). Positive correlations were shown between pairs among three air pollutants. Among meteorological parameters, PM2.5 had a negative relationship with the maximum temperature (r = −0.12, p < 0.01), minimum temperature (r = −0.24, p < 0.01), average temperature (r = −0.19, p < 0.01), average relative humidity (r = −0.12, p < 0.01), and average wind velocity (r = −0.20, p < 0.01). AQI had positive relationships with maximum temperature (r = 0.19, p < 0.01) and average temperature (r = 0.11, p < 0.01), but negative relationships with average relative humidity (r = −0.24, p < 0.01) and average wind velocity (r = −0.11, p < 0.01).
Longitude and latitude were positively correlated to each other. Among air pollutant variables, longitude had negative relationships with PM2.5 (r = −0.22, p < 0.01), PM10 (r = −0.20, p < 0.01), and AQI (r = −0.15, p < 0.01). Among meteorological parameters, longitude was negatively correlated with maximum temperature (r = −0.06, p < 0.01), minimum temperature (r = −0.10, p < 0.01), average temperature (r = −0.07, p < 0.01), and average relative humidity (r = −0.04, p < 0.01). Longitude also had a positive correlation with average wind velocity (r = 0.26, p < 0.01)). Among economic parameters, longitude had negative relationships with GDP (r = −0.12, p < 0.01), GDP per capita (r = −0.21, p < 0.01), total retail sales of social consumer goods (r = −0.05, p < 0.01), and population (r = −0.07, p < 0.01).

3.4. Facial Expression Scores in Urban Forest Visitors of Cities at Varied Urbanization Levels

Large-size cities showed a higher happy score (44.97 ± 0.90%) by 6.09% compared to that (42.39 ± 0.85%) in metro-size cities. A significant difference was found in the sad scores of forest visitors in cities at different levels of urbanization. Mega-size cities had the highest average sad score of 15.35%. The neutral score did not show any significant difference among different urbanization levels. Metro-size cities had the highest neutral score at 44.77%, while large-size cities had the lowest neutral score at 42.30%. The PEI did not show any significant difference among varied urbanization levels. Mega-size cities had the highest PEI at 21.24%, while metro-size cities had the lowest PEI at 29.46%.
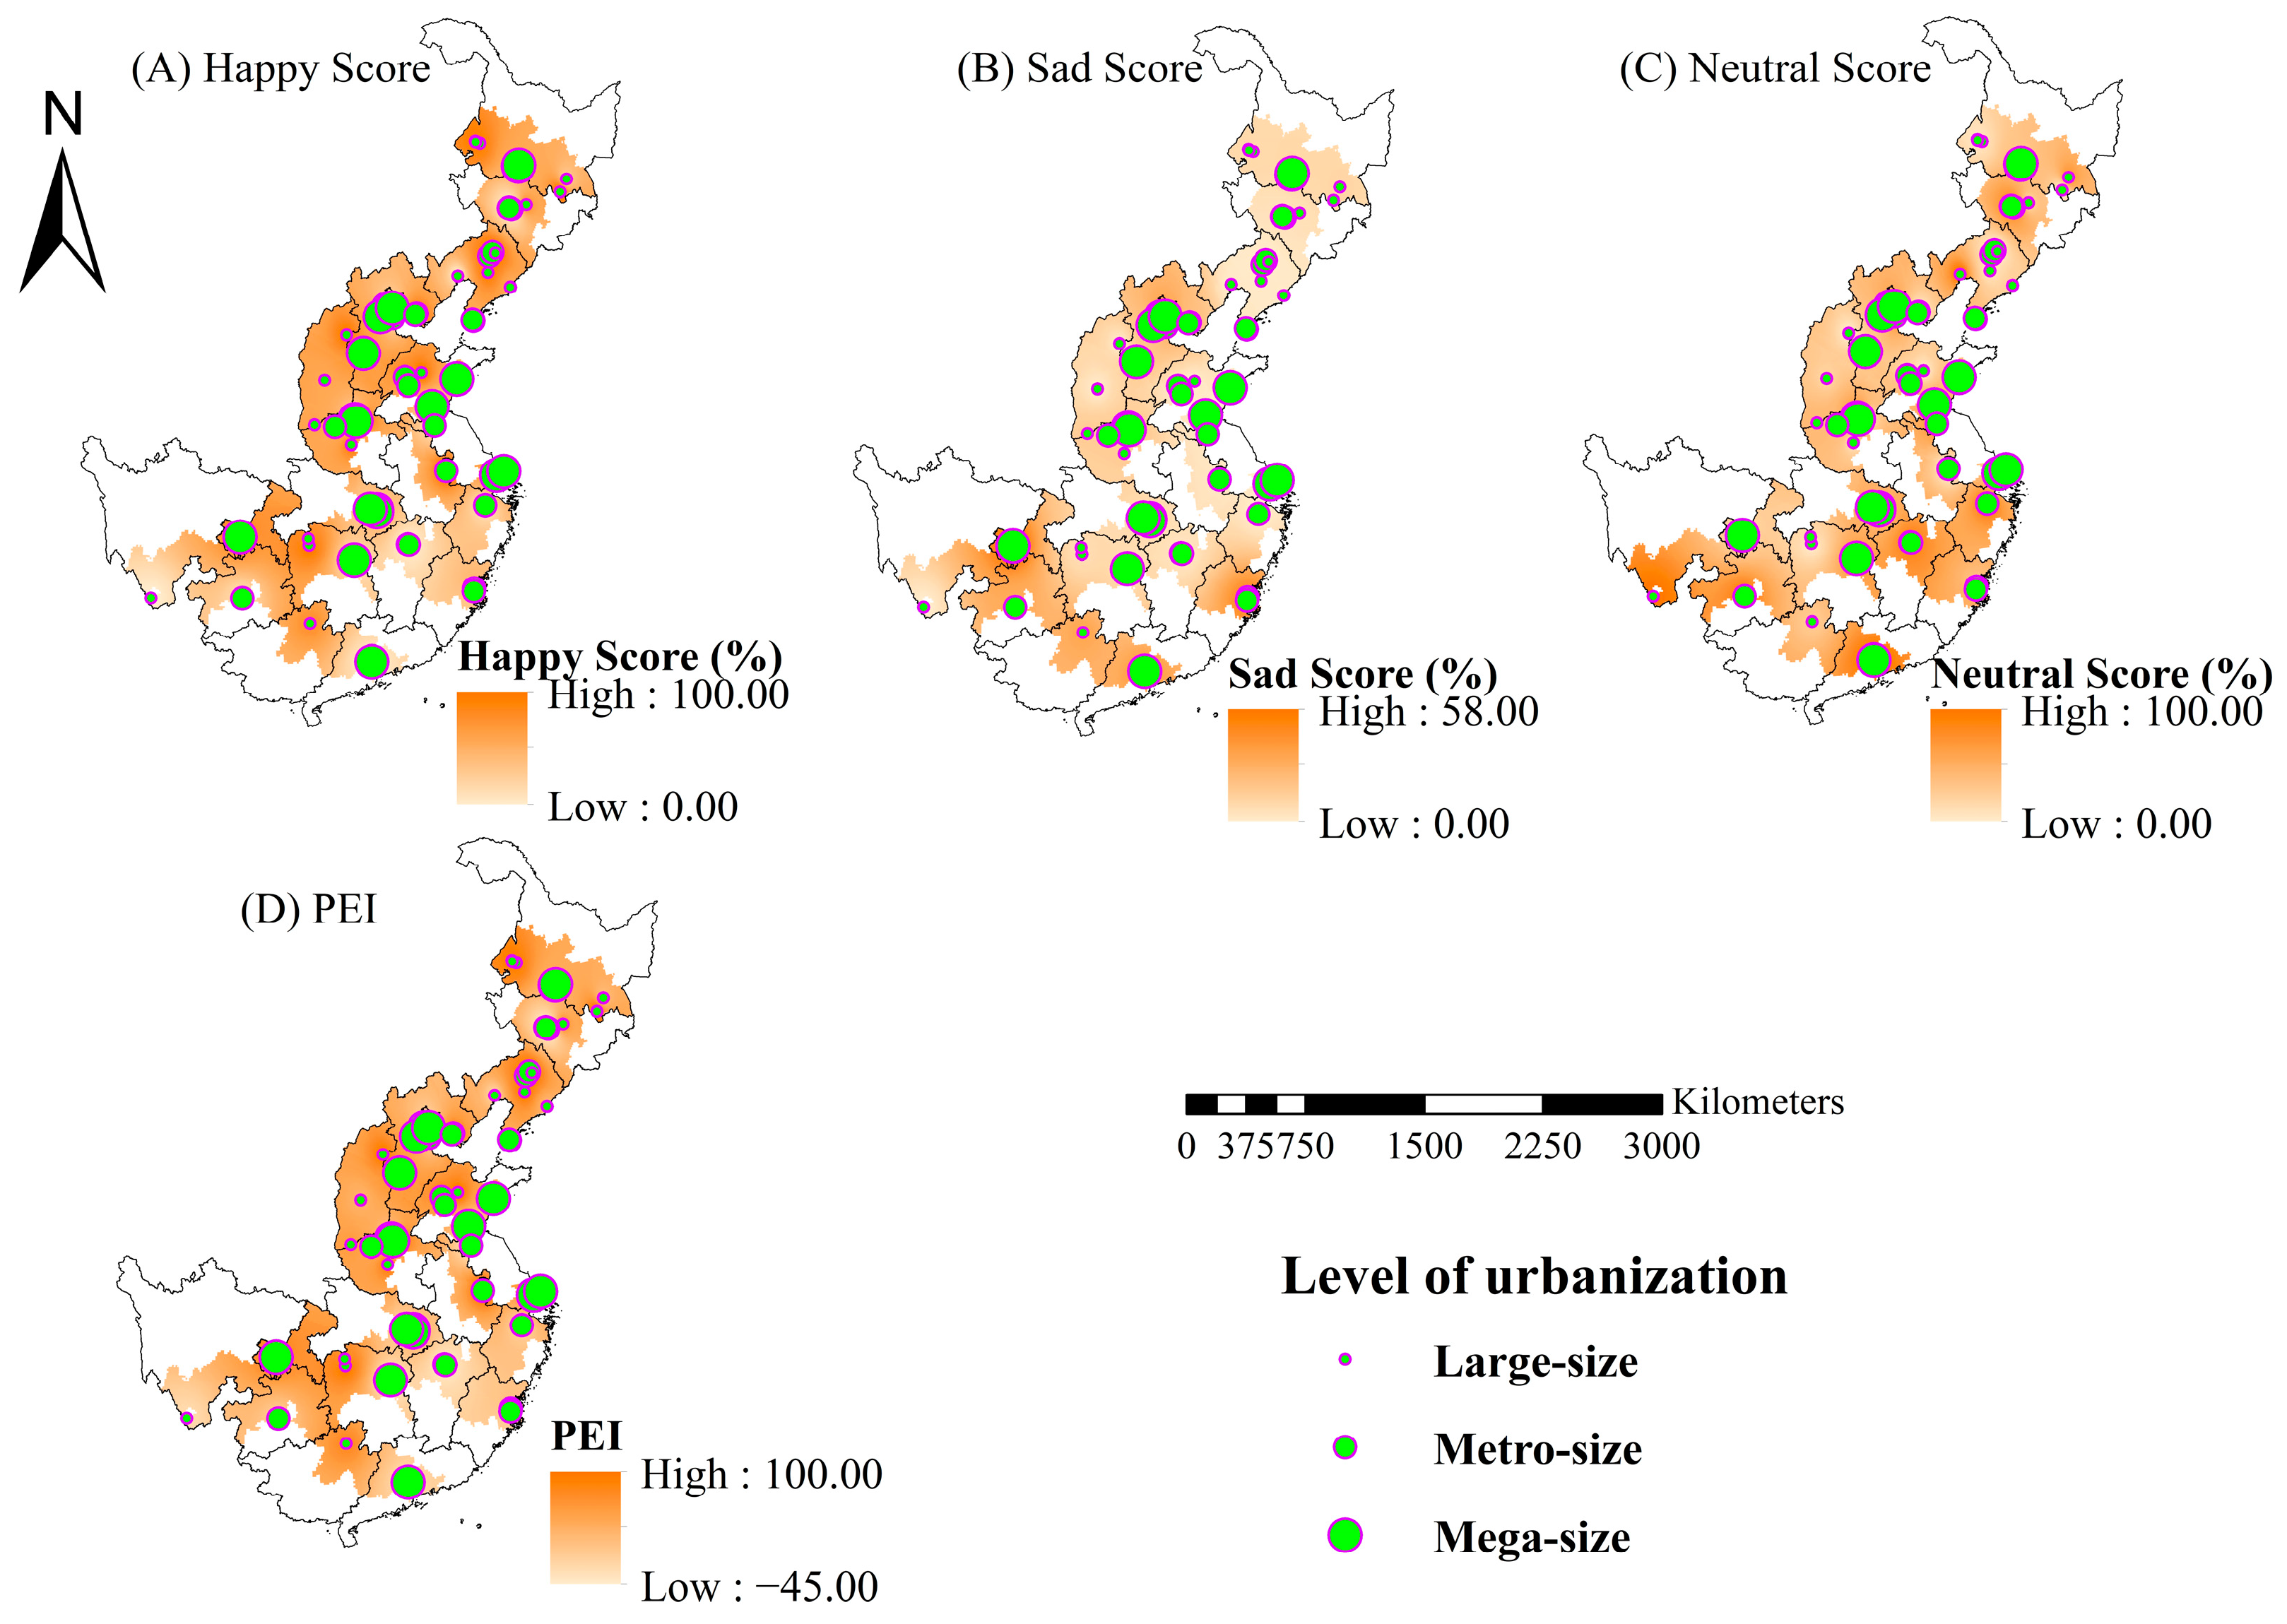
Forest visitors’ facial expression scores showed different spatial distribution patterns for different emotions in regions with varied urbanization levels (Figure 5). Happy scores and PEI showed a aggregation of high values in regions around the mega-size cities of Beijing and Zhengzhou, and in a metro-size city of Langfang in North China (Figure 5A,D). Sad scores were clustered by high values in regions among the mega-size city of Chongqing and the metro-size city of Fuzhou in the southern region of China (Figure 5B). Neutral scores showed a clustering pattern of high values in regions around the mega-size city of Chongqing and metro-size city of Guiyang in Southwest China (Figure 5C).

3.5. Regressions of Facial Expression Scores against Air Quality, Regional Climate, and Socioeconomics

PM10 and longitude were found to have negative contributions to the happy score, while latitude was revealed to have a positive contribution to the happy score (Table 1). The regression coefficient of the happy score at the intercept was 4.64, which was higher than that for PM10, longitude, and latitude, indicating that the happy score is a regressed consequence formed under forces of combined multiple factors. People showed a higher happy score on days with low PM10. Visitors in the western and northern regions had higher happy scores than those in other regions. Therefore, this study showed that visitors in the Northeast China showed the highest happy scores due to more frequent days with a lower PM10.
Several independent variables were indicated to have significant contributions to sad scores, including variables of PM2.5, PM10, AQI, longitude, latitude, temperature, relative humidity, wind velocity, GDP, GDP per capita, and total retail sales of consumer goods (Table 2). The regression coefficient at the intercept was 7.93, which was much larger than those of other factors, indicating that the sad score is a regressed consequence of combined multiple factors. People showed higher sad scores on days with a high PM10 but low PM2.5 and AQI. Decreased levels in average temperature, relative humidity, and wind velocity also contributed to the increase in sad scores. In addition, the sad score was also regressed to be positively responsive to dual increases in GDP and population and decreases in GDP per capita and total sales of consumer goods.
PM10 was observed to have a positive contribution to the presentation of neutral scores (Table 3). People showed a higher neutral score on days with a high PM10.
Variables of PM10, longitude, and latitude were indicated to have significant contributions to PEI (Table 4). The regression coefficient at the intercept was 5.23, which was much larger than those of other factors. This indicates that PEI is a regressed consequence formed by combined factors. People showed a higher PEI with a lower PM10. A higher PEI would be more expected for visitors in the western and northern regions than for visitors from other areas. Visitors in Northeast China showed the highest happiness score on days with a low PM10.

4. Discussion

4.1. Differences between Socioeconomic Indicators and Air Pollutant

Our study indicated that socioeconomic indicators increased with the level of urbanization. Urbanization is a multifaceted phenomenon with profound changes in land use, economic structure, social organization, behavior and consumption patterns, and political and administrative arrangements [41,42]. A study used data from 180 countries to demonstrate that urbanization is not related to economic growth although it is positively related to national income [43]. Thus, these findings concur with the findings of our study.
Views on the relationship between urbanization and air pollution are contrasting. It was reported that cities at a high urbanization rate had lower atmospheric concentrations of air pollutants [33,44,45]. In contrast, it was also reported that urbanization was positively correlated with air pollution in 289 cities in China [32]. An inverted U-shaped relationship was reported between urbanization and air pollutants [42,44], which coincides with our results. Our first hypothesis was not confirmed, and we found more air pollutants in larger-size and mega-size cities than in metro-size cities. Our conclusion is more reliable as on the one hand, China’s rapid economic growth relied heavily on energy consumption and resource depletion in synchronization with emissions of large amounts of pollutants [46,47]. On the other hand, it was suggested that the development of a secondary industry may have also promoted the emission of air pollutants [48]. The causes of various air pollutants are dependent, which complicates the relationship between air pollutants and urbanization. The value of AQI increased with the increase in urbanization level, which can be explained by the fact that AQI is not a directly perceived indicator of air pollution following urbanization and industrialization. More work should be carried out in the future to study the relationship between urbanization and air pollution in regions concerned in this study.

4.2. Spatiotemporal Distribution of Air Pollutants and Meteorological Factors

The distribution of air pollutants in China was revealed to be spatially heterogeneous. Several studies demonstrated that high PM2.5 accumulation in the air over the years was mainly found in cities in northern regions of China, especially in Beijing, Tianjin, Hebei, and their surrounding towns [49]. Air pollution with a high PM10 concentration was mainly concentrated in cities in Northern China [8,50]. High AQI was found to be more distributed in northern and northwestern regions of China [8]. These results together demonstrate spatial variations of different air pollutants, which are all consistent with the findings of our study. In cities in North China, burning fossil fuels for heating indoor habitats in winter mainly accounts for the formation of air pollution [8,51]. At the same time, industrial agglomeration in North China exacerbates air pollution by causing extremely high environmental loads [52]. As an important grain production base in China, occasional straw burning still occurs in the northeast towns around big cities and metropolises, although it has been explicitly banned [53]. Particulate matter and secondary aerosols generated during straw burning will further strengthen regional air pollution [54]. Cities in Northern China also encountered higher wind velocity in winter, which causes blowing dust, making the number of polluted cities larger in winter than in other seasons [29]. We observed that air pollution was more severe in large cities with a greater population, where socioeconomic indicators and air pollutants were proportionally increased and together confirm our third hypothesis. This was attributed to the fact that people consume natural resources and emit large amounts of pollution during the process of urbanization [42,44]. Population density was also found to contribute to the increase in air pollution in synchronization of urbanization [32]. However, the increase in economic standards allowed people to improve their environmental standards, which contributed to the reduction of pollution [33,44].
There is an existing interaction between the socioeconomic and climatic conditions [55]. For example, the heat island effect and carbon emissions from the urbanization process would have a serious impact on the local climate [41]. Climate change may also affect the demand for electricity use [56], and reduce labor productivity in manual manufacturing industries [57]. We found that socioeconomic indices were negatively correlated with wind velocity, and positively correlated with minimum to average temperatures and air humidity. One possible reason accounting for these findings was that when the level of urbanization was low, cities were not established to a scale that can financially support countermeasures to alleviate air pollution caused jointly by temperature and humidity. The capacity of a city to cope with climate change can be enhanced at later stages of urbanization, resulting in fewer negative impacts of climate change on urbanization.

4.3. Forest Visitors’ Emotional Perceptions under Different Urbanization Levels

Previous studies reported that subjective happiness can grow with the increase in general income level [58]. It was also suggested that urban residents living in small- to medium-size cities tended to report higher levels of happiness [59]. We found that visitors in large-size cities and mega-size cities showed a higher happy score and PEI compared to those metro-size cities. Meanwhile, sad scores of forest visitors were shown to increase with the level of urbanization. This was mainly due to a higher frequency of suffering psychological pressure concerning monthly installments loaned at higher housing prices in more developed cities [60]. In addition, environmental pollution and traffic congestion in larger cities may also have contributed to the perception of negative emotions, which further declined the presented happiness [59,60].
Previous studies showed a significant spatial variability in the positive emotions exhibited by visitors [18,61]. For example, forest visitors in the northern cities of Northeast China showed more positive sentiments than forest visitors in the southern cities [18]. It has been found that people visiting urban forests around the downtown area of a city generally have a higher probability of exhibiting more negative emotions compared to those visiting remote rural forests [22,61]. We noticed that forest visitors in cities in regions of Northeast China had a higher probability of exhibiting positive emotions compared to those visiting other regions. Facial emotions presented by forest visitors were determined by their perceptions towards experiences in forest settings shaped by regional socioeconomic factors. In our study, compared to smaller sized cities, mega-size cities were found to attract more people who showed higher scores of sad emotions and higher PEI. Visiting experiences in forests of mega-size cities were probably accompanied with more green facilities and medical assistance compared to those in smaller cities. This will reassure worries and induce comfortable feelings by perceiving a prompter adjustment to cope with uncertain physical and psychological suddenness. All these factors can be responsible for the higher happy scores shown by people in mega-size cities. The higher sad scores can be accounted for by, as described above, perceptions of greater pressures induced by low household income but high costs.

4.4. Responses of Forest Visitors’ Emotional Perceptions to Combined Socioeconomic Indicators, Air Pollutants, and Meteorological Factors

China is currently experiencing a massive population migration. One of the biggest groups under migration is people with little education, low income, and poor living standards, which, however, account for a large group of newly migrated city dwellers during the process of rapid population growth in large-size cities [59]. This group of migrators is generally more negative in their emotional perceptions, which can be easily recognized from their facial expressions. In detail, their low happiness states were the result of a synthesis of low income, high risk of work, and apparent worry about unemployment [62]. Therefore, the major body of city dwellers showed a lower level of happiness on their faces, which was more apparent in more developed cities [59]. These accord with results found in our study that the decreases in local GDP per capita was associated with a higher frequency to the presented sadness. GDP can account for part of the subjective well-being, but this effect was only significant in the short term [63]. In our study, GDP can be perceived by forest visitors and exposed as sadness on their faces. This was explained by the fact that a high-income population also faces more stressors than lower-income groups, which is easily presented on their faces. In addition, the frequency of showing sadness was lower on faces of visitors in forests of cities with higher total retail sales of social goods. Cities with an activate consumption economy of retail goods do not need the production of heavy industry to support regional economy, which in turn alleviates atmospheric pollution and reduces visitors’ perceptions of sadness [64].
In a specific local forest, tiny changes of temperature in a forest cannot be perceived by visitors, with a rare relationship to exposed emotions [19]. On the national scale, daily records of average temperature can be perceived by people and exposed as remarkable happiness on their faces during experiences in forests. In a thermal comfort range (12–22 °C), temperature was found to be positively correlated with self-reported rates of happiness by forest visitors [23,65]. The sad score was found to proportionally differ with changes in both maximum and minimum temperatures and was inversely proportional to the change in average temperature. This can be explained by the fact that people generally present facial expressions of a more comfortable feeling in a habitat with a mild temperature rather than with extreme temperatures [21]. We did not find any significant effect of air humidity on expressed emotions, which disagrees with previous findings [19]. Our average relative humidity was ~62%, which was higher than the upper limit of the range of 37%–50% that was reported to induce positive physical responses in visitors [39]. Wind velocity tends to be perceptible when humans are sweating [66]. We observed a negative effect of wind velocity on happy scores, sad scores, and PEI. Air pollutants and wind velocity were also found to be negatively correlated. In addition, we also found low wind velocity in economically developed areas. These results together suggest that it is unlikely that wind velocity caused a single effect to modify visitors’ emotional perceptions [20,23]. Thus, we cannot accept our second hypothesis.
Air pollutants can reduce forest visitors’ happiness scores and increase sadness scores [50,67]. Other studies also showed that air pollution can significantly reduce the perception of happiness through self-reported scores [67]. One study explored the extent to which people’s life satisfaction was affected by PM10, where regression analysis showed that every 1 μg/m3 of increase in PM10 would result in a 0.017 of decrease in residents’ life satisfaction [68]. These results also coincide with our results in this study. The decrease in PM10 values increased regressed happy scores and PEI but decreased regressed sad scores. These findings suggest that a decline in PM10 can increase the perception and encourage the presentation of a positive mood in forest visitors. Thus, air pollution can have a direct negative impact on people’s health [69,70]. Air pollution can also trigger depression thus making people have a higher level of negative emotions [4,5]. However, low PM2.5 and AQI can also be perceived by visitors and exposed as high sadness scores. This could be explained by the fact that air pollution needs to be measured by both solid and gaseous pollutants, and that gaseous pollutants also affect visitors’ emotional perceptions. More studies are needed in the future to explore the effect of air pollution on visitors’ emotional perceptions.

4.5. Limitations of the Current Study

Our study has several limitations. First, data we collected had some spatiotemporal limitations. Our dataset included 6309 photos of visitors from 59 urban forests in 42 cities in China in 2020, but this year was accompanied by the COVID pandemic when many visitors chose to wear masks even in the open air. Our study area was established based on the number of photos posted by forest visitors on social media, hence cities that we chose were unlikely to cover all lands in the northwest and most of the southwest parts of China. It will be valuable to conduct another experiment to see if similar results occur, or if there might have been an effect due to circumstances in the 2020 study year.
Second, the accuracy may be compromised because photos posted on social media are conscious expressions of visitors. When facial expression scores are used as a measure of people’s emotional expressions, two types of photos can be used. One type is photos that are taken when people unconsciously take photos, and the other type is photos with subjects consciously thinking about the fact they are being photographed. Data collected in this study belongs to the second type, but more photos in the first type may be a more accurate reflection of emotions from experiences in forests. In addition, while collecting the photos of forest visitors, we may also analyze the questionnaires of the research subjects to obtain a comprehensive and objective understanding of the emotional expressions of forest visitors. In the future, it will be suggested to employ a parallel initiative of multiple research instruments to quantify the emotional expressions of forest visitors comprehensively.
Third, our study focused on the effects of socioeconomic indicators, air pollutants, and geo-meteorological factors on forest visitors’ emotional perceptions, while higher visualized greenery is also responsible for making people in forest environments show more positive emotions than those in urban environments [19]. However, the effect of visualized greenery was not considered in this study. Future research should include the effect of visual greenness as an indicator of forest visitors’ emotional perceptions.

5. Conclusions

In this study, a total of 6309 facial photos of urban forest visitors from 42 cities in China were screened and downloaded from the Sina Weibo platform. Facial recognition by FireFACE was used to obtain the happy score, sad score, neutral score, and PEI of the visitors. This study showed that metro-size cities with populations of 5 to 10 million had the highest air pollutants. Severe air pollutants (doses of above 75 μg/m3 for PM2.5, above 150 μg/m3 for PM10, and above 150 for AQI) were more frequently found in cities in Northeastern and Northern China. Visitors living in large-size cities with populations of 5 to 10 million and mega-size cities with populations of over 10 million were revealed to show the highest positive emotions compared to visitors living in other cities. The positive sentiment of forest visitors was mainly concentrated in the northeast region of China. A Quasi-Poisson regression suggested that forest visitors in Northeast China showed the highest score of happiness with low PM10. Cities at lower longitudes and higher latitudes with a low GDP per capita and low total retail sales but a high GDP with low air pollution, low relative humidity, and low wind velocity but high temperatures had high sad scores. This study used big data to investigate the factors influencing visitors’ emotional perceptions on a large scale, and the results can be used to inform the sustainable development of further cities.

Supplementary Materials

The following supporting information can be downloaded at: https://www.mdpi.com/article/10.3390/f14081571/s1, Table S1: Socioeconomic indicators of the study area; Figure S1: The relationship between facial photos and air pollution.

Author Contributions

Conceptualization, H.W.; methodology, H.W.; software, X.W., L.M. and Y.L.; validation, Y.L.; formal analysis, Y.L.; investigation, X.W.; resources, X.W.; data curation, L.M.; writing—original draft preparation, X.W.; writing—review and editing, H.W.; visualization, X.W.; supervision, H.W.; project administration, H.W.; funding acquisition, H.W. All authors have read and agreed to the published version of the manuscript.

Funding

This research was funded by the National Natural Science Foundation of China (grant numbers 41971122; 41861017; 31600496) and Chinese Academy of Sciences (the Strategic Priority Research Program, grant number XDA23070503).

Data Availability Statement

Data is unavailable due to privacy or ethical restrictions.

Acknowledgments

Students who helped collecting facial photos of park visitors are totally acknowledged. Experts who provided suggestions for this paper were gratefully acknowledged. Authors feel grateful to editors and reviewers who gave insightful comments on this manuscript to promote its quality from an earlier edition. Richard Hauer is greatly appreciated for his generous contribution to the English edits in the final version that is published.

Conflicts of Interest

The authors declare no conflict of interest. The funders had no role in the design of the study.

References

  1. Geng, G.N.; Zheng, Y.X.; Zhang, Q.; Xue, T.; Zhao, H.Y.; Tong, D.; Zheng, B.; Li, M.; Liu, F.; Hong, C.P.; et al. Drivers of PM2.5 air pollution deaths in China 2002–2017. Nat. Geosci. 2021, 14, 645–650. [Google Scholar] [CrossRef]
  2. Wang, S.J.; Zhou, C.S.; Wang, Z.B.; Feng, K.S.; Hubacek, K. The characteristics and drivers of fine particulate matter (PM2.5) distribution in China. J. Clean Prod. 2017, 142, 1800–1809. [Google Scholar] [CrossRef]
  3. West, J.J.; Cohen, A.; Dentener, F.; Brunekreef, B.; Zhu, T.; Armstrong, B.; Bell, M.L.; Brauer, M.; Carmichael, G.; Costa, D.L.; et al. What We Breathe Impacts Our Health: Improving Understanding of the Link between Air Pollution and Health. Environ. Sci. Technol. 2016, 50, 4895–4904. [Google Scholar] [CrossRef] [Green Version]
  4. Zheng, S.Q.; Wang, J.H.; Sun, C.; Zhang, X.N.; Kahn, M.E. Air pollution lowers Chinese urbanites’ expressed happiness on social media. Nat. Hum. Behav. 2019, 3, 237–243. [Google Scholar] [CrossRef] [PubMed]
  5. Ji, H.M.; Wang, J.; Meng, B.; Cao, Z.; Yang, T.; Zhi, G.Q.; Chen, S.Y.; Wang, S.H.; Zhang, J.Q. Research on adaption to air pollution in Chinese cities: Evidence from social media-based health sensing. Environ. Res. 2022, 210, 11. [Google Scholar] [CrossRef]
  6. Chen, F.; Zhang, X.; Chen, Z. Air pollution and mental health: Evidence from China Health and Nutrition Survey. J. Asian Econ. 2023, 86, 101611. [Google Scholar] [CrossRef]
  7. Bi, X.H.; Dai, Q.L.; Wu, J.H.; Zhang, Q.; Zhang, W.H.; Luo, R.X.; Cheng, Y.; Zhang, J.Y.; Wang, L.; Yu, Z.J.; et al. Characteristics of the main primary source profiles of particulate matter across China from 1987 to 2017. Atmos. Chem. Phys. 2019, 19, 3223–3243. [Google Scholar] [CrossRef] [Green Version]
  8. Fan, H.; Zhao, C.F.; Yang, Y.K. A comprehensive analysis of the spatio-temporal variation of urban air pollution in China during 2014–2018. Atmos. Environ. 2020, 220, 12. [Google Scholar] [CrossRef]
  9. Sarrat, C.; Lemonsu, A.; Masson, V.; Guedalia, D. Impact of urban heat island on regional atmospheric pollution. Atmos. Environ. 2006, 40, 1743–1758. [Google Scholar] [CrossRef]
  10. Tiwari, S.; Srivastava, A.K.; Bisht, D.S.; Parmita, P.; Srivastava, M.K.; Attri, S.D. Diurnal and seasonal variations of black carbon and PM2.5 over New Delhi, India: Influence of meteorology. Atmos. Res. 2013, 125, 50–62. [Google Scholar] [CrossRef]
  11. Cogliani, E. Air pollution forecast in cities by an air pollution index highly correlated with meteorological variables. Atmos. Environ. 2001, 35, 2871–2877. [Google Scholar] [CrossRef]
  12. Li, Y.; Guan, D.; Yu, Y.; Westland, S.; Wang, D.; Meng, J.; Wang, X.; He, K.; Tao, S. A psychological measurement on subjective well-being and air pollution. Nature Comm. 2019, 10, 5473. [Google Scholar] [CrossRef] [Green Version]
  13. Escobedo, F.J.; Wagner, J.E.; Nowak, D.J.; De la Maza, C.L.; Rodriguez, M.; Crane, D.E. Analyzing the cost effectiveness of Santiago, Chile’s policy of using urban forests to improve air quality. J. Environ. Manag. 2008, 86, 148–157. [Google Scholar] [CrossRef] [PubMed]
  14. Xu, C.; Dong, L.; Yu, C.; Zhang, Y.; Cheng, B. Can forest city construction affect urban air quality? The evidence from the Beijing-Tianjin-Hebei urban agglomeration of China. J. Clean Prod. 2020, 264, 121607. [Google Scholar] [CrossRef]
  15. Yuan, L.; Shin, K.; Managi, S. Subjective Well-being and Environmental Quality: The Impact of Air Pollution and Green Coverage in China. Ecol. Econ. 2018, 153, 124–138. [Google Scholar] [CrossRef]
  16. Wei, H.X.; Hauer, R.J.; Guo, S.L. Daytime dynamic of spontaneous expressions of pedestrians in an urban forest park. Urban For. Urban Green. 2021, 65, 10. [Google Scholar] [CrossRef]
  17. Liu, P.; Liu, M.N.; Xia, T.T.; Wang, Y.T.; Wei, H.X. Can Urban Forest Settings Evoke Positive Emotion? Evidence on Facial Expressions and Detection of Driving Factors. Sustainability 2021, 13, 8687. [Google Scholar] [CrossRef]
  18. Wei, H.X.; Hauer, R.J.; Chen, X.; He, X.Y. Facial Expressions of Visitors in Forests along the Urbanization Gradient: What Can We Learn from Selfies on Social Networking Services? Forests 2019, 10, 1049. [Google Scholar] [CrossRef] [Green Version]
  19. Wei, H.X.; Ma, B.Q.; Hauer, R.J.; Liu, C.Y.; Chen, X.; He, X.Y. Relationship between environmental factors and facial expressions of visitors during the urban forest experience. Urban For. Urban Green. 2020, 53, 10. [Google Scholar] [CrossRef]
  20. Mao, B.; Liang, F.; Li, Z.Z.; Zheng, W.Q. Microclimates Potentially Shape Spatial Distribution of Facial Expressions for Urban Forest Visitors: A Regional Study of 30 Parks in North China. Sustainability 2022, 14, 1648. [Google Scholar] [CrossRef]
  21. Li, Y.J.; Sun, Y.X.; Zhao, Y.; Wang, Y.; Cheng, S.P. Mapping seasonal sentiments of people visiting blue spaces in urban wetlands: A pilot study on inland cities of China. Front. Ecol. Evol. 2022, 10, 18. [Google Scholar] [CrossRef]
  22. Wei, H.X.; Hauer, R.J.; Sun, Y.X.; Meng, L.Q.; Guo, P. Emotional perceptions of people exposed to green and blue spaces in forest parks of cities at rapid urbanization regions of East China. Urban For. Urban Green. 2022, 78, 16. [Google Scholar] [CrossRef]
  23. Li, H.Y.; Wang, X.G.; Wei, H.X.; Xia, T.T.; Liu, M.N.; Ai, S.S. Geographical Distribution and Driving Meteorological Forces of Facial Expressions of Visitors in Urban Wetland Parks in Eastern China. Front. Earth Sci. 2022, 10, 13. [Google Scholar] [CrossRef]
  24. He, Q.; Wang, Y.; Qiu, Q.; Su, Y.; Wang, Y.; Wei, H.X.; Li, J.Y. Joint effects of air PM2.5 and socioeconomic dimensions on posted emotions of urban green space visitors in cities experiencing population urbanization: A pilot study on 50 cities of East China. Sci. Total Environ. 2023, 861, 160607. [Google Scholar] [CrossRef]
  25. He, J.J.; Gong, S.L.; Yu, Y.; Yu, L.J.; Wu, L.; Mao, H.J.; Song, C.B.; Zhao, S.P.; Liu, H.L.; Li, X.Y.; et al. Air pollution characteristics and their relation to meteorological conditions during 2014-2015 in major Chinese cities. Environ. Pollut. 2017, 223, 484–496. [Google Scholar] [CrossRef]
  26. Wang, X.Y.; Dickinson, R.E.; Su, L.Y.; Zhou, C.L.E.; Wang, K.C. PM2.5 Pollution In China And How It Has Been Exacerbated By Terrain And Meteorological Conditions. Bull. Amer. Meteorol. Soc. 2018, 99, 105–120. [Google Scholar] [CrossRef]
  27. Chen, Z.Y.; Xie, X.M.; Cai, J.; Chen, D.L.; Gao, B.B.; He, B.; Cheng, N.L.; Xu, B. Understanding meteorological influences on PM2.5 concentrations across China: A temporal and spatial perspective. Atmos. Chem. Phys. 2018, 18, 5343–5358. [Google Scholar] [CrossRef] [Green Version]
  28. Pendergrass, D.C.; Shen, L.; Jacob, D.J.; Mickley, L.J. Predicting the Impact of Climate Change on Severe Wintertime Particulate Pollution Events in Beijing Using Extreme Value Theory. Geophys. Res. Lett. 2019, 46, 1824–1830. [Google Scholar] [CrossRef] [Green Version]
  29. Zhao, S.P.; Yin, D.Y.; Yu, Y.; Kang, S.C.; Qin, D.H.; Dong, L.X. PM2.5 and O-3 pollution during 2015-2019 over 367 Chinese cities: Spatiotemporal variations, meteorological and topographical impacts. Environ. Pollut. 2020, 264, 10. [Google Scholar] [CrossRef]
  30. Song, C.B.; Wu, L.; Xie, Y.C.; He, J.J.; Chen, X.; Wang, T.; Lin, Y.C.; Jin, T.S.; Wang, A.X.; Liu, Y.; et al. Air pollution in China: Status and spatiotemporal variations. Environ. Pollut. 2017, 227, 334–347. [Google Scholar] [CrossRef]
  31. Wang, Y.G.; Ying, Q.; Hu, J.L.; Zhang, H.L. Spatial and temporal variations of six criteria air pollutants in 31 provincial capital cities in China during 2013–2014. Environ. Int. 2014, 73, 413–422. [Google Scholar] [CrossRef] [PubMed]
  32. Liu, H.M.; Fang, C.L.; Zhang, X.L.; Wang, Z.Y.; Bao, C.; Li, F.Z. The effect of natural and anthropogenic factors on haze pollution in Chinese cities: A spatial econometrics approach. J. Clean Prod. 2017, 165, 323–333. [Google Scholar] [CrossRef]
  33. Chen, J.D.; Wang, B.; Huang, S.; Song, M.L. The influence of increased population density in China on air pollution. Sci. Total Environ. 2020, 735, 13. [Google Scholar] [CrossRef] [PubMed]
  34. The State Council of the People’s Republic of China. China to Apply New City Classification Standards. Available online: http://english.www.gov.cn/policies/latest_releases/2014/11/25/content_281475015213546.htm (accessed on 20 November 2022).
  35. Wei, H.X.; Hauer, R.J.; He, X.Y. A forest experience does not always evoke positive emotion: A pilot study on unconscious facial expressions using the face reading technology. For. Policy Econ. 2021, 123, 9. [Google Scholar] [CrossRef]
  36. China National Environmental Monitoring Centre. China National Environmental Monitoring Centre. Available online: http://www.cnemc.cn/ (accessed on 16 July 2023).
  37. National Meteorological Information Centre. China Meteorological Data Service Centre. Available online: http://data.cma.cn/en (accessed on 16 July 2023).
  38. Kruskal, W.H.; Wallis, W.A. Use of ranks in one-criterion variance analysis. J. Am. Stat. Assoc. 1952, 47, 583–621. [Google Scholar] [CrossRef]
  39. An, B.Y.; Wang, D.; Liu, X.J.; Guan, H.M.; Wei, H.X.; Ren, Z.B. The effect of environmental factors in urban forests on blood pressure and heart rate in university students. J. For. Res. 2019, 24, 27–34. [Google Scholar] [CrossRef]
  40. Bielinis, E.; Takayama, N.; Boiko, S.; Omelan, A.; Bielinis, L. The effect of winter forest bathing on psychological relaxation of young Polish adults. Urban For. Urban Green. 2018, 29, 276–283. [Google Scholar] [CrossRef]
  41. Huo, T.F.; Li, X.H.; Cai, W.G.; Zuo, J.; Jia, F.Y.; Wei, H.F. Exploring the impact of urbanization on urban building carbon emissions in China: Evidence from a provincial panel data model. Sustain. Cities Soc. 2020, 56, 11. [Google Scholar] [CrossRef]
  42. Liu, H.M.; Cui, W.J.; Zhang, M. Exploring the causal relationship between urbanization and air pollution: Evidence from China. Sustain. Cities Soc. 2022, 80, 12. [Google Scholar] [CrossRef]
  43. Bloom, D.E.; Canning, D.; Fink, G. Urbanization and the wealth of nations. Science 2008, 319, 772–775. [Google Scholar] [CrossRef] [Green Version]
  44. Lin, B.Q.; Zhu, J.P. Changes in urban air quality during urbanization in China. J. Clean Prod. 2018, 188, 312–321. [Google Scholar] [CrossRef]
  45. Zhang, N.; Gong, M.Y. Economic and environmental outcomes of economic transition: Evidence from a quasi-experiment in China. J. Asian Econ. 2022, 80, 11. [Google Scholar] [CrossRef]
  46. Maji, K.J.; Ye, W.F.; Arora, M.; Nagendra, S.M.S. PM2.5-related health and economic loss assessment for 338 Chinese cities. Environ. Int. 2018, 121, 392–403. [Google Scholar] [CrossRef]
  47. Xie, Y.; Dai, H.C.; Zhang, Y.X.; Wu, Y.Z.; Hanaoka, T.; Masui, T. Comparison of health and economic impacts of PM2.5 and ozone pollution in China. Environ. Int. 2019, 130, 12. [Google Scholar] [CrossRef]
  48. Zhu, W.W.; Wang, M.C.; Zhang, B.B. The effects of urbanization on PM2.5 concentrations in China’s Yangtze River Economic Belt: New evidence from spatial econometric analysis. J. Clean Prod. 2019, 239, 11. [Google Scholar] [CrossRef]
  49. Zhang, Q.; Zheng, Y.X.; Tong, D.; Shao, M.; Wang, S.X.; Zhang, Y.H.; Xu, X.D.; Wang, J.N.; He, H.; Liu, W.Q.; et al. Drivers of improved PM2.5 air quality in China from 2013 to 2017. Proc. Natl. Acad. Sci. USA 2019, 116, 24463–24469. [Google Scholar] [CrossRef] [Green Version]
  50. Zhang, X.; Zhang, X.B.; Chen, X. Valuing Air Quality Using Happiness Data: The Case of China. Ecol. Econ. 2017, 137, 29–36. [Google Scholar] [CrossRef] [PubMed]
  51. Shen, Y.; Zhang, L.P.; Fang, X.; Ji, H.Y.; Li, X.; Zhao, Z.W. Spatiotemporal patterns of recent PM2.5 concentrations over typical urban agglomerations in China. Sci. Total Environ. 2019, 655, 13–26. [Google Scholar] [CrossRef] [PubMed]
  52. Lu, W.; Tam, V.W.Y.; Du, L.; Chen, H. Impact of industrial agglomeration on haze pollution: New evidence from Bohai Sea Economic Region in China. J. Clean Prod. 2021, 280, 14. [Google Scholar] [CrossRef]
  53. Yin, S.; Wang, X.F.; Zhang, X.R.; Zhang, Z.X.; Xiao, Y.; Tani, H.; Sun, Z.Y. Exploring the effects of crop residue burning on local haze pollution in Northeast China using ground and satellite data. Atmos. Environ. 2019, 199, 189–201. [Google Scholar] [CrossRef]
  54. Gadde, B.; Bonnet, S.; Menke, C.; Garivait, S. Air pollutant emissions from rice straw open field burning in India, Thailand and the Philippines. Environ. Pollut. 2009, 157, 1554–1558. [Google Scholar] [CrossRef]
  55. Karl, T.R.; Diaz, H.F.; Kukla, G. Urbanization: Its Detection and Effect in the United States Climate Record. J. Clim. 1988, 1, 1099–1123. [Google Scholar] [CrossRef]
  56. Fan, J.L.; Hu, J.W.; Zhang, X. Impacts of climate change on electricity demand in China: An empirical estimation based on panel data. Energy 2019, 170, 880–888. [Google Scholar] [CrossRef]
  57. Cai, X.Q.; Lu, Y.; Wang, J. The impact of temperature on manufacturing worker productivity: Evidence from personnel data. J. Comp. Econ. 2018, 46, 889–905. [Google Scholar] [CrossRef]
  58. Cai, H.J.; Yuan, J.Q.; Su, Z.; Wang, X.O.; Huang, Z.H.; Jing, Y.M.; Yang, Z.Y. Does Economic Growth Raise Happiness in China? A Comprehensive Reexamination. Soc. Psychol. Pers. Sci. 2022, 11, 238–248. [Google Scholar] [CrossRef]
  59. Dang, Y.X.; Chen, L.; Zhang, W.Z.; Zheng, D.; Zhan, D.S. How does growing city size affect residents’ happiness in urban China? A case study of the Bohai rim area. Habitat Int. 2020, 97, 9. [Google Scholar] [CrossRef]
  60. Zhan, D.S.; Kwan, M.P.; Zhang, W.Z.; Chen, L.; Dang, Y.X. The impact of housing pressure on subjective well-being in urban China. Habitat Int. 2022, 127, 10. [Google Scholar] [CrossRef]
  61. Song, C.R.; Ikei, H.; Kobayashi, M.; Miura, T.; Taue, M.; Kagawa, T.; Li, Q.; Kumeda, S.; Imai, M.; Miyazaki, Y. Effect of Forest Walking on Autonomic Nervous System Activity in Middle-Aged Hypertensive Individuals: A Pilot Study. Int. J. Environ. Res. Public Health 2015, 12, 2687–2699. [Google Scholar] [CrossRef] [PubMed] [Green Version]
  62. Morgan, R.; Wang, F. Well-Being in Transition: Life Satisfaction in Urban China from 2002 to 2012. J. Happiness Stud. 2019, 20, 2609–2629. [Google Scholar] [CrossRef]
  63. Easterlin, R.A.; McVey, L.A.; Switek, M.; Sawangfa, O.; Zweig, J.S. The happiness-income paradox revisited. Proc. Natl. Acad. Sci. USA 2010, 107, 22463–22468. [Google Scholar] [CrossRef] [PubMed]
  64. Deng, G.Y.; Ding, Y.F.; Ren, S.L. The study on the air pollutants embodied in goods for consumption and trade in China—Accounting and structural decomposition analysis. J. Clean Prod. 2016, 135, 332–341. [Google Scholar] [CrossRef]
  65. Jeong, M.A.; Park, S.; Song, G.S. Comparison of human thermal responses between the urban forest area and the central building district in Seoul, Korea. Urban For. Urban Green. 2016, 15, 133–148. [Google Scholar] [CrossRef]
  66. Hoppe, P. The physiological equivalent temperature—A universal index for the biometeorological assessment of the thermal environment. Int. J. Biometeorol. 1999, 43, 71–75. [Google Scholar] [CrossRef]
  67. Song, Y.; Zhou, A.; Zhang, M.; Wang, H. Assessing the effects of haze pollution on subjective well-being based on Chinese General Social Survey. J. Clean Prod. 2019, 235, 574–582. [Google Scholar] [CrossRef]
  68. Orru, K.; Orru, H.; Maasikmets, M.; Hendrikson, R.; Ainsaar, M. Well-being and environmental quality: Does pollution affect life satisfaction? Qual. Life Res. 2016, 25, 699–705. [Google Scholar] [CrossRef]
  69. Wang, Y.; Yang, Y.; Huang, S.; Huang, L.; Sun, W.J. Effects of air quality and weather conditions on Chinese tourists’ emotional experience. J. Hosp. Tour. Manag. 2021, 48, 1–9. [Google Scholar] [CrossRef]
  70. Zhang, X.; Chen, X.; Zhang, X.B. The impact of exposure to air pollution on cognitive performance. Proc. Natl. Acad. Sci. USA 2018, 115, 9193–9197. [Google Scholar] [CrossRef] [Green Version]
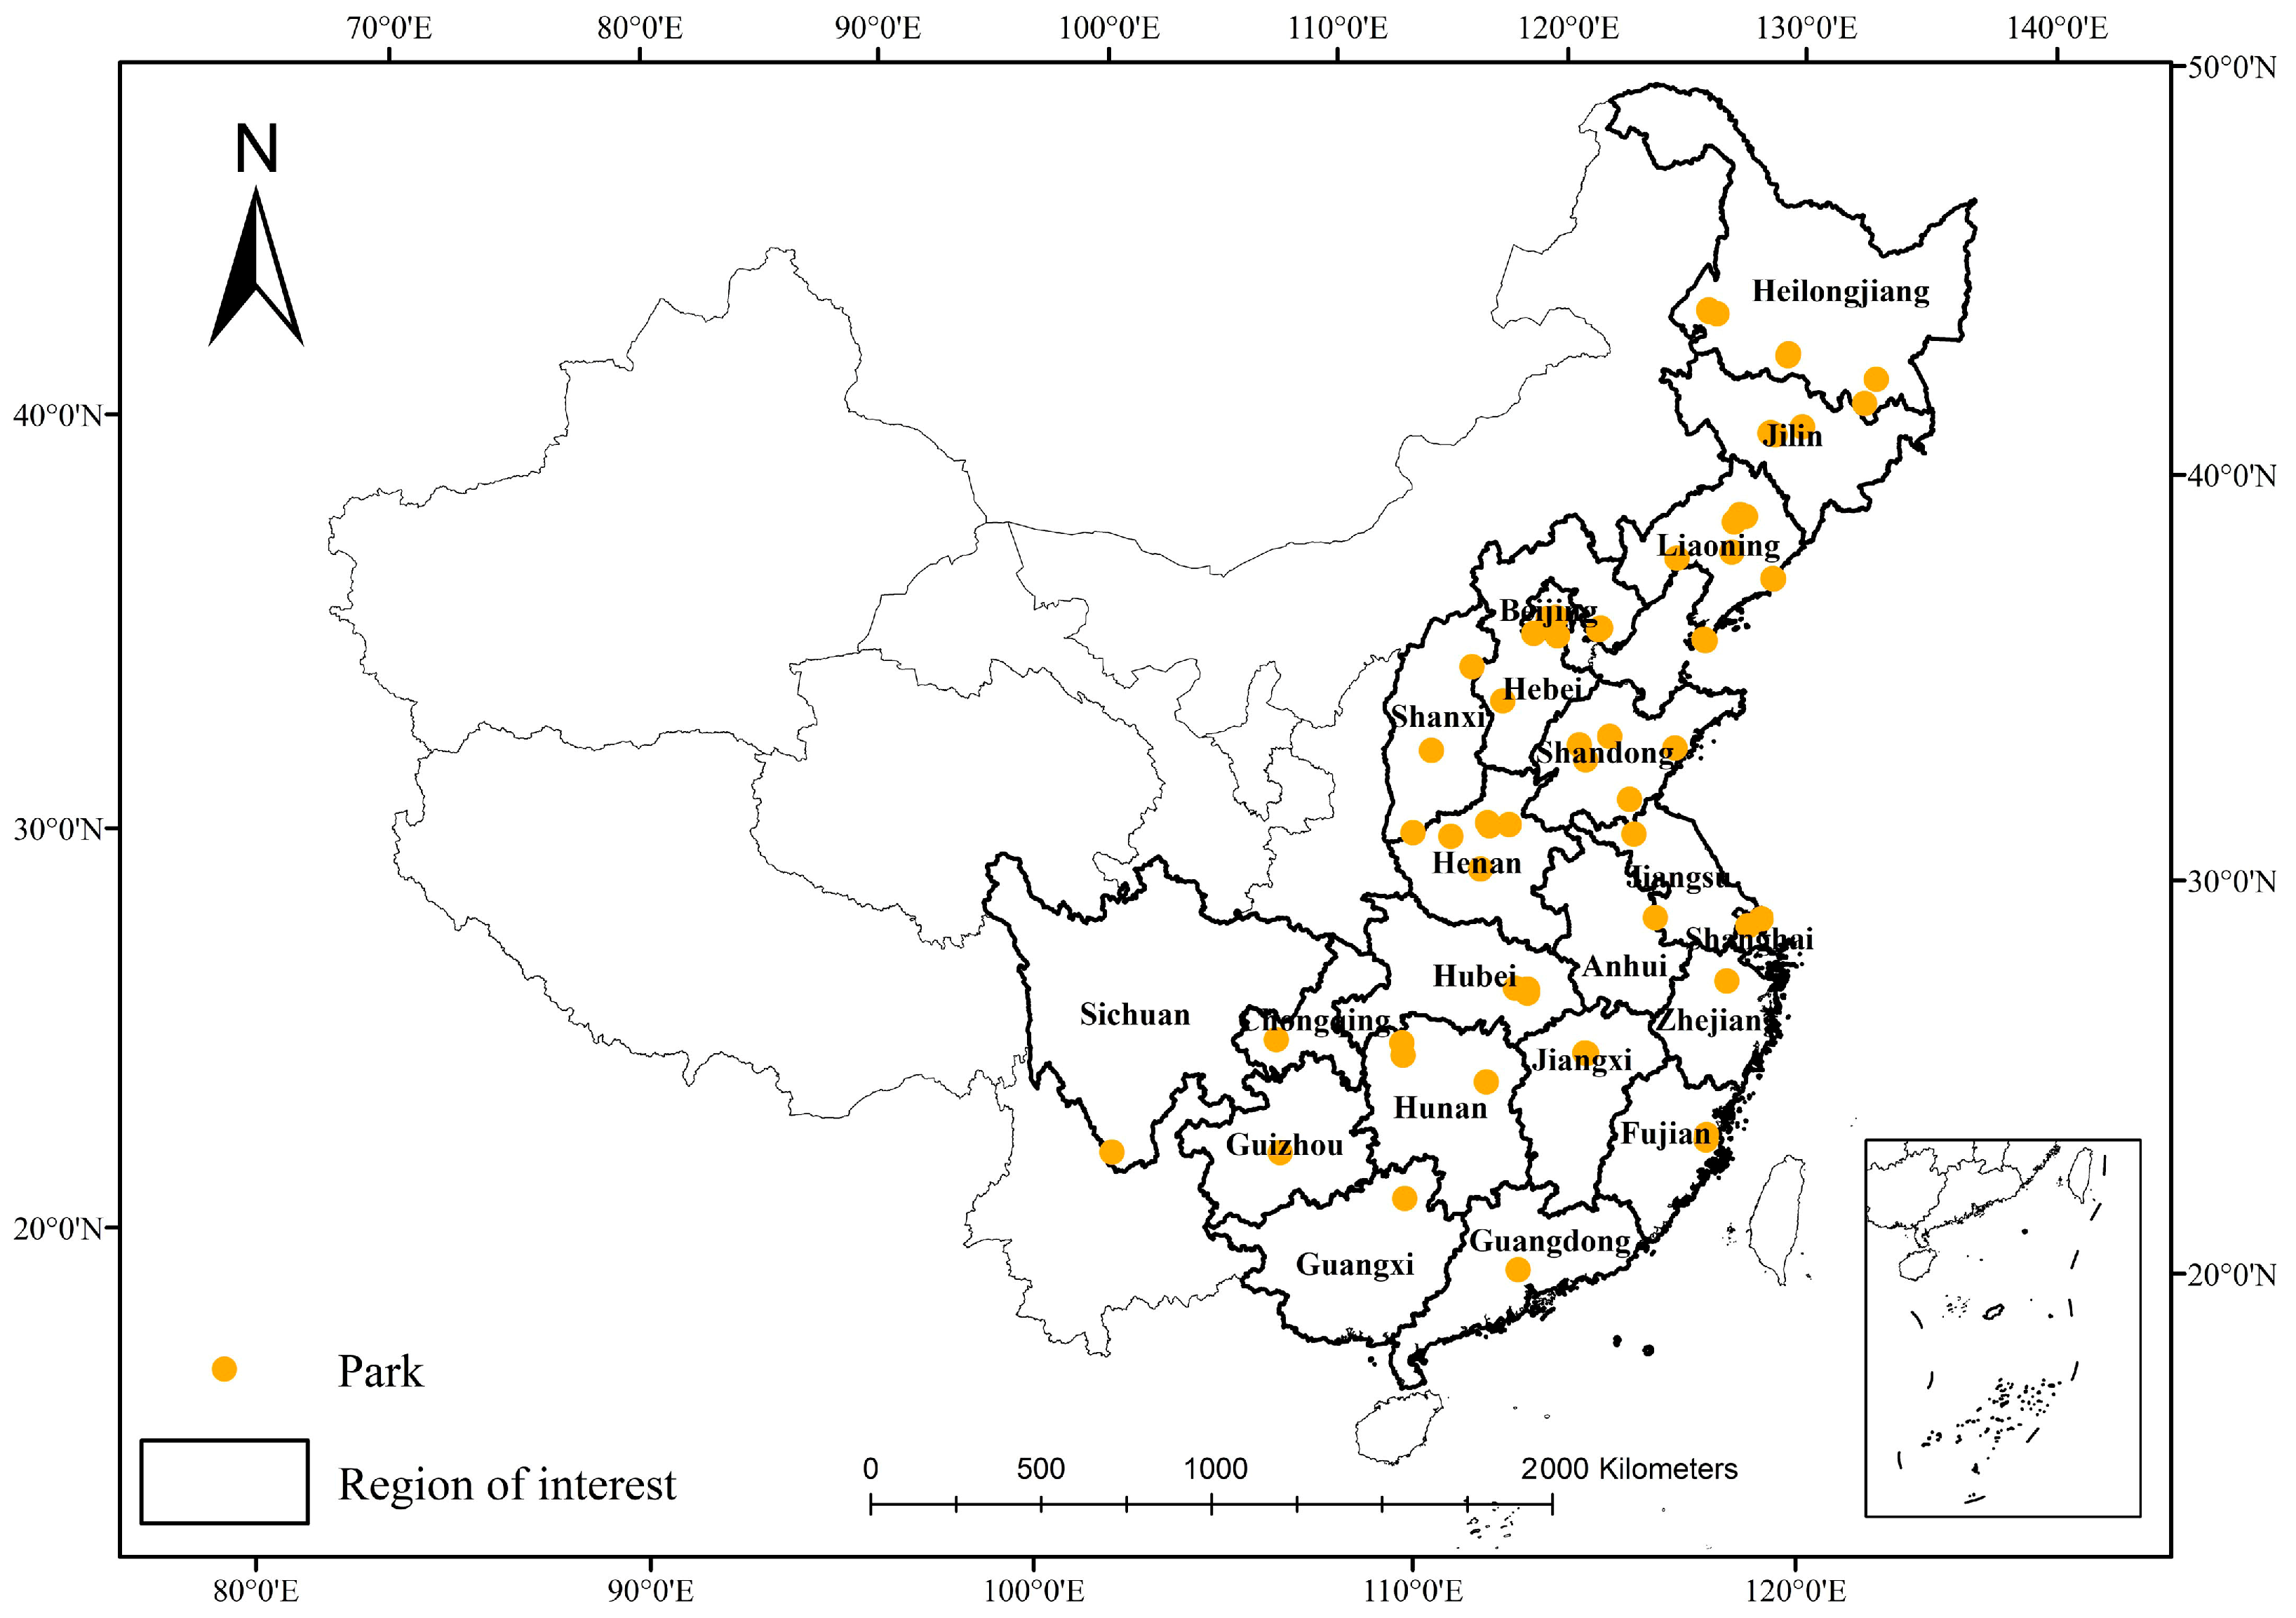
Figure 1. Distribution of cities with objective urban forests in the study area.
Forests 14 01571 g001
Figure 2. Spatial interpolation maps of PM2.5 (A), PM10 (B), and AQI (C) based on different urbanization levels.
Forests 14 01571 g002
Figure 3. Spatial interpolation maps of maximum temperature (A), minimum temperature (B), average temperature (C), average relative humidity (D), and average wind velocity (E) based on different urbanization levels.
Forests 14 01571 g003
Figure 4. Spearman correlation between different socioeconomic indicators, air pollutants, and meteorological factors. Larger circles indicate stronger correlation, darker blue means stronger positive correlation, and darker red means stronger negative correlation. The asterisks indicate the statistical p-value. ‘**’ p < 0.01; ‘*’ p < 0.05.
Forests 14 01571 g004
Figure 5. Spatial interpolation maps of happy score (A), sad score (B), neutral score (C), and PEI (D) based on different levels of urbanization.
Forests 14 01571 g005
Table 1. Parameter estimation analysis of the effects of independent variables such as socioeconomic indicators, air pollutants, and meteorological factors of the happy score regressed by Quasi-Poisson regression.
Independent VariablesEstimateStd. Errort ValuePr(>|t|)
Intercept4.640.3015.66<2 × 10⁻¹⁶***
PM10−1.38 × 10−33.28 × 10−4−4.212.54 × 10−5***
Longitude−9.19 × 10−33.04 × 10−3−3.032.48 × 10−3**
Latitude8.51× 10−32.81 × 10−33.022.50 × 10−3**
The asterisks indicate the statistical p-value. ‘***’ p < 0.001; ‘**’ p < 0.01.
Table 2. Parameter estimation analysis of the effects of independent variables such as socioeconomic indicators, air pollutants, and meteorological factors of the sad score regressed by Quasi-Poisson regression.
Independent VariablesEstimateStd. Errort ValuePr(>|t|)
Intercept7.933.50 × 10−122.64<2 × 10⁻¹⁶***
PM2.5−2.95 × 10−31.17 × 10−3−2.531.13 × 10−2*
PM101.90 × 10−37.33 × 10−42.599.53 × 10−3**
AQI−1.98 × 10−37.06 × 10−4−2.814.99 × 10−3**
Longitude−4.12 × 10−23.84 × 10−3−10.73<2 × 10⁻¹⁶***
Latitude−2.05 × 10−23.52 × 10−3−5.816.49 × 10−9***
Maximum temperature5.16 × 10−29.35 × 10−35.513.66 × 10−8***
Minimum temperature2.12 × 10−29.68 × 10−32.192.87 × 10−2*
Average temperature−6.22 × 10−21.73 × 10−2−3.603.27 × 10−4***
Average relative humidity−2.23 × 10−39.57 × 10−4−2.331.98 × 10−2 *
Average wind velocity−2.29 × 10−28.02 × 10−3−2.854.35 × 10−3**
GDP2.26 × 10−41.46 × 10−515.50<2 × 10⁻¹⁶***
GDP per capita−7.84× 10−66.15 × 10−7−12.76<2 × 10⁻¹⁶***
Total retail sales of social consumer goods−4.34 × 10−43.66 × 10−5−11.85<2 × 10⁻¹⁶***
The asterisks indicate the statistical p-value. ‘***’ p < 0.001; ‘**’ p < 0.01; ‘*’ p < 0.05.
Table 3. Parameter estimation analysis of the effects of independent variables such as socioeconomic indicators, air pollutants, and meteorological factors on the neutral score regressed by Quasi-Poisson regression.
Independent VariablesEstimateStd. Errort ValuePr(>|t|)
Intercept3.722.05 × 10−2181.77<2 × 10⁻¹⁶***
PM109.38 × 10−42.60 × 10−43.613.12 × 10−4***
The asterisks indicate the statistical p-value. ‘***’ p < 0.001.
Table 4. Parameter estimation analysis of the effects of independent variables such as socioeconomic indicators, air pollutants, and meteorological factors on PEI regressed by Quasi-Poisson regression.
Independent VariablesEstimateStd. Errort ValuePr(>|t|)
Intercept5.231.26 × 10−141.49<2 × 10⁻¹⁶***
PM10−5.44 × 10−41.36 × 10−4−4.006.55 × 10−5***
Longitude−3.82 × 10−31.29 × 10−3−2.972.97 × 10−3**
Latitude3.80 × 10−31.18 × 10−33.211.32 × 10−3**
The asterisks indicate the statistical p-value. ‘***’ p < 0.001; ‘**’ p < 0.01.
Disclaimer/Publisher’s Note: The statements, opinions and data contained in all publications are solely those of the individual author(s) and contributor(s) and not of MDPI and/or the editor(s). MDPI and/or the editor(s) disclaim responsibility for any injury to people or property resulting from any ideas, methods, instructions or products referred to in the content.