Abstract
This study was conducted in the territory of the industrial site of the Udachny Mining and Processing Division (Yakutia, northeast Russia). The objects of study were permafrost soils and two species of shrubs (Betula middendorffii T. and Duschekia fruticose R.). Soil and plant samples were analyzed using atomic absorption spectrometry for the presence of PTEs (Pb, Ni, Mn, Cd, Co, Cr, Zn, Cu, and As). The bioaccumulation factor (BAF), frequency of occurrence (Hi), pollution index (PI), and pollution load index (PLI) were calculated. The PI and PLI are calculated for both soil and two plant species for the first time in this study. The results showed that the soils have a high Ni, Cr, Co, As, and Mn content. It has been established that high soil pollution naturally leads to an increase in the concentration of elements in the leaves of shrubs. The soils and vegetation are dominated by elements associated with trap magmatism—Cr, Co, Cu, and dolerite dikes—Mn and Zn. For Betula middendorffii, the PLI was classified as unpolluted to moderately polluted, and Duschekia fruticosa. was classified as unpolluted. The high level of contamination is typical for areas located near industrial sites, such as waste dumps, kimberlite pipes, tailings ponds, and roads. The BAF results confirmed that the leaves of Betula middendorffii are able to accumulate more PTEs and have the highest level of resistance to PTE contamination in mining environments. This analysis showed that the consistent application of the PI, PLI, and BAF indices is very efficient in the ecological and biogeochemical assessment of the situation in industrial development areas.
1. Introduction
Metals and metalloid ions constitute a natural part of the Earth and are found in the different layers that compose it. However, when their levels are detected in high concentrations, it can lead to toxicity for many forms of life (microorganisms, plants, animals, and humans) [1,2]. Contamination with potentially toxic elements (PTEs) may originate from soil parent material (lithogenic source) and/or various anthropogenic sources [3,4,5]. To the natural presence in the environment, human activity significantly contributes to the release of PTEs from natural sources, causing contamination of the components of the natural environment [6,7,8,9]. Industrial activities are considered to be the major source of PTEs that accumulate in the environment and reach toxic levels, thereby causing health risks and adversely affecting ecosystems [10]. For example, soils at industrial sites may have distinct groups of PTE contaminants that depend on the respective industries and their raw materials and products [11,12].
Metal contaminants in soil can be absorbed by plants through their roots and vascular system [13,14], and airborne PTEs can be deposited and absorbed on the foliage [15,16]. The bioavailability of PTEs is primarily influenced by the soil’s physicochemical properties [17] and plant species [18]. Since PTEs are resistant and stay in the plant for a long time, they may pose a potential threat [19,20].
In terms of the diversity, quantity, and quality of minerals, Yakutia is considered to be one of the leaders. It makes a significant contribution to the mineral resource base of the country, which is the economic backbone of the entire Russian economy. There are 2959 officially registered deposits of diamonds, gold, coal, natural gas, ferrous, non-ferrous, rare metals, tin, etc. The most important ones are the deposits of diamonds (82% of Russia’s reserves), antimony (82%), and uranium (61%). The republic also possesses 47% of explored coal reserves and 35% of natural gas and oil in Eastern Siberia and the Far East. As a result of the active development of the territory of Yakutia, soil resources have been degraded to varying degrees, and significant areas of natural landscapes have been completely destroyed and polluted [21]. Therefore, much attention is paid to the pollution problem in this territory. Thus, the purpose of this study is to assess the contamination of surface soils by PTEs in the industrial area of the Udachny Mining and Processing Division (Udachny MPD) and estimate the content of PTEs in plants growing in the study area. It is expected that the study will provide baseline data regarding the distribution, accumulation, and potential sources of PTEs in surface soils and plants in the zone of influence of mining areas.
2. Materials and Methods
2.1. Research Area
The studies were conducted in the central part of the Daldyn-Alakit mining area northwest of Yakutia (northeast Russia) in the territory of the Daldyn kimberlite field (N 66°25′47″; E 112°24′07″) (Figure 1).
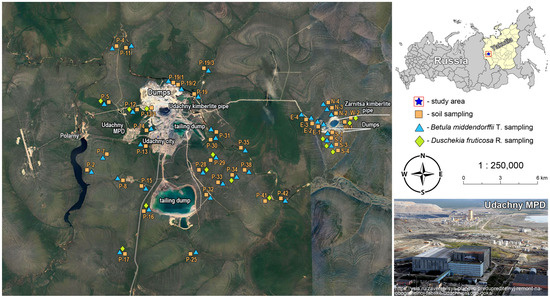
Figure 1.
Sampling sites, Udachny Mining and Processing Division.
One of the largest industrial enterprises in Yakutia, known as the Udachny Mining and Processing Division of the ALROSA Company, which has existed since 1971, is located within the Daldyn kimberlite field. The Udachny MPD is developing two primary diamond deposits: the Udachny and Zarnitsa kimberlite pipes. The Udachny kimberlite pipe is located 15 km from the city of Udachny. Since 2014, mining has been performed by the closed method. The Zarnitsa kimberlite pipe is located in the same kimberlite field and is located 18 km from the city. Mining is carried out by the open-pit method. Emissions into the atmosphere from the Udachny MPD increased from 1.36 thousand tons in 2005 to 3.85 thousand tons in 2020 [22].
The territory is located within the eastern part of the Vilyui high plain of the Central Siberian plateau. The absolute values of watersheds vary from 655 to 755 m. The relief of the trap plateau is hilly and gently sloping with an absolute elevation of 400–500 m and a relative elevation above the nearest watercourses of 100–250 m [23].
The climate is sharply continental, which is manifested in large annual fluctuations of air temperature and relatively low precipitation. The mean annual temperature is 12.7 °C, and the amplitude of the maximum and minimum monthly mean is from −41.6 to 14.8 °C. The difference in mean temperatures between the cold and warm seasons is very large and ranges from 34 to −64 °C. The mean annual precipitation is 200–250 mm, and 75%–80% falls during the warm season (from April to October). Snow cover persists for 220–250 days a year, and its height is not great [24].
The territory of the Daldyno-Alakit area is located in the zone of continuous distribution and close permafrost occurrence. The peculiarities and thickness of its structure are different in different climatic zones. The permafrost thickness is determined to be 250–400 m. As the thickness of the active horizon increases, if additional soil moisture is excluded, soils from the surface dry out noticeably, which, in turn, affects the structure and floristic composition of the ground cover and forest stand [25].
The vegetation cover of the study area is located in the subzone of sparsely standing northern taiga larch forests. Larch forests dominate, occupying 80% of the territory, and are represented by types such as Lárix gmélinii, Betula middendorffii T., Duschekia fruticosa R., Vaccinium vitis-idaea L., Ledum palustre L., Vaccinium vitis-idaea L., Vaccinium uliginosum L., Vaccinium vitis-idaea L., Ledum palustre L., Aulacomnium palustre, Vaccinium uliginosum L., Aulacomnium palustre, Ledum palustre L., and Sphagnum angustifolium [26,27].
Therefore, the soils of the Daldyno-Alakitskii district belong to the East Siberian permafrost taiga zone of the boreal (moderately cold) soil belt of Russia. Cryosols occupy 40.7% as part of the total area of the soil cover. Fluvisols are an intrazonal type of soil and within this territory are located on 19.4% of the area. Rendzic leptosols and umbric gleysols are subtypes of soils [25,28].
2.2. Soil Sampling and Analyses
The samples of soil were taken in the vicinity of the industrial area of Udachny MPD, in view of the source of the PTE emissions in the study area (near the kimberlite pipe pit, dumps, tailings ponds, factories, and other technogenic objects). In the course of this work, 50 points were planned, from which surface soils were sampled from a depth of 0–20 cm. The soil types were identified by the international standard for the taxonomic hierarchy of soils, adopted by the International Union of Soil Sciences [29]. The samples of selected soil were prepared for laboratory analysis. Soils were analyzed for main physical and chemical properties. pH in soil/water suspension 1:2.5 was measured using a glass electrode by ISO 10390:2005 [30] and GOST-26483-85 [31]. Total organic matter (SOM) was determined by sulfochromic oxidation according to ISO 14235:1998 [32] and GOST-26213-91 [33]. The content of the mobile forms of Pb, Ni, Mn, Cd, Co, Cr, Zn, Cu, and As was determined using an atomic absorption spectrometry using a graphite furnace (by MGA-1000 GC Lumex) with extraction by 1 N HNO3 in accordance with M 03-07-2014 [34]. The 1 N HNO3 extracts were the most strongly bound to the soil, unlike H2O and 1 N HCl [35,36,37,38].
2.3. Plant Sampling and Analyses
The leaves of plants are known to be one of the informative indicators of the state of the environment [39,40]. Geobotanical studies at the initial stages of the search for primary diamond deposits in the study area revealed that sparse larch forests with alder are distributed in fragmentary patches and confined to kimberlite pipe outcrops and partly to their dealluvial plumes. The same studies showed that the type of forest stands changes much less than the sinusual structure of the soil cover (moss lichen and shrub layers). Thus, the indicator role of, for example, the shrub layer is much higher. Therefore, bioindication of the state in the soil–vegetation system is more efficient to carry out according to the biogeochemical response using the example of leaves of shrub plants, which act as indicators not only of plicative structures but also changes of the general ecological and geochemical state of the substrate.
The sampling of plants was made at the same observation points as the soil. Leaves of Betula middendorffii and Duschekia fruticosa. were chosen as plants for the study. The leaf lamina is a powerful plant air pump for plants to absorb and accumulate the PTEs from industrial emissions [41]. Therefore, washing of leaf samples before shredding and ashing was not deliberately carried out. Due to washing, information about the dust component, which is very important in ecological and biogeochemical studies, disappears as a result of the dusting of waste rock dumps, soils of tailings, and sides of open pits.
A sampling of the leaves of the dominant shrub species was carried out by the method of mean selection at the height of 1.0–1.1 m from the soil surface from the outer side of the crown along the circumference. Leaves for analysis were selected without petioles. The leaves were selected during the main growing season (August to early September) to determine the accumulative capacity of the plant. In the laboratory, the plants were dried, ground into powder using an electric mill, and sent for analysis. The same analytical procedure was repeated for plants for PTE analysis, which was followed for soil samples.
2.4. Quality Control
The chemical analysis of each sample was conducted in triplicate relative to a control for analytical precision. Standard reference soil samples SDPC-1, -2, -3 and SSC-1, -2, -3 were included for quality control. The standard deviation was <5% for all elements. All glassware and plastic containers were soaked in 10% (v/v) HNO3 for at least 24 h and thoroughly cleaned with deionized water before utilization. All chemical reagents were guaranteed reagents.
2.5. Assessment of PTE Pollution
The pollution index (PI) and pollution load index (PLI) based on the distribution of mobile forms of PTEs in soils and plants were calculated for the geoecological assessment of the territory. Typically, these indices are calculated to assess the condition of soils [42,43,44,45]. But within the framework of this study, for comparison, there was a possibility to apply these indices to the biogeochemical characteristics of the study area.
The pollution index (PI) and pollution load index (PLI) of the PTEs were calculated using the following equations [43]:
where Cn is the measured value of the PTEs in the soil and plant, Bn is the geochemical background value of the PTEs in the local soil and plant, and n is the number of PTEs. The PI is divided into four levels from no to high pollution to indicate the pollution degree and classified as follows: unpolluted (PI ≤ 1), slightly polluted (PI = 1–2), moderately polluted (PI = 2–3), and highly polluted (PI > 3) [46]. According to the value of the PLI, soils can be classified as unpolluted (PLI < 1), unpolluted to moderately polluted (PLI = 1–2), moderately polluted (PLI = 2–3), moderately to highly polluted (PLI = 3–4), highly polluted (PLI = 4–5), and very highly polluted (PLI > 5) [45].
2.6. Bioaccumulation Factor
The bioaccumulation factor (BAF) is an important parameter and refers to the efficiency of a plant species to accumulate PTEs into its tissue from the surrounding environment [47,48,49]:
where Cp and Cs are concentrations of the element in plants and soil samples, respectively. Higher BAF values indicate higher bioavailability of PTEs in soils and bioconcentration in plants.
2.7. Statistical Analyses
The most commonly used multivariate statistical methods, including descriptive statistics and correlation analysis, were used to assess the analytical data in this study. All statistical analyses were processed using Statistica v. 13.0, SPSS v. 23.0 software and OriginPro 2021.
The normal distribution of the data set was estimated by the statistical method (Kolmogorov–Smirnov and Shapiro–Wilk). Abnormal distribution values were transformed according to the principles of CoDa [50,51,52] using the clr transformation. The clr data showed a normal distribution due to a decrease in the weight of the outliers (Figure 2).
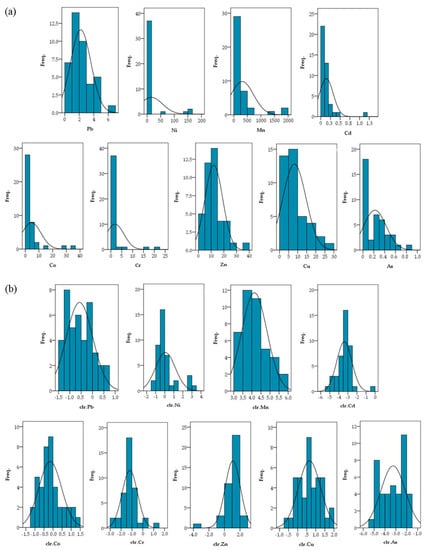
Figure 2.
PTE histograms for raw data (a) and clr-transformed data (b).
3. Results
3.1. Descriptive Statistics of Physicochemical Properties and PTE Concentrations in Soils
The data of the pH value, soil organic matter (SOM), and levels of PTEs in soil samples collected from the industrial site of Udachny MPD are presented in Table 1. For the soil samples analyzed, the pH ranged from 4.3 to 8.7. Most of the soil samples were alkaline, in which a share was 70%; 15% of the soil samples had a neutral reaction and 15% were weak and medium acidic. The content of organic matter in the soil was relatively high, with maximum values exceeding the minimum values tenfold. The content SOM in the studied types of cryosols ranges from 2.2 to 30.0%. It represents slightly decomposed organic matter (up to 70% of the non-hydrolyzable residue) and coarse humus fulvate-humate soil organic material. The same SOM content was noted by many researchers studying the cryosols of Yakutia [53,54,55,56].

Table 1.
PTE concentrations (mg/kg), pH, and soil organic matter content (SOM, %) of the studied soils; n = 50.
Mean PTE concentrations (mg/kg) decreased in the following order: Mn > Ni > Zn > Cu > Co > Pb > Cr > As > Cd. Among them, the contents of Ni, Cr, Co, As, and Mn exceeded the background values by 4.93, 2.09, 1.72, 1.69, and 1.65 times, respectively. This is explained by the fact that the level of PTE is influenced by both anthropogenic factors associated with the work of mining enterprises, which proves the presence of a technogenic component in the soils of the industrial site [57] and the overlay of the nature anomaly of the territory in the central part of the Daldyn kimberlite field.
The coefficient of variation (CV) reflects the variation of PTE concentrations [45,58]. In this study, the CVs of five elements (Mn, Ni, Zn, Co, and Cu) had CVs > 35%, indicating high fluctuations. Cr has medium variation, while Pb, Cd, and As have low variation. A description of the relationship between the concentrations of PTEs in soil and the main physical and chemical properties is presented in Figure 3.
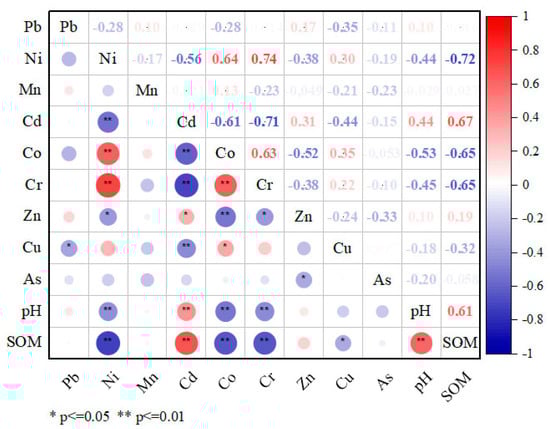
Figure 3.
Correlation plot of the soil PTE contents with main physicochemical properties. * Correlation is significant at the 0.05 level, ** correlation is significant at the 0.01 level. SOM—soil organic matter. Red colors represent positive correlations, while blue colors denote negative correlations. The darker or more saturated the color, the stronger the relationship.
SOC and pH demonstrated significant positive correlations with Cd at p < 0.01 and negative correlations with Ni, Co, and Cr at p < 0.01. A significantly high positive correlation between Cr, Ni, and Co at p < 0.01 was found when examining the ratios of the respective elements. Another significant but weaker correlation is observed between Cd and Zn at p < 0.05. They are also negatively correlated with the previous group of Ni, Co, and Cr.
A positive correlation of Cd with soil pH confirms its low solubility and mobility. There is the concept of pH precipitation, where certain trace elements can precipitate at certain pH intervals [59]. In the range of pH = 4.1–7.4 of the study area, some microelements fall within the pH limit of hydroxide precipitation and accumulate in the soil. So far, they represent only a potential hazard. Thus, Co, Cr, and Ni correlated negatively with soil pH mainly because these elements fall within the given precipitation pH interval. Similar results are shown in Ganpat L. et al. [60] and Nuralykyzy et al. [61].
The significant negative correlation of SOM with Co, Cr, and Ni shows that organic matter does not bind these elements. They are in an accessible mobile form and may have a subsequent toxic effect on biota. The positive correlation between SOM and Cd indicates their high correlation. This is because organic matter has a higher Cd binding energy than other physical and chemical indicators of soils [59].
The positive correlation between PTEs indicated that they tend to accumulate together, and the result is their co-occurrence and interdependence; they come from similar sources and migrate together [61,62,63]. Cr, Ni, and Co are known to be members of the iron family and generally have an affinity for siderophiles [64]. They are also typomorphic elements of kimberlites, which reflect the geochemical specificity of the territory of the Daldyn kimberlite field. Therefore, high concentrations of these elements are explained by the second entry into the surface layer of soil in the form of re-suspended dust of soil material as a result of aerogenic spread from drilling and blasting, wind erosion of dumps, etc., as well as the influence of anthropogenic and industrial activities on the territory of the industrial site of the Udachny MPD. The studies conducted by Rodriguez Martín et al. [65] and Gololobova [66] also revealed a high correlation between these elements. The Cd-Zn association suggests that these elements may come from similar sources. Similar results have been obtained in other studies [65,67,68,69].
3.2. Descriptive Statistics of PTE Concentrations in Plants
PTE concentrations determined in plant leaves are presented in Table 2. The order of distribution of mean PTE concentrations in both plant species was similar and arranged in descending order: Mn > Zn > Cr > Ni > Cu > Pb > As > Co > Cd. The concentrations of the elements Ni, Mn, Cd, Cr, and Zn in the leaves of Betula middendorffii exceeded the values in the leaves of Duschekia fruticosa. by 1.19, 4.59, 1.43, 2.67, 1.02, and 1.72 times, respectively.
Table 2.
Descriptive statistics of PTE content in the leaves of the plants of the study area.
3.3. Indices of Pollution
3.3.1. Pollution Index (PI) and Pollution Load Index (PLI)
The range PI of soil values for Pb is 0.18–3.69, Ni: 0.32–52.5, Mn: 0.18–9.82, Cd: 0.24–10.18, Co: 0.20–13.13, Cr: 0.12–23.06, Zn: 0.01–3.85, Cu: 0.14–4.90, and As: 0.19–6.46. The mean PI values of these PTEs were in the following order: Ni > Cr > Co > As > Mn > Cu > Cd > Zn > Pb. The mean values of these PTEs are above 1, which indicates soil contamination with these elements (Figure 4a). The PI of Pb, Mn, Cd, Co, Zn, Cu, and As indicated light pollution (1 < PI ≤ 2), Cr—moderate pollution (2 < PI ≤ 3), and Ni—high pollution (PI > 3).
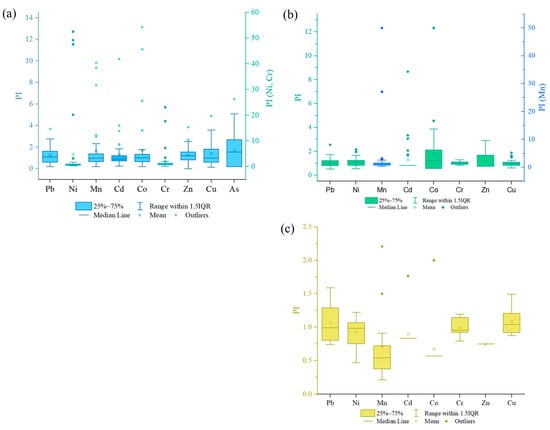
Figure 4.
Boxplots of the pollution index (PI): (a) in soil and (b) in Betula middendorffii (c) Duschekia fruticosa. Levels of pollution: unpolluted (PI ≤ 1), slightly polluted (1 < PI ≤ 2), moderately polluted (2 < PI ≤ 3), and highly polluted (PI > 3). The scales for Ni and Cr (a), and Mn (b) are presented in right and shown by other colors.
The pollution index (PI) for leaves of Betula middendorffii and Duschekia fruticosa is different (Figure 4b,c). According to the mean values, the order of the decreasing PI is as follows. For Betula middendorffii leaves, Mn > Co > Cd > Zn > Ni > Pb > Cr > Cu; for Duschekia fruticosa. leaves, Cu > Pb > Cr > Ni > Cd > Zn > Mn > Co. The PI in the leaves of Betula middendorffii for Cu was less than 1, which indicates the absence of contamination by this element. Cr, Pb, Ni, Cd, Co, and Zn are classified as slightly polluted (1 < PI ≤ 2) and Mn as highly polluted (PI > 3). In the leaves of Duschekia fruticosa., a PI ≤ 1 for Co, Mn, Zn, Cd, Ni, and Cr refers to uncontaminated levels, while Pb and Cu are weakly contaminated (1 < PI ≤ 2).
The PLI is widely used to estimate the relative degree of soil contamination by PTEs [44]. It provides a simple comparative means of the PTE level in a study area: the number of times a particular element in the soil exceeds the mean natural background concentration [11]. The soil PLI values in this study ranged from 0.85 to 1.40, with a mean value of 1.02 (Figure 5a), corresponding to unpolluted to moderately polluted levels (1 < PLI ≤ 2). The highest PLI value (1.40) was found at P-19/2, followed by P-19/1 (1.32) (Figure 5b). These points are located near waste rock dumps. Ni, Cr, Co, Mn, As, and Cu contamination factors were higher, resulting in a higher PLI value in the study area. A PLI >1 indicates pollution and indicates an anthropogenic source of pollution. The PLI was low at points more distant from the impact objects of the industrial site of the Udachny MPD (PLI ≤ 1).
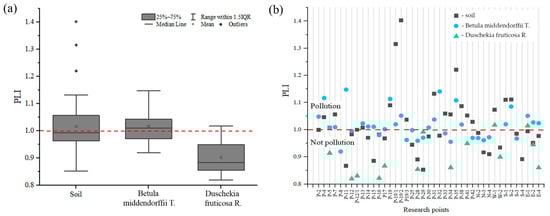
Figure 5.
Pollution load index (PLI) of the studied PTEs in the study area: (a) mean values, (b) the PLI level at the study points. The red dotted line shows the threshold level of pollution.
The values of the PLI in the leaves of Betula middendorffii were higher than in the leaves of Duschekia fruticosa. In the leaves of Betula middendorffii, the PLI is classified on mean as unpolluted to moderately polluted (1 < PLI ≤ 2), with the highest values recorded at points P-11, P-32, P-4, and P-19. Observation points P-4, P-11, and P-32 are anthropogenically transformed soils; point P-19 is near the side of the Udachny kimberlite pipe quarry. Meanwhile, in the leaves of Duschekia fruticosa., the PLI is mostly unpolluted (PLI ≤ 1), but two points with a value greater than one were recorded at points W-1 and S-1, which are located 100 m to the west and south of the edge of the Zarnitsa kimberlite pipe pit.
3.3.2. Bioaccumulation Factor (BAF)
The BAF was estimated for each site in order to comprehend the bioconcentration process in the soil–plant system. Plant bioaccumulation factors in the study area are presented in Table 3.
Table 3.
The bioaccumulation factor (BAF) in the leaves of the plants in the study area.
The mean PTEs for Betula middendorffii were in the following order: Cr > Zn > Ni > Mn > Pb > Cu > Cd > Co; for Duschekia fruticosa.: Cr > Zn > Ni > Pb > Cu > Mn > Cd > Co. The only difference was the lower Mn content in Duschekia fruticosa. leaves. Cr has the highest phytoabsorption potential regardless of plant species, followed by Zn and Ni. The proportion of elements absorbed with a BAF ˃ 1 in the plant species studied was as follows: in Betula middendorffii leaves—Zn (97%) ˃ Cr (94%) ˃ Ni (86%) ˃ Pb (75%) ˃ Cu (39%) ˃ Mn (8%); in Duschekia fruticosa. leaves—Zn (100%) ˃ Cr (100%) ˃ Ni (93%) ˃ Pb (64%) ˃ Cu (43%). There was no accumulation of Cd and Co in the leaves of Betula middendorffii, and Cd, Co, and Mn in the leaves of Duschekia fruticosa. The highest phytoabsorption in Betula middendorffii leaves was noted in points P-11 for Pb, Mn, Cr, and Cu, P-32 for Ni, and P-15 for Zn. In Duschekia fruticosa. leaves, the maximum phytoabsorption was found at the studied points P-17 for Pb, P-29 for Ni, P-12 for Cr, P-16 for Zn, and S-4 for Cu. It was revealed that the greatest amount of PTE is accumulated by plants in the observation point P-11, which is located at the abandoned site of mining construction materials for road dumping, where technogenic salts are formed on the surface of the basic rocks.
4. Discussion
The presented study is the first attempt to use the PI and PLI coefficients to assess vegetation pollution. It is well-known that the accumulation of chemical elements first stimulates the vital activity of the plant and its productivity, and then depresses it. In other cases, in plants, when a certain level of concentration of a chemical element is reached, mechanisms begin to operate that prevent its further absorption. Therefore, it is quite problematic to assess the level of pollution of plants in their apparent relatively safe condition. Therefore, the presented study is the first attempt to use the PI and PLI coefficients to assess plant pollution.
For the description of the biogeochemical characteristics of the study area and the connection between PTE concentrations in soils and plants, the PI and PLI indices were compared (Table 4). It has been established that high soil pollution naturally leads to an increase in the concentration of elements in the leaves of shrubs. An analysis of the PI index shows that in uncontaminated points with PI < 1, the agreement between the PLI in soils and plants is 43%. Moreover, soils and plants are dominated by elements associated with trap magmatism—Cr, Co, Cu, and dolerite dikes—Mn and Zn. Cadmium and lead are the most toxic elements [70]; they are more often found in soils with an acceptable level of pollution than in plants in the same area. The PI is characterized by low values in forest areas remote from industrial facilities. The exception is the points with the preserved plants, for example near quarries Udachny (P-14, P-15) and Zarnitsa (W-1 W-2), and basites (P-11), in which the PLI is higher in plants than in soils.
Table 4.
Characteristics of the microelement composition of soils and plants in the study area.
As the level of pollution increases, the number of coincidences between the PLI in soils and plants increases up to 73%. In areas with the highest pollution load index, the content of chemical elements in plants reflects natural and technogenic anomalies in soils and the accumulation of these elements in dust particles. As a rule, these are sites at a distance of 100 to 500 m from industrial facilities (P-19-19/2, P-35) with high PI in soils and plants. The content of Co, Cu, Zn, Pb, and As in the soils of these sites is almost ubiquitous. At the same time, high concentrations of Co and Zn were noted in the plants, which indicates a certain tolerance of Betula middendorffii and Duschekia fruticosa. to their accumulation. According to numerous toxicological studies, zinc, lead, and cadmium lead to various pathologies of living organisms, even at low concentrations [71]. The excessive zinc and copper levels lead to deficiencies (inhibition) of other important micro and macro components (enzymes) in the organism [72]. However, despite the high content of PTEs in soils, the studied plants have a strong stress tolerance and capacity to tolerate an environment with a high concentration of PTEs. For example, in areas of dead forest, where there is the oppression of larch trees and moss cover, shrubs are in a stable state, which proves their high resistance (Figure 6). Therefore, these plants can be attributed to metallophytes. Metallophytes are plants that can survive in metal-rich soils. [73]. Prolonged exposure of metallophytes to excess amounts of PTEs contributes to the evolution of their resistance through a protective mechanism and the development of a unique ability to resist, survive, and multiply in an environment rich in PTEs [5]. The BAF results also confirmed that Betula middendorffii and Duschekia fruticosa. have a high potential for PTE accumulation. At the same time, Betula middendorffii is able to accumulate a greater amount of PTE and has a more significant potential for phytoextraction. From these results, it becomes clear that the accumulation of various PTEs differs in different plant species. This is explained by the fact that Betula middendorffii is less selective and is distributed almost everywhere in the climatic subzone of the northern taiga. At the same time, Duschekia fruticosa. is more selective in geological conditions and is confined mainly to kimberlites. Prolonged exposure of metallophytes to excess amounts of PTEs contributes to the evolution of their resistance through a protective mechanism and the development of a unique ability to resist, survive, and multiply in an environment rich in PTEs [5].
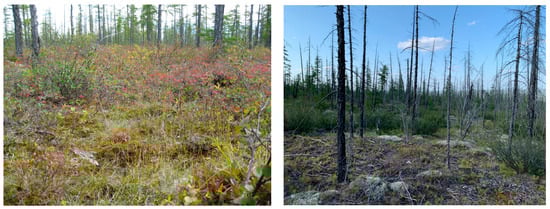
Figure 6.
Undisturbed natural biotope (left), area of “dead” forest (right).
Vegetation changes under the impact of various environmental factors affect the state of biogeocenose as a whole and, as a result, can be utilized as diagnostic properties. The specific features of plant metabolism, including the presence of a highly sensitive photosynthetic apparatus that absorbs PTE from the environment, allow them to be used as targets for the diagnostics of atmospheric air pollution. Yet, as studies have shown, plants can also be used to detect soil contamination.
In order to improve the accuracy of geoecological assessments, it is essential to use not one, but several methods of phytoindication, including the analysis of air condition. In this case, however, in the example of the industrial site of the Udachninsky Mining and Processing Plant, precipitation is not a key factor in soil and plant pollution. The contrast of anomalies in soils and plants was identified as a result of the natural anomaly of the Daldyn kimberlite field and the anthropogenic impact of industrial facilities.
Thus, the consecutive analysis of the calculated BAF, PI, and PLI indices can be efficiently utilized for the study of plant geochemistry, with the results comparable in terms of the spectrum of trace elements and the contrast coefficients for soils.
5. Conclusions
The present study investigated soil and plant pollution by potentially toxic elements (PTEs) within the industrial site of the Udachny Mining and Processing Division.
It has been established that high soil pollution naturally leads to an increase in the concentration of elements in the leaves of shrubs. The soils and vegetation are dominated by elements associated with trap magmatism—Cr, Co, Cu, and dolerite dikes—Mn and Zn.
It was revealed that Betula middendorffii has the highest resistance to PTE contamination in mining conditions.
This analysis showed that the consistent application of the PI, PLI, and BAF indices for the territories of industrial development is very effective in the ecological and biogeochemical assessment of the situation. In biogeochemical studies as objects of the bioindication, it can be recommended to use the leaves of Duschekia fruticosa. in geological works in search of kimberlites, and the leaves of Betula middendorffii for ecological and geochemical assessment of the situation in the areas of industrial development.
Author Contributions
Conceptualization, A.G. and Y.L.; methodology, A.G.; software, A.G.; validation, Y.L.; formal analysis, A.G.; investigation, A.G.; resources, Y.L.; data curation, A.G.; writing—original draft preparation, A.G.; writing—review and editing, Y.L.; visualization, A.G.; supervision, A.G.; project administration, A.G. All authors have read and agreed to the published version of the manuscript.
Funding
This work was carried out within the framework of the project Ministry of Education of the Russian Federation, Diamond and Precious Metals Geology Institute FUEM-2019-0003 “Evolution of the earth’s crust of the North Asian craton, basic-ultrabasic and kimberlite magmatism, diamond content of the Yakutian kimberlite province”.
Data Availability Statement
The data is available on request from the corresponding author.
Conflicts of Interest
The authors declare no conflict of interest.
References
- Angulo-Bejarano, P.I.; Puente-Rivera, J.; Cruz-Ortega, R. Metal and metalloid toxicity in plants: An overview on molecular aspects. Plants 2021, 10, 635. [Google Scholar] [CrossRef] [PubMed]
- Rahman, Z.; Singh, V.P. The Relative Impact of Toxic Heavy Metals (THMs) (Arsenic (As), Cadmium (Cd), Chromium (Cr)(VI), Mercury (Hg), and Lead (Pb)) On the Total Environment: An Overview. Environ. Monit. Assess. 2019, 191, 419. [Google Scholar] [PubMed]
- Seleiman, M.; Santanen, A.; Mäkelä, P. Recycling Sludge on Cropland as Fertilizer-Advantages and Risks. Resour. Conserv. Recycl. 2019, 155, 104647. [Google Scholar] [CrossRef]
- Ning, L.; Yun, L.; Jenmei, W.; Xinyu, C. The Sources Risk Assessment Combined with APCS/MLR Model for Potentially Toxic Elements in Farmland of a First-Tier City, China. Environ. Sci. Pollut. Res. 2022, 29, 50717–50726. [Google Scholar]
- Sabir, M.; Baltrėnaitė-Gedienė, E.; Ditta, A.; Ullah, H.; Kanwal, A.; Ullah, S.; Faraj, T.K. Bioaccumulation of Heavy Metals in a Soil–Plant System from an Open Dumpsite and the Associated Health Risks through Multiple Routes. Sustainability 2022, 14, 13223. [Google Scholar] [CrossRef]
- Narendrula-Kotha, R.; Theriault, G.; Mehes-Smith, M.; Kalubi, K.; Nkongolo, K. Metal Toxicity and Resistance in Plants and Microorganisms in Terrestrial Ecosystems. Residue Rev. 2019, 249, 1–27. [Google Scholar]
- Ruan, X.; Ge, S.; Jiao, X.; Zhan, W.; Wang, Y. Bioaccumulation and risk assessment of potential toxic elements in the soil-vegetable system as influenced by historical wastewater irrigation. Agric. Water Manag. 2023, 279, 108197. [Google Scholar] [CrossRef]
- Nataliia, R.; Abdelhak, E.; Michelle, G.; Tian, F.; Laptev, V. Bioaccumulation of As, Cd, Cr, Cu, Pb, Zn in Ambrosia artemisiifolia L. in the polluted area by enterprise for the production and processing of batteries. Ann. Civil. Environ. Eng. 2022, 6, 26–30. [Google Scholar]
- Pehoiu, G.; Murarescu, O.; Radulescu, C.; Dulama, I.D.; Teodorescu, S.; Stirbescu, R.M.; Bucurica, I.A.; Stanescu, S.G. Heavy metals accumulation and translocation in native plants grown on tailing dumps and human health risk. Plant Soil 2020, 456, 405–424. [Google Scholar] [CrossRef]
- Aloud, S.S. Impact of Municipal and Industrial Waste on the Distribution and Accumulation of Some Heavy Metals in Sandy Soils of Al-Qassim Region at Central of Saudi Arabia. J. Environ. Sci. Technol. 2008, 1, 135–142. [Google Scholar]
- Aloud, S.S.; Alotaibi, K.D.; Almutairi, K.F.; Albarakah, F.N. Assessment of Heavy Metals Accumulation in Soil and Native Plants in an Industrial Environment, Saudi Arabia. Sustainability 2022, 14, 5993. [Google Scholar] [CrossRef]
- He, Z.L.; Yang, X.E.; Stoffella, P.J. Trace Elements in Agroecosystems and Impacts on the Environment. J. Trace Elem. Med. Biol. 2005, 19, 125–140. [Google Scholar] [PubMed]
- Feng, J.; Wang, Y.; Zhao, J.; Zhu, L.; Bian, X.; Zhang, W. Source Attributions of Heavy Metals in Rice Plant Along Highway in Eastern China. J. Environ. Sci. 2011, 23, 1158–1164. [Google Scholar] [CrossRef] [PubMed]
- Sulaiman, F.R.; Hamzah, H.A. Heavy Metals Accumulation in Suburban Roadside Plants of a Tropical Area (Jengka, Malaysia). Ecol. Process. 2018, 7, 28. [Google Scholar] [CrossRef]
- Nabulo, G.; Oryem-Origa, H.; Diamond, M. Assessment of Lead, Cadmium, and Zinc Contamination of Roadside Soils, Surface Films, and Vegetables in Kampala City, Uganda. Environ. Res. 2006, 101, 42–52. [Google Scholar]
- Shahid, M.; Dumat, C.; Khalid, S.; Schreck, E.; Xiong, T.; Niazi, N.K. Foliar Heavy Metal Uptake, Toxicity and Detoxification in Plants: A Comparison of Foliar and Root Metal Uptake. J. Hazard. Mater. 2017, 325, 36–58. [Google Scholar] [CrossRef]
- Liu, W.X.; Shen, L.F.; Liu, J.W.; Wang, Y.W.; Li, S.R. Uptake of Toxic Heavy Metals by Rice (Oryza sativa L.) Cultivated in Agricultural Soil near Zhengzhou city, People Republic of China. Bull. Environ. Contam. Toxicol. 2007, 79, 209–213. [Google Scholar] [CrossRef]
- Koz, B.; Cevik, U. Lead Adsorption Capacity of Some Moss Species Used for Heavy Metal Analysis. Ecol. Indic. 2014, 36, 491–494. [Google Scholar] [CrossRef]
- Boularbah, A.; Schwartz, C.; Bitton, G.; Aboudrar, W.; Ouhammou, A.; Morel, J.L. Heavy metal contamination from mining sites in South Morocco: 2. Assessment of metal accumulation and toxicity in plants. Chemosphere 2006, 63, 811–817. [Google Scholar] [CrossRef]
- Zhang, M.; Yan, X.; Zhang, F.; Zeng, C.; Devkota, L.P. Factorial analysis of heavy metal concentration in roadside farmland plants around Kathmandu, Nepal. Appl. Mech. Mater. 2012, 178–181, 1016–1021. [Google Scholar] [CrossRef]
- Danilov, P.P.; Legostaeva, Y.B.; Savvinov, G.N. Technogenic Landscapes and Their Influence on The Natural Soil Cover of Western Yakutia. Vestn. NEFU 2005, 2, 70–75. [Google Scholar]
- JV Udachninsky GOK AK «ALROSA» (PJSC). Monitoring of Sustainable Development. Available online: https://monitoring-esg.ru/esg-analitika/analitika-po-kompaniyam/sp-ak-alrosa-pao-udachninskij-gorno-obogatitelnyj-kombinat (accessed on 1 October 2022).
- Legostaeva, Y.; Kozlova, I.; Popov, V.; Noev, D. Geoecological Situation in the Area of Aikhal MPD. In Proceedings of the Geology and Mineral Resources of the North-East of Russia, Yakutsk, Russia, 8 April 2020; pp. 482–485. [Google Scholar]
- Drozdov, A.V.; Popov, V.F. Removal of drainage brines into the bowels of the permafrost zone during the development of diamond deposits in Yakutia. Explor. Prot. Miner. Resour. 2013, 12, 44–48. [Google Scholar]
- Gololobova, A.G. Investigation of The Spatial Distribution of Microelements in Soils by the Method of Multivariate Statistical Analysis (on the Example of The Territory of the Daldyn Kiberlite Field, Northwestern Yakutia). Bull. Tomsk. Polytech. 2023, 334, 89–103. [Google Scholar]
- Mironova, S.I. Plant Successions in the Natural-Technogenic Landscapes of Western Yakutia and their Optimization; Academy of Natural History Publ. House: Moscow, Russia, 2016; p. 140. [Google Scholar]
- Poiseeva, S.I. The current state of vegetation in the zone of technogenesis (on the example of North-Western Yakutia). Probl. Reg. Ecol. 2008, 2, 83–86. [Google Scholar]
- Legostaeva, Y.B.; Gololobova, A.G. Features of the distribution of trace elements in the soils of the background and impact zones at diamond mining sites in the northwest of the Siberian Platform. Bull. Tomsk. Polytech. 2021, 332, 142–153. [Google Scholar]
- International Union of Soil Sciences (IUSS). IUSS Working Group WRB, 4th ed.; World Reference Base for Soil Resources. International soil classification system for naming soils and creating legends for soil maps; International Union of Soil Sciences (IUSS): Vienna, Austria, 2022. [Google Scholar]
- ISO 10390; Soil Quality—Determination of pH. ISO: Geneva, Switzerland, 2005.
- GOST-26483-85; State Standard of the Union of SSR. Soils. Preparation of Salt Extract and Determination of Its pH by CINAO Method. Standards Publishing House: Moscow, Russia, 1985.
- ISO 14235; Soil Quality—Determination of Organic Carbon by Sulfochromic Oxidation. ISO: Geneva, Switzerland, 1998.
- GOST-26213-91; State Standard of the Union of SSR. Soils. Methods for Determination of Organic Matter. Standards Publishing House: Moscow, Russia, 1991.
- Method M 03-07-2014; Measurement of the Mass Fraction of Elements (As, Cd, Co, Cr, Cu, Hg, Mn, Ni, Pb, V, Zn) in Samples of Soil, Subsoil, Bottom Sediments and Sewage Sludge, FER 16.1:2:2.2:2.3.63-09. FGU “Federal Center for Analysis and Evaluation technogenic impact”: Moscow, Russia, 2014.
- Ilyin, V.B. Heavy Metals in the Soil-Plant System; Nauka: Novosibirsk, Russia, 1991; p. 150. [Google Scholar]
- Ladonin, D.V. Compounds of heavy metals in soils—problems and methods of study. Soil Sci. 2002, 6, 682–692. [Google Scholar]
- Syso, A.I. Mechanisms of Distribution of Chemical Elements in Soil-Forming Rocks and Soils of the Western Siberia; SB RAS; Publishing House of the Russian Academy of Sciences: Novosibirsk, Russia, 2007; Volume 227. [Google Scholar]
- Šmejkalová, M.; Mikanová, O.; Borůvka, L. Effects of heavy metal concentrations on biological activity of soil micro-organisms. Plant Soil Environ. 2003, 49, 321–326. [Google Scholar] [CrossRef]
- Gorelova, S.V.; Frontasyeva, M.V.; Gorbunov, A.V.; Lyapunov, S.M.; Okina, O.I. Bioindication and monitoring of atmospheric deposition using trees and shrubs. In Proceedings of the 27th Task Force Meeting of the UNECE ICP Vegetation, Paris, France, 28–30 January 2014. [Google Scholar]
- Petrunina, N.S.; Ermakov, V.V. Modern aspects of plant geochemical ecology. Probl. Biogeochem. Geochem. Ecol. 2012, 1, 147–155. [Google Scholar]
- Neverova, O.A.; Kolmogorova, E.Y. Woody Plants and the Urbanized Environment: Ecological and Biotechnological Aspects; Nauka: Novosibirsk, Russia, 2003; p. 222. [Google Scholar]
- Kowalska, J.B.; Mazurek, R.; Gąsiorek, M.; Zaleski, T. Pollution indices as useful tools for the comprehensive evaluation of the degree of soil contamination—A review. Environ. Geochem. Health 2018, 40, 2395–2420. [Google Scholar] [CrossRef]
- Tomlinson, D.L.; Wilson, J.G.; Harris, C.R.; Jeffrey, D.W. Problems in the assessment of heavy-metal levels in estuaries and the formation of a pollution index. Helgoländer Meeresunters 1980, 33, 566–575. [Google Scholar] [CrossRef]
- Stevanović, V.; Gulan, L.; Milenković, B.; Valjarević, A.; Zeremski, T.; Penjišević, I. Environmental Risk Assessment of Radioactivity and Heavy Metals in Soil of Toplica Region, South Serbia. Environ. Geochem. Health 2018, 40, 2101–2118. [Google Scholar] [CrossRef]
- Khorshidi, N.; Parsa, M.; Lentz, D.R.; Sobhanverdi, J. Identification of heavy metal pollution sources and its associated risk assessment in an industrial town using the K-means clustering technique. Appl. Geochem. 2021, 135, 105113. [Google Scholar] [CrossRef]
- Wu, X.L.; Zhang, T.X.; Wang, H.; Yu, X.J.; Zheng, X.N.; Li, H.Y. Characteristics of temperature and precipitation change in Xinjiang during 1961–2017. Desert Oasis Meteorol. 2020, 14, 27–34. [Google Scholar]
- Rizova, V.A. Assessment of phytoremediation potential of indigenous plants growing around the solid waste open dumpsite. Environ. Eng. Res. 2020, 24, 234. [Google Scholar]
- Ladislas, S.; El-Mufleh, A.; Gérente, C.; Chazarenc, F.; Andres, Y.; Béchet, B. Potential of aquatic macrophytes as bioindicators of heavy metal pollution in urban stormwater runoff. Water Air Soil Pollut. 2012, 223, 877–888. [Google Scholar] [CrossRef]
- Dessalew, G.; Beyene, A.; Nebiyu, A.; Astatkie, T. Effect of brewery spent diatomite sludge on trace metal availability in soil and uptake by wheat crop, and trace metal risk on human health through the consumption of wheat grain. Heliyon 2018, 4, e00783. [Google Scholar] [CrossRef] [PubMed]
- Aitchison, J. The Statistical Analysis of Compositional Data; Chapman and Hall: London, UK, 1986; 416p. [Google Scholar]
- Aitchison, J. The Statistical Analysis of Compositional Data; Blackburn Press: Caldwell, NJ, USA, 2003; 460p. [Google Scholar]
- Pawlowsky-Glahn, V.; Buccianti, A. (Eds.) Compositional Data Analysis: Theory and Applications; Wiley: Chichester, UK; West Sussex, UK, 2011. [Google Scholar]
- Desyatkin, R.V.; Lesovaya, S.N.; Okoneshnikova, M.V.; Ivanova, A.Z. Cryozems and pale-yellow poorly differentiated soils of the tundra and taiga of Yakutia: Properties, mineralogical composition and classification. Eurasian Soil Sci. 2021, 12, 1423–1436. [Google Scholar]
- Ershov, Y.I. Cryogenic soils on the rocks of the trap formation of Central Siberia. Eurasian Soil Sci. 2022, 6, 657–672. [Google Scholar]
- Ivanova, A.Z.; Okoneshnikova, M.V.; Desyatkin, A.R.; Filippov, N.V. Soils of cryogenic forms of the microrelief of the tundra and forest-tundra zones of North-Eastern Yakutia. Nat. Resour. Arct. Subarct. 2022, 1, 98–107. [Google Scholar]
- Desyatkin, R.V.; Lesovaya, S.N.; Okoneshnikova, M.V.; Ivanova, A.Z.; Platonova, N.V. Permafrost soils of the river basin. Alazeya: Properties, mineralogical composition and classification. Eurasian Soil Sci. 2023, 2, 131–142. [Google Scholar]
- Gololobova, A.G. Ecogeochemical monitoring of soil cover at diamond mining sites in Western Yakutia. Bull. Tomsk Polytech. 2020, 331, 146–157. [Google Scholar]
- Wang, M.S.; Han, Q.; Gui, C.L.; Cao, J.L.; Liu, Y.P.; He, X.D.; He, Y.C. Differences in the risk assessment of soil heavy metals between newly built and original parks in Jiaozuo, Henan Province, China. Sci. Total Environ. 2019, 676, 1–10. [Google Scholar] [CrossRef] [PubMed]
- Kabata-Pendias, A. Trace Elements in Soils and Plants, 4th ed.; CRS Press: Boca Raton, FL, USA, 2011; 548p. [Google Scholar]
- Ganpat, L.; Rajpaul, Y.; Atul, B.P.; Ravindra, K.R.; Anil, K.V.; Dinesh, K.Y. Heavy metals distribution and their correlation with physico-chemical properties of different soil series of northwestern India. Indian J. Agric. Sci. 2020, 90, 1742–1746. [Google Scholar]
- Nuralykyzy, B.; Wang, P.; Deng, X.; An, S.; Huang, Y. Heavy Metal Contents and Assessment of Soil Contamination in Different Land-Use Types in the Qaidam Basin. Sustainability 2021, 13, 12020. [Google Scholar] [CrossRef]
- Bhuiyan, M.A.H.; Parvez, L.; Islam, M.A.; Dampare, S.B.; Suzuki, S. Heavy metal pollution of coal mine-affected agricultural soils in the northern part of Bangladesh. J. Hazard. Mater. 2010, 173, 384–392. [Google Scholar] [CrossRef]
- Robertson, D.J.; Taylor, K.G.; Hoon, S.R. Geochemical and mineral magnetic characterisation of urban sediment particulates, Manchester, UK. Appl. Geochem. 2003, 18, 269–282. [Google Scholar] [CrossRef]
- Lv, J.; Liu, Y.; Zhang, Z.; Dai, J.; Dai, B.; Zhu, Y. Identifying the origins and spatial distributions of heavy metals in soils of Ju country (Eastern China) using multivariate and geostatistical approach. J. Soils Sediments 2015, 15, 163–178. [Google Scholar] [CrossRef]
- Rodríguez, M.J.A.; Arias, M.L.; Corbi, J.M.G. Heavy metals contents in agricultural topsoils in the Ebro basin (Spain). Application of the multivariate geoestatistical methods to study spatial variations. Environ. Pollut. 2006, 144, 1001–1012. [Google Scholar] [CrossRef]
- Gololobova, A.; Legostaeva, Y.; Popov, V.; Makarov, V.; Shadrinova, O. Geochemical Characteristics of Soils to the Impact of Diamond Mining in Siberia (Russia). Minerals 2022, 12, 1518. [Google Scholar] [CrossRef]
- Li, D.; Wu, D.; Xu, F.; Lai, J.; Shao, L. Assessment of soil and maize contamination by TE near a coal gangue–fired thermal power plant. Environ. Monit. Assess. 2020, 192, 541. [Google Scholar] [CrossRef]
- Zamani, A.; Yaftian, M.R.; Parizanganeh, A. Statistical evaluation of topsoil heavy metal pollution around a lead and zinc production plant in Zanjan province, Iran. Caspian J. Environ. Sci. 2015, 13, 349–361. [Google Scholar]
- Sohrabizadeh, Z.; Sodaeizadeh, H.; Hakimzadeh, M.A.; Taghizadeh-Mehrjardi, R.; Ghanei Bafghi, M.J. A statistical approach to study the spatial heavy metal distribution in soils in the Kushk Mine, Iran. Geosci. Data J. 2022, 10, 315–327. [Google Scholar] [CrossRef]
- Dutta, A.; Patra, A.; Singh Jatav, H.; Singh Jatav, S.; Kumar Singh, S.; Sathyanarayana, E.; Verma, S.; Singh, P. Toxicity of Cadmium in Soil-Plant-Human Continuum and Its Bioremediation Techniques. Soil Contamination—Threats and Sustainable Solutions; IntechOpen: London, UK, 2021; p. 298. [Google Scholar]
- Wu, H.; Liao, Q.; Chillrud, S.N.; Yang, Q.; Huang, L.; Bi, J.; Yan, B. Environmental Exposure to Cadmium: Health Risk Assessment and its Associations with Hypertension and Impaired Kidney Function. Sci. Rep. 2016, 6, 29989. [Google Scholar] [CrossRef]
- Assi, M.A.; Hezmee, M.N.M.; Haron, A.W.; Sabri, M.Y.; Rajion, M.A. The detrimental effects of lead on human and animal health. Vet. World 2016, 9, 660–671. [Google Scholar] [CrossRef] [PubMed]
- Irshad, S.; Xie, Z.; Mehmood, S.; Nawaz, A.; Ditta, A.; Mahmood, Q. Insights into conventional and recent technologies for arsenic bioremediation: A systematic review. Environ. Sci. Pollut. Res. 2021, 28, 18870–18892. [Google Scholar] [CrossRef] [PubMed]


Disclaimer/Publisher’s Note: The statements, opinions and data contained in all publications are solely those of the individual author(s) and contributor(s) and not of MDPI and/or the editor(s). MDPI and/or the editor(s) disclaim responsibility for any injury to people or property resulting from any ideas, methods, instructions or products referred to in the content. |
© 2023 by the authors. Licensee MDPI, Basel, Switzerland. This article is an open access article distributed under the terms and conditions of the Creative Commons Attribution (CC BY) license (https://creativecommons.org/licenses/by/4.0/).