Article

The Range Potential of North American Tree Species in Europe

1
Forest Research Institute of Baden-Wuerttemberg, Wonnhaldestraße 4, 79100 Freiburg, Germany
2
Department of Plant Ecology, Institute of Landscape and Plant Ecology, University of Hohenheim, 70593 Stuttgart, Germany
*
Author to whom correspondence should be addressed.
Forests 2024, 15(1), 130; https://doi.org/10.3390/f15010130
Submission received: 11 December 2023 / Revised: 21 December 2023 / Accepted: 30 December 2023 / Published: 8 January 2024

Abstract

:
European forest ecosystems are projected to change severely under climate change especially due to an anticipated decline in the distribution of major tree species in Europe. Therefore, the adaptation of European forests appears necessary and urgent. While spontaneous adaptation mechanisms bear a large self-guided potential, we focus on quantifying the potential of management-guided mechanisms. Besides other possible tree species groups for adaptation, non-native tree species from North America have a long tradition in Europe, yet their full distribution potential is not completely revealed. We applied an ensemble species distribution model approach to six North American species, using combined occurrence data from the native and naturalized ranges to gain more insights into the species suitability in the introduced area in 2070 (2061–2080) under the emission scenarios RCP 4.5 and 8.5. Our findings support the assumption that there is unreported species potential in the introduced area beyond their current distribution. Next to northeastern range shifts projected for all species, we identified Abies grandis, Liriodendron tulipifera, Quercus rubra, and Robinia pseudoacacia with increasing range potentials in the future. P. ponderosa and P. menziesii var. menziesii are projected to show a steady and decreased range potential under RCP 4.5 and 8.5, respectively.

1. Introduction

In these times of climate change, European forest ecosystems are facing increasing risks with a variety of impacts. While global warming accelerates and precipitation during the vegetation period declines [1], the frequency and magnitude of climatic extreme events such as droughts, storms, and floods are also on the rise and affect forests severely. Extreme events, such as the drought year of 2018 in Central Europe, lead to increased tree mortality in forests [2], and the growth potentials of domestic tree species are projected to decline [3,4]. Most notably, prominent tree species like Fagus sylvatica L. and Picea abies (L.) Karst. suffered severely from climatic extremes in recent summers [5] and are expected to diminish in their distribution in the future under climate change [6,7,8,9]. Consequently, species more adapted to the anticipated future climate now receive more attention to complement currently dominating tree species. Among potential complementary species, those that show a promising growth potential, produce valuable timber, and are heat- and drought-adapted, while withstanding late frost events, are especially sought for [10] to maintain the important services and functions provided by forests despite the threats of environmental changes. The target species pool in this context may consist of native or non-native species.
Although species from other origins may be equally suited for testing, North American species were selected for tests in this study due to their long history in Central European forestry [10]. Well-documented data and scientific knowledge about the growth behavior and risks of those species in Central Europe are available, but it remains questionable if their current distribution represents their full ecological and climatic potential, as climate in the introduced area is the most often detected range limitation, tested in similar studies [11,12,13].
Occurrences of non-native tree species in Europe represent the species’ realized niches, often referred to as naturalized niches in the context of non-native species [14], while the fundamental niche in the new environment remains vague, and range shifts and expansions can be expected in the future. In their respective native ranges, species are growing under the equilibrium assumption which means that the species occur in balance with their environment, namely climate and site conditions. When transferred in time and space, the ecological equilibrium is suspended and the contrast in climatic conditions between non-native and native ranges, often referred to as niche conservatism, must be considered [14,15]. Further, species can occur in a “tolerance” niche which could be surpassing the climatic limitations observed in the original distribution and thus increase the species’ distribution potential [16].
Common and widely used tools to analyze a species’ potential to adapt to a new niche (niche transferability) are species distribution models (SDMs), also named habitat selection models or ecological niche models (e.g., [7,17,18,19,20]). These are correlative, statistical, regression-based, or machine learning models that connect detected species presence data and/or absences with environmental, often climatic, parameters, and inter- or extrapolate species distributions in time or space [17,21,22].
To explore the niche potential of North American tree species in Europe, ensemble SDMs are built in this study to gain insights into their range potential beyond their well-observed realized respective niches in Europe. With this approach, we want to overcome the common data limitation of SDMs, representing only the truncated realized niche for introduced species which often hampers extrapolation to novel environments [23]. Ensemble modeling combines several modeling algorithms and builds a more robust consensus model by ranking each model equally within the model ensemble. It is seen as advantageous for model predictions in time and space as each model prediction contains the same likelihood of representing the most likely projection [24]. Hence, an ensemble modeling approach increases robustness due to the combination of several modeling algorithms and considering their respective strengths and weaknesses [25]. Furthermore, model uncertainties of future predictions are provided via a coefficient of variation (CV) for each model algorithm and hence can be visually observed and evaluated.
In our study, we aimed (1) to quantify the climatic similarity between the native and target ranges of North American tree species in Europe, to identify (2) their potential distribution beyond their present distribution in current and future climates, (3) the range shifts for different climate scenarios, and (4) species with potential area gains as a function of climatic changes.

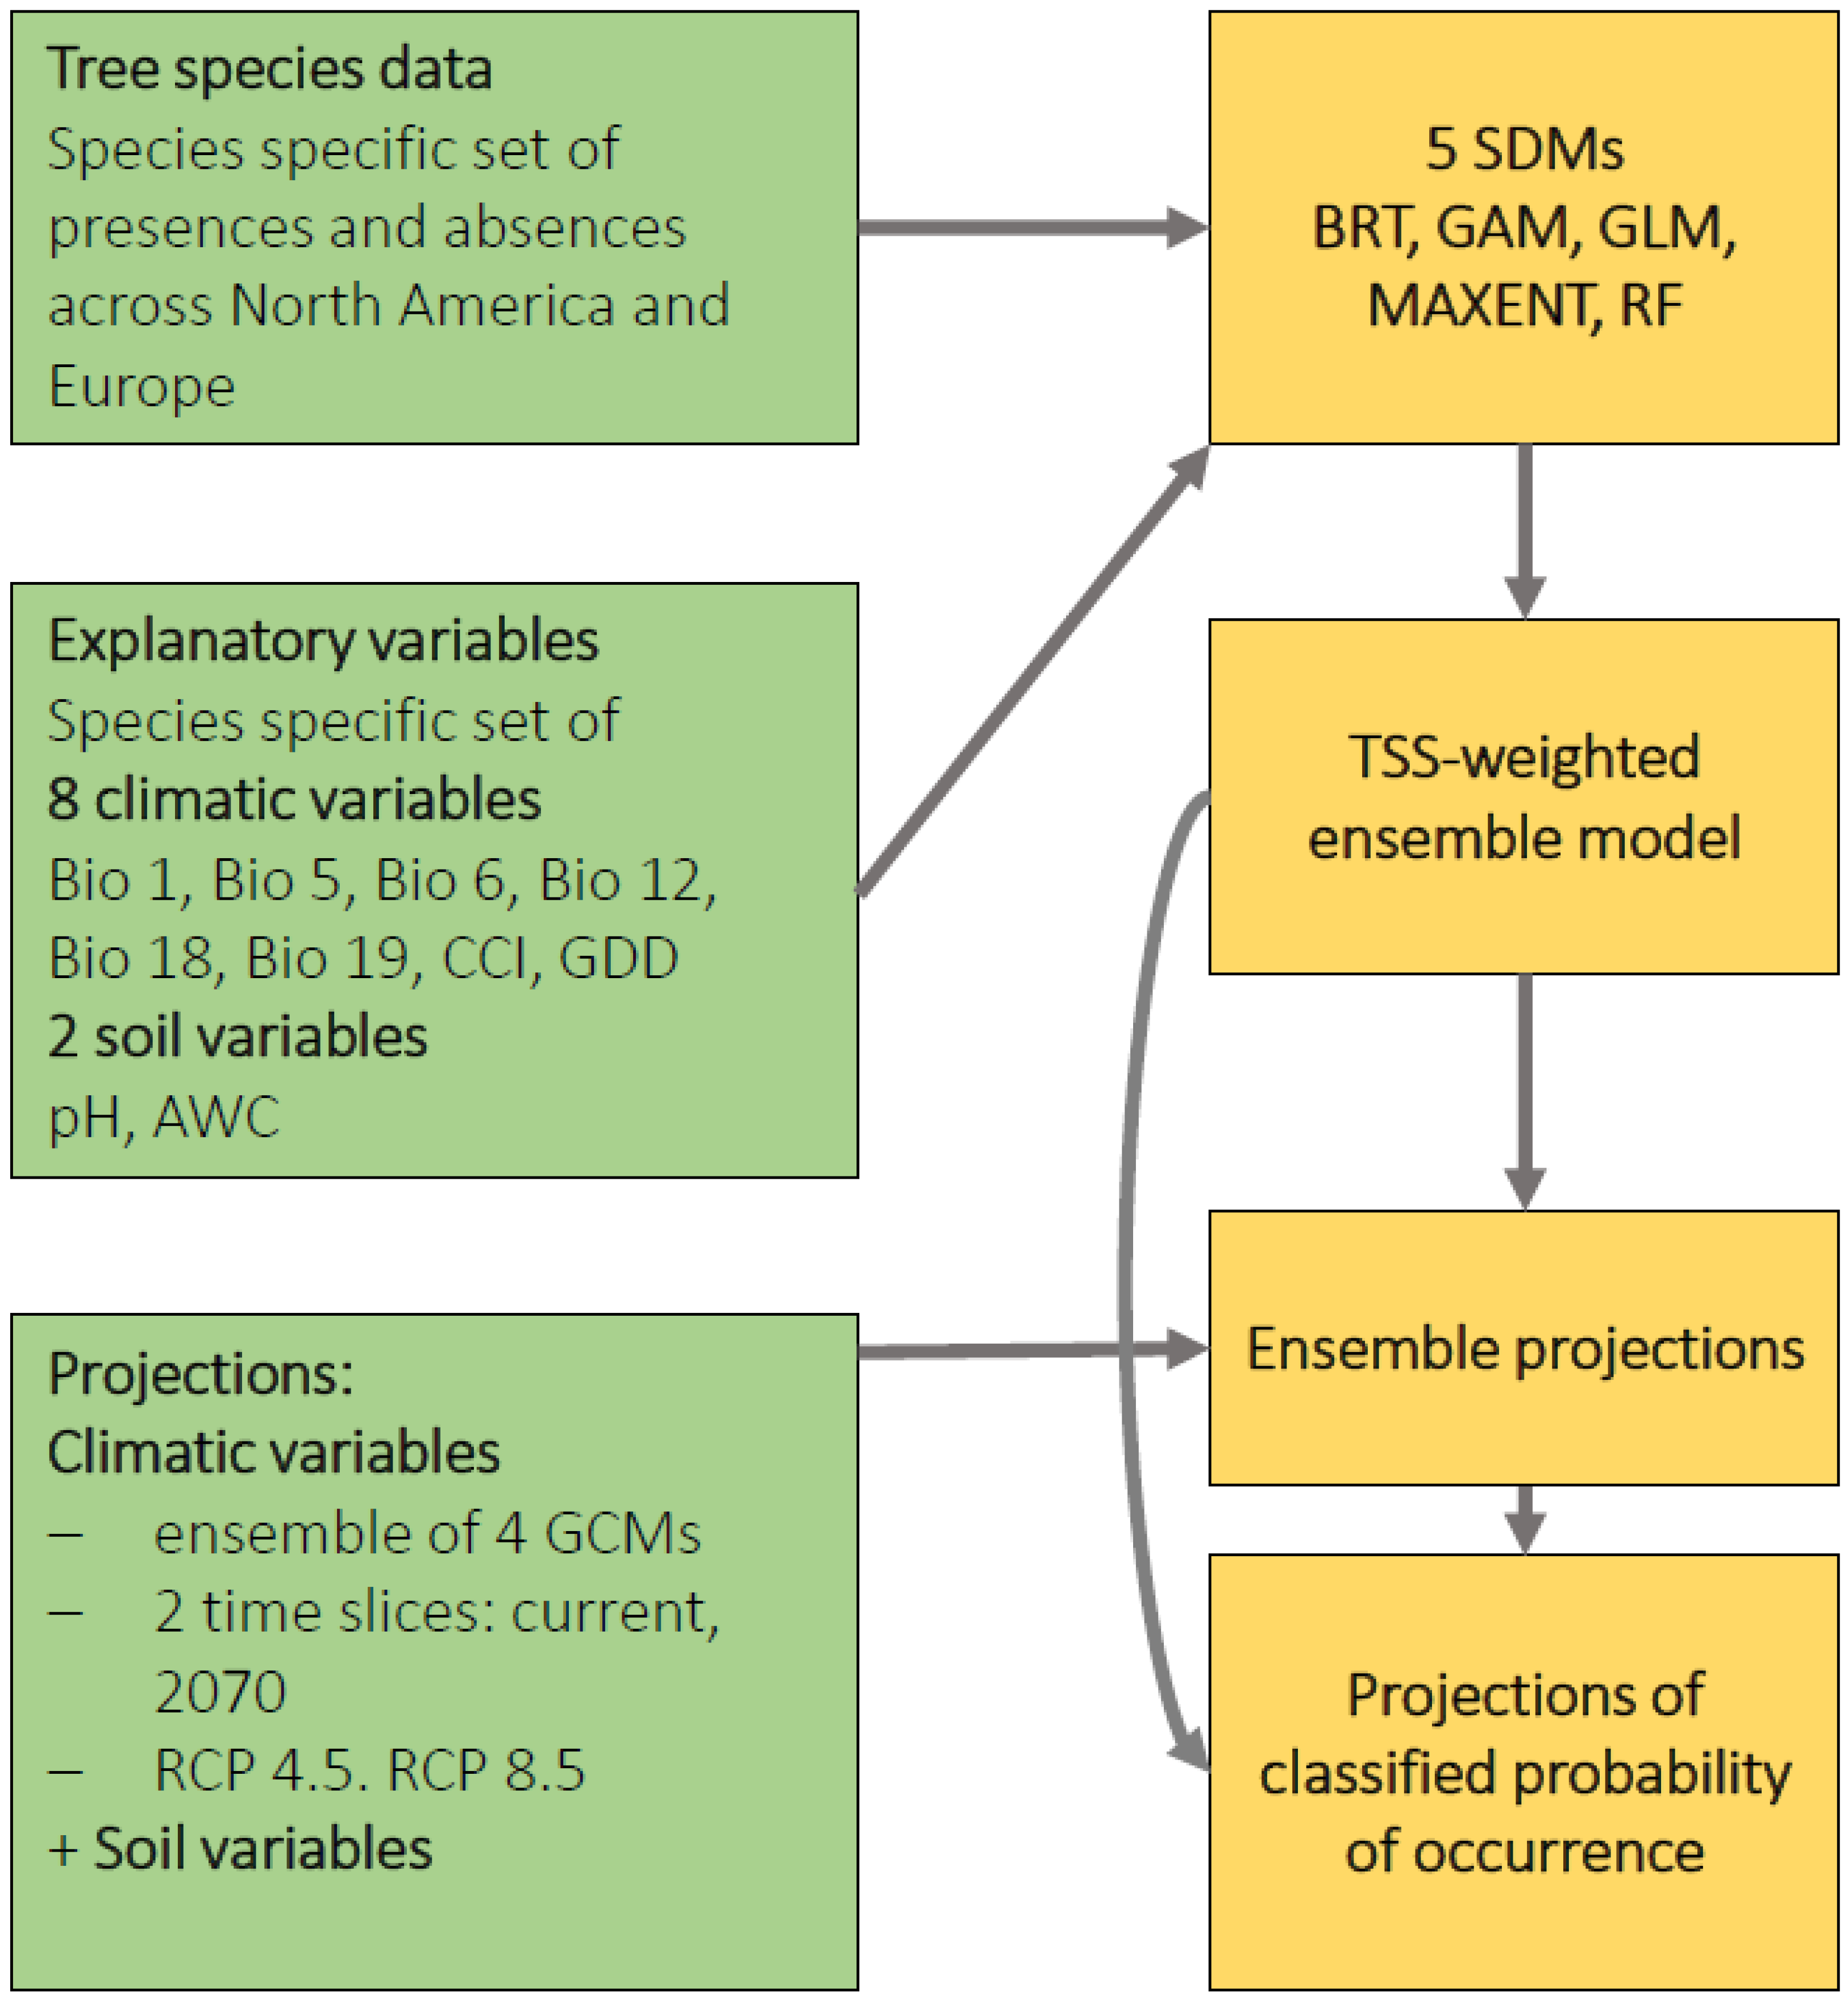
2. Materials and Methods

2.1. Climate Data

We used the dataset “Climatologies at high resolution for the earth’s land surface areas” (CHELSA), Version 1.2 [26] as a source for current and projected climate data. Historic monthly data for the time slice 1979–2013 were downloaded for 19 bioclimatic variables (Bioclims), which are derived from the monthly temperature and precipitation values to generate biologically meaningful variables [27]. Additionally, monthly mean temperature data were used to calculate the variables growing degree days (temperature sum above 5 °C, GDD) and Conrad’s continentality index (based on the average annual temperature range and the geographical latitude, CCI; for (details see [28])). All climatic variables have a horizontal resolution of 1 km. As climate change scenarios, we used the representative concentration pathway (RCP) scenarios 4.5 (intermediate-emission scenario) and 8.5 (high-emission scenario) for the time slice 2061–2080, hereafter 2070, which were published in the IPCC’s fifth Assessment Report (AR5) in 2014 [29].
We selected four global circulation models (GCMs) out of the IPCC’s CMIP-5 model ensemble provided in CHELSA, based on the application of the envelope approach [7,8,29,30,31]. In this approach, the GCMs that represented climatic extremes were selected, based on their performance in predicting future temperature and precipitation parameters, e.g., bioclimatic variables. For this selection, we used the web application “compareR” [32], which provides scatterplots showing variable-specific differences in future predictions of a GCM ensemble (scatterplots not shown). Our final selection considered the following GCMs: MPI-ESM-LR [33], GISS-E2-R [34], IPSL-CM5A-LR [35], and HadGem2-CC [36].

2.2. Tree Species Data

Serving as a basis for this study, a systematic, literature-based multicriteria decision analysis (MCDA) was carried out in a previous study [10] to evaluate the potential of promising complementary candidate species in terms of their future suitability in Central Europe. Since this study was published in German, we briefly repeat its key steps. Among the total of 33 investigated species were native species currently growing as admixed or minor tree species as well as non-native tree species from neighboring European countries or from other continents. Their selection was based on expert interviews aiming at ranking their potential drought and heat tolerance under continued climate change as well as the continued provisioning of multiple ecosystem services of forests. Several North American tree species were included in that list.
Out of this and similar preliminary studies [10,37,38], we selected the following six North American species due to indications for an increasing climatic suitability in Europe: Red oak (Quercus rubra L.), Yellow-poplar (Liriodendron tulipifera), Black locust (Robinia pseudoacacia L.), Ponderosa pine (Pinus ponderosa P. Lawson & C. Lawson), Grand fir (Abies grandis (Douglas ex D. Don) Lindl.), and Douglas fir (Pseudotsuga menziesii (Mirb.) Franco var. menziesii). For Douglas fir, only the provenance menziesii var. menziesii was selected, as var. glauca is prone to fungal infestation by Rhabdocline pseudotsugae and thus currently poorly distributed in Europe [39]. The potential of some minor native species from the previous study [37] was already examined with SDMs in a different study [40], leaving the North American species yet to be tested. Their geographical distribution in the analyzed data is depicted in Figure 1. The selection procedure did not follow a formal quantitative method but can be described as a qualitative preselection.
The 35 considered criteria per species encompassed five groups: (1) silvicultural criteria (e.g., required site conditions, competitive strength, light demands, etc.), (2) growth and yield potential (e.g., total volume production, availability of site index curves, etc.), (3) timber use potential (e.g., wood density, weathering resistance, etc.), (4) ecosystem services (e.g., landscape aesthetics, fall foliage, potential for insect pollination, etc.), and (5) risks (e.g., pathogens, drought and fire tolerance, invasiveness, etc.). This broad range of criteria was intended to adequately represent the multifunctional characteristics of the decision situation “choice of adapted tree species”. By applying different weights to certain criteria or criteria groups, the MCDA method can be modified by the operators to suit individual preferences of decision-makers, as it is a common feature of the MCDA. Further details on the methods and findings are available in [10].
The investigated tree species can be divided into the geographical groups “western” and “eastern”, due to differences in climatic patterns of each geographical region. Western species, mainly growing in Southwestern Canada and the Pacific Northwest of the United States are P. ponderosa, P. menziesii var. menziesii, and A. grandis. Eastern species are located in the Eastern and Southeastern United States, namely, Q. rubra, L. tulipifera, and R. pseudoacacia. The “western” species naturally grow under predominantly lower maximum temperatures of the warmest month (Figure 2a) and low precipitation during the warmest quarter compared to the “Eastern” species (Figure 2c). The east of North America has a similar precipitation during the warmest quarter to the majority of Central Europe with approximately 200–350 mm. The west of North America experiences much less precipitation during the warmest quarter with 50–150 mm, which is similar to southern European summer precipitation patterns. In terms of temperature of the warmest month (Bioclim 5), eastern species mainly occur in conditions with maximum monthly temperatures of 24–32 °C, and western species predominantly in conditions with 21–26 °C (A. grandis and P. menziesii var. menziesii) and 24–28 °C (P. ponderosa), respectively (Figure 2a).
To gain insight into the potential range of the tree species, we combined occurrence data from their native range in North America and their naturalized range in Europe. For the native range, we used occurrence data provided by Thompson et al. [41], which are based on tree atlas data [43] showing the species’ natural geographic range. This large dataset contained sufficient presence points for model calibration for each species (Table 1), with prevalence values ranging from 2.5% for A. grandis to 28.4% for Q. rubra. We used the EU-Forest database [44] for European occurrence data. This dataset contains forest inventory data from 21 European countries as presence–absence data. As true absences were missing in that dataset, we handled all points where the presence of a species was not captured by the inventories as pseudoabsences. The EU-Forest dataset was sufficient to fit models for R. pseudoacacia, Q. rubra, and P. menziesii var. menziesii (Table 1). A. grandis, L. tulipifera, and P. ponderosa were modeled exclusively with North American occurrence data, as there were insufficient presence points captured by European forest inventories. The minimum was defined as 500 presence data points (prevalence >0.2%), as models with fewer presence points showed worse performance and transferability, tested in preliminary model runs.

2.3. Soil Data

Soil data were acquired from openlandmap.org (accessed on 13 February 2018) [42]. This dataset provides 11 edaphic variables at six standard depths (0, 10, 30, 60, 100, and 200 cm), at a 250 m horizontal resolution. For our approach, we used the mean soil pH in H2O at a 0–30 cm depth (pH), and the soil available water capacity in mm (AWC), summed for the soil depths of 0–100 cm.

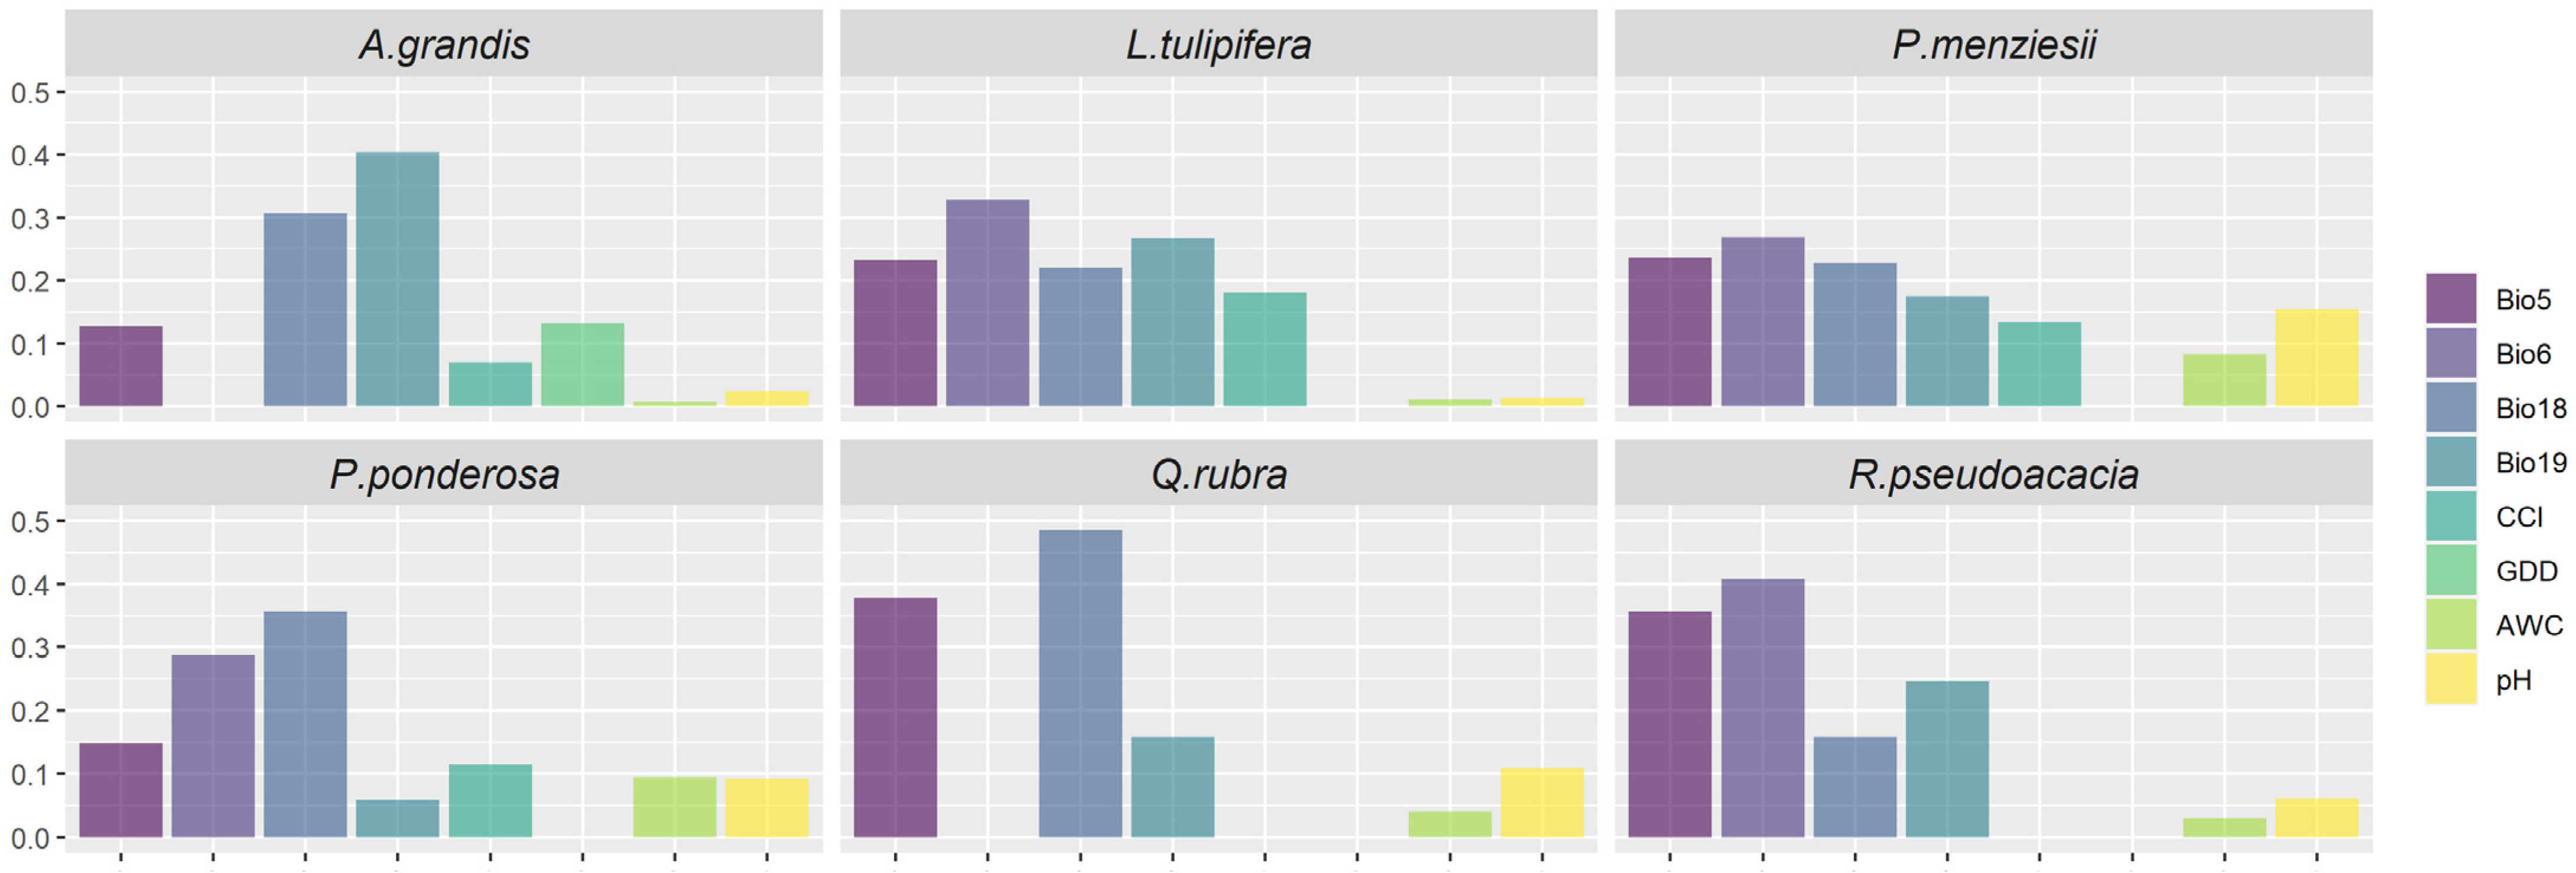
2.4. Explanatory Variables

The choice of environmental variables preferably considers the ensemble of ecological requirements of a plant species. Heat, water, nutrient supply, and extreme climate conditions, particularly in times of climate change, have the greatest effects on speciesdistribution [45]. Therefore, we preselected variables that were meaningful in terms of the species’ ecophysiology [45,46,47] and that had a great variable importance in previous studies, e.g., [7,48,49]. The annual mean temperature (Bioclim 1), the temperature extremes of maximum temperature in the warmest month (Bioclim 5), the minimum temperature in the coldest month (Bioclim 6), and the GDD were selected as temperature variables. As suggested by other authors [8,50,51], we additionally selected the CCI to potentially account for variations in seasonal temperature differences. Precipitation variables were used to consider the water availability for the tree species. We selected annual precipitation (Bioclim 12), the precipitation of the warmest quarter (Bioclim 18), and the precipitation of the coldest quarter (Bioclim 19). As plant-related soil variables, the available water capacity and soil pH in the topsoil layer (0–30 cm) were selected.
As a second step of variable preselection, the variance inflation factor (VIF) and Pearson’s correlation coefficient analysis was applied to exclude multicollinearity among the predictor variables. A correlation coefficient of 0.7 and VIF values of >10 were defined as thresholds for the final variable selection [52].

2.5. Statistical Modeling

The statistical analyses were performed with the statistical software R, version 4.0.1 [53] using the package BIOMOD2 [54].

2.5.1. Niche Transferability

As an initial step, we tested for climatic dissimilarities between North America and Europe by running a multivariate environmental similarity surface (MESS) analysis [55]. This analysis tests if the environmental conditions in the introduced range are unknown for the species (novel environment), or if there are similar conditions (environmental analogues), as model extrapolations should not be performed without environmental analogues [56]. The MESS analysis offers insight into model transferability by comparing the environmental range of the predictors between the native and naturalized species ranges using a MAXENT model. Here, we compared the ranges of the preselected bioclimatic variables and the CCI between the current climate in Europe and North America. A map is produced that shows the differences and similarities in the environmental range of the predictors by assigning positive values for similarities and negative values for novel environments [55].

2.5.2. Species Distribution Models

For analysis purposes and to avoid spatial autocorrelation, the tree species data were converted to an equal point grid with a resolution of 4 km. This dataset contained 988,880 observations in North America and 250,048 observations in Europe. Each point located within the species range represented a presence point. All remaining data points served as absence data to create binary models, while considering true absences in North America and pseudoabsences in Europe. Due to the varying prevalences among the species in North America, absences were randomly sampled to build models with equally balanced presence and absence points (Table 1). In the case of combined data from Europe and North America, both datasets were first weighted to similar observations, then combined to generate subsets of similar ratios of presence–absence data for both continents per species [57]. For evaluation purposes, the datasets were randomly split into training data (70%) and testing data (30%) [45]. Using the training data, we applied ensemble models containing five algorithms: boosted regression trees (BRT), random forest (RF), generalized linear models (GLM), generalized additive models (GAM), and maximum entropy (MAXENT). A weighted mean of the model algorithms was computed using the true skill statistics (TSS), selecting models above the quality threshold of 0.6 [58]. This model evaluation metric is independent of prevalence when using balanced data [25,59]. The TSS and area under the receiver operating curve (AUC) were used to evaluate the models. To test model uncertainties, the coefficient of variation (CV) among the individual models was investigated for current climate conditions, with high CV values representing a high variation between model predictions and thus a higher model uncertainty. The relative variable importance was computed for each species ensemble model as introduced by the BIOMOD2 package.
Biotic interactions are important to consider in species range shifts and SDMs [60]. For shifts in tree species, competitive interactions between tree species [61] and pathogen–tree species occurrence interactions would be especially relevant. However, we were not able to implement biotic interactions due to several limitations: (1) For the three species L. tulipifera, A. grandis, and P. ponderosa, we were lacking appropriate data for co-occurrence with European tree species, (2) the approach of pairwise dependencies based on multiple independent equations is considered to be inappropriate for model predictions, and (3) biotic interactions are not constant over time and space, making predictions to some degree unrealistic [60]. The consideration of selected aspects of biotic interactions might have been possible for some species. However, in favor of a consistent modeling approach for all considered species, we opted for the application of traditional SDMs without biotic interactions.
After projecting the probabilities of occurrence, the continuous values were converted into suitability classes according to Hanewinkel et al. 2014 [62], who introduced four management classes, ranging from a core distribution area to no occurrence area. We selected three threshold values in order to establish four classes: the maximum TSS (TSSmax), the false negative rate, and the false positive rate. The following suitability classes were defined based on these thresholds: (1) core distribution, (2) extended distribution, (3) occasional distribution, and (4) no distribution. We performed several preliminary cross-validation runs, as suggested in recent studies, e.g., [49,63], but did not detect stark effects on model performance values and predicted suitability. For the final models, we excluded several cross-validation runs to be able to perform the class definition as described above. To quantify area gains and losses in percentages (presented in Section 3.4 and Table 5, we translated the four suitability classes into two binary classes: suitable (classes one and two), unsuitable (classes three and four). The classification approach was applied to facilitate a summarized interpretation and the applicability of our continuously scaled response variable.
The consecutive steps of data preparation, model fitting, and model projections are summarized in Figure A1 (Appendix A) and illustrate the ensemble modeling approach.
In this study, we apply the term suitability within the framework of SDMs, following the assumption that only environmental parameters contribute to the suitability of a species. Here, it can be considered synonymous to the term probability of occurrence, but suitability is favored due to its facilitated readability.

3. Results

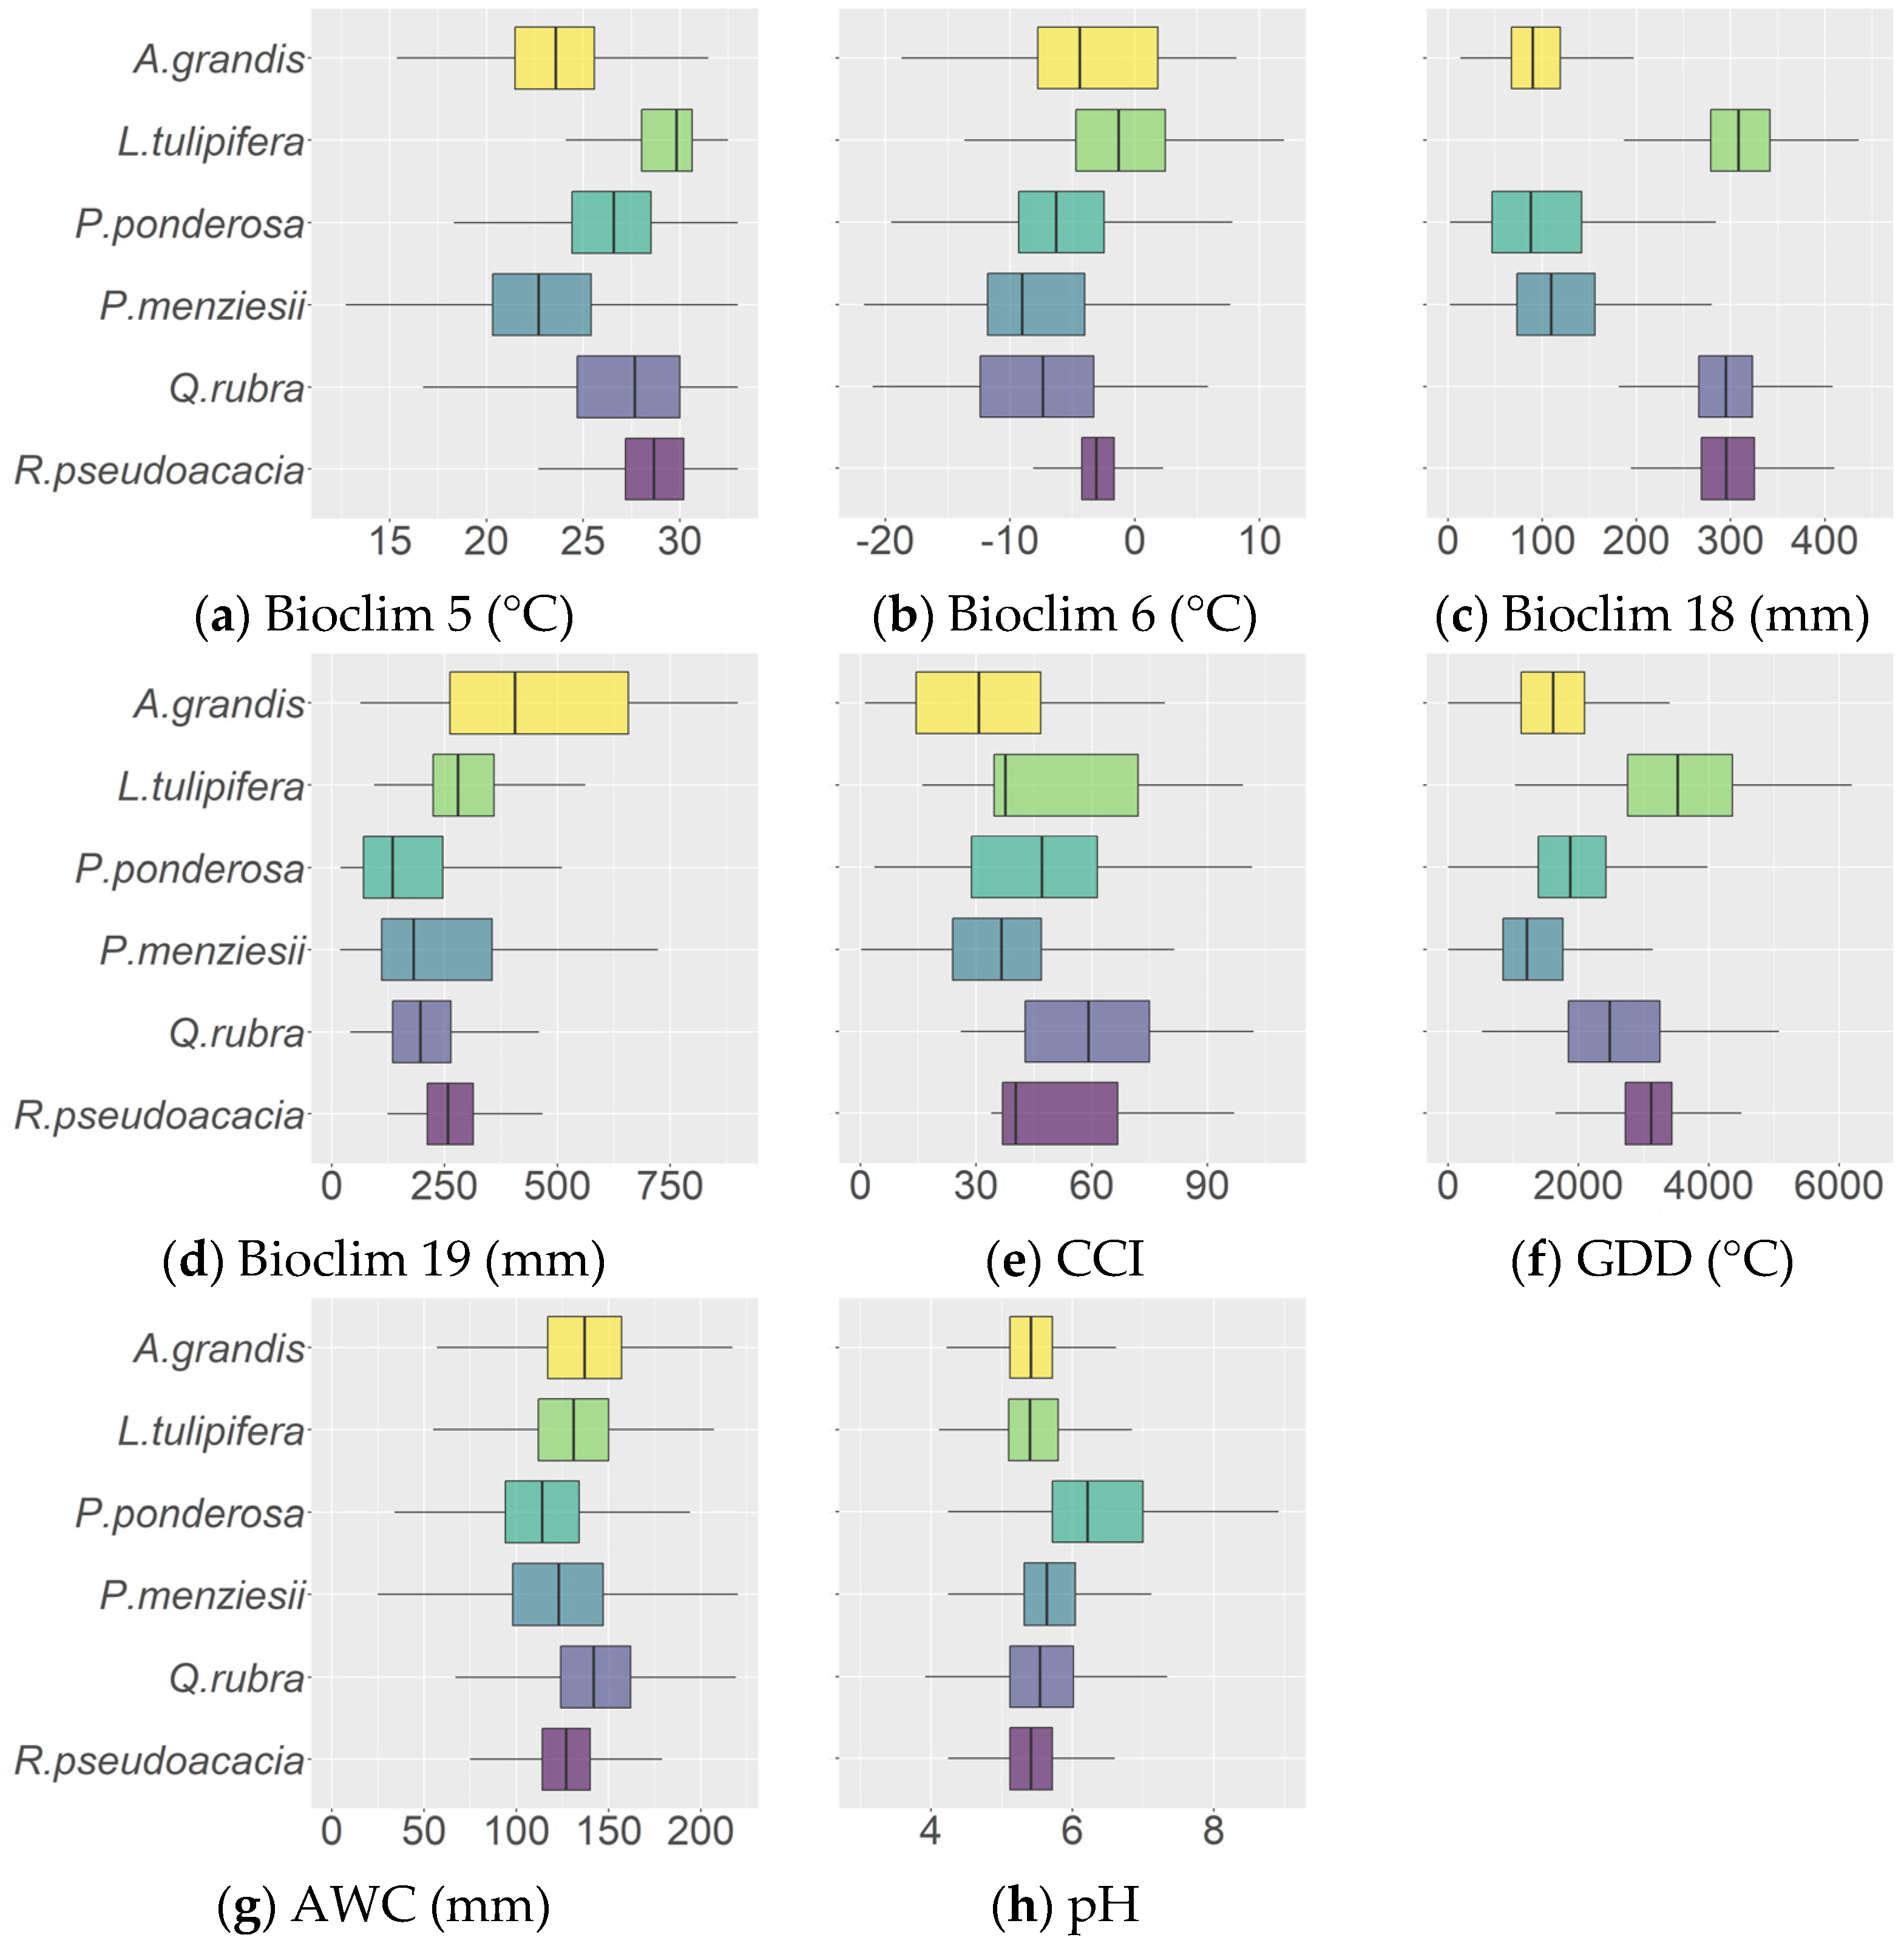
3.1. High Climatic Similarity between the Native and Introduced Ranges

The niche transferability tested with the MESS analysis of North American tree species to Europe showed practically no limitations for the majority of European sites, when evaluating all analyzed bioclimatic variables simultaneously (Figure 3a). However, the transferability showed a gradient across Europe starting from a very low, yet positive, transferability in Southern Europe and Scandinavia to a higher transferability with strong environmental analogues being located in Eastern and Southeastern Europe. The highest overlap for all selected Bioclim variables (Figure 3a) was found in Central Ukraine. Negative values and thus a large dissimilarity were detected in Novaya Zemlya, Northern Russia.
Analyzing the climate variables individually, the MESS map of Bioclim 5 (temperature of the warmest quarter, Figure 3b) showed similar patterns when compared to the map of all selected Bioclim variables (Figure 3a) and projected a substantially higher transferability in Southern and Southeastern Europe. In contrast, the minimum temperature of the coldest month (Figure 3c, Bioclim 6) showed higher similarities for a large band from Southern Scandinavia to Southeastern Europe, with decreasing yet positive similarities toward both Northeast and Southwest Europe. The precipitation of the warmest quarter (Figure 3d, Bioclim 18) showed quite homogenously high similarity patterns throughout Europe, with a low but still positive similarity in only small areas, such as on the Iberian Peninsula, the Alps, some Mediterranean islands and coastlines, and bordering the Caspian Sea. The continentality patterns of North America had the highest overlap with those in Eastern Europe, while Western, Northwestern, and Central Europe showed a limited transferability due to rather maritime climate patterns, yet with still positive values of similarity (Figure 3e).

3.2. Ensemble Model Performance

Within the ensemble model approach, most model algorithms performed well above the evaluation threshold of TSS > 0.6 (Table 2). The weighted ensemble models of each species performed very well with TSS scores ranging from 0.79 for Q. rubra to 0.98 for L. tulipifera, and excellent AUC scores of 0.97–1 (Table 3). Furthermore, the models showed sensitivity values (SE) of 0.88–0.99 and specificity values (SP) of 0.83–0.98. RF models showed the highest predictive performance among all model algorithms (Table 2).
The mean relative variable importance across all investigated species revealed a high influence of bioclimatic variables on model predictions, led by the minimum temperature of the coldest month (Bioclim 6), precipitation of the warmest quarter (Bioclim 18), and maximum temperature of the warmest month (Bioclim 5, Table 4). Conrad’s continentality index (CCI) and growing degree days (GDD) showed limited effects on model fitting and were therefore excluded in the final variable selection for two species (CCI) and five species (GDD), respectively (Table 4). The soil parameters showed very limited importance. The individual variable importance for each species model is presented in Figure A2 (Appendix A).

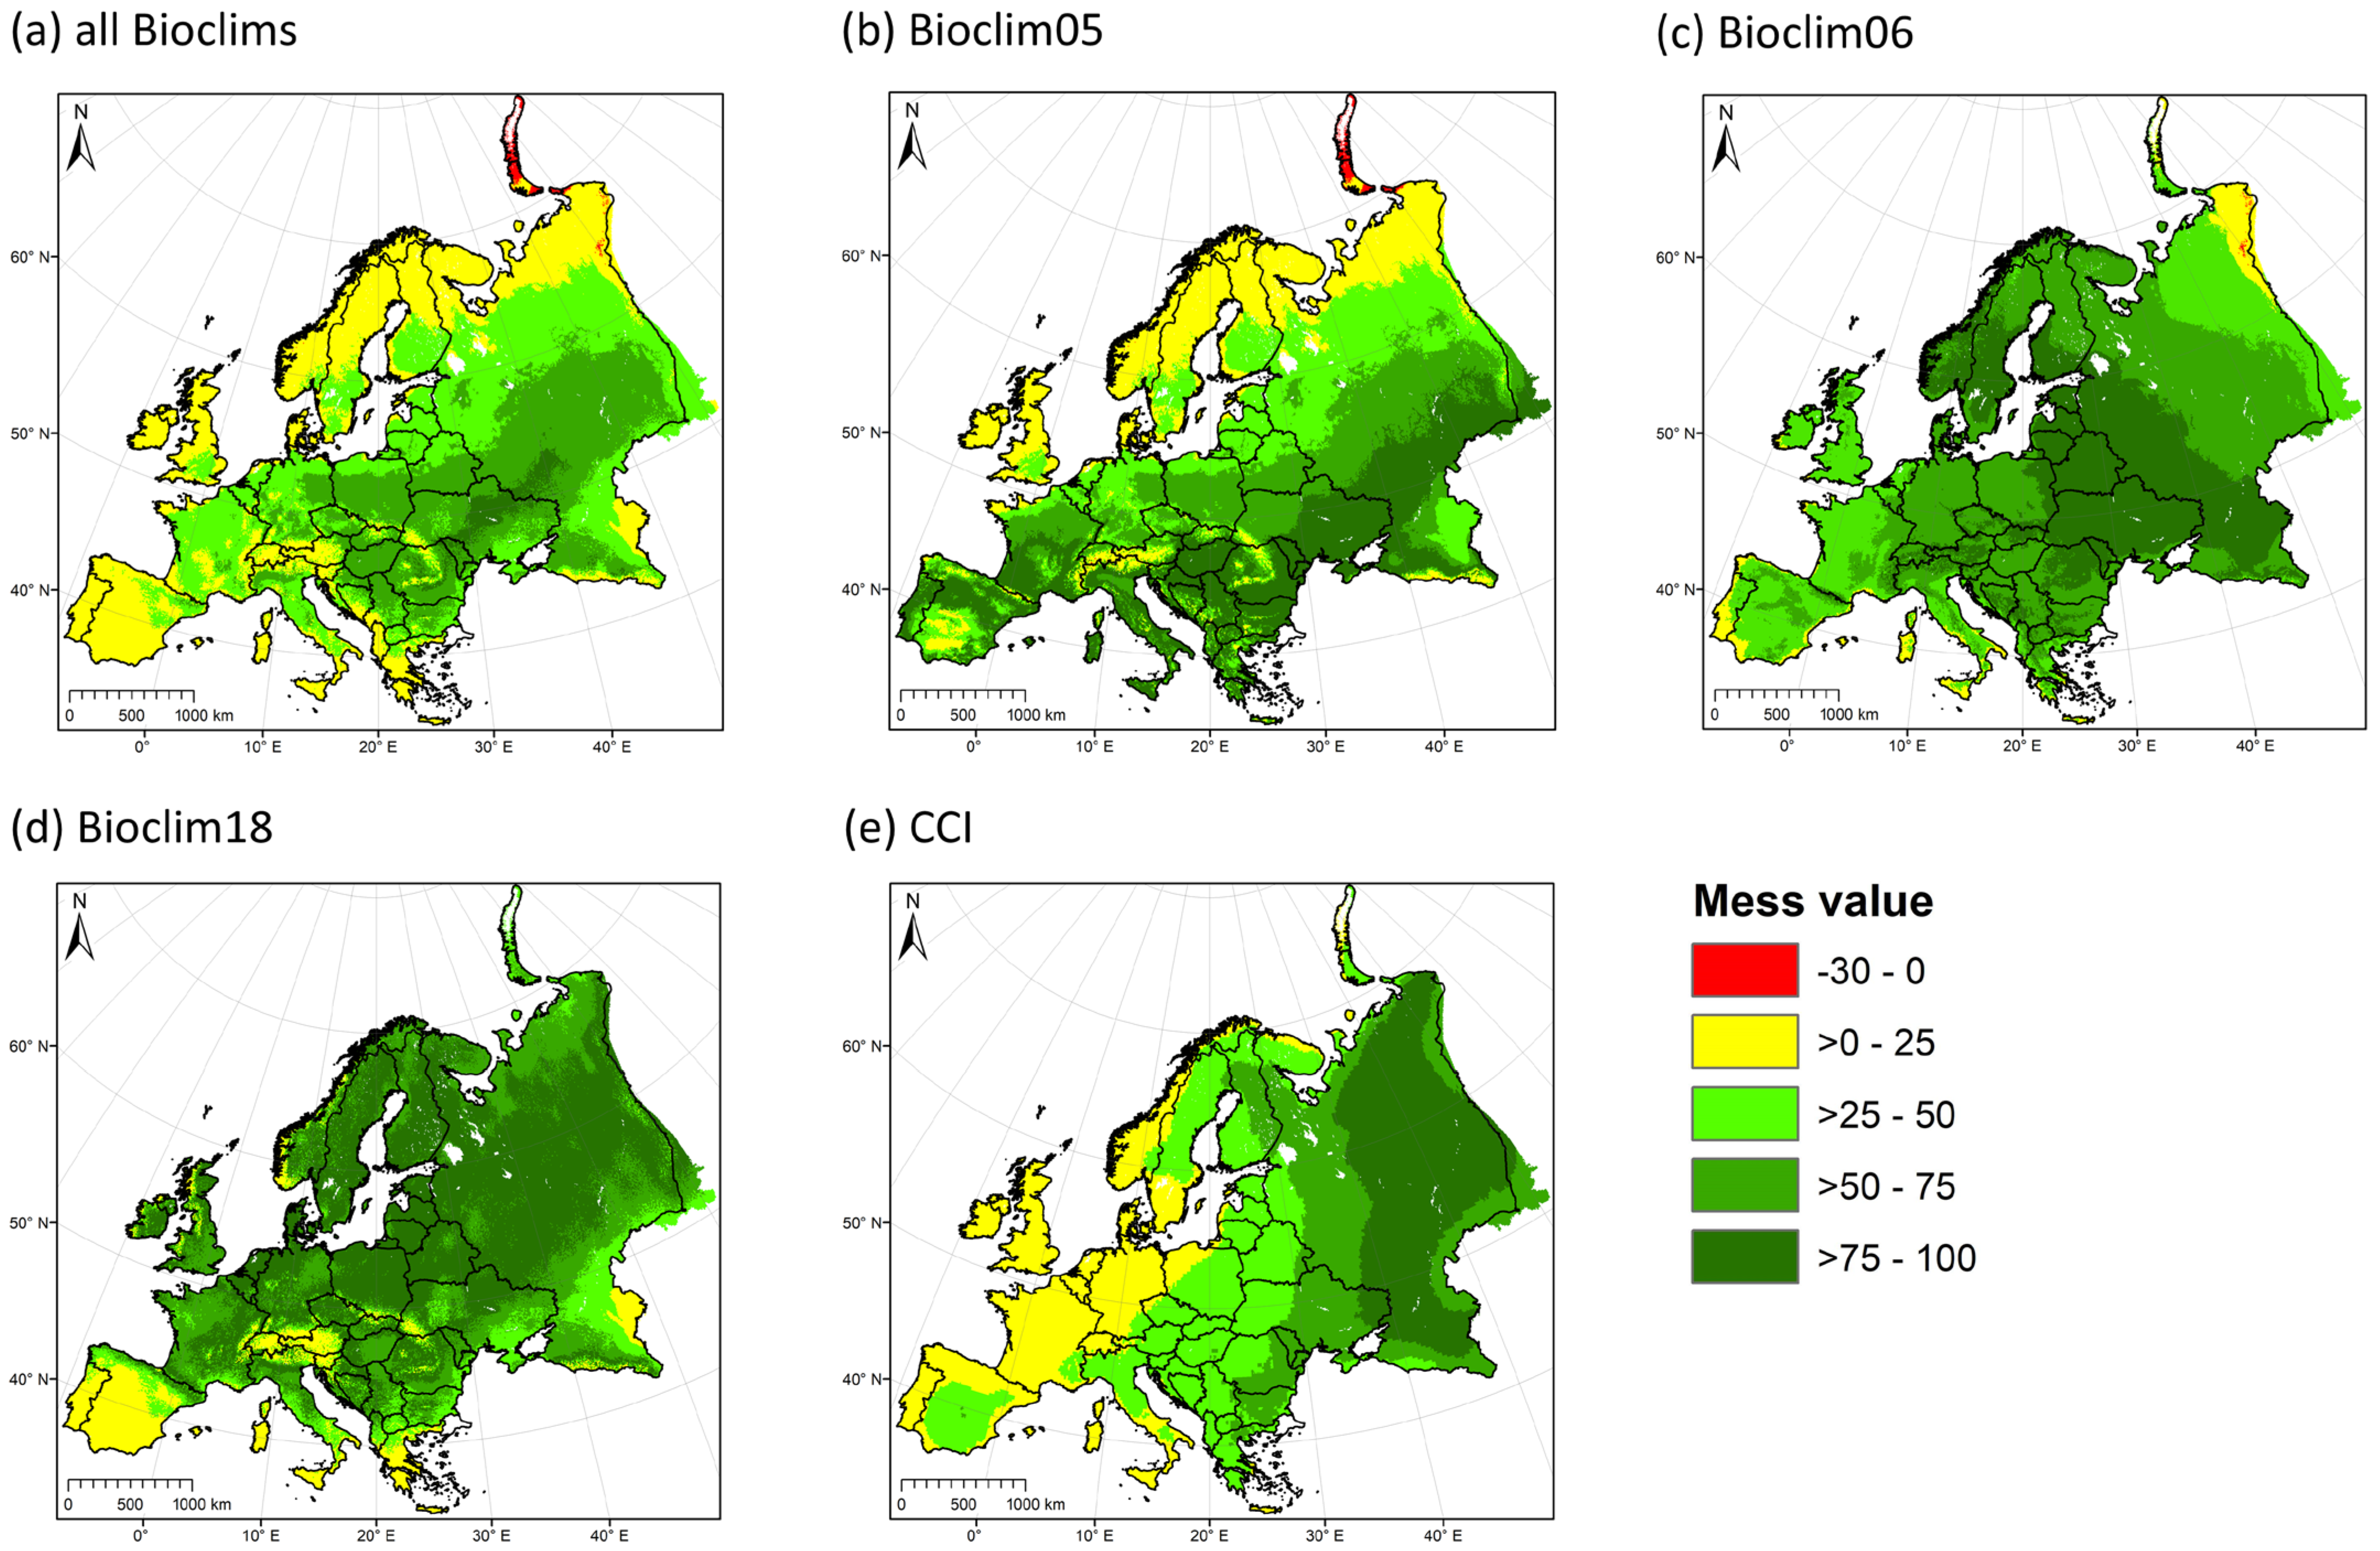
3.3. Model Uncertainty

The coefficient of variation (CV) among the individual model predictions within the ensemble showed geographically differing variability for current climatic conditions, with maximum CV values around 20%. However, a high consensus was found for the majority of Central Europe for P. menziesii var. menziesii, Q. rubra, and P. ponderosa (Figure 4).
For the other three species, a higher variance was detected within Central Europe. Areas of climatic extremes, i.e., Southern Europe, Northern Europe above the Arctic Circle, and the Alps, showed a higher model uncertainty in general. While the models in the ensemble showed high overlaps in predictions for P. menziesii var. menziesii, Q. rubra, and P. ponderosa, and with limitations for A. grandis, a high CV was detected for L. tulipifera and R. pseudoacacia in Northern and Northeastern Europe. With the exception of P. ponderosa and partially, R. pseudoacacia, all models identified high CVs for Southern Europe.
Besides geographical patterns, the classification into the suitability classes showed a stark influence on the variance among model predictions within the ensemble. Variance was low in areas of high suitability for all species, classified as suitability classes “core” and “extended”, compared to suitability maps in 3.4 (Figure 5). When a low suitability was detected (classes “occasional” and “none”), the variance was particularly higher among the model predictions.

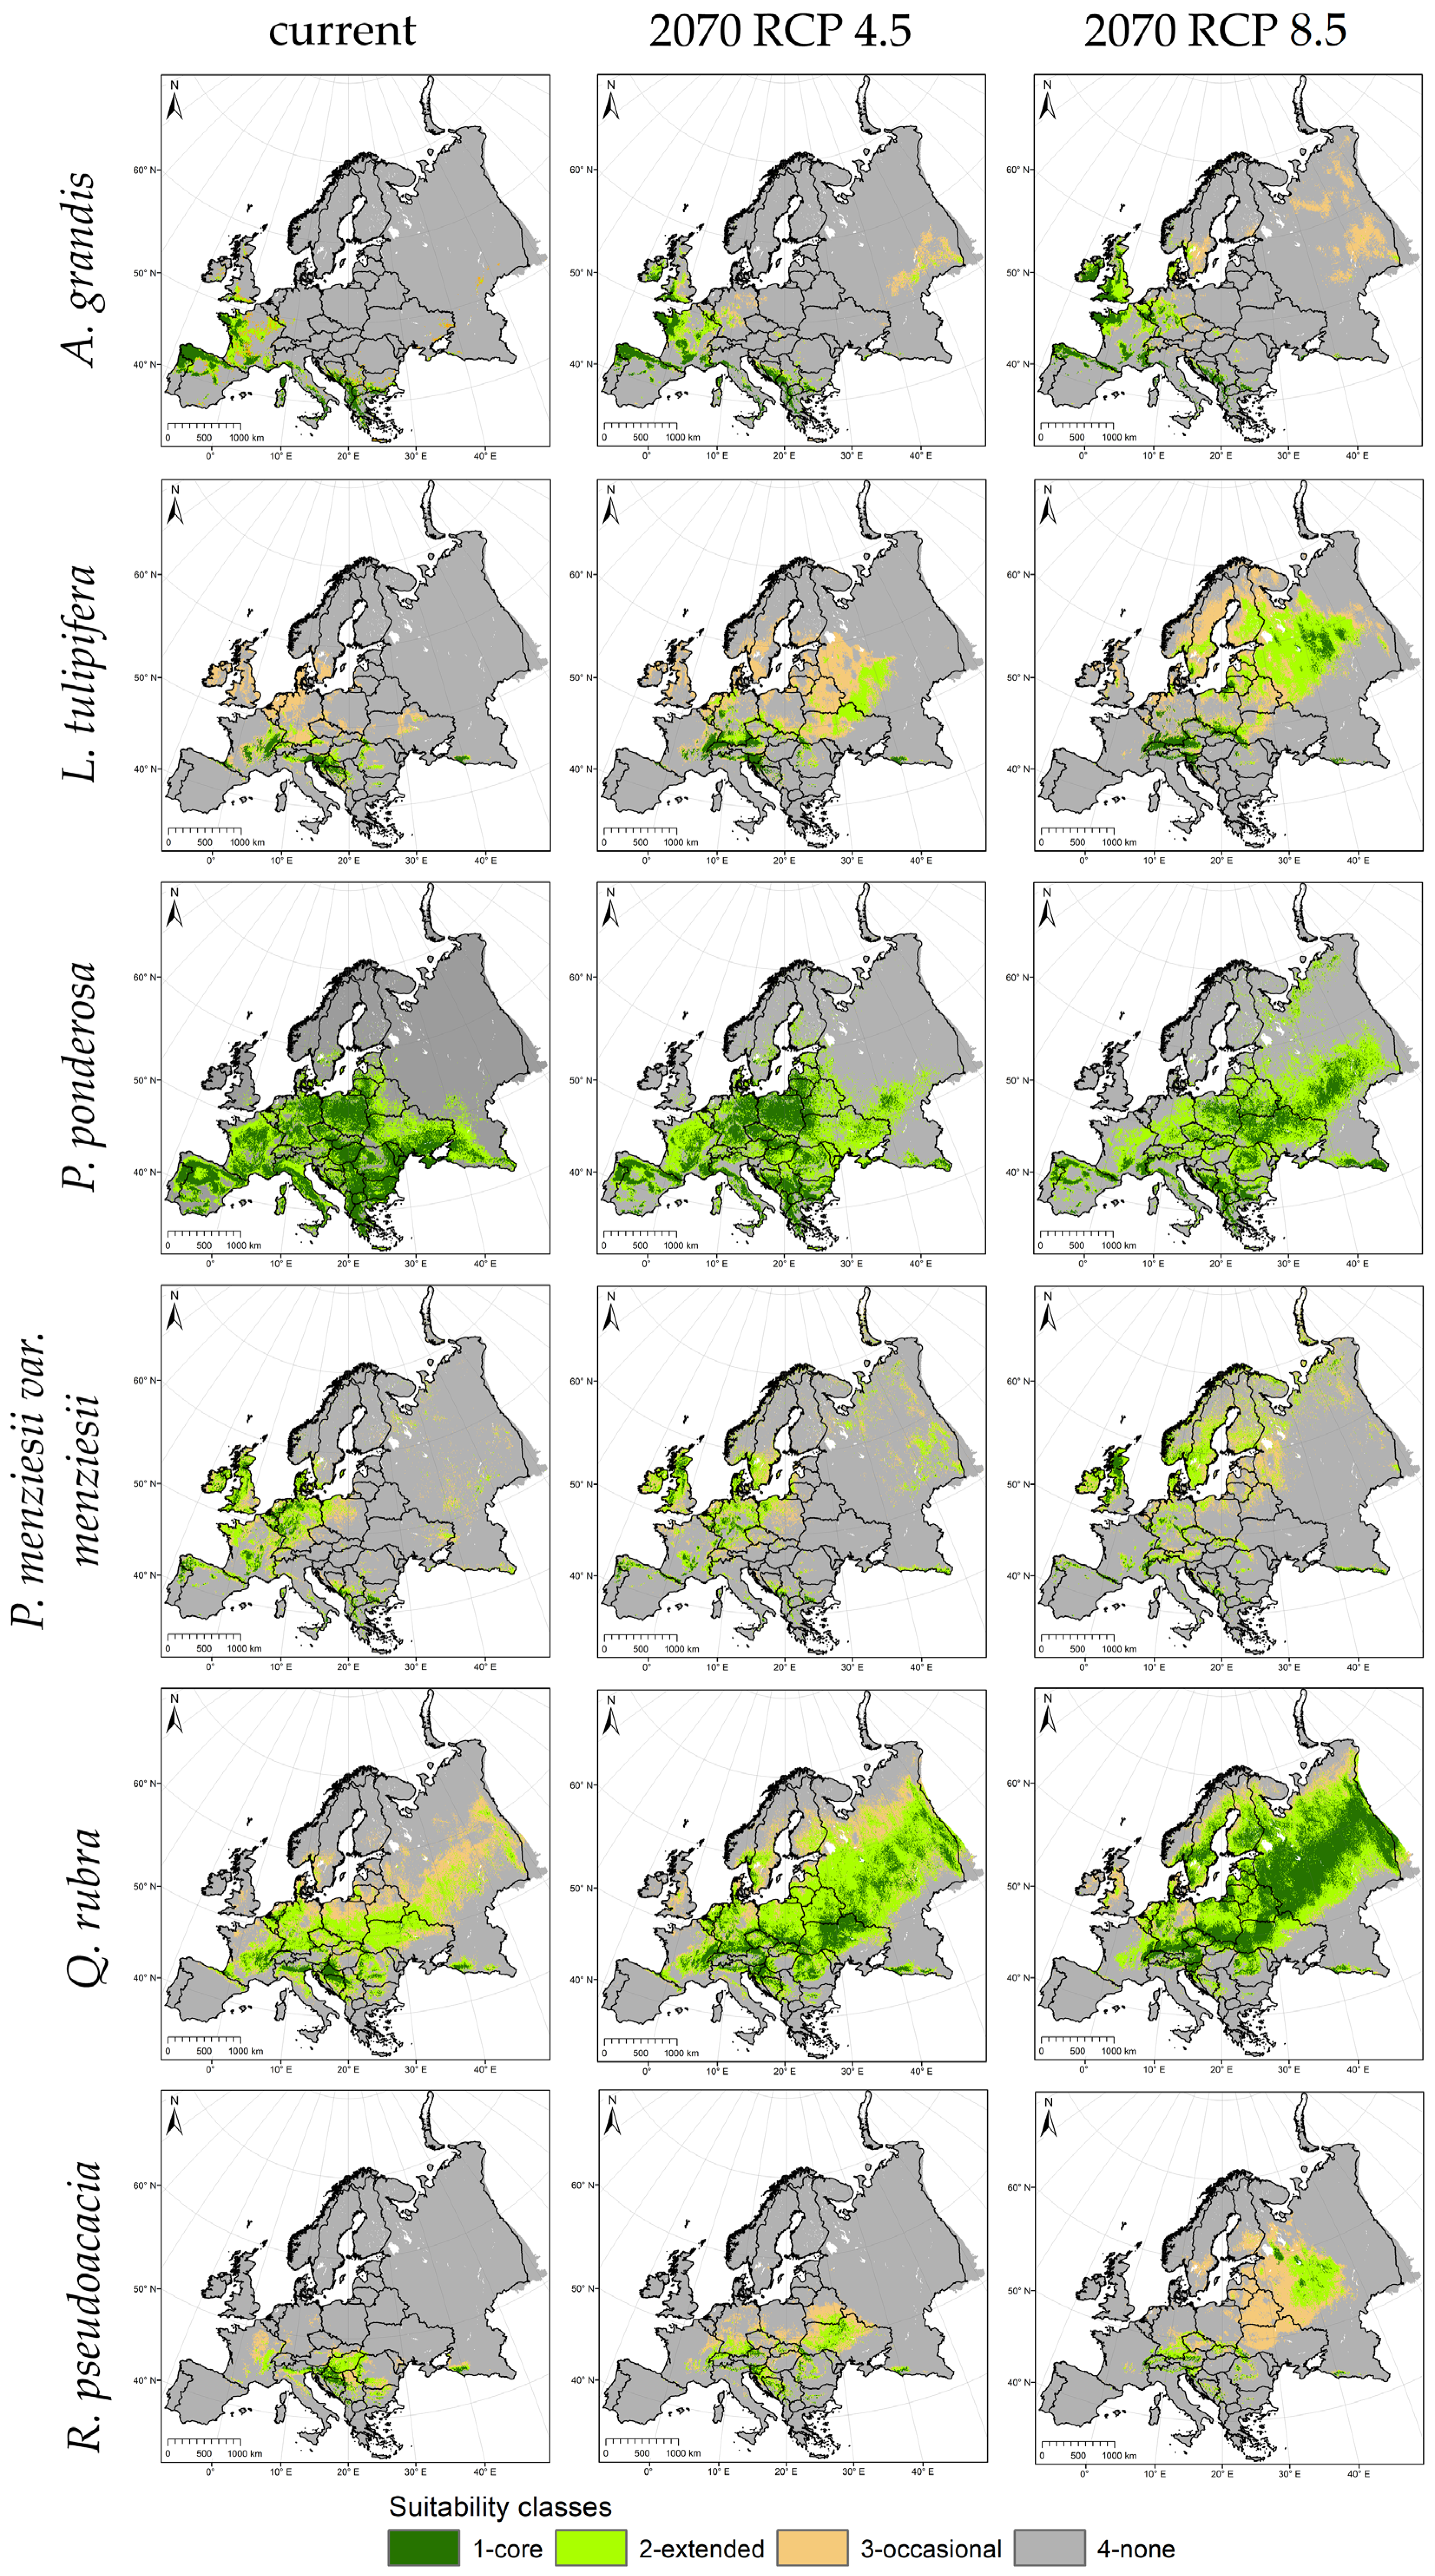
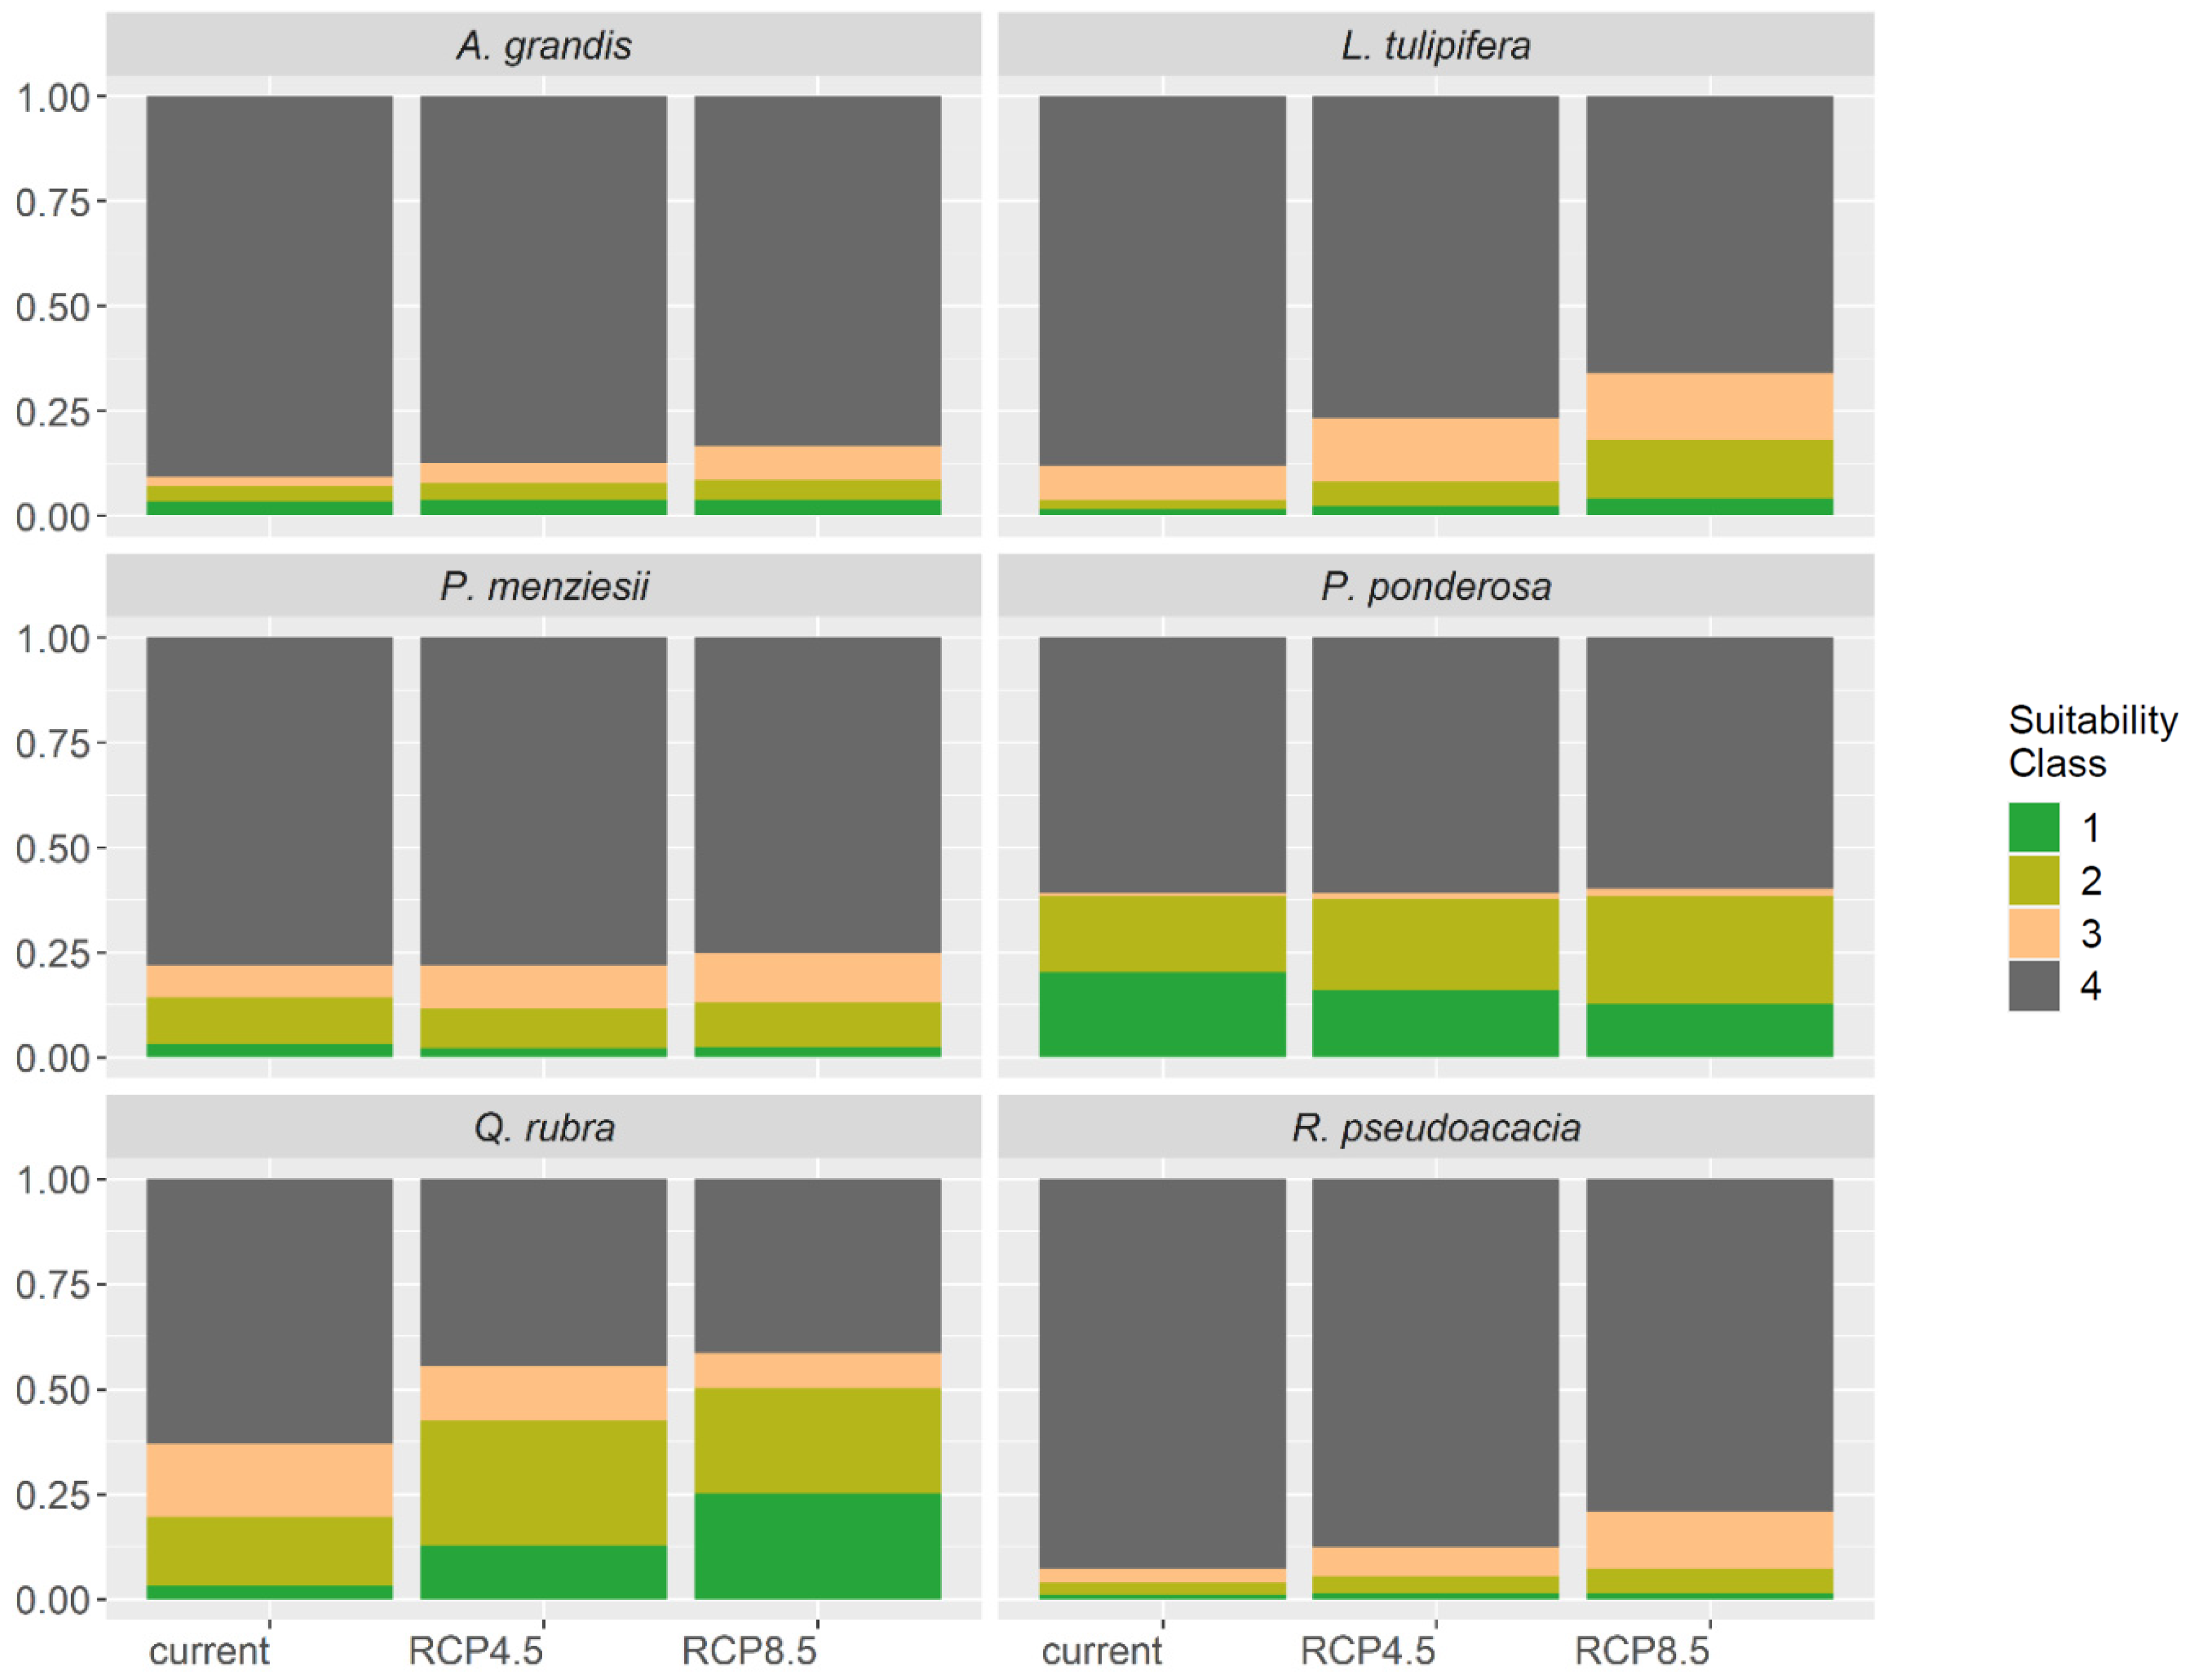
3.4. Range Shifts and Predicting Future Species Distribution in Europe

For four of the six investigated North American tree species, a gain in suitability in the future was projected for both emission scenarios, RCP 4.5 and RCP 8.5 (Table 5; Figure 5 and Figure 6). Further, we found a general northeast shift at the leading-edge ranges among all species, with range contractions appearing at the trailing edge, mostly in Southern Europe (Figure 5).
Table 5. Area gain and loss in 2070 for RCP 4.5 and 8.5 compared to suitability for current European climate. Suitability classes 1, 2 and 3, 4 are combined, respectively, to create two classes (suitable; unsuitable).
Suitability (%)Area Gain and Loss (%)
SpeciesCurrent2070 RCP 4.52070 RCP 8.52070 RCP 4.52070 RCP 8.5
A. grandis7.07.88.611.622.7
L. tulipifera4.08.218.3107.9362.1
P. menziesii var. menziesii14.311.513.1−19.8−8.6
P. ponderosa38.337.738.4−1.60.3
Q. rubra19.642.650.3217.5257.0
R. pseudoacacia3.85.57.147.789.6
Mean14.518.922.660.6120.5
P. ponderosa suitability is projected to remain rather steady in Europe during climate change. Under current climate conditions, P. ponderosa shows the highest overall suitability of the investigated species with 38.3% (Table 5). In 2070, under the intermediate- and high-emission scenarios, the suitability remains nearly stable with a loss of −1.6% for RCP 4.5 and a gain of 0.3% for RCP 8.5. While showing a steady suitability in Central Europe, P. ponderosa gains suitability in the northeast and loses in the west of Europe under the high emission scenario (Figure 4). L. tulipifera is projected to have very limited suitability in Europe for the current climate, with 4% of suitable areas overall. Under intermediate emissions, L. tulipifera is expected to double its suitability with a gain of 107.9% while showing relatively stable projections for Central Europe and expanding northeastward (Figure 4). Under high emissions, the suitability of L. tulipifera is projected to be nearly quadrupled (362.1%), expanding further in the northeastern direction while remaining relatively steady for Central Europe (Figure 4). Distinct gains in suitability are also projected for both emission scenarios for Q. rubra. For the current climate, suitable locations are in Central Europe (19.6%), ranging from the French west coast to eastern areas of European Russia (Figure 4). For both future scenarios RCP 4.5 and 8.5, strong gains in suitability are projected with 217.5% and 257.0%, respectively, showing a range shift towards Northeastern Europe, with suitable areas up to the 65th degree of longitude, while losing suitability in southwestern areas, mainly in France (Figure 4). R. pseudoacacia is projected to be suitable in only 3.8% of Europe, showing a high probability of occurrence in northern Italy, the Balkan countries, and the Russian coast land near the Black Sea (Figure 4). Under intermediate emissions, R. pseudoacacia shows a moderate gain in suitable areas (47.7%), expanding northward to southern Germany and the Czech Republic and northeastward towards Belarus, Ukraine, and Western Russia (Figure 4). Under the high-emission scenario, the gain of suitability increases further, identifying 89.6% of suitable areas, showing a clear northeast shift with a high suitability in European Russia. Under the current climate conditions, A. grandis is suitable in 7% of Europe, ranging from the coastal area of Western France, Northern Spain, and Western Portugal to Italy including Sardinia and Corsica, to south of the Balkan countries and Greece (Figure 4). In the future under RCP 4.5, A. grandis is projected to mildly gain in suitability (11.6%), shifting its potential moderately in the northeastern direction while diminishing slightly in most southern areas. This trend continues under high emissions while gaining a suitable area (22.6%) up to Great Britain and Ireland, some areas in South Scandinavia and Central Europe, predominantly in the Netherlands, Belgium, and Germany (Figure 4). P. menziesii var. menziesii is the only species that is projected to systematically lose suitability due to climate change in both emission scenarios. While currently being suited in 14.3% of Europe, particularly in Northern Spain, France, Denmark, Northern Great Britain, and Northern Poland (Figure 4), P. menziesii var. menziesii loses −19.8% of suitability under intermediate emissions (Figure 4) but only −8.6% under the high-emission scenario due to a northeast range shift with gains in Southern Scandinavia and Finland, while losing suitable areas in Germany and Poland.

4. Discussion

4.1. Hypotheses

4.1.1. Limitations in Niche Transferability (H1) and Ensemble Model Performance

Model extrapolation in space is an often criticized approach when environmental analogues cannot be identified in a new target area [56]. As long as environmental similarities are observed, the resulting maps should document their location [23]. We found almost no limitations in the niche transferability from North America to Europe based on the MESS analysis. Both univariate and multivariate approaches indicated moderately to highly similar climate patterns. Due to its conservative character, the multivariate similarity (Figure 3a) represents the lowest value of all considered variables. Understanding this conservative, pessimistic character, the predominantly positive results of this multivariate similarity can be interpreted as rather encouraging for the transferability.
Partly contrasting with our findings, Camenen et al. [57] detected a great difference between the native North American and the naturalized niches in Europe for Q. rubra and R. pseudoacacia, based on niche overlap and niche transferability. Here, SDMs performed best when calibrated with data from both ranges, scoring an average TSS > 0.94, well in accordance with our findings, where the predictive performance of the fitted ensemble models was also excellent in terms of the evaluation metrics TSS (mean TSS of 0.90) and AUC (mean AUC of 0.99; Table 2). However, despite niche differences and limited transferability, Camenen et al. [57] found a high niche similarity for Q. rubra and R. pseudoacacia, indicating a differentiated signal when using multiple indicators for transferability, overlap, and similarity.
Within the ensemble model approach of our study, RF models performed best among all species, corresponding well with the findings of Camenen et al. [57]. This high predictive accuracy of models utilizing combined data from the native and the naturalized ranges indicates advantages compared to models exclusively using data from the native range. Model predictions in space might be more accurate when both the naturalized, realized niche and the natural, fundamental niche are represented by the data [50,64,65] and when applying the RF model algorithms.

4.1.2. North and East Range Shifts of All North American Tree Species (H2)

Coherent with previous studies projecting North American species suitability both in the native species range [66,67] and the naturalized European range ([7,8,40,49,68]), we detected a north to northeast range shift at the leading edge for all studied species under climate change. We found anticipated contractions in the south of Europe at the trailing edge, due to hotter and drier conditions limiting species suitability, similar to the effects found by Liang et al. [69] and McKenney et al. [58] in the Northeastern United States. Whether these substantial projected range shifts are likely to happen at the pace of climate change is still largely debated (e.g., [69]). Analyzed for Q. rubra saplings in a study in North America, an above-average range-shifting velocity was found, allowing for some optimism about at least this species’ ability to keep up with the pace of climate change [67].

4.1.3. Changes of the Distribution Potential (H3)

Our ensemble model for P. menziesii var. menziesii identified suitable areas mainly in Northwestern Europe for the current climate, which corresponds well to the potential distribution of similar studies [7,50], and indicated a moderate loss in suitability for both emission scenarios in 2070. This limitation in suitability for future climate was also shown by projections in the native range of P. menziesii var. menziesii, where the suitability was predicted to decrease during climate change [70]. However, Schueler and Chakraborty [71] projected P. menziesii var. menziesii to be suited in Central Europe in the current climate while evaluating parts of Western Europe as not suited for the current time slice (1991–2010). This difference could be due to using occurrence data from the naturalized range only, which does not reflect the species fundamental, native or natural niche, and potentially the differing historic climate data used for modeling, as we used the time slice 1979–2013 for the recent climate.
We found a moderate suitability for Q. rubra under the current climate and an increase until 2070 for both RCP 4.5 and 8.5. The potential distribution in Southern, Western, and Central Europe corresponds well with the results of Camenen et al. [57] for the current climate, and is also in accordance with the results of Thurm et al. [8] with gains in suitability for future conditions and both scenarios. Dyderski et al. [7] calibrated models with occurrence data of Q. rubra from Europe and found a similar suitability for the current climate in Central Europe. However, their projections did not show suitable areas for Q. rubra in Northeastern Europe, neither under current nor future conditions for 2070. Moreover, the studies projected range contractions for the majority of Central Europe. Adding the naturalized range of Europe to our data set seemed to have a great influence on the projections since our models projected a much higher future suitability for Q. rubra in Europe. Overall, our results rank Q. rubra as a promising species, predicting a gain in suitable area under climate change, which is in consensus with Thurm et al. [8].
The suitability of R. pseudoacacia in Europe was found to be limited, especially for Central Europe under current climatic conditions. An extended suitability for R. pseudoacacia was projected in northeastern Europe under RCP 4.5 and 8.5. However, this contradicts the results of previous studies, using occurrence data from Europe [7,8,49] or combined data from native and naturalized ranges [57]. The limited suitability in our predictions could be due to the narrow native range of R. pseudoacacia (Figure 1), in regard to the small seasonal temperature and precipitation ranges for summer and winter, respectively (Figure 2). In the naturalized range in Europe, R. pseudoacacia shows a much broader amplitude in the represented climatic ranges [10,72] compared to the natural range, which could lead to more optimistic projections for Central Europe as found in the mentioned studies based on the naturalized range only.
P. ponderosa is the species that showed the highest suitability under current climate in Europe. While the suitability is projected to decrease under climate change, an expansion in northeastern Europe is predicted. There are indications that P. ponderosa could gain suitability under future conditions as projected by studies with case-study areas from its native range [73,74]. In contrast, a study in British Columbia [70] found minor losses for the suitability of P. ponderosa under climate change. A hint for the broad suitability of P. ponderosa in our study could be the broad distribution in the native range including a vast amplitude of climatic conditions [41]. For this species, no results from studies based on combined natural and naturalized ranges are known to the authors.
The ensemble model for L. tulipifera identified suitable areas mainly in Central Europe under the current climate, while the general suitability was limited. We projected moderate gains under the intermediate-emission scenario and stark gains under the high-emission scenario. This corresponds well to the findings of a recent study [75] where an expansion in suitability was projected for L. tulipifera under RCP 4.5 and 8.5. McKenney et al. [66] found a north, northwestern range shift for L. tulipifera during climate change for both RCP 4.5 and 8.5. in North America. L. tulipifera grows in high summer temperatures with high precipitation (Figure 1), the latter potentially being a limiting factor for future suitability in Europe. Yet, little is known about the distribution potential of L. tulipifera in the naturalized range due to a lack of occurrence data captured by forest inventories in Europe (Table 1), highlighting the necessity of applying innovative approaches, i.e., transferring SDMs calibrated in the native range, as performed in this study.
The suitability of A. grandis showed minor gains during climate change with only limited suitable areas in Western and Southern Europe. Thurm et al. [8] predicted that A. grandis will drastically lose suitability by 2070 for both intermediate- (−44%) and high-emission scenarios (−60%) while showing an above-average range shift potential. The reason for this loss could be the limited occurrence of oceanic climate in the naturalized range of A. grandis [8], a factor we could include by utilizing data from the wider native range that includes dry and moist conditions. In the native range of A. grandis, a north shift was projected by McKenney et al. [66], while other studies projected an accelerating decrease in suitability during climate change [70].

4.1.4. Species with Potential Area Gains (H4)

Summarizing the changes in the distribution potential, we conclude that Abies grandis, Liriodendron tulipifera, Quercus rubra, and Robinia pseudoacacia can be considered winner species under climate change, referring to their potential area gains in our SDM-based projections across Europe as a whole. In contrast, P. ponderosa and P. menziesii var. menziesii are projected to show a steady and decreased range potential under the moderate RCP 4.5 and the more realistic, while pessimistic, RCP 8.5, respectively. We thus argue that these two species can be considered neutral or loser species.

4.2. Strengths and Limitations of the Study

Projecting SDMs into the future comprises uncertainties and limitations. Thus, predictions should be handled with caution. State-of-the-art approaches such as climate ensemble modeling, RCP, and GCM ensembles offer the possibility to reveal the prediction uncertainties, for example, as the coefficient of variation between different model runs. This is advantageous since it displays the uncertainty and does not suggest a pseudoreliability of a singular point estimate as displayed by applying singular model types or model runs. The ensemble method also shows the high impact of the applied model algorithms, RCPs, and GCM selection on the SDM prediction outcome [76]. Uncertainty may also arise from using long-term, periodic mean values for the climatic input variables. Annually varying climate data would lead to annually varying distributions and maps and would thus display a greater variability. However, these annually differing distributions and maps would on average result in the long-term trends which we displayed based on periodic means. Since the reliability of SDM model predictions for future climatic conditions cannot be formally evaluated, e.g., based on deviations between predictions and observations, we can only hypothesize that the model reliability of ensemble SDMs is higher compared to singular modeling approaches, mainly by depicting areas of high and low model uncertainty.
Model and niche transferability in time and space also contain limitations. The main concern is the assumption that species have the same environmental requirements when transferred. Previous studies found a low niche overlap between North America and Europe [50,57], questioning transferability. A main aspect for accurately determining the niche overlap is identifying the variables with the biggest impact on the species distribution [77]. Moreover, the choice of the selected variables strongly affects the model predictions, as an SDM treats the selected variables as the binding niche requirements of a species, following the equilibrium assumption [78]. We selected bioclimatic variables that reflected climatic extremes and hence were expected to be crucial or exclusive during climate change, following the indications observed by other authors (e.g., [7,48,49]). Across all species, the temperature of the warmest and coldest months were the most important predictors. While the temperature of the warmest month was selected for all species’ models, the temperature of the coldest month was excluded for Q. rubra and A. grandis by the correlation analysis. If included in the models, predictions might be different due to the high importance of the temperature of the coldest month on species distribution (Table 4). Camenen et al. [57], who used a similar approach, declared the minimum temperature in winter, maximum temperature in summer, precipitation seasonality, and summer precipitation as the most important variables, which is in accordance with our findings, besides precipitation seasonality. We selected the CCI to account for the temperature continentality as a proxy for late frost events. As the continentality of North America mainly increases from south to north, while in Europe, it ranges mostly from west to east, the CCI might be the variable posing the biggest challenge for model transferability as a high similarity in continentality was mainly found for Eastern Europe (Figure 2).
As a highlight of this study, we used combined occurrence data from Europe and the species’ native ranges in North America to gain more insights into the species distribution potential. The data of Thompson et al. [41] are based on Little’s natural species ranges [43], published in 1971. Thus, these data do not account for interim dynamics, e.g., an increase in early and late frost events since the 1980s in Europe [79]. The potential of A. grandis, L. tulipifera, and P. ponderosa could be limited due to the unavailability of sufficient species presence data in the EU-Forest dataset (Table 1) [44]. However, species with small natural ranges and limited climatic distributions, such as A. grandis, have previously been found to hold potential for the greatest niche expansion [14] and hence might be promising complementary species for the future.
Next to climatic variables, we added soil variables (AWC and pH) to fit the ensemble models. Both variables were projected to have a minor effect on species distribution with the lowest measured variable importance among all variables. This could be due to the spatial data resampling from a horizontal resolution of 250 m to a coarse resolution of 4 km which inherently led to less variance in the variable ranges and thus could not account for site-specific conditions on smaller scales. We thus hypothesize that the lack of importance has to be attributed to the mismatch of spatial resolutions and not to the lack of thematic correlation.
We found the greatest influence of climatic variables on the predictions, as SDMs follow the assumption that environmental conditions determine the species distribution. However, biotic interactions could actually be the main drivers for niche differences between the native and naturalized ranges [80]. In our study, biotic interactions were largely unaccounted for due to a lack of data, limiting the interpretation of the potential niche occupancy in the naturalized ranges.
Our results assist informed decision-making concerning assisted migration. However, assisted migration is only one potential element of the forests’ adaptation to climate change. It can be advantageous due to an accelerated tree migration by introducing non-native species to suitable areas in the new environment (e.g., [78,81]). A natural tree migration as the more natural and thus preferable process of adaptation is often hampered by a migration lag, as species have previously not reacted as rapidly to natural climatic changes as would be necessary to cope with the speed of current anthropogenic climatic changes [8,66,69,82]. However, assisted migration is controversial as it is unpredictable how species disperse in a new environment and how invasive a species will be. From these considerations, the general concept of species mixtures and the avoidance of monospecific stands (e.g., [83]) receive further substantiation. We thus recommend planting non-native North American tree species in suitable areas only, only admixed with other native and non-native European tree species, and outside of protected areas with a strong focus on native tree species composition.
Besides assisted migration, additional adaptation mechanisms have to be considered for future forests: intraspecific adaptation without genetic recombination, such as epigenetic adaptation [84], has been shown to bear substantial adaptive potential, especially concerning the pace of climate change. Also, silvicultural interventions such as selective thinning [85], increasing species diversity [86], and the structural diversity [87] of forests have been shown to increase fitness, stability, resilience, or resistance of forests under anthropogenic climate change.
Considering the potential introduction of non-native species, it is a general concern to evaluate potentially negative impacts on the native vegetation and the reversibility of the introduction. Despite the general challenges to evaluate novel biotic interactions [88], an established approach is to evaluate the invasiveness of the species under consideration. Within this procedure, potential negative impacts of the introduced species on the natural species are estimated. Negative impacts can be the abundant proliferation of the introduced species eliminating or displacing the native species [89]. We did not investigate invasiveness due to the other focus of our study; however, the three already well-observed introduced species in Europe, P. menziesii var. menziesii, Q. rubra, and R. pseudoacacia already occupy their full naturalized niche in Central Europe [57] and are already ranked as invasive species [90]. Before intensifying the introduction of the three currently less-observed species L. tulipifera, A. grandis, and P. ponderosa, these considerations suggest studying potentially undesired ecological effects and invasiveness more profoundly.
Besides the presented climatic niches of the studied species, our findings suggest a potential future suitability of non-native conifers for certain areas in Europe. Despite their limited climatic suitability, A. grandis, P. ponderosa, and P. menziesii var. menziesii could be promising particularly in the light of timber production, yield, and wood demand, for future cultivation in mixed forest stands possibly in combination with broadleaf species that are projected to have a higher suitability under climate change. Here, minor native tree species should be taken into consideration since they hold the potential to complement the diminishing major tree species in European stands in the future [40], as minor native species contain lower ecological risks as non-native species. Additionally, the rapid dynamics of climate change need to be increasingly considered in nature conservation concepts which frequently have static fundamentals such as close-to-nature aspects [91]. These considerations have an impact on the geographical and temporal definition of native species and need to be substantiated in future research.

5. Conclusions

The ensemble models identified suitable areas in Europe in the future for five of the six studied species along with a northeast species shift under climate change. Increasing in suitability in Europe during climate change, A. grandis, L. tulipifera, and R. pseudoacacia were identified as gaining species. Q. rubra overall contained the highest range potential in Europe, starting with a generally high suitability for the current climate and gaining even more area during climate change. P. ponderosa showed a rather stable suitability under RCP 4.5 and 8.5, while P. menziesii var. menziesii was projected to decrease in climatic suitability under climate change. Nonetheless, both species held a generally large area potential for Europe, showing an increasing suitability for certain regions under climate change.

Author Contributions

Conceptualization, A.T.A. and H.H.; methodology, H.H. and O.K.; formal analysis, H.H.; investigation H.H.; data curation, O.K., A.L.d.A. and H.H.; writing—original draft preparation, H.H.; writing—review and editing, A.T.A., H.H., O.K. and J.H.; visualization, H.H. and J.H.; supervision, project administration, funding acquisition, A.T.A. All authors have read and agreed to the published version of the manuscript.

Funding

This research was funded by the state Ministry of Food, Rural Affairs and Consumer Protection of Baden-Wuerttemberg, through the grant “Notfallplan für den Wald in Baden-Württemberg” from the state budget 2020–2021.

Institutional Review Board Statement

Not applicable.

Data Availability Statement

The data presented in this study are available on request from the corresponding author.

Conflicts of Interest

The authors declare no conflicts of interest.

Appendix A

Figure A1. Summary of ensemble modeling approach showing input data and modeling steps.
Forests 15 00130 g0a1
Figure A2. Relative variable importance of the selected predictors for the weighted mean ensemble model of each studied species, performed as introduced in the BIOMOD2 package.
Forests 15 00130 g0a2

References

  1. Scheffers, B.R.; De Meester, L.; Bridge, T.C.; Hoffmann, A.A.; Pandolfi, J.M.; Corlett, R.T.; Butchart, S.H.; Pearce-Kelly, P.; Kovacs, K.M.; Dudgeon, D. The broad footprint of climate change from genes to biomes to people. Science 2016, 354, aaf7671. [Google Scholar] [CrossRef] [PubMed]
  2. Schuldt, B.; Buras, A.; Arend, M.; Vitasse, Y.; Beierkuhnlein, C.; Damm, A.; Gharun, M.; Grams, T.E.; Hauck, M.; Hajek, P. A first assessment of the impact of the extreme 2018 summer drought on Central European forests. Basic Appl. Ecol. 2020, 45, 86–103. [Google Scholar] [CrossRef]
  3. Martinez del Castillo, E.; Zang, C.S.; Buras, A.; Hacket-Pain, A.; Esper, J.; Serrano-Notivoli, R.; Hartl, C.; Weigel, R.; Klesse, S.; Resco de Dios, V.; et al. Climate-change-driven growth decline of European beech forests. Commun. Biol. 2022, 5, 163. [Google Scholar] [CrossRef] [PubMed]
  4. Pretzsch, H.; del Río, M.; Arcangeli, C.; Bielak, K.; Dudzinska, M.; Forrester, D.I.; Klädtke, J.; Kohnle, U.; Ledermann, T.; Matthews, R.; et al. Forest growth in Europe shows diverging large regional trends. Sci. Rep. 2023, 13, 15373. [Google Scholar] [CrossRef] [PubMed]
  5. Salomón, R.L.; Peters, R.L.; Zweifel, R.; Sass-Klaassen, U.G.; Stegehuis, A.I.; Smiljanic, M.; Poyatos, R.; Babst, F.; Cienciala, E.; Fonti, P. The 2018 European heatwave led to stem dehydration but not to consistent growth reductions in forests. Nat. Commun. 2022, 13, 1–11. [Google Scholar] [CrossRef] [PubMed]
  6. Hanewinkel, M.; Cullmann, D.A.; Schelhaas, M.-J.; Nabuurs, G.-J.; Zimmermann, N.E. Climate change may cause severe loss in the economic value of European forest land. Nat. Clim. Chang. 2013, 3, 203–207. [Google Scholar] [CrossRef]
  7. Dyderski, M.K.; Paz, S.; Frelich, L.E.; Jagodzinski, A.M. How much does climate change threaten European forest tree species distributions? Glob. Chang. Biol. 2018, 24, 1150–1163. [Google Scholar] [CrossRef]
  8. Thurm, E.A.; Hernandez, L.; Baltensweiler, A.; Ayan, S.; Rasztovits, E.; Bielak, K.; Zlatanov, T.M.; Hladnik, D.; Balic, B.; Freudenschuss, A.; et al. Alternative tree species under climate warming in managed European forests. For. Ecol. Manag. 2018, 430, 485–497. [Google Scholar] [CrossRef]
  9. Ruiz-Labourdette, D.; Schmitz, M.F.; Pineda, F.D. Changes in tree species composition in Mediterranean mountains under climate change: Indicators for conservation planning. Ecol. Indic. 2013, 24, 310–323. [Google Scholar] [CrossRef]
  10. De Avila, A.; Häring, B.; Rheinbay, B.; Brüchert, F.; Hirsch, M.; Albrecht, A. Artensteckbriefe 2.0—Alternative Baumarten im Klimawandel; Self-published; Forest Research Institute Baden-Wuerttemberg: Freiburg, Germany, 2021; 246p. [Google Scholar]
  11. Araujo, M.B.; Guisan, A. Five (or so) challenges for species distribution modelling. J. Biogeogr. 2006, 33, 1677–1688. [Google Scholar] [CrossRef]
  12. Pearson, R.G.; Thuiller, W.; Araújo, M.B.; Martinez-Meyer, E.; Brotons, L.; McClean, C.; Miles, L.; Segurado, P.; Dawson, T.P.; Lees, D.C. Model-based uncertainty in species range prediction. J. Biogeogr. 2006, 33, 1704–1711. [Google Scholar] [CrossRef]
  13. Barbet-Massin, M.; Jiguet, F.; Albert, C.H.; Thuiller, W. Selecting pseudo-absences for species distribution models: How, where and how many? Methods Ecol. Evol. 2012, 3, 327–338. [Google Scholar] [CrossRef]
  14. Early, R.; Sax, D.F. Climatic niche shifts between species’ native and naturalized ranges raise concern for ecological forecasts during invasions and climate change. Glob. Ecol. Biogeogr. 2014, 23, 1356–1365. [Google Scholar] [CrossRef]
  15. Wiens, J.J.; Ackerly, D.D.; Allen, A.P.; Anacker, B.L.; Buckley, L.B.; Cornell, H.V.; Damschen, E.I.; Jonathan Davies, T.; Grytnes, J.A.; Harrison, S.P. Niche conservatism as an emerging principle in ecology and conservation biology. Ecol. Lett. 2010, 13, 1310–1324. [Google Scholar] [CrossRef] [PubMed]
  16. Sax, D.F.; Early, R.; Bellemare, J. Niche syndromes, species extinction risks, and management under climate change. Trends Ecol. Evol. 2013, 28, 517–523. [Google Scholar] [CrossRef]
  17. Elith, J.; Leathwick, J.R. Species distribution models: Ecological explanation and prediction across space and time. Annu. Rev. Ecol. Evol. Syst. 2009, 40, 677–697. [Google Scholar] [CrossRef]
  18. Guisan, A.; Tingley, R.; Baumgartner, J.B.; Naujokaitis-Lewis, I.; Sutcliffe, P.R.; Tulloch, A.I.; Regan, T.J.; Brotons, L.; McDonald-Madden, E.; Mantyka-Pringle, C. Predicting species distributions for conservation decisions. Ecol. Lett. 2013, 16, 1424–1435. [Google Scholar] [CrossRef]
  19. Zimmermann, N.E.; Edwards, T.C., Jr.; Graham, C.H.; Pearman, P.B.; Svenning, J.C. New trends in species distribution modelling. Ecography 2010, 33, 985–989. [Google Scholar] [CrossRef]
  20. Puchałka, R.; Paź-Dyderska, S.; Jagodziński, A.M.; Sádlo, J.; Vítková, M.; Klisz, M.; Koniakin, S.; Prokopuk, Y.; Netsvetov, M.; Nicolescu, V.-N.; et al. Predicted range shifts of alien tree species in Europe. Agric. For. Meteorol. 2023, 341, 109650. [Google Scholar] [CrossRef]
  21. Guisan, A.; Thuiller, W.; Zimmermann, N.E. Habitat Suitability and Distribution Models: With Applications in R; Cambridge University Press: Cambridge, UK, 2017. [Google Scholar]
  22. Zurell, D.; Franklin, J.; König, C.; Bouchet, P.J.; Dormann, C.F.; Elith, J.; Fandos, G.; Feng, X.; Guillera-Arroita, G.; Guisan, A. A standard protocol for reporting species distribution models. Ecography 2020, 43, 1261–1277. [Google Scholar] [CrossRef]
  23. Zurell, D.; Elith, J.; Schröder, B. Predicting to new environments: Tools for visualizing model behaviour and impacts on mapped distributions. Divers. Distrib. 2012, 18, 628–634. [Google Scholar] [CrossRef]
  24. Thuiller, W. Patterns and uncertainties of species’ range shifts under climate change. Glob. Chang. Biol. 2004, 10, 2020–2027. [Google Scholar] [CrossRef]
  25. Thuiller, W.; Lafourcade, B.; Engler, R.; Araújo, M.B. BIOMOD—A platform for ensemble forecasting of species distributions. Ecography 2009, 32, 369–373. [Google Scholar] [CrossRef]
  26. Karger, D.N.; Conrad, O.; Bohner, J.; Kawohl, T.; Kreft, H.; Soria-Auza, R.W.; Zimmermann, N.E.; Linder, H.P.; Kessler, M. Climatologies at high resolution for the earth’s land surface areas. Sci. Data 2017, 4, 170122. [Google Scholar] [CrossRef] [PubMed]
  27. Fick, S.E.; Hijmans, R.J. WorldClim 2: New 1-km spatial resolution climate surfaces for global land areas. Int. J. Climatol. 2017, 37, 4302–4315. [Google Scholar] [CrossRef]
  28. Conrad, V. Usual formulas of continentality and their limits of validity. Eos Trans. Am. Geophys. Union 1946, 27, 663–664. [Google Scholar]
  29. IPCC. Climate Change 2014: Synthesis Report. Contribution of Working Groups I, II and III to the Fifth Assessment Report of the Intergovernmental Panel on Climate Change; IPCC: Geneva, Switzerland, 2014.
  30. Pletterbauer, F.; Graf, W.; Schmutz, S. Effect of biotic dependencies in species distribution models: The future distribution of Thymallus thymallus under consideration of Allogamus auricollis. Ecol. Model. 2016, 327, 95–104. [Google Scholar] [CrossRef]
  31. Kaini, S.; Nepal, S.; Pradhananga, S.; Gardner, T.; Sharma, A.K. Representative general circulation models selection and downscaling of climate data for the transboundary Koshi river basin in China and Nepal. Int. J. Climatol. 2020, 40, 4131–4149. [Google Scholar] [CrossRef]
  32. Fajardo, J.; Corcoran, D.; Roehrdanz, P.R.; Hannah, L.; Marquet, P.A. GCM compareR: A web application to assess differences and assist in the selection of general circulation models for climate change research. Methods Ecol. Evol. 2020, 11, 656–663. [Google Scholar] [CrossRef]
  33. Giorgetta, M.A.; Jungclaus, J.; Reick, C.H.; Legutke, S.; Bader, J.; Böttinger, M.; Brovkin, V.; Crueger, T.; Esch, M.; Fieg, K. Climate and carbon cycle changes from 1850 to 2100 in MPI-ESM simulations for the Coupled Model Intercomparison Project phase 5. J. Adv. Model. Earth Syst. 2013, 5, 572–597. [Google Scholar] [CrossRef]
  34. Schmidt, G.A.; Kelley, M.; Nazarenko, L.; Ruedy, R.; Russell, G.L.; Aleinov, I.; Bauer, M.; Bauer, S.E.; Bhat, M.K.; Bleck, R. Configuration and assessment of the GISS ModelE2 contributions to the CMIP5 archive. J. Adv. Model. Earth Syst. 2014, 6, 141–184. [Google Scholar] [CrossRef]
  35. Dufresne, J.-L.; Foujols, M.-A.; Denvil, S.; Caubel, A.; Marti, O.; Aumont, O.; Balkanski, Y.; Bekki, S.; Bellenger, H.; Benshila, R. Climate change projections using the IPSL-CM5 Earth System Model: From CMIP3 to CMIP5. Clim. Dyn. 2013, 40, 2123–2165. [Google Scholar] [CrossRef]
  36. Osprey, S.; Hardiman, S. HadGEM2-CC Model Output Prepared for CMIP5 RCP4.5, Served by ESGF; University of Oxford: Oxford, UK, 2014. [Google Scholar]
  37. Albrecht, A.T.; De Avila, A.L. Ein Vorschlag zur literaturbasierten Ermittlung möglicher Alternativbaumarten im Klimawandel am Beispiel der Artensteckbriefe in Baden-Württemberg. Allg. Forst Jagdztg. 2019, 189, 129–143. [Google Scholar]
  38. de Avila, A.L.; Albrecht, A. Alternative Baumarten im Klimawandel: Artensteckbriefe: Eine Stoffsammlung; Forstliche Versuchs-und Forschungsanstalt Baden-Württemberg (FVA): Freiburg, Germany, 2017. [Google Scholar]
  39. Spellmann, H.; Weller, A.; Brang, P.; Michiels, H.-G.; Bolte, A. Douglasie (Pseudotsuga menziesii (Mirb.) Franco); Vor, T., Spellmann, H., Bolt, A.U., Ammer, C., Eds.; Potenziale und Risiken eingeführter Baumarten; Universitätsverlag Göttingen: Göttingen, Germany, 2015; pp. 187–217. [Google Scholar]
  40. Koch, O.; de Avila, A.L.; Heinen, H.; Albrecht, A.T. Retreat of Major European Tree Species Distribution under Climate Change—Minor Natives to the Rescue? Sustainability 2022, 14, 5213. [Google Scholar]
  41. Thompson, R.S.; Anderson, K.H.; Pelltier, R.T.; Strickland, L.E.; Shafer, S.L.; Bartlein, P.J.; McFadden, A.K. Atlas of Relations between Climatic Parameters and Distributions of Important Trees and Shrubs in North America: Revisions for All Taxa from The United States and Canada and New Taxa from the Western United States; US Department of the Interior, US Geological Survey: Washington, DC, USA, 2015.
  42. Hengl, T.; Wheeler, I.; MacMillan, R.A. LandGIS: Global Soil and Vegetation Mapping Using Legacy Field Observations and State-of-the-Art Machine Learning; OpenGeoHub: Wageningen, The Netherlands, 2019. [Google Scholar]
  43. Little, E.L.; Viereck, L.A. Atlas of United States Trees: (no. 1146). Conifers and Important Hardwoods; EL, L., Jr., Ed.; US Government Printing Office: Washington, DC, USA, 1971; Volume 1.
  44. Mauri, A.; Strona, G.; San-Miguel-Ayanz, J. EU-Forest, a high-resolution tree occurrence dataset for Europe. Sci. Data 2017, 4, 160123. [Google Scholar] [CrossRef] [PubMed]
  45. Guisan, A.; Zimmermann, N.E. Predictive habitat distribution models in ecology. Ecol. Model. 2000, 135, 147–186. [Google Scholar] [CrossRef]
  46. Austin, M.P.; Van Niel, K.P. Improving Species Distribution Models for Climate Change Studies: Variable Selection and Scale; Wiley Online Library: New York, NY, USA, 2011. [Google Scholar]
  47. Mod, H.K.; Scherrer, D.; Luoto, M.; Guisan, A. What we use is not what we know: Environmental predictors in plant distribution models. J. Veg. Sci. 2016, 27, 1308–1322. [Google Scholar] [CrossRef]
  48. Walentowski, H.; Falk, W.; Mette, T.; Kunz, J.; Bräuning, A.; Meinardus, C.; Zang, C.; Sutcliffe, L.M.E.; Leuschner, C. Assessing future suitability of tree species under climate change by multiple methods: A case study in southern Germany. Ann. For. Res. 2017, 60, 101–126. [Google Scholar] [CrossRef]
  49. Mauri, A.; Girardello, M.; Strona, G.; Beck, P.S.; Forzieri, G.; Caudullo, G.; Manca, F.; Cescatti, A. EU-Trees4F, a dataset on the future distribution of European tree species. Sci. Data 2022, 9, 37. [Google Scholar] [CrossRef]
  50. Boiffin, J.; Badeau, V.; Bréda, N. Species distribution models may misdirect assisted migration: Insights from the introduction of Douglas-fir to Europe. Ecol. Appl. 2017, 27, 446–457. [Google Scholar] [CrossRef]
  51. Thurm, E.A. Mixed Stands of Douglas-Fir and European Beech Compared to Pure Stands; Technische Universität München: München, Germany, 2017. [Google Scholar]
  52. Dormann, C.F.; Elith, J.; Bacher, S.; Buchmann, C.; Carl, G.; Carré, G.; Marquéz, J.R.G.; Gruber, B.; Lafourcade, B.; Leitão, P.J. Collinearity: A review of methods to deal with it and a simulation study evaluating their performance. Ecography 2013, 36, 27–46. [Google Scholar] [CrossRef]
  53. Team, R.C. R: A Language and Environment for Statistical Computing; R Foundation for Statistical Computing: Vienna, Austria, 2021; Available online: https://www.R-project.org/ (accessed on 5 December 2023).
  54. Thuiller, W.; Georges, D.; Gueguen, M.; Engler, R.; Breiner, F.; Lafourcade, B.; Patin, R. biomod2: Ensemble Platform for Species Distribution Modeling, R Package Version 4.2-4. 2023. Available online: https://rdrr.io/cran/biomod2/(accessed on 5 December 2023).
  55. Elith, J.; Kearney, M.; Phillips, S. The art of modelling range-shifting species. Methods Ecol. Evol. 2010, 1, 330–342. [Google Scholar] [CrossRef]
  56. Fitzpatrick, M.C.; Hargrove, W.W. The projection of species distribution models and the problem of non-analog climate. Biodivers. Conserv. 2009, 18, 2255–2261. [Google Scholar] [CrossRef]
  57. Camenen, E.; Porté, A.J.; Benito Garzón, M. American trees shift their niches when invading Western Europe: Evaluating invasion risks in a changing climate. Ecol. Evol. 2016, 6, 7263–7275. [Google Scholar] [CrossRef] [PubMed]
  58. Allouche, O.; Tsoar, A.; Kadmon, R. Assessing the accuracy of species distribution models: Prevalence, kappa and the true skill statistic (TSS). J. Appl. Ecol. 2006, 43, 1223–1232. [Google Scholar] [CrossRef]
  59. Gallien, L.; Douzet, R.; Pratte, S.; Zimmermann, N.E.; Thuiller, W. Invasive species distribution models–how violating the equilibrium assumption can create new insights. Glob. Ecol. Biogeogr. 2012, 21, 1126–1136. [Google Scholar] [CrossRef]
  60. Wisz, M.S.; Pottier, J.; Kissling, W.D.; Pellissier, L.; Lenoir, J.; Damgaard, C.F.; Dormann, C.F.; Forchhammer, M.C.; Grytnes, J.-A.; Guisan, A.; et al. The role of biotic interactions in shaping distributions and realised assemblages of species: Implications for species distribution modelling. Biol. Rev. 2013, 88, 15–30. [Google Scholar] [CrossRef]
  61. Meier, E.S.; Edwards, T.C., Jr.; Kienast, F.; Dobbertin, M.; Zimmermann, N.E. Co-occurrence patterns of trees along macro-climatic gradients and their potential influence on the present and future distribution of Fagus sylvatica L. J. Biogeogr. 2011, 38, 371–382. [Google Scholar] [CrossRef]
  62. Hanewinkel, M.; Cullmann, D.A.; Michiels, H.G.; Kandler, G. Converting probabilistic tree species range shift projections into meaningful classes for management. J. Environ. Manag. 2014, 134, 153–165. [Google Scholar] [CrossRef]
  63. Lee, S.; Jung, H.; Choi, J. Projecting the Impact of Climate Change on the Spatial Distribution of Six Subalpine Tree Species in South Korea Using a Multi-Model Ensemble Approach. Forests 2021, 12, 37. [Google Scholar] [CrossRef]
  64. Veloz, S.D.; Williams, J.W.; Blois, J.L.; He, F.; Otto-Bliesner, B.; Liu, Z. No-analog climates and shifting realized niches during the late quaternary: Implications for 21st-century predictions by species distribution models. Glob. Chang. Biol. 2012, 18, 1698–1713. [Google Scholar] [CrossRef]
  65. Pearman, P.B.; Guisan, A.; Broennimann, O.; Randin, C.F. Niche dynamics in space and time. Trends Ecol. Evol. 2008, 23, 149–158. [Google Scholar] [CrossRef]
  66. McKenney, D.W.; Pedlar, J.H.; Lawrence, K.; Campbell, K.; Hutchinson, M.F. Potential impacts of climate change on the distribution of North American trees. BioScience 2007, 57, 939–948. [Google Scholar] [CrossRef]
  67. Sittaro, F.; Paquette, A.; Messier, C.; Nock, C.A. Tree range expansion in eastern North America fails to keep pace with climate warming at northern range limits. Glob. Chang. Biol. 2017, 23, 3292–3301. [Google Scholar] [CrossRef] [PubMed]
  68. Chakraborty, D.; Móricz, N.; Rasztovits, E.; Dobor, L.; Schueler, S. Provisioning forest and conservation science with high-resolution maps of potential distribution of major European tree species under climate change. Ann. For. Sci. 2021, 78, 26. [Google Scholar] [CrossRef]
  69. Liang, Y.; Duveneck, M.J.; Gustafson, E.J.; Serra-Diaz, J.M.; Thompson, J.R. How disturbance, competition, and dispersal interact to prevent tree range boundaries from keeping pace with climate change. Glob. Chang. Biol. 2018, 24, e335–e351. [Google Scholar] [CrossRef] [PubMed]
  70. Hamann, A.; Wang, T. Potential effects of climate change on ecosystem and tree species distribution in British Columbia. Ecology 2006, 87, 2773–2786. [Google Scholar] [CrossRef]
  71. Schüler, S.; Chakraborty, D. Limitierende Faktoren für den Douglasienanbau in Mitteleuropa im Klimawandel. Schweiz. Z. Forstwes. 2021, 172, 84–93. [Google Scholar] [CrossRef]
  72. Lockow, K.-W.; Lockow, J. Die Robinie (Robinia pseudoacacia L.): Eine Schnellwachsende Baumart Mit Wertvollen Holzeigenschaften; Gesellschaft zur Förderung Schnellwachsender Baumarten in Norddeutschland eV; cw Nordwest Media Verlagsgesellschaft: Grevesmühlen, Germany, 2013. [Google Scholar]
  73. Bell, D.M.; Bradford, J.B.; Lauenroth, W.K. Mountain landscapes offer few opportunities for high-elevation tree species migration. Glob. Chang. Biol. 2014, 20, 1441–1451. [Google Scholar] [CrossRef]
  74. Peters, M.P. Assessing Ponderosa Pine (Pinus ponderosa) Suitable Habitat throughout Arizona in Response to Future Climate Models; Arizona State University: Maricopa, AZ, USA, 2011. [Google Scholar]
  75. Cao, Y.; Feng, J.; Hwarari, D.; Ahmad, B.; Wu, H.; Chen, J.; Yang, L. Alterations in Population Distribution of Liriodendron chinense (Hemsl.) Sarg. and Liriodendron tulipifera Linn. Caused by Climate Change. Forests 2022, 13, 488. [Google Scholar] [CrossRef]
  76. Thuiller, W.; Gueguen, M.; Renaud, J.; Karger, D.N.; Zimmermann, N.E. Uncertainty in ensembles of global biodiversity scenarios. Nat. Commun. 2019, 10, 1446. [Google Scholar] [CrossRef] [PubMed]
  77. Broennimann, O.; Fitzpatrick, M.C.; Pearman, P.B.; Petitpierre, B.; Pellissier, L.; Yoccoz, N.G.; Thuiller, W.; Fortin, M.J.; Randin, C.; Zimmermann, N.E. Measuring ecological niche overlap from occurrence and spatial environmental data. Glob. Ecol. Biogeogr. 2012, 21, 481–497. [Google Scholar] [CrossRef]
  78. Iverson, L.R.; McKenzie, D. Tree-species range shifts in a changing climate: Detecting, modeling, assisting. Landsc. Ecol. 2013, 28, 879–889. [Google Scholar] [CrossRef]
  79. Liu, Q.; Piao, S.; Janssens, I.A.; Fu, Y.; Peng, S.; Lian, X.; Ciais, P.; Myneni, R.B.; Peñuelas, J.; Wang, T. Extension of the growing season increases vegetation exposure to frost. Nat. Commun. 2018, 9, 426. [Google Scholar] [CrossRef] [PubMed]
  80. Blossey, B.; Notzold, R. Evolution of increased competitive ability in invasive nonindigenous plants: A hypothesis. J. Ecol. 1995, 83, 887–889. [Google Scholar] [CrossRef]
  81. Schwartz, M.W.; Hellmann, J.J.; McLachlan, J.M.; Sax, D.F.; Borevitz, J.O.; Brennan, J.; Camacho, A.E.; Ceballos, G.; Clark, J.R.; Doremus, H. Managed relocation: Integrating the scientific, regulatory, and ethical challenges. BioScience 2012, 62, 732–743. [Google Scholar] [CrossRef]
  82. Feurdean, A.; Bhagwat, S.A.; Willis, K.J.; Birks, H.J.B.; Lischke, H.; Hickler, T. Tree Migration-Rates: Narrowing the Gap between Inferred Post-Glacial Rates and Projected Rates. PLoS ONE 2013, 8, e71797. [Google Scholar] [CrossRef]
  83. Pretzsch, H.; Poschenrieder, W.; Uhl, E.; Brazaitis, G.; Makrickiene, E.; Calama, R. Silvicultural prescriptions for mixed-species forest stands. A European review and perspective. Eur. J. For. Res. 2021, 140, 1267–1294. [Google Scholar] [CrossRef]
  84. Sow, M.D.; Allona, I.; Ambroise, C.; Conde, D.; Fichot, R.; Gribkova, S.; Jorge, V.; Le-Provost, G.; Pâques, L.; Plomion, C.; et al. Chapter Twelve—Epigenetics in Forest Trees: State of the Art and Potential Implications for Breeding and Management in a Context of Climate Change. In Advances in Botanical Research; Mirouze, M., Bucher, E., Gallusci, P., Eds.; Academic Press: Cambridge, MA, USA, 2018; Volume 88, pp. 387–453. [Google Scholar]
  85. Sohn, J.A.; Saha, S.; Bauhus, J. Potential of forest thinning to mitigate drought stress: A meta-analysis. For. Ecol. Manag. 2016, 380, 261–273. [Google Scholar] [CrossRef]
  86. Morin, X.; Fahse, L.; Jactel, H.; Scherer-Lorenzen, M.; Garcia-Valdes, R.; Bugmann, H. Long-term response of forest productivity to climate change is mostly driven by change in tree species composition. Sci. Rep. 2018, 8, 5627. [Google Scholar] [CrossRef]
  87. Ehbrecht, M.; Seidel, D.; Annighöfer, P.; Kreft, H.; Köhler, M.; Zemp, D.C.; Puettmann, K.; Nilus, R.; Babweteera, F.; Willim, K.; et al. Global patterns and climatic controls of forest structural complexity. Nat. Commun. 2021, 12, 519. [Google Scholar] [CrossRef] [PubMed]
  88. O’Loughlin, L.S.; Panetta, F.D.; Gooden, B. Identifying thresholds in the impacts of an invasive groundcover on native vegetation. Sci. Rep. 2021, 11, 20512. [Google Scholar] [CrossRef] [PubMed]
  89. Kumar Rai, P.; Singh, J.S. Invasive alien plant species: Their impact on environment, ecosystem services and human health. Ecol. Indic. 2020, 111, 106020. [Google Scholar] [CrossRef] [PubMed]
  90. Dyderski, M.K.; Jagodziński, A.M. Impact of invasive tree species on natural regeneration species composition, diversity, and density. Forests 2020, 11, 456. [Google Scholar] [CrossRef]
  91. Hickler, T.; Vohland, K.; Feehan, J.; Miller, P.A.; Smith, B.; Costa, L.; Giesecke, T.; Fronzek, S.; Carter, T.R.; Cramer, W.; et al. Projecting the future distribution of European potential natural vegetation zones with a generalized, tree species-based dynamic vegetation model. Glob. Ecol. Biogeogr. 2012, 21, 50–63. [Google Scholar] [CrossRef]
Figure 1. Native geographical ranges of the investigated North American species [41].
Forests 15 00130 g001
Figure 2. Variable ranges of the studied species in their respective native range for (a) maximum temperature of the warmest month (Bioclim 5) (°C); (b) minimum temperature of the coldest month (Bioclim 6) (°C); (c) precipitation of the warmest quarter (Bioclim 18) (mm); (d) precipitation of the coldest quarter (Bioclim 19) (mm), (e) Conrad’s continentality index (CCI); (f) temperature sum of growing degree days >5 °C (GDD); (g) sum of the soil available water capacity in 0–100 cm soil depth (AWC) (mm); (h) mean pH for a 0–30 cm soil depth (pH). The data correspond to species occurrence data in North America by Thompson et al. [41], climate data from CHELSA 1.2 [26], and soil data from LandGIS [42]. For further variable explanations, see Section 2.1, Section 2.2 and Section 2.3.
Forests 15 00130 g002
Figure 3. Niche transferability map from native (North America) to introduced (Europe) range, generated by the MESS (multivariate environmental similarity surface) analysis using four selected bioclimatic variables; (a) combined for all four variables; (b) maximum temperature of the warmest month; (c) minimum temperature of the coldest month; (d) precipitation of the warmest quarter; (e) Conrad’s continentality index. Positive values indicate a higher similarity, negative values dissimilarity (novel environments).
Forests 15 00130 g003
Figure 4. Model ensemble uncertainty measured with the coefficient of variation (CV) between the individual models for all species under current climate conditions. High CV values (lighter colors) represent a high model uncertainty, low values (darker colors) a low model uncertainty.
Forests 15 00130 g004
Figure 5. Classified suitability expressed as classified occurrence probability of the tree species in Europe for the current climate, 2070 RCP 4.5, and RCP 8.5. Suitability classes: 1 = core, 2 = extended, 3 = occasional, 4 = none.
Forests 15 00130 g005
Figure 6. Share (%) of classified probabilities of occurrence of the investigated species in Europe for the current climate and future climate in 2070 RCP 4.5 and RCP 8.5. Suitability classes: 1 = core, 2 = extended, 3 = occasional, 4 = none.
Forests 15 00130 g006
Table 1. Species presence and prevalence in the native range, North America (NA), and in the naturalized range, Europe (EUR).
SpeciesPresence
NA [41]
Prevalence
NA (%)
Presence
EUR [44]
Prevalence
EUR (%)
A. grandis25,0132.54300.2
L. tulipifera142,25214.410.0
P. menziesii var. menziesii114,84711.652232.1
P. ponderosa70,1897.140.0
Q. rubra280,78228.417250.7
R. pseudoacacia40,2194.147881.9
Table 2. Model scores of all model algorithms.
SpeciesModelSE 1SP 1TSSAUC
A. grandisBRT0.980.950.930.99
A. grandisGAM0.980.960.940.99
A. grandisGLM0.980.950.930.99
A. grandisMAXENT0.950.950.900.98
A. grandisRF0.980.970.951
L. tulipiferaBRT0.990.970.961
L. tulipiferaGAM0.990.980.971
L. tulipiferaGLM0.990.960.950.99
L. tulipiferaMAXENT0.970.950.920.98
L. tulipiferaRF0.990.9911
P. ponderosaBRT0.870.870.740.94
P. ponderosaGAM0.910.850.750.94
P. ponderosaGLM0.910.850.760.95
P. ponderosaMAXENT0.890.850.740.95
P. ponderosaRF0.940.940.991
P. menziesii var. menziesiiBRT0.870.800.660.90
P. menziesii var. menziesiiGAM0.850.800.630.89
P. menziesii var. menziesiiGLM0.890.790.670.91
P. menziesii var. menziesiiMAXENT0.840.790.630.90
P. menziesii var. menziesiiRF0.850.910.981
Q. rubraBRT0.810.850.690.92
Q. rubraGAM0.850.830.680.92
Q. rubraGLM0.850.730.570.85
Q. rubraMAXENT0.790.830.640.91
Q. rubraRF0.850.870.981
R. pseudoacaciaBRT0.940.910.860.97
R. pseudoacaciaGAM0.990.790.790.89
R. pseudoacaciaGLM0.870.860.750.94
R. pseudoacaciaMAXENT0.910.920.830.96
R. pseudoacaciaRF0.960.960.991
1 at TSSmax.
Table 3. Ensemble model performance scores.
SpeciesSE 1SP 1TSSAUC
A. grandis0.980.960.961
L. tulipifera0.990.980.981
P. menziesii var. menziesii0.950.920.890.99
P. ponderosa0.930.900.860.98
Q. rubra0.880.830.790.97
R. pseudoacacia0.970.930.931
Mean0.950.920.900.99
1 at TSSmax.
Table 4. Relative importance of the environmental variables averaged for all six species. Bioclim 6 represents the average of four species (not selected for A. grandis and Q. rubra models); CCI represents the average of four species (not selected for Q. rubra and R. pseudoacacia models); * GDD only selected for A. grandis models.
Bioclim 5Bioclim 6Bioclim 18Bioclim 19CCIGDDAWCpH
Mean0.250.320.290.170.120.13 *0.040.08
Disclaimer/Publisher’s Note: The statements, opinions and data contained in all publications are solely those of the individual author(s) and contributor(s) and not of MDPI and/or the editor(s). MDPI and/or the editor(s) disclaim responsibility for any injury to people or property resulting from any ideas, methods, instructions or products referred to in the content.

