Article

Influence of Irrigation on Biomass Partitioning in Above- and Belowground Organs of Trees Planted in Desert Sites of Mongolia

by
Ser-Oddamba Byambadorj
1,2,
Byung Bae Park
2,*,
Sarangua Lkhagvasuren
1,
Enkhchimeg Tsedensodnom
1,3,
Otgonsaikhan Byambasuren
1,
Altankhundaga Khajid
4,
Donato Chiatante
5 and
Batkhuu Nyam-Osor
1,*
1
Laboratory of Forest Genetics and Ecophysiology, National University of Mongolia, Ulaanbaatar 14201, Mongolia
2
Department of Environment and Forest Resources, College of Agriculture and Life Science, Chungnam National University, Daejeon 34134, Republic of Korea
3
Institute of Geography and Geoecology, Mongolian Academy of Sciences, Ulaanbaatar 15170, Mongolia
4
Department of Education, Otgontenger University, Ulaanbaatar 13343, Mongolia
5
Department of Biotechnologies and Life Science, Università dell’Insubria, 21100 Varese, Italy
*
Authors to whom correspondence should be addressed.
Forests 2024, 15(1), 46; https://doi.org/10.3390/f15010046
Submission received: 30 November 2023 / Revised: 19 December 2023 / Accepted: 21 December 2023 / Published: 25 December 2023
(This article belongs to the Special Issue Biomass Estimation and Carbon Stocks in Forest Ecosystems—Volume II)

Abstract

:
Planting trees is considered a crucial factor in mitigating the increase in carbon emissions in the atmosphere by generating plant biomass. In addition to advancing our understanding of how tree biomass is allocated in desert environments, we explore potential variations in biomass partitioning based on the irrigation regimes (4, 8, and 12 L h−1) supporting the growth of these trees. Specifically, this study compares the pattern of biomass distribution between above-ground and belowground organs of 11-year-old trees (U. pumila, E. moorcroftii, and T. ramosissima) planted in a desert site in Mongolia. An interesting result of this study is the demonstration that biomass partitioning among roots of different diameter classes differs between the tree species tested, suggesting that each tree species establishes its own type of root/soil interaction. The differences in biomass partitioning in roots could determine specificity in the strength of anchorage and efficiency of nutrition for the trees. We also demonstrate that the presence of plantations influences certain chemical properties of the desert soil, with differences depending on the tree species planted. In addition to presenting a method for planting trees in desert sites, this study underscores that a reliable evaluation of atmospheric carbon sequestration in trees must necessarily include root excavation to obtain an accurate measurement of biomass stored in belowground structures. Assessing the overall biomass produced by these trees allows us to determine the potential for carbon sequestration achievable through plantations established in desert sites.

1. Introduction

The worsening effects of global changes (i.e., a continuous reduction of precipitations and an increase in the frequency of heat waves) are leading to land degradation and desertification. Human behaviour maintains irresponsibly high levels of grazing on natural grasslands [1,2,3]. Moreover, there is no need to stress the negative effect of land abandonment on areas prone to desertification [4]. In this scenario, it is not surprising that there is a surge of initiatives [5,6,7,8,9] aimed at planting trees in arid and semiarid regions as a measure to counteract the effectcs of global changes [10].
The average air temperature in Mongolia has risen by 2.25 °C in the last 80 years and the number of hot days has increased considerably [11] while average precipitation is decreasing by a value of 7.3%. Therefore, is not surprising that the assessment establishes that nearly 76.9% (i.e., 120.3 m/ha) of the total Mongolian lands are already in a condition of extreme degradation tending towards desertification [12]. As a consequence of this scenario, the implementation in Mongolia of well-managed plantations is considered to be the only means to counteract urgently this situation [2].
In analogy to strategies adopted worldwide to arrest desertification of arid lands through the construction of green wall [5], in Mongolia a tree planting iniative named “Green Belt” has been launched jointly by the Mongolian and South Korean Governments. The objectives of this initiative are: (1) protecting the soil from further degradation; (2) sequestering carbon within the construction of the tree biomass; (3) increasing carbon concentration in the soil [13]; (4) associating forestry with the development of agricultural activities by taking advantage of the irrigation systems used for the plantations [14].
Under this Green Belt initiative, a total of 1,079,663 trees have already been planted for a total of 2520 hectares, located both in Mongolia’s semiarid steppe and in the Gobi Desert [15]. Hence, after 11 years from planting time, it is necessary to assess the performance of the tree species to select the best candidate to be suggested for future plantations. For this purpose, our laboratories have been involved in evaluating the performance of the new plantations, and the results of these studies are summarized in several papers [2,16,17,18,19,20,21,22]. In these studies, the kinetics of growth and development of three tree species (Ulmus pumila L., Tamarix ramosissima Ldb., and Elaeagnus moorcroftii Wall. ex Schlecht.) has been investigated. The choice of testing the growth performance of Ulmus pumila L. was based on the fact that this tree species is widespread through Mongolia’s lands and shows good tolerance to conditions of water/nutrient shortages [19]. In the case of Tamarix ramosissima Ldb., the choice was based on its capacity to live well in dry and semi-arid habitats with a high tolerance to abiotic stress (drought, salinity, and high temperature) [23]. In the case, of Elaeagnus moorcroftii Wall. ex Schlecht the choice was based upon its capacity to live in degraded soil affected by strong winds [18] which are very frequent in the desert sites considered here. During growth, these plantations have been supported by different irrigation regimes (“drip irrigation”). This type of irrigation has been used because it provides the occurrence of regular moisture in the soil, and it accelerates root growth resulting in an increase in nutrient availability with a related increase in tree growth [24].
Investigations regarding the performance of tree plantations [25] have focused mainly on measuring the morphological traits of aboveground organs (stem, branches, and leaves), whereas the analysis of how roots grow and develop after planting has remained completely ignored. This gap in knowledge represents a bias not only for a correct evaluation of the plantation performance but also because it affects the possibility of measuring correctly the carbon sequestration potential of this type of environmental restoration initiative. The present work is aimed at eliminating this gap with Ulmus pumila L., Tamarix ramosissima Ldb., and Elaeagnus moorcroftii Wall. (ex Schlecht) trees planted in a desert site. In particular, here we analyze accurately the growth in both above- and belowground organs, with a particular focus on carbon partitioning among plant organs. For this reason, we have excavated the trees and measured their morphological traits (stem height, root collar diameter, and root length) and the amount of biomass allocated in both aboveground and belowground organs (i.e., carbon pools) [26]. In addition, we have also investigated if/how biomass partitioning is affected by the amount of water made available in the soil when plantations are supported by three different irrigation regimes (4, 8, and 12 L h−1) [25]. Investigation about the effect of irrigation regimes is necessary, as it is known that the amount of water in the soil affects the functional equilibrium that regulates the amount of carbon that must be distributed between the different organs (i.e., the carbon sink) to ensure an optimal growth rate [27]. Moreover, it has been shown that plants growing under drought conditions prefer to invest in the construction of root biomass and surfaces to maximize exchange with the soil and increase water and nutrient uptake [28]. On the contrary, it has been shown that leaf area increases when water is abundant to enable a higher level of carbon fixation [29].
In addition, investigating biomass partitioning to different plant organ pools, this work also analyzes how the presence of trees affects the chemical properties of the soil in the first 0–20 cm of depth. In fact, it is known that the chemical and physical properties change when the soil is prepared and managed for tree-planting initiatives [30].
An interesting aspect of this work derives also from the fact that we show a methodological approach for measuring correctly the overall biomass (i.e., carbon from the atmosphere) produced by plantations established in desert sites. Moreover, this approach provides useful indications for planting trees and supporting their growth and development by irrigation in biomes characterized by limited water resources.

2. Materials and Methods

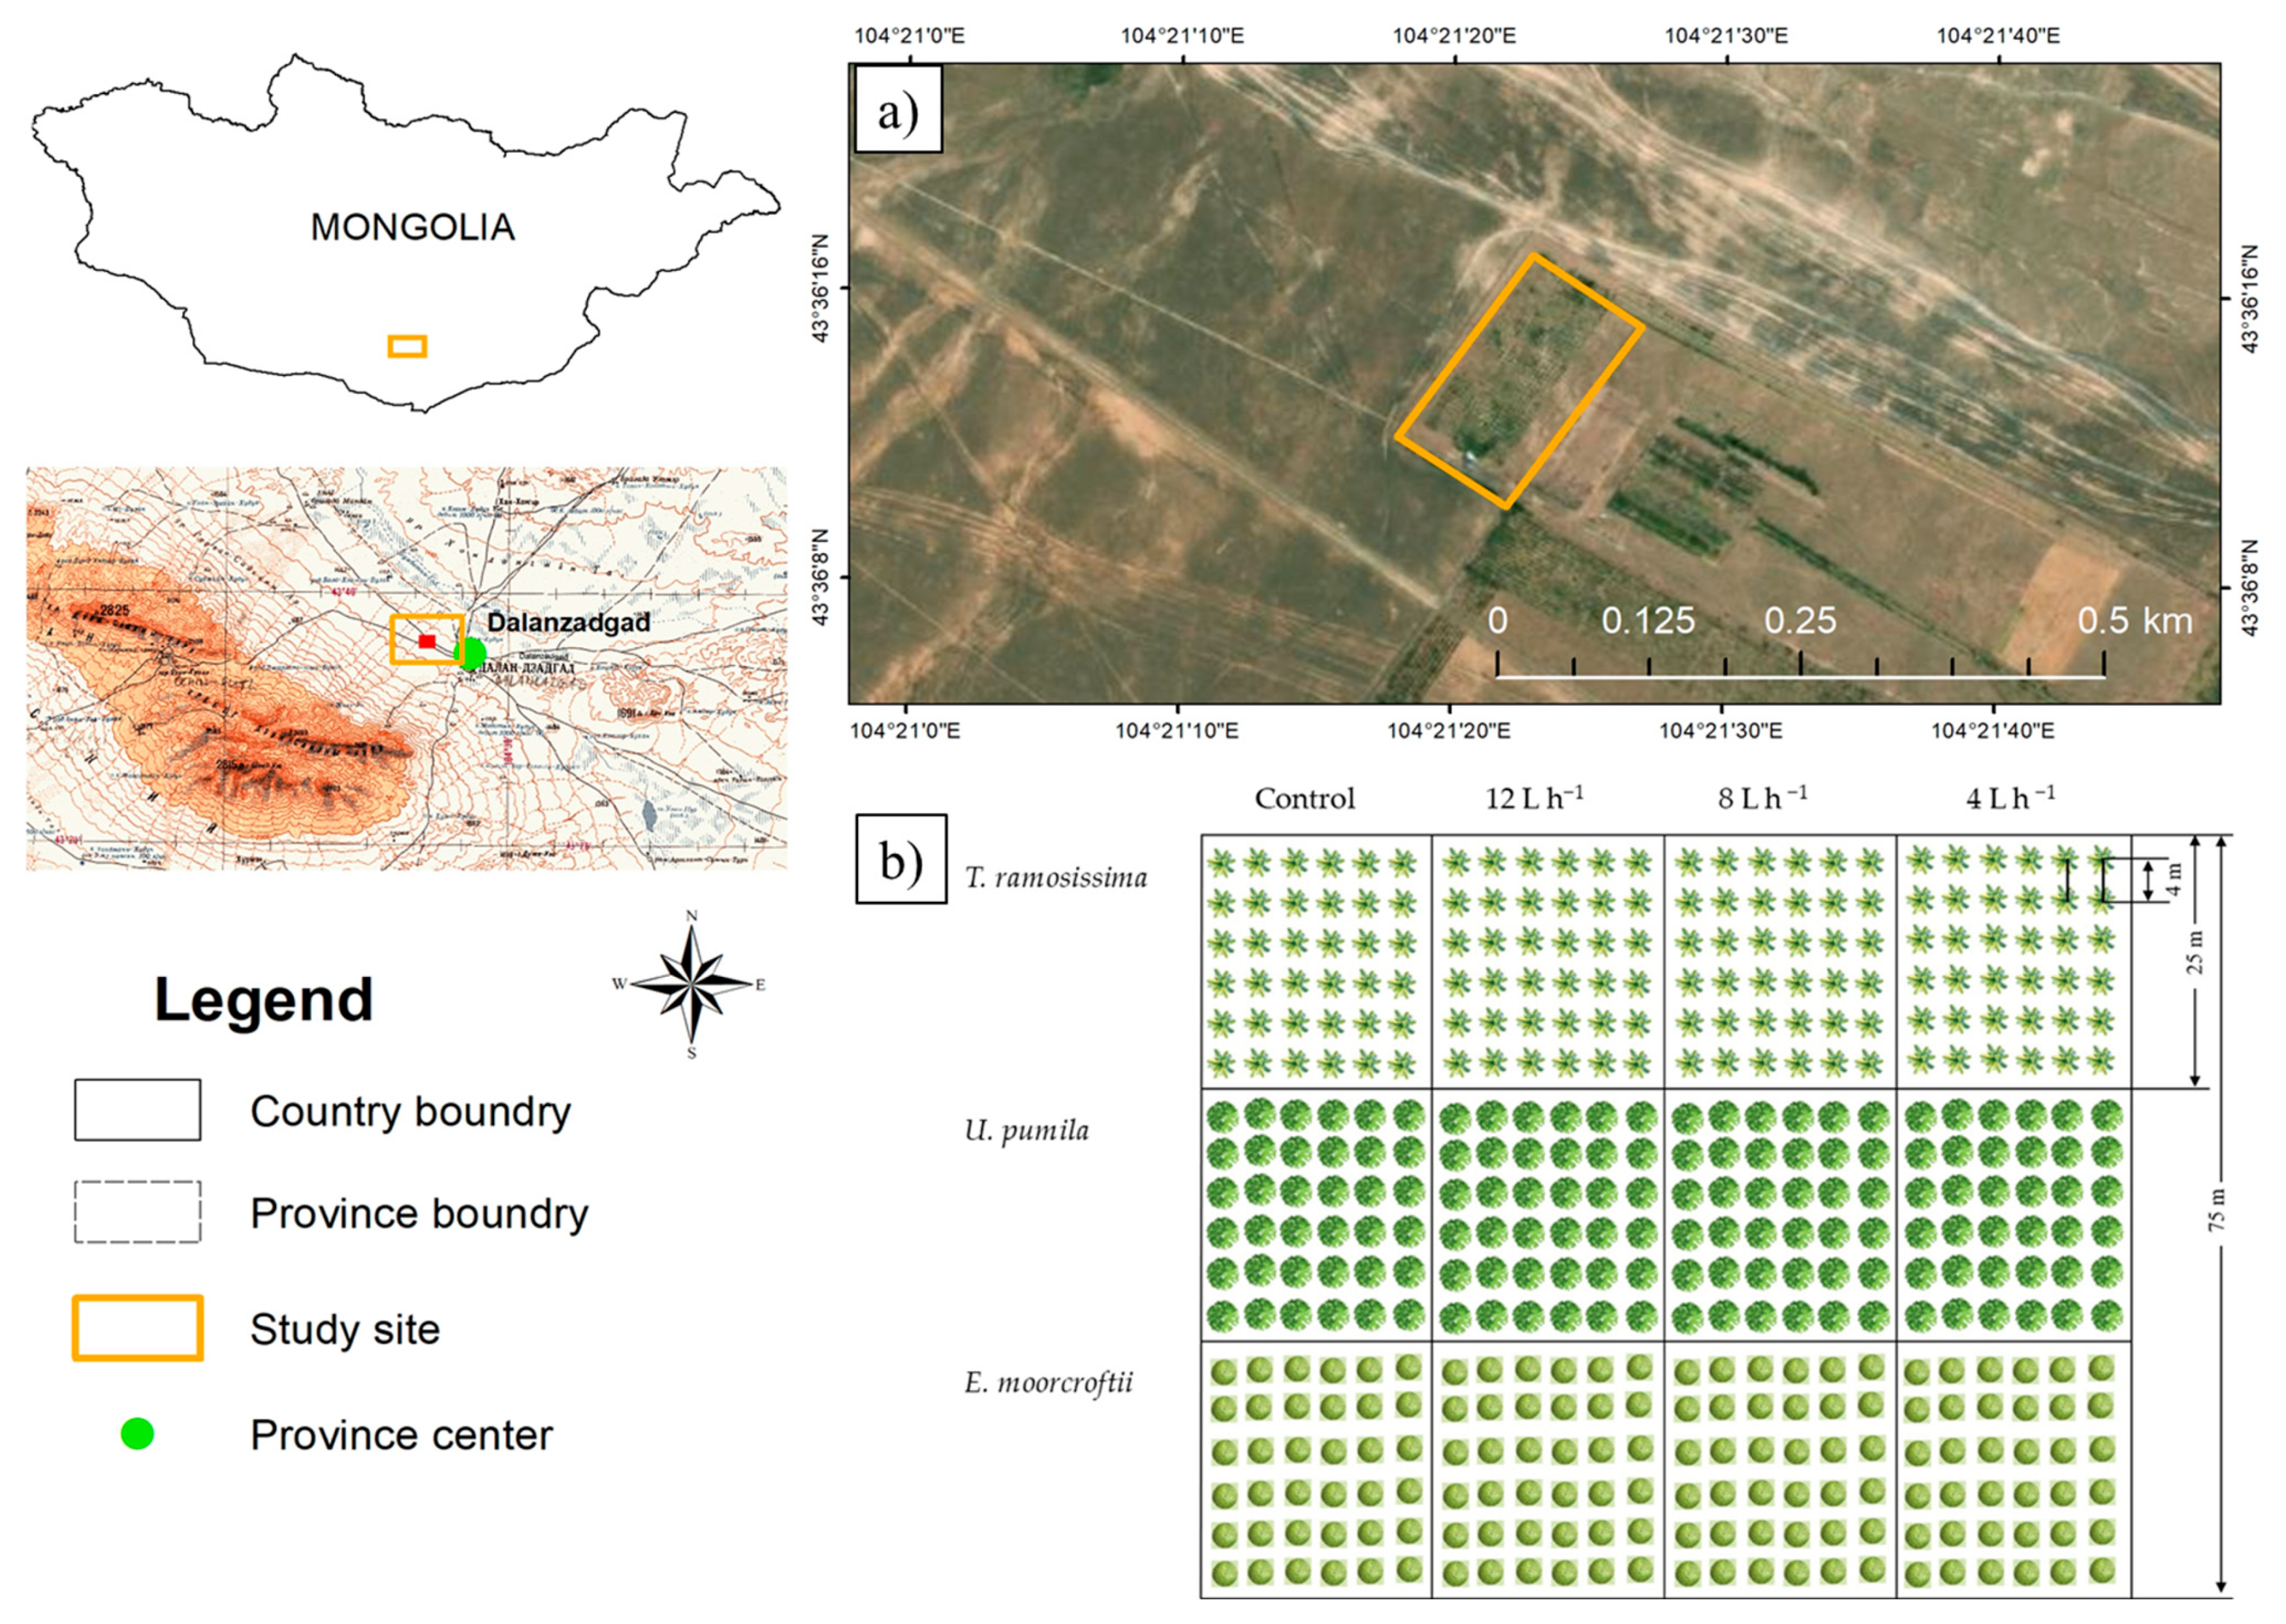
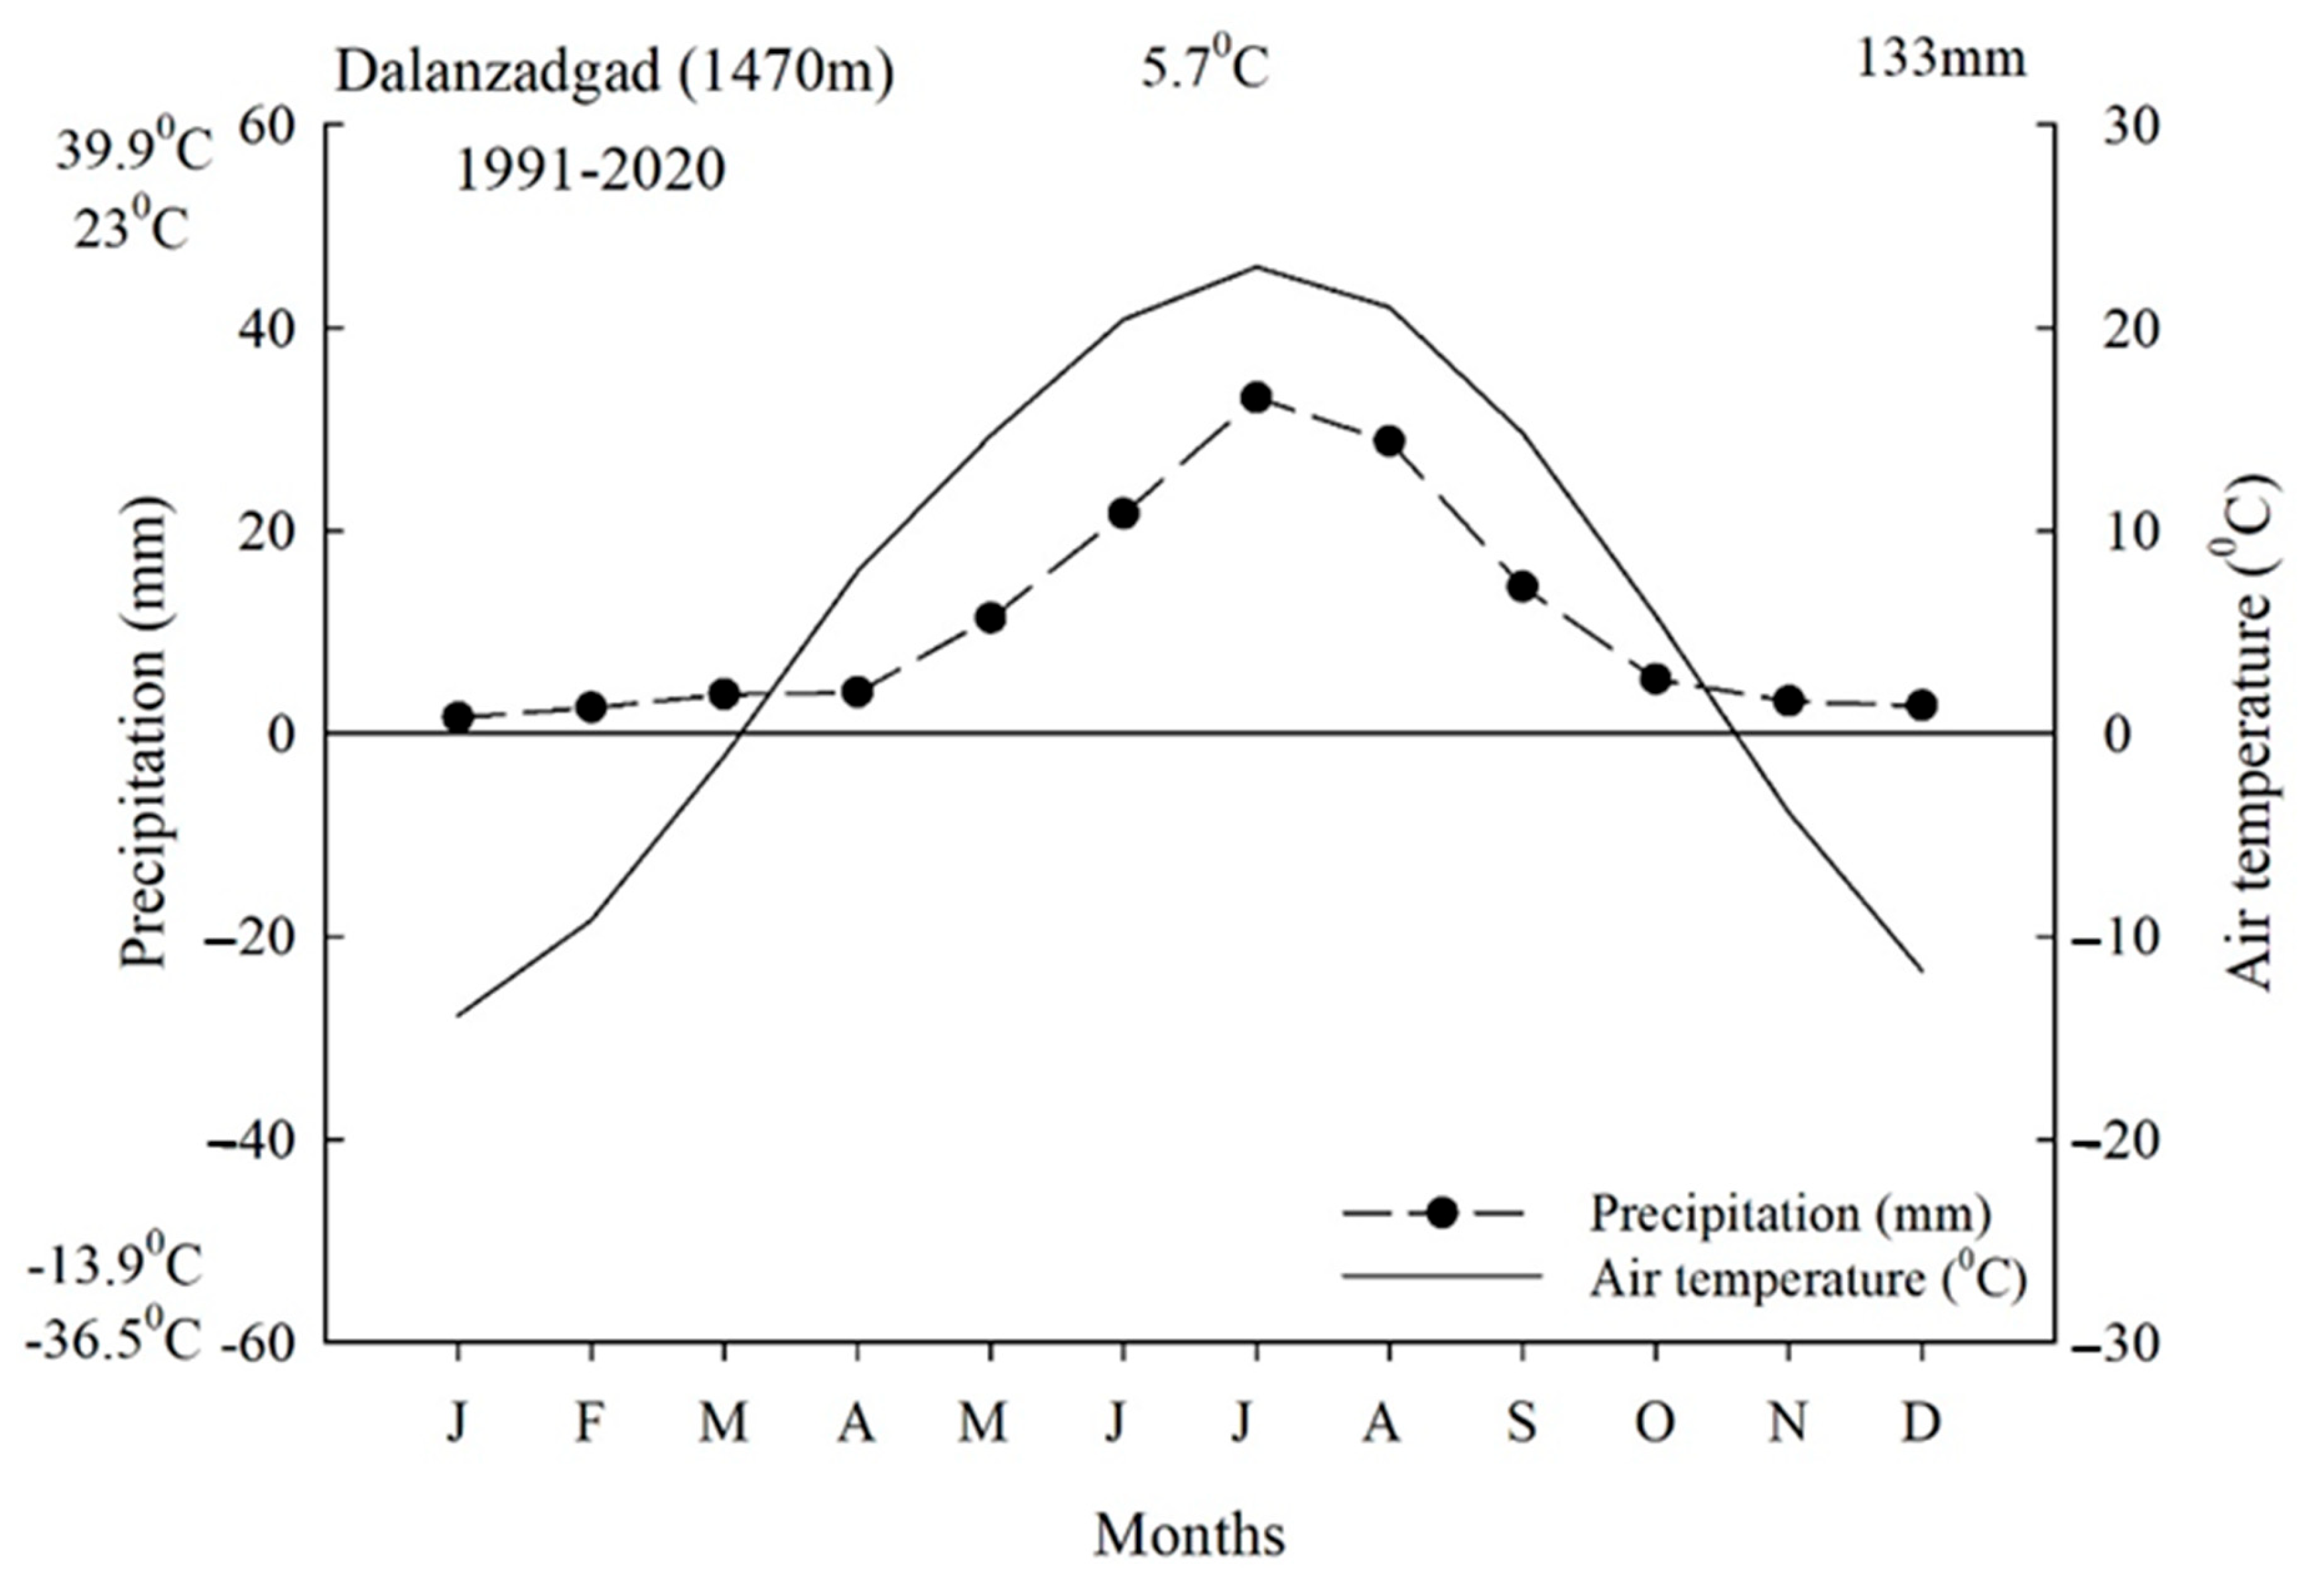
2.1. Study Site Description

This study regards the plantation implemented in Dalanzadgad soum (43°36′12.74″ N, 104°21′22.25″ E), Umnugobi province, Mongolia (Figure 1).
This site is classifiable as Desert-steppe and is characterized by grassland plains or mainly feather grass-onion communities with pea shrubs [18,31]. The dominant species (i.e., 59.7%) includes Oxytropis aciphylla Ldb., Convolvulus ammanii Desr., Peganium nigellastrum Bge, and annual plants, such as Artemisia pectinata Pall., Chenopodium aristatum L., Eragrostis minor Host., Enneapogon desvauxii P. Beauv. [32,33]. These species are associated with Allium polyrrhizum Turcz. ex Rgl, A. mongolicum Rgl, Stipa gobica Roshev., and S. glareosa P. Smirn. The vegetative season is very short starting in May and ending in September) when the first frost events occur. The temperature and precipitation are reported in Figure 2 [34]. The soil is classifiable as Gobi brown soil (Calcisol), which is generally, stony, sandy loamy, with high carbonate content and low organic matter [35].

2.2. Planting Scheme and Sampling Design

Two-year-old seedlings (grown in the nursery) (Ulmus pumila L., Tamarix ramosissima Ldb., Elaeagnus moorcroftii Wall. ex Schlecht) are transplanted in 2009 and grown with the support of drip irrigation treatments. Four different irrigation regimes are tested (rainfall as control, rainfall+ 84 mm tree−1 yr−1 (corresponding to 4 L h−1 with a field capacity of 30%), rainfall + 168 mm tree−1 yr−1 (corresponding to 8 L h−1 with a field capacity of 50%), rainfall + 252 mm tree−1 yr−1 (corresponding to 12 L h−1 with a field capacity of 70%). Irrigation (5 h) is repeated twice a week for the entire vegetative season (May to mid-September). Samples are collected from 12 plots (each measuring 25 × 25 m), where trees are planted at a 4 m distance between rows, for a total of 36 seedlings planted in each plot (Figure 1). Seedlings are planted in 60–70 cm deep holes having a 50–60 cm diameter. For easy establishment, seedlings are daily irrigated with the same amount of water for one month.

2.3. Measurement of Morphological Traits and Allocation of Biomass to Above and Below-Ground Organs

To measure the growth performance five trees × 3 species × 3 treatments are selected and excavated by hand 11 years (August, 2020) after their planting. As indicators of growth performance, traits such as stem height, Root Collar Diameter (RCD), and root length are measured by using a digital Vernier calliper [36] and ruler (Basic aluminium Staff TS5-5MD, Republic of Korea). Root length is obtained by summing the root length obtained from each root class as described below.
Regarding biomass, we measured separately the dry weight of above- and below-ground organs. In the case of above-ground organs, we have measured separately each component (i.e., stem, branches, and leaves) and for this purpose subsamples of each component were collected and dried in an oven for 72 h at 105 °C (stem, branches, and roots) or 70 °C (leaves) in the oven (Forced Convection Oven-OF-21E, Lab Comp., Seoul, Republic of Korea). SB indicates stem biomass; BB indicates branch biomass; LB indicates leaf biomass.
In the case of belowground organs, we used a digital calliper to segregate the roots into different classes based on their diameter according to the classification first suggested by [37] and later modified by [38]. The roots with a diameter below 2 mm are named Fine Root (FR). All the roots characterized by a diameter above 2 mm are divided into four categories (i.e., classes) as follows: Small Root (SR) with a diameter of 2–5 mm); Medium R (MR) with a diameter of 5–10 mm; Large Root (LR) with a diameter of 10–20 mm; and Very Large Root (VLR) with a diameter > 20 mm). Moreover, the Main Root or tap root (TR) is measured separately from all the other lateral roots. Biomass of each root class is obtained by measuring the dry weight of the subsamples after treatment in the oven at 105 °C until constant weight is achieved. An electronic balance (Discovery Semi-Micro and Analytical Balance-DVG215CD, Ohaus Corp., Parsippany, NJ, United States America) is used and biomass of each root class is named: FRB, SRB, MRB, LRB, VLRB, and TRB.
The biomass of aboveground organs (AG) is obtained by summing the biomass of each component and in analogy the biomass of belowground organs (named BG) was obtained by summing the biomass of each single root class. The sum of AG or BG is named the total tree biomass (ToTB) of the tree.
Total carbon (TC) stock per hectare (Mg ha−1) is calculated by summing up the carbon stock of AG and BG of all the trees present in the hectare [39]. The carbon content in AG and BG is calculated by multiplying the dry weight values by a conversion factor of 0.5 [40,41,42,43]. The amount of CO2 sequestered is estimated by multiplying AG and BG carbon content by a 3.67 factor [44].

2.4. Soil Sampling and Chemical Analyses

Regarding the evaluation of the effects of the presence of trees on the chemical properties of the soil, three replicates of soil samples are collected from the plots representing the three tree species tested and the four irrigation regime treatments (control + 3 irrigation regimes). Soil samples referred to two different layers (0–10 and 10–20 cm depth) are collected at 40 cm distance from the stem. Soil samples are air-dried and passed through a 2 mm sieve. Soil organic matter (SOM) is measured by the K2CrO7-H2SO4 oxidation method of Walkley and Black [45]. Calcium carbon content is determined by the volumetric method [46]. The pH is determined for a 1:2.5 air-dried soil/distilled water mixture using a glass electrode pH meter [47]. The electrical conductivity (EC) is determined for a 1:5 air-dried soil/distilled water mixture using a platinum electrode. Available phosphorus (P2O5) is measured by molybdenum blue colourimetric after (NH4)2CO3 digestion [48]. Nitrate-nitrogen (NO2-N) is determined by using CH3COONa digestion and a spectropolarimeter. Potassium (K2O) is analyzed by flame spectrometry methods [49].

2.5. Statistical Analysis

All the statistical analyses are performed by using the Statistical Analysis Software (SAS) package v.9.4 [50]. Two-way ANOVA is run for each species to determine the effects of different irrigation treatments on the parameters measured. Duncan’s multiple range test (DMRT) is used to evaluate multiple comparisons among the treatments. For the ratio between each morphological parameter, principal component analysis (PCA) is performed by using the Paleontological Statistics (PAST) program [51]. All parameters are visualized by a heat map function. The heat map was built using the Display R program package [52] and grouped both rows and columns. The numeric differences in the heat map are highlighted by a colour scale where dark blue and light blue colours indicate the increase and the decrease of each parameter, respectively. The graphs are produced using the Sigma Plot 12.5 software [53].

3. Results

3.1. Effect of Irrigation Regimes on Morphological Traits of Above- and Below-Ground Organs of the Trees

The growth performance of the trees in the presence or absence of irrigation was evaluated by measuring separately the morphological traits of above- or below-ground organs. Seedlings of the three species growing without irrigation (control samples) did not survive after planting (not shown), contrary to the seedlings treated with irrigation showing a good growth performance (stem height, RCD, and root length) also at the lowest irrigation regime (Figure 3; Table S1). In U. pumila treated with 12 L h−1 (Figure 3) stem height presented values higher than the trees treated with 8 and 4 L h−1. Instead, in T. ramosissima and E. moorcroftii stem height showed similar values with 12 or 8 L h−1 which were higher than 4 L h−1. In the case of RCD, both E. moorcroftii and U. pumila treated with 8 and 12 L h−1 showed similar values higher than 4 L h−1 whereas in T. ramosissima, the highest value was found in 8 L h−1. Root length values in U. pumila and T. ramosissima, were similar in all irrigation regimes, contrary to E. moorcroftii which showed the highest value with 12 L h−1 whereas the other two watering regimes did not show significant differences.

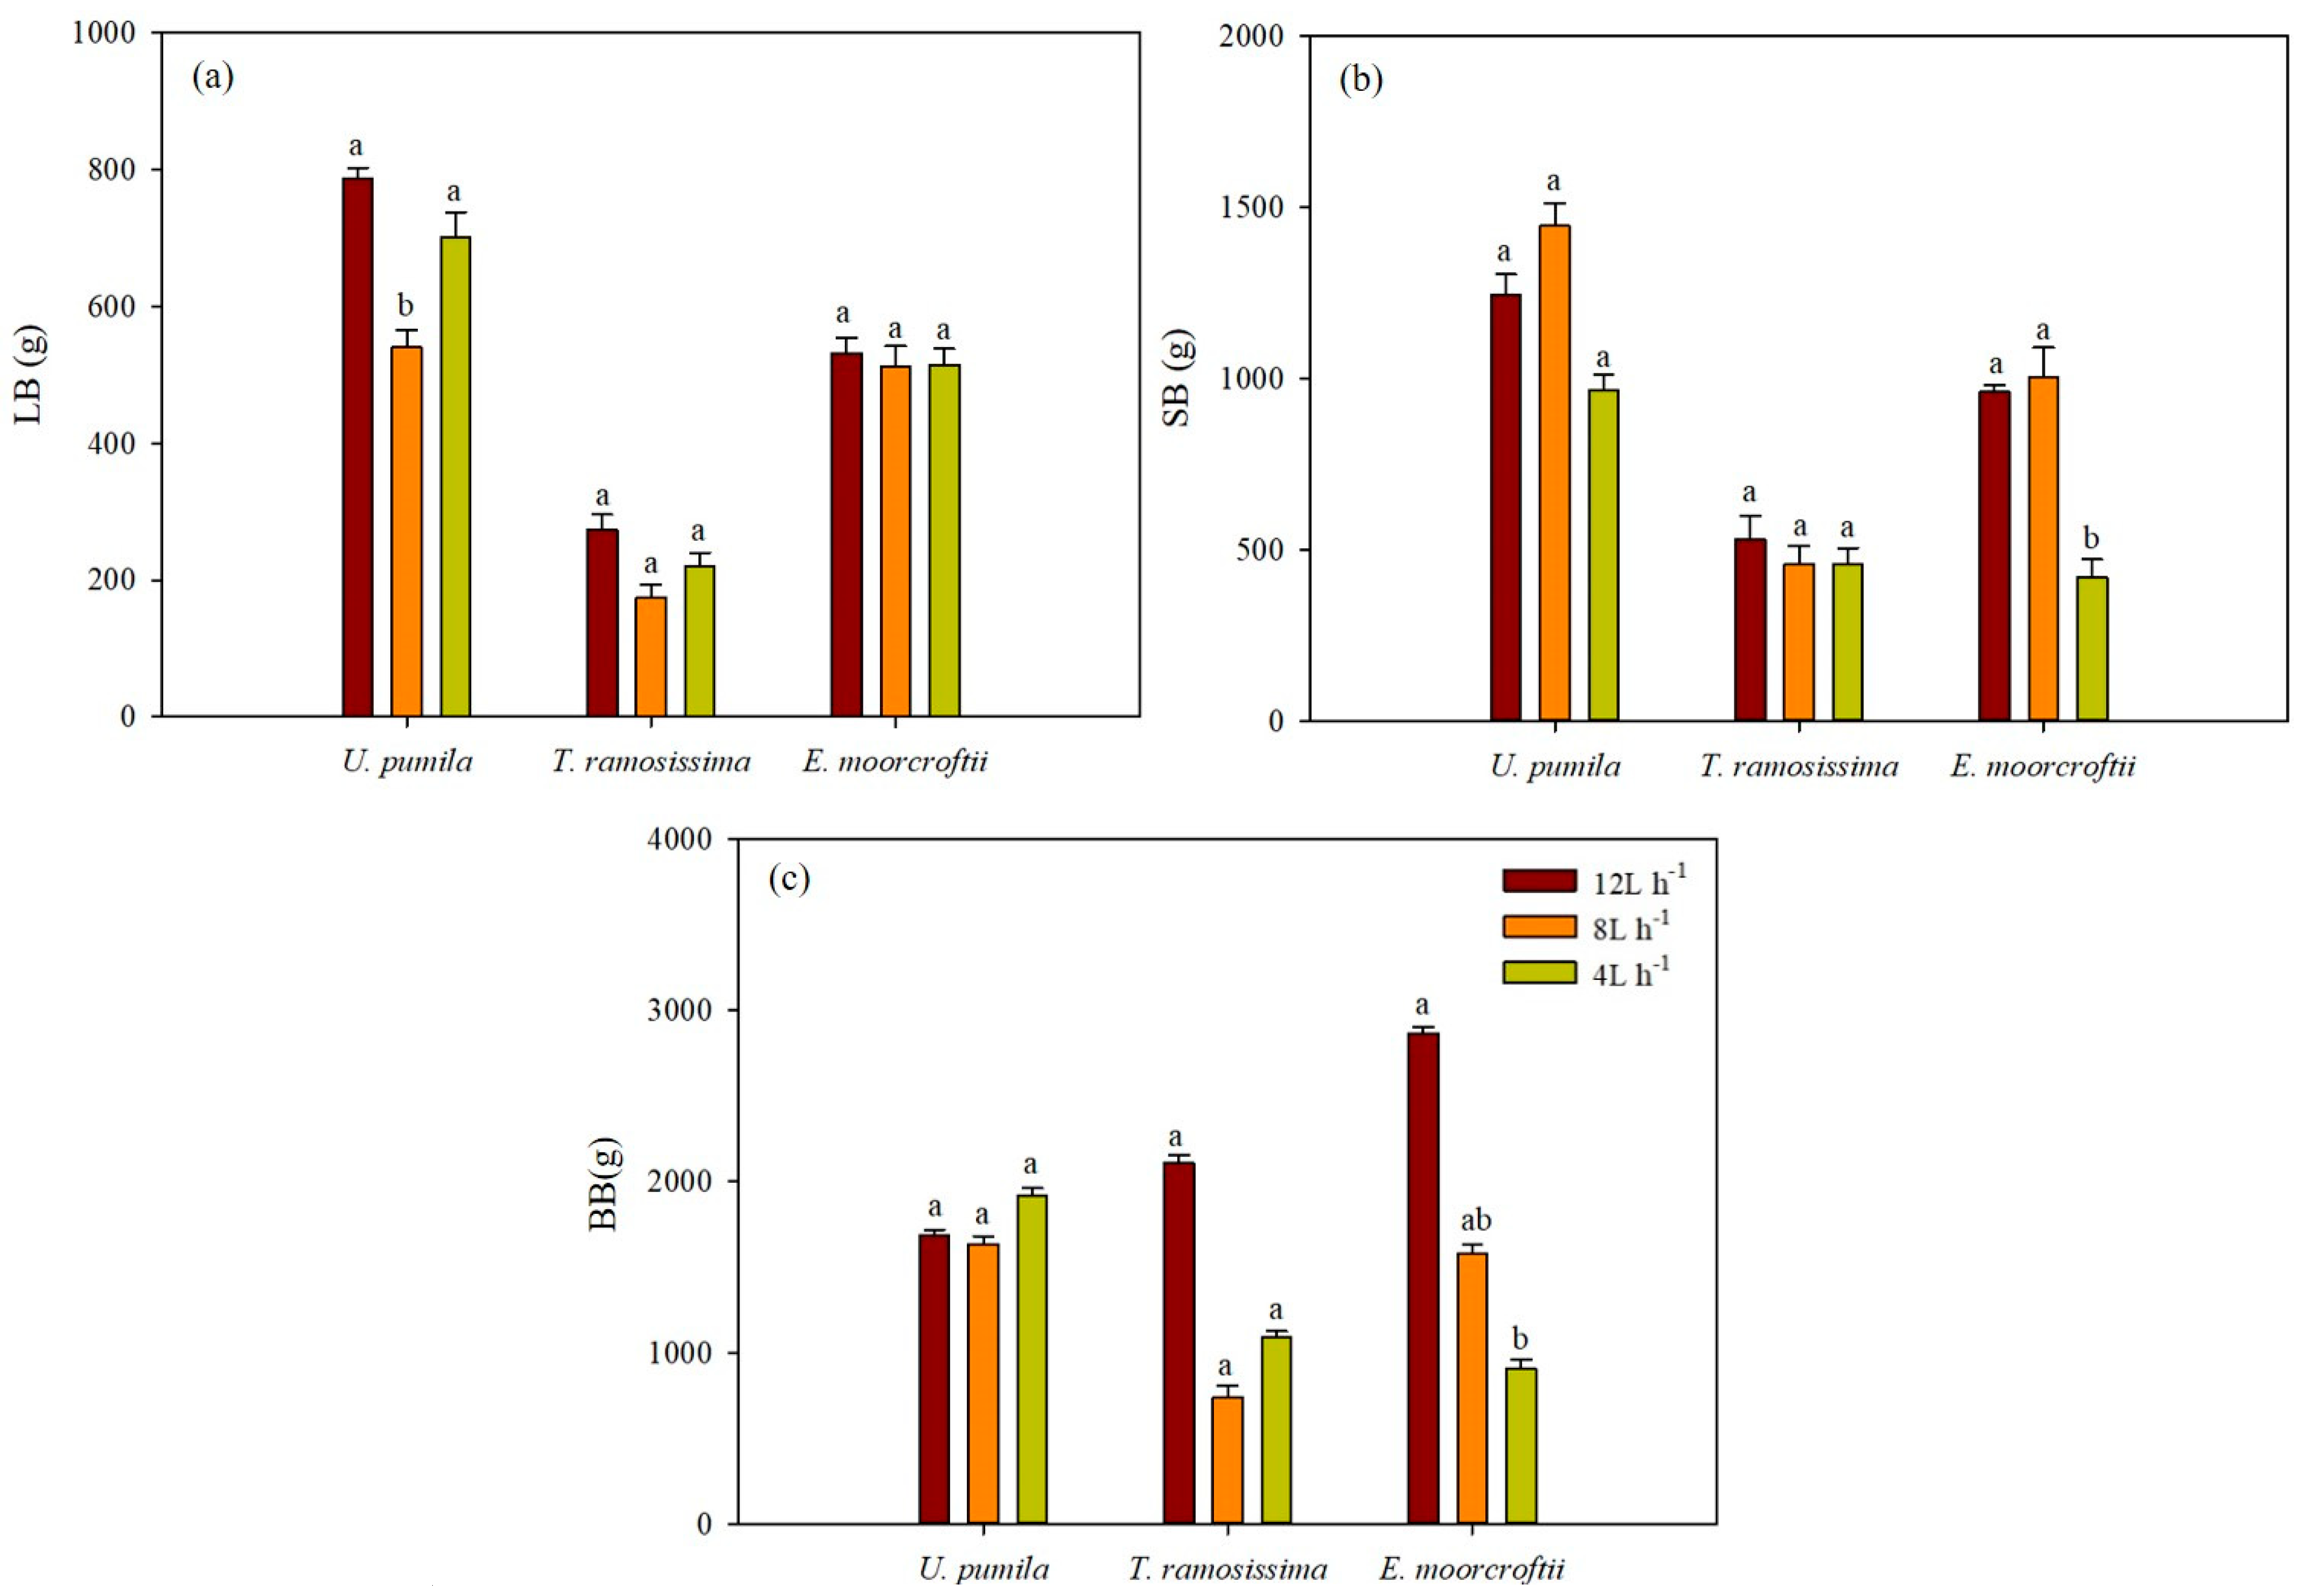
3.2. Irrigation and Biomass Partitioning

In the case of TB, our data showed (Figure 4a) that in U. pumila there were no differences between the irrigation regime applied contrary to both T. ramosissima and E. moorcroftii. In E. moorcroftii, TB values were almost similar to those reported for U. pumila in 12 L h−1 and 8 L h−1 whereas the values in 4 L h−1 were significantly lower. In T. ramosissima the TB values in 12 L h−1 were considerably lower than in U. pumila or E. moorcroftii (Figure 4a; Table S2) with the lowest value found in 8 L h−1.
In the case of BG (i.e., TRB) in U. pumila, 4 L h−1 induced a lower value concerning the other two irrigation regimes (Figure 4b). The same pattern of BG variations was observed in T. ramosissima and E. moorcrofti even though the 8 L h−1 induced in E. moorcrofti values were similar to those measured in 12 L h−1 (Figure 4b).
When we measured AG biomass (Figure 4c) U. pumila showed similar values which were independent of irrigation regimes. Higher were the values in T. ramosissima and E. moorcroftii when irrigation was 12 L h−1.
It was interesting to investigate if/how the different irrigation regimes affected the partitioning of biomass among the different components of the AG or BG.
Regarding AG, we found that LB, except for 8 L h−1 in U. pumila, was not affected by the irrigation regime used. The lowest value was observed in T. ramosissima (Figure 5a; Table S2). Also in the case of SB, our data showed a lack of difference between the irrigation regimes except for E. moorcroftii trees, where a significant reduction of stem biomass were observed with the lowest irrigation regime (Figure 5b). In analogy, also regarding BB (Figure 5c), the only difference was found in E. moorcroftii trees, with the lowest value found in 4 L h−1.
Regarding the biomass investment in the different root classes (described in Materials and Methods), our data showed that in U. pumila the irrigation regimes did not induce variations in TR, VLR and MR classes, whereas significant reductions were observed in FR, SR, and LR classes but only in 12 L h−1 (Figure 6a–f). In T. ramosissima, biomass investments in MR, LR, and VLR classes were reduced with lower irrigation regimes (i.e., 8 and 4 L h−1), whereas they were completely arrested in the FR class. (Figure 6a–f). In the case of E. moorcroftii, our data showed that biomass investments in FR and SR classes were insensitive to irrigation regimes whereas increased in MR, LR, VLR, and TR classes with higher irrigation regimes (Figure 6a–f).
To better understand how the irrigation regimes altered the partitioning of biomass in the AG components (SB, BB, and LB) or BG, we investigated the ratio between the biomass present in each AG component or BG and the total biomass measured in the tree species studied (ToTB) (Table 1). According to the data collected, we found that in U. pumila, more than half of TB (54%–58%) are located in AG, compared to a little more than 40% (41%–45%) found in RB. Slightly higher (65%–68%) was the percentage of biomass found in AG organs of T. ramosissima and E. moorcroftii concerning ToTB. Regarding the BG, we found that the percentage of biomass decreased from 41%–45% in U. pumila to 31%–42% in the other two tree species.
With the same purpose, we decided to analyze (Table 2) how biomass investments belowground were partitioned among each root class in the three tree species. In this case, it is evident that TRB of U. pumila presented nearly half (48%−58%) of BG and this partitioning was not affected by variations of the irrigation regimes. Moreover, our data showed that biomass partitioning was not sensitive to variation of irrigation regime in TR but also MR, and VLR. On the contrary, significant variations of biomass in response to irrigation regimes were found in FR, SR, and LR with higher values observed with the highest level of irrigation.
Biomass partitioning between the root classes of T. ramosissima showed that in the root apparatus of this tree, the TR (Table 2) accounted for more than 50% of total root biomass (59%–72%). Significant differences were observed with variations of irrigation regime with the highest value found at lower levels of irrigation. In all the other root classes (SRB, MRB, LRB, VLRB) the highest percentages were observed with the highest level of irrigation.
The data regarding the partitioning of root biomass in E. moorcroftii (Table 2), showed that 52%−69% of biomass was allocated to the TR class with higher values with 8–12 L h−1. The biomass allocated to MR and VLR classes lacked significant variations with the irrigation regimes whereas LRB decreased significantly its percentage with the the increase of the level of irrigation.

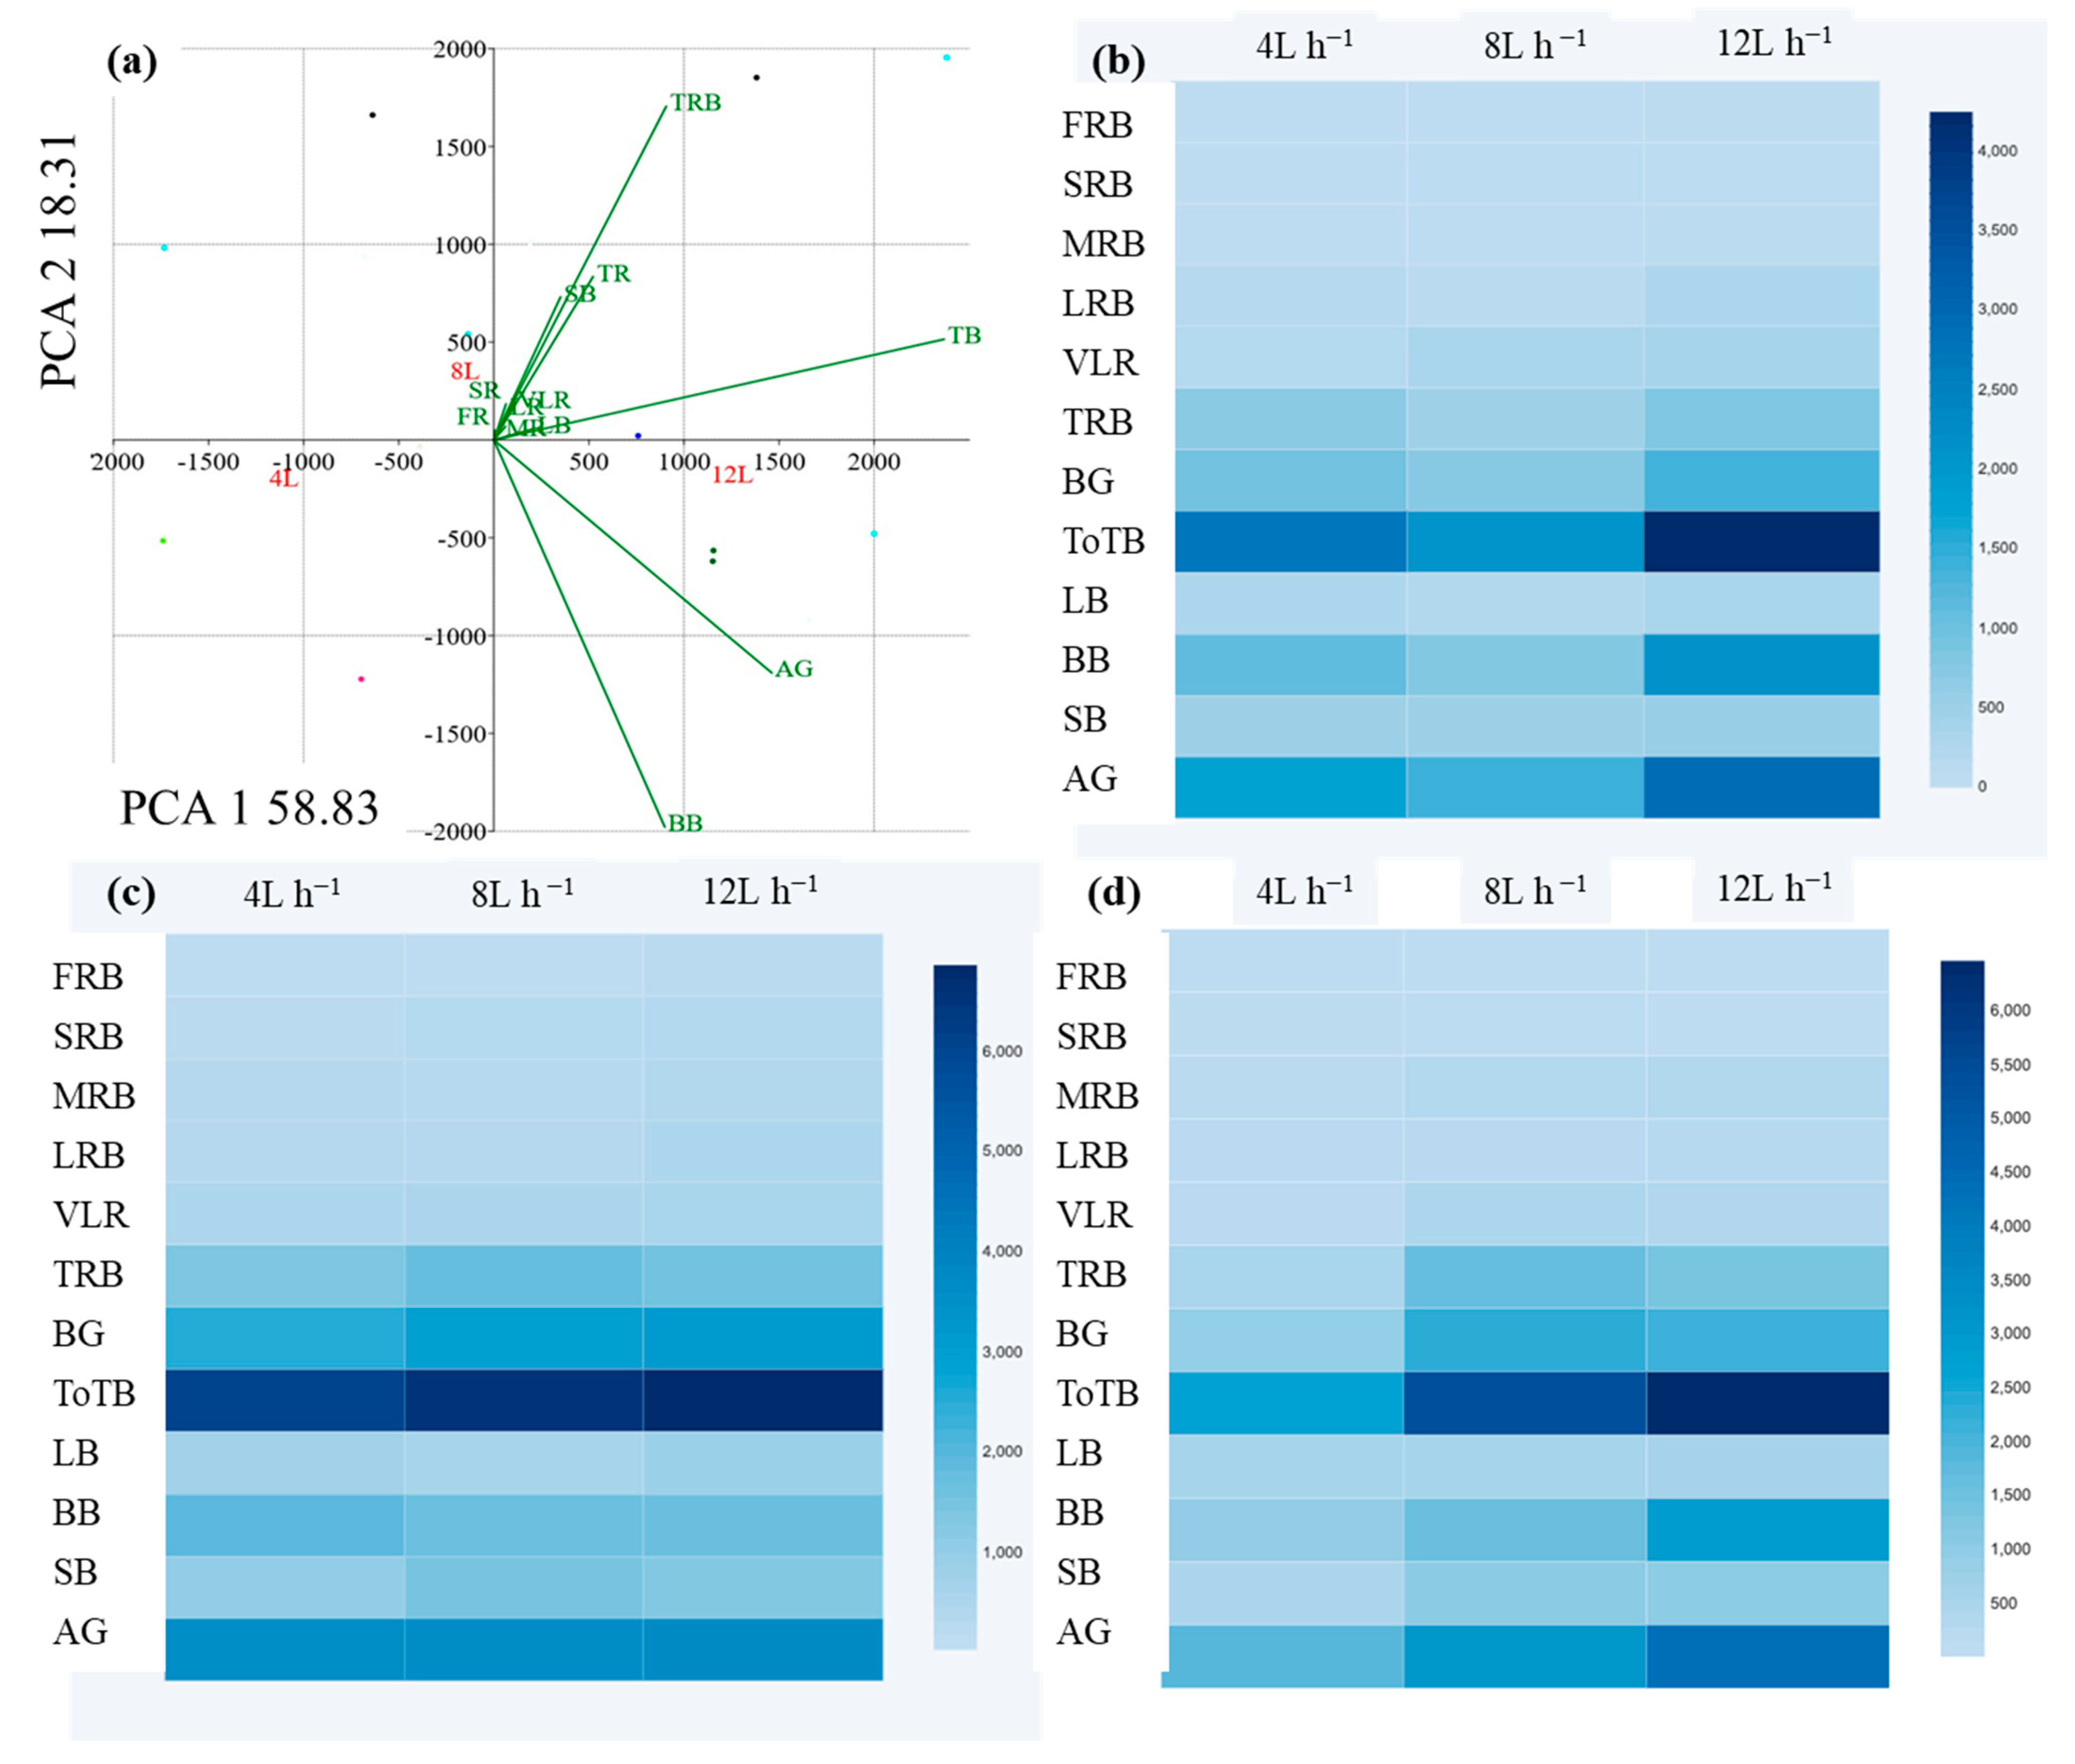
3.3. Statistical Analysis of the Variation of Biomass Partitioning between Above and Below-Ground Organs of Each Tree Species in Response to Different Irrigation Regimes

According to our PCA analysis, it was particularly evident that variation in biomass partitioning was positively correlated with the increase of irrigation regime. In particular, 8 and 12 L h−1 irrigation regimes accounted for 77.14% of data variance (PCA 1 58.83%, PCA 2 18.31%) (Figure 7a). Moreover, when we used the heat map approach we obtained a clear indication that in all three tree species tested, ToTB showed variations that depended on the irrigation regime. Regarding biomass partitioning, it became evident (Figure 7b–d) that in BG the amount of biomass allocated to root classes with low diameters did not change (or change very little) with the variation of the irrigation regime. Different was the response of the taproot showing variations already when trees were treated with the lowest 4 L h−1 level of irrigation (Figure 7b–d).
Regarding AG partitioning, the Heath Map showed that variations depending on the irrigation regime of AG in U. pumila were absent compared with T. ramossima and E. moorcroftii. In particular, biomass accumulation in the leaves and non-significant variation were not observed in irrigation in all three tree species tested.

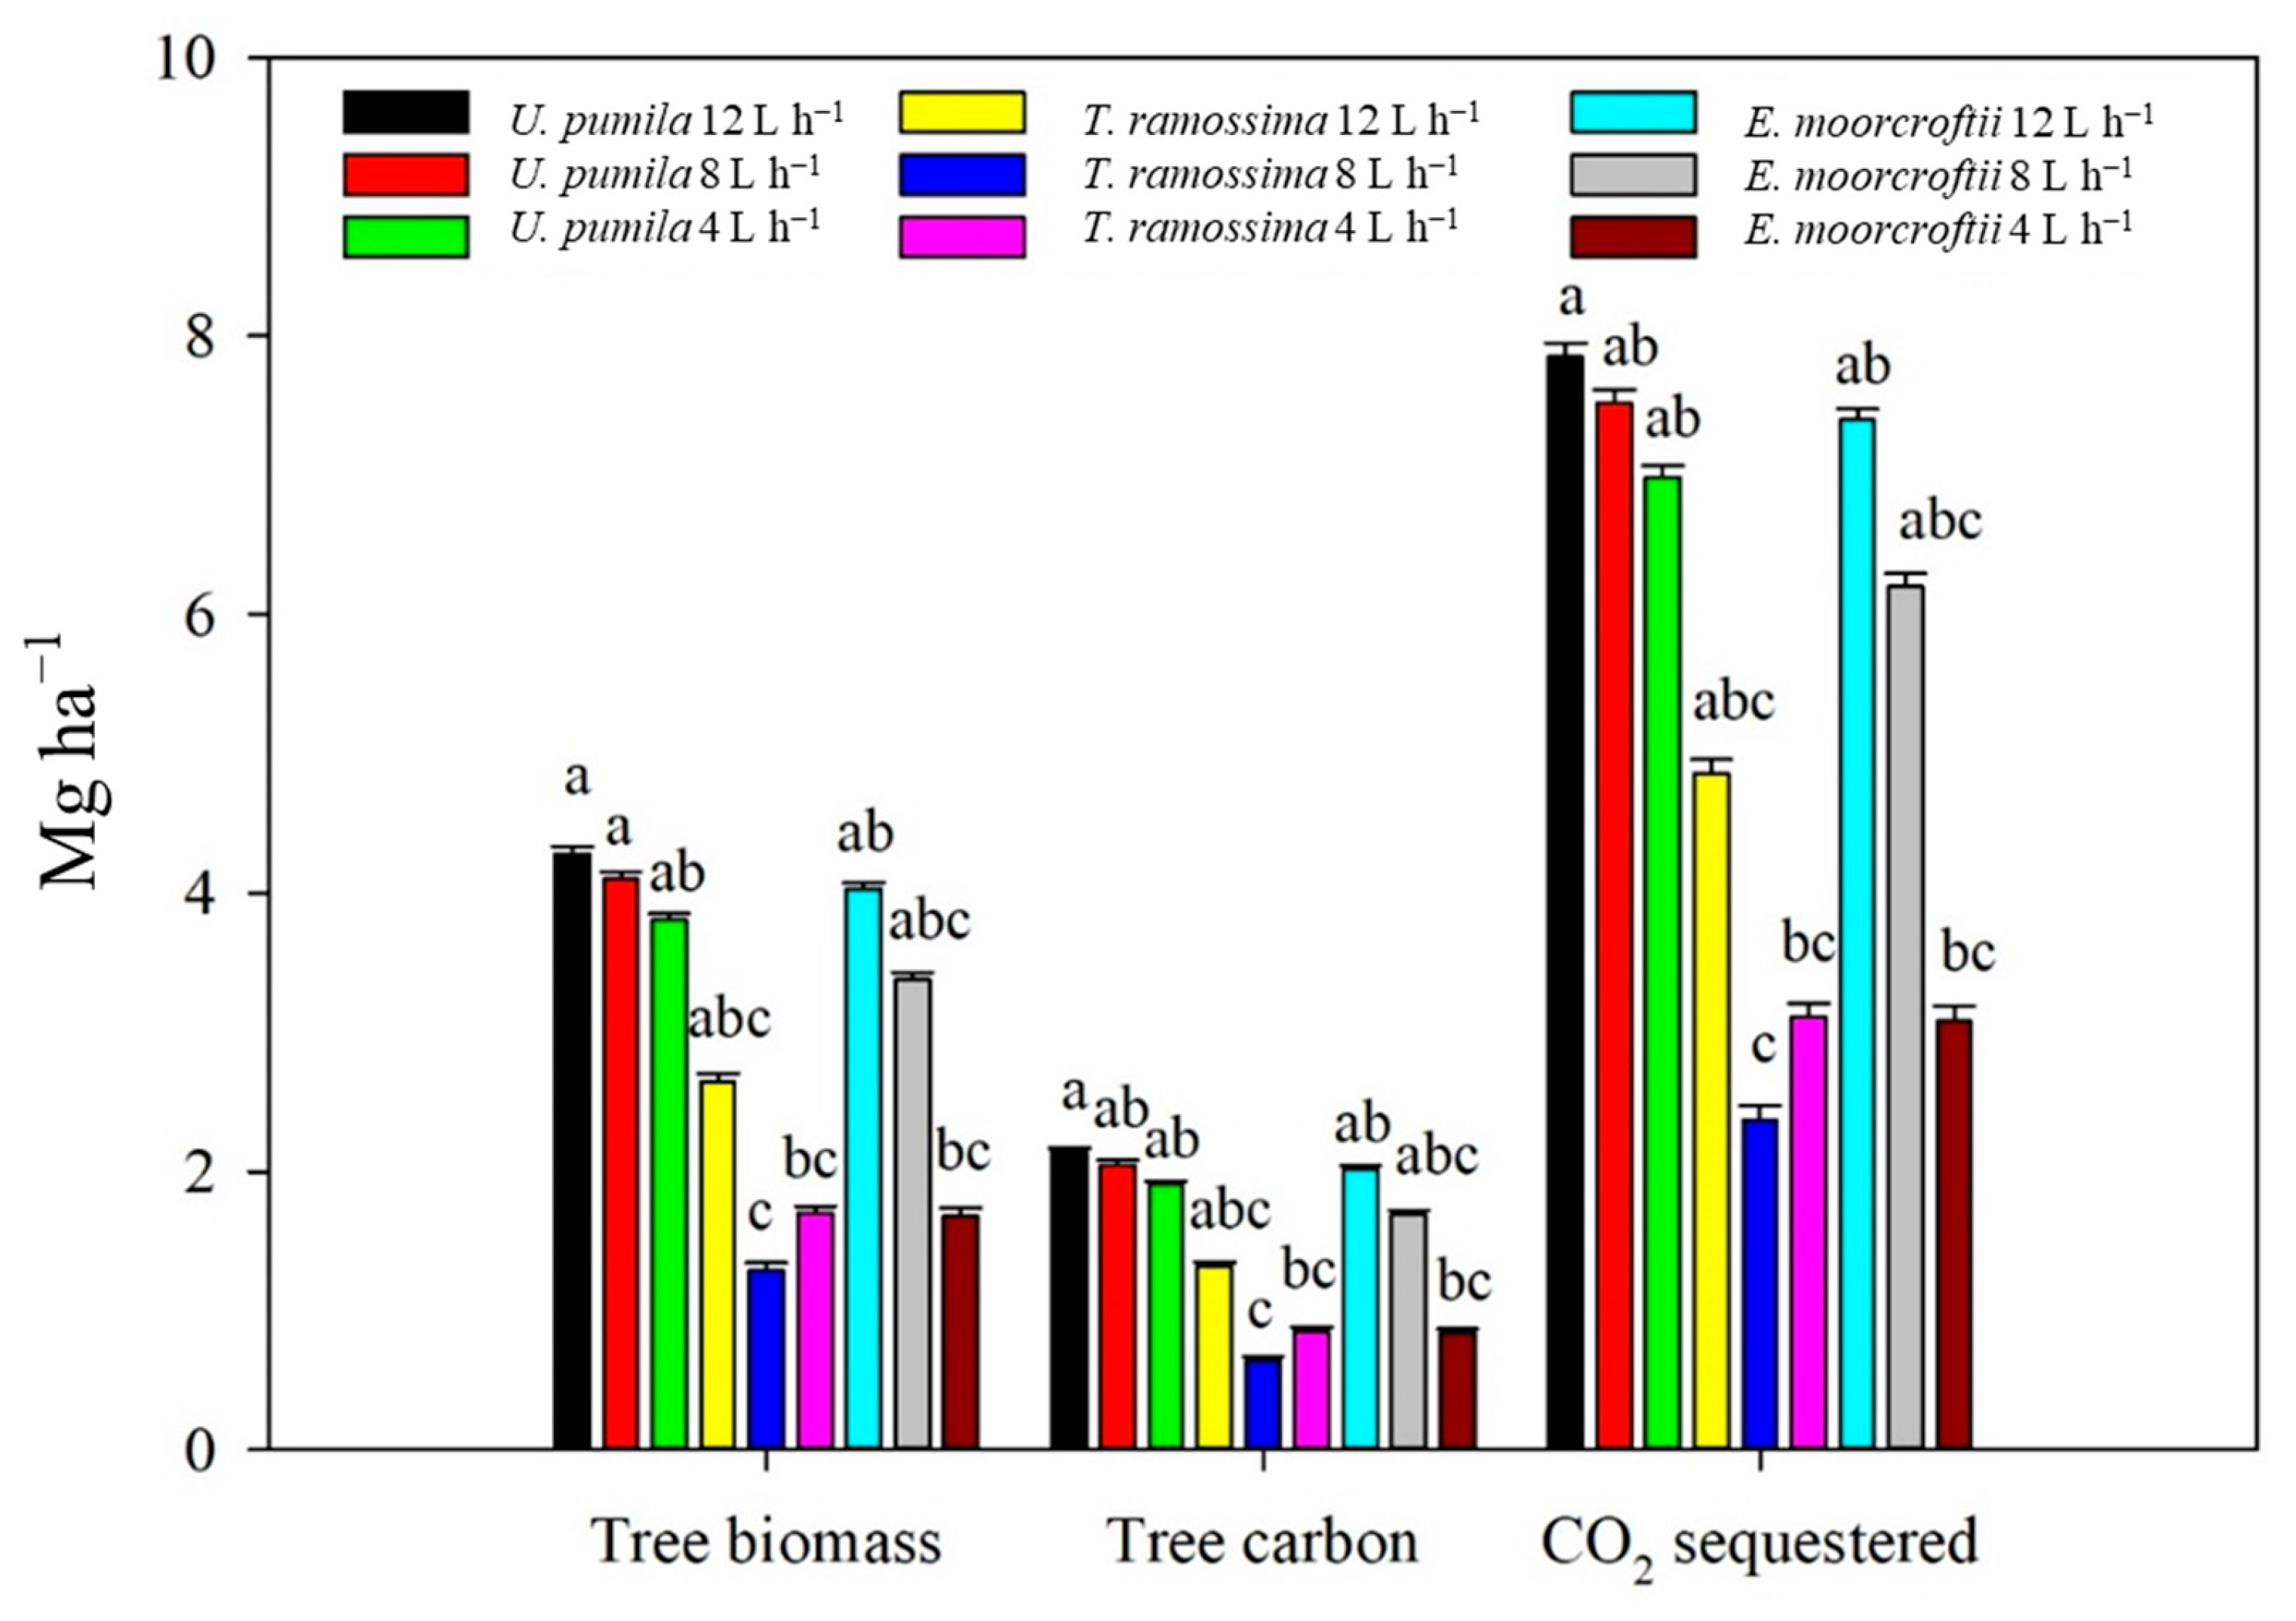
3.4. Carbon Content in the Tree

By summing AG and BG, we have estimated (according to what is described in the Materials and Methods section): (1) the mean amount of plant biomass produced per hectare; (2) the amount of carbon sequestered in the tree biomass per hectare; and (3) the amount of carbon sequestered by the plantation per hectare (Figure 8). The data indicated that U. pumila trees presented the highest values of all three parameters, whereas T. ramosissima showed the lowest values.

3.5. Soil Chemical Properties

When we compared the chemical properties of soil where plantations with the selected tree species had been established with the pH of control soil (i.e., soil without plantations) (Table 3), we did not find significant differences. In the case of calcium carbonate (CaCO3), the data indicated that the soil planted with U. pumila or T. ramosissima showed a considerable decrease in concentration that was correlated to higher irrigation regimes (8 and 12 L h−1). Completely different was the result obtained with soil where E. moorcroftii had been planted as in this case the lowest concentration of calcium carbonate was observed with the highest level of irrigation (Table 3). The percentage of organic matter (%) remained constant with different watering regimes independently from the tree plantation considered. Regarding the Nitrate-Nitrogen concentration in the soil, we found a rapid decrease related to an increase in the level of the irrigation regime in the soil where U. pumila and T. ramosissima had been growing. In the case of soil with E. moorcroftii, we observed that despite the decrease of concentration related to an increase in the irrigation level, all Nitrate-Nitrogen concentrations were considerably higher than the control soil independent from the level of irrigation considered (Table 3). EC in soil with T. ramosissima showed close values with different levels of irrigation, while decreased in U. pumila and E. moorcroftii with irrigation higher than 4 L h−1. Regarding phosphorous we found that by excluding the soil where U. pumila trees were irrigated with 12 L h−1, all the other soils showed decreasing values related to an increase of the level of irrigation. In the case of potassium (K2O), our data showed that by increasing the level of irrigation the concentration of potassium, except in soil with E. moorcroftii (Table 3).

4. Discussion

During the last decade, the number of new forests planted worldwide has increased exponentially, and this fact is important as it leads to an attempt to mitigate the negative effect of global changes through sequestering carbon from the atmosphere into plant biomass. At the same time, FAO reports [54] that the number of failures of tree planting initiatives is increasing with seedling mortality after 10 years of growth that could reach 83% as a consequence of negative factors related to technical (i.e., management) and environmental variables acting on the plantations [55].
The danger of failure calls attention to the need to continuously monitor the performance of these plantations, even several years from their implementation, to preserve the possibility of adopting supporting measures if necessary. In particular, close monitoring is necessary during the first few years of growth of the seedlings, when they are more exposed to negative effects due to environmental factors [56]. Moreover, avoiding the failure of the planting initiative is necessary to prevent a decrease in political support for this type of environmental restoration action [55].
Our research group started more than 10 years ago a monitoring activity to assess the performances of plantations implemented in the arid and semiarid lands of Mongolia to mitigate the advancement of desertification [2,17,19,20,21]. These plantations are part of a broader project called the “Green Belt Project,” aimed not only to avoid the irreparable loss of degraded soil but also to improve the local level of livelihood [57]. Another ecosystem service expected from these plantations is the possibility of sequestering carbon from the atmosphere into plant biomass and soil [58]. In fact, it is known that forests represent one of the largest carbon sinks in the world, given that more than 80% of terrestrial biomass is represented by AG and BG components of forest trees [59,60].
In a previous paper [25], we reported that all the tree species tested in the Green Belt plantations are not able to survive the drought conditions of desert sites without the support of drip irrigation. However, in this first study, the knowledge of both growth and development parameters referring to below-ground organs was completely ignored. The importance of investigating carbon allocation derives from the fact that it has been predicted [61] that distribution to below-ground organs is normally preferred over aboveground organs (i.e., optimal partitioning theory) when constraints such as drought limit the growth and development of trees [62]. In fact, several models regarding carbon allocation have been published, but the strategies adopted to govern the variations of biomass partitioning remain unclear [63].
The present study sheds light on the growth and development of U. pumila, T. ramosissima, and E. moorcroftii, trees and investigates if/how biomass is partitioned in above- and below-ground organs in different tree species responds to variations of the irrigation regimes. The first important result emerging from this work is that, unlike other tree species [64,65], we demonstrate that U. pumila, T. ramosissima, and E. moorcroftii can grow and develop in the presence of a low irrigation regime such as 4 L h−1. Despite the fact that in our experimental settings we have not included the inclusion of a barrier able to avoid the movement of water among soil parcels subjected to different irrigation regimes (i.e., the impossibility to correctly correlate the growth response of the trees with the amount of water available in the soil receiving a specific irrigation regime), we show that also the lowest irrigation regime is sufficient to ensure the full development of all their above- and belowground organs. Hence, our study agrees with other authors [66,67,68] that in desert sites, the implementation of forests is possible despite the fact that it is necessary to dig wells to enable tree growth and consequently good plantation performance.
The morphological effect of irrigation on tree branching observed carries little significance since the plantations examined by our work are not located in an urban context where trees play a recreational and landscape-depicting function [69]. More important are the considerations emerging from our comparative analysis of biomass production and its partitioning among above- and below-ground organs (i.e., AG and BG). In fact, knowing where carbon is allocated is an important indication regarding the possible duration of its storage in plant tissues. The length of this storage depends directly upon the lifetime (i.e., when the organ will be shed from the rest of the plant) of the organ where the tissues are located. In fact, when carbon is allocated to leaves or fine roots, we can assume, from the knowledge that these organs have a short mean lifetime, that the carbon stored in them will be returned rapidly to the environment. Different is the case of stems, branches, or MR, LR, and VLR [70,71] where the retention time could be as long as the long life of the tree.
According to the data presented here, T. ramosissima accumulates less biomass and, for this reason, should not be used when a plantation aims only to sequester carbon. At the same time, U. pumila emerges as a better carbon accumulator even when trees are irrigated with the lowest irrigation regime. We exclude from our evaluations the data referring to leaf biomass produced by the trees examined, given that this carbon sink presents a too short lifetime compared to all other plant organs. Moreover, the fact that the ratio of BG to ToTB in all the tree species remains constant despite increasing levels of irrigation confirms that the amount of 4 L h−1 satisfies all the needs of water. This fact explains well why trees arrest any investment of carbon for the production of more roots [72,73].
Interesting is the pattern emerging of how BG is partitioned among roots of different diameter classes, despite the unexplained increase in biomass investment for the production of roots with small diameters when higher irrigation is present. In fact, our result contrasts with what is reported in the literature, which suggests that more fine roots are produced when the water amount in the soil decreases and a larger volume of soil must be explored by the plant in the search for water [74]. Our result also contrasts with our observation that AG does not change with higher irrigation regimes. In the absence of a physiological need (i.e., a higher level of water uptake), one possible explanation could be that in the presence of a higher amount of water in the soil, the mean lifetime of roots with smaller diameters is longer than normal, which would explain why we find an increase in biomass in this root class.
It is known that anthropogenic activities modify soil properties [75], and our data confirm that a number of the chemical properties of desert soil are modified, whereas others remain unchanged after the implementation of our plantations. We show the occurrence of a leaching effect on CaCO3H and Nitrate-Nitrogen [76,77], despite the unexplained reason why, in the case of some tree species, the highest concentration values are related to the highest irrigation support. Furthermore, the lack of variation in organic matter measurable in the soil even in the presence of a high level of biomass production suggests that, probably in the desert site, litter decomposition has a scarce influence on the organic matter stored in the soil (at least at the soil depth considered in our study).
However, the alteration of desert soil properties when plantations are implemented calls for a more thorough study. More so given that irrigation of desert lands paves the way to agroforestry activities that represent an additional economic turning point for the population living in these poor lands.

5. Conclusions

Our work shows how the implementation of plantations in desert sites needs a preliminary comparative analysis of the effects of different irrigation regimes to find the lowest and most sustainable level of irrigation sufficient to successfully support the growth and development of trees. Furthermore, our comparative analysis of tree growth and development proves to be a necessary step in selecting the tree species that better adapts to the environmental factors that characterize a desert site. The destructive approach (i.e., tree excavation) used in our comparative analysis is the only one that provides a reliable measurement of the amount (and plant’s organ partitioning) of atmospheric carbon sequesterable per tree and per hectare of plantation. This knowledge is necessary for building models regarding the possible contribution of forests established worldwide on desert lands to increasing global change mitigation.

Supplementary Materials

The following supporting information can be downloaded at: https://www.mdpi.com/article/10.3390/f15010046/s1, Table S1: Two-way ANOVA results for woody plant height, RCD and root length; Table S2: Two-way ANOVA results for Above-ground and below-ground biomass.

Author Contributions

Conceptualization, B.N.-O. and S.-O.B.; methodology, B.N.-O. and S.-O.B.; software and data analysis, S.-O.B.; data collection, S.-O.B., S.L., E.T., O.B. and A.K.; writing, reviewing and editing S.-O.B., D.C., B.N.-O. and B.B.P.; supervision, B.N.-O. and B.B.P.; funding acquisition, B.N.-O. All authors have read and agreed to the published version of the manuscript.

Funding

This work was financially supported by the Mongolia-Korea Joint “Green Belt” Plantation Project provided by the Korea Forest Service and Northeast Asian Forest Forum and Yuhan Kimberly Co., Ltd. (Republic of Korea).

Data Availability Statement

The data used is primarily reflected in the article. Other relevant data is available from the authors upon request.

Acknowledgments

We thank the members of the Laboratory of Forest Genetics and Ecophysiology, National University of Mongolia and Jonathan O. Hernandez (College of Forestry and Natural Resources, University of the Philippines) for their help in field survey and plant material collections.

Conflicts of Interest

The authors declare no conflict of interest.

References

  1. Entezari Zarch, A.; Ahmadi, H.; Moeini, A.; Pazira, E. Impacts of environmental and human factors on desertification-induced land degradation in arid areas. Arab. J. Geosci. 2021, 14, 2447. [Google Scholar] [CrossRef]
  2. Byambadorj, S.-O.; Chiatante, D.; Akhmadi, K.; Lunten, J.; Ochirbat, B.; Park, B.B.; Scippa, G.S.; Montagnoli, A.; Nyam-Osor, B. The effect of different watering regimes and fertilizer addition on the growth of tree species used to afforest the semi-arid steppe of Mongolia. Plant Biosyst. 2021, 155, 747–758. [Google Scholar] [CrossRef]
  3. Munkhzul, O.; Oyundelger, K.; Narantuya, N.; Tuvshintogtokh, I.; Oyuntsetseg, B.; Wesche, K.; Jäschke, Y. Grazing Effects on Mongolian Steppe Vegetation—A Systematic Review of Local Literature. Front. Ecol. Evol. 2021, 9, 703220. [Google Scholar] [CrossRef]
  4. Kosmas, C.; Kairis, O.; Karavitis, C.; Acikalin, S.; Alcalá, M.; Alfama, P.; Atlhopheng, J.; Barrera, J.; Belgacem, A.; Solé-Benet, A.; et al. An exploratory analysis of land abandonment drivers in areas prone to desertification. Catena 2015, 128, 252–261. [Google Scholar] [CrossRef]
  5. Goffner, D.; Sinare, H.; Gordon, L.J. The great Green Wall for the Sahara and the Sahel initiative as an opportunity to enhance resilience in Sahelian landscapes and livelihoods. Reg. Environ. Chang. 2019, 19, 2139–2140. [Google Scholar] [CrossRef]
  6. Saley, I.A.; Salack, S.; Sanda, I.S.; Moussa, M.S.; Bonkaney, A.L.; Ly, M.; Fodé, M. The possible role of the Sahel Greenbelt on the occurrence of climate extremes over the West African Sahel. Atmos. Sci. Lett. 2019, 20, e927. [Google Scholar] [CrossRef]
  7. Liu, X. Comment on “why large-scale afforestation efforts in China have failed to solve the desertification problem”. Environ. Sci. Technol. 2008, 42, 8165. [Google Scholar] [CrossRef] [PubMed]
  8. Idris Medugu, N.; Rafee Majid, M.; Johar, F.; Choji, I.D. The role of afforestation programme in combating desertification in Nigeria. Int. J. Clim. Chang. Strateg. Manag. 2010, 2, 35–47. [Google Scholar] [CrossRef]
  9. Beiser, V. China’s Green Great Wall is on the Front Line of Its Fight against Desertification, but Is It Sustainable? Available online: https://www.scmp.com/magazines/post-magazine/long-reads/article/2177586/chinas-green-great-wall-front-line-itsfight (accessed on 12 October 2023).
  10. Sarlak, M.; Ferretti, L.V.; Biasi, R. The productive landscape in the desert margin for the sustainable development of rural settlements: An innovative greenbelt for maranjab desert in Iran. Sustainability 2021, 13, 2077. [Google Scholar] [CrossRef]
  11. MNE Report on the State of the Environment of Mongolia 2019–2020; Ministry of Environment and Tourism: Ulaanbaatar, Mongolia, 2020.
  12. National Committee on Combatting Desertification of Mongolia National Report on Voluntary Target Setting to Achieve Land Degradation Neutrality in Mongolia. 2018. Available online: https://www.unccd.int/our-work-impact/country-profiles/mongolia (accessed on 2 September 2023).
  13. Domke, G.M.; Oswalt, S.N.; Walters, B.F.; Morin, R.S. Tree planting has the potential to increase carbon sequestration capacity of forests in the United States. Proc. Natl. Acad. Sci. USA 2020, 117, 24649–24651. [Google Scholar] [CrossRef]
  14. Kassa, G.; Bekele, T.; Demissew, S.; Abebe, T. Above- and belowground biomass and biomass carbon stocks in homegarden agroforestry systems of different age groups at three sites of southern and southwestern Ethiopia. Carbon Manag. 2022, 13, 531–549. [Google Scholar] [CrossRef]
  15. Batkhuu, N.-O.; Khaulenbek, A.; Batkhishig, O.; Janchivdorj, L.; Bayasgalan, D.; Tsagaantsooj, N.; Ser-Oddamba, B.; Enkhchimeg, T.; Oyuntugs, A.; Zoljargal, S.; et al. Afforestation Practice in Arid and Semi-Arid Regions of Mongolia; Chultem, D., Ed.; Hunnu Press LLC: Ulaanbaatar, Mongolia, 2018; ISBN 978-99978-4-889-5. [Google Scholar]
  16. Avirmed, T.; Byambadorj, S.-O.; Chiatante, D.; Sharavdorj, K.; Ganbat, B.; Sukhbaatar, G.; Nyam-Osor, B. Afforestation of semi-arid regions of Mongolia: Carbon sequestration in trees and increase of soil organic carbon. Plant Biosyst.—An Int. J. Deal. All Asp. Plant Biol. 2023, 157, 1. [Google Scholar] [CrossRef]
  17. Byambadorj, S.O.; Hernandez, J.O.; Lkhagvasuren, S.; Erma, G.; Sharavdorj, K.; Park, B.B.; Nyam-Osor, B. Leaf morpho-physiological traits of Populus sibirica and Ulmus pumila in different irrigation regimes and fertilizer types. PeerJ 2023, 11, e16107. [Google Scholar] [CrossRef] [PubMed]
  18. Ser-Oddamba, B.; Khaulenbek, A.; Janchivdorj, L.; Batkhishig, O.; Park, B.B.; Batkhuu, N.-O. The Effect of Different Watering Regimes on the Growth of Trees and Shrubs in Desert Regions of Mongolia. Mong. J. Biol. Sci. 2020, 18, 55–64. [Google Scholar] [CrossRef]
  19. Nyam-Osor, B.; Byambadorj, S.; Park, B.B.; Terzaghi, M.; Gabriella, S.S.; Stanturf, J.A.; Chiatante, D.; Montagnoli, A. Root Biomass Distribution of Populus sibirica and Ulmus pumila Afforestation Stands Is Affected by Watering Regimes and Fertilization in the Mongolian Semi-arid Steppe. Front. Plant Sci. 2021, 12, 638828. [Google Scholar] [CrossRef] [PubMed]
  20. Montagnoli, A.; Lasserre, B.; Terzaghi, M.; Byambadorj, S.O.; Nyam-Osor, B.; Scippa, G.S.; Chiatante, D. Fertilization reduces root architecture plasticity in Ulmus pumila used for afforesting Mongolian semi-arid steppe. Front. Plant Sci. 2022, 13, 878299. [Google Scholar] [CrossRef] [PubMed]
  21. Byambadorj, S.-O.; Nyam-Osor, B.; Park, B.B.; Avirmed, T.; Scippa, G.S.; Chiatante, D.; Montagnoli, A.; Dimitrova, A. Afforestation of Mongolian steppe: Patterns of biomass partitioning in Populus sibirica and Ulmus pumila trees in response to management supporting measures. Plant Biosyst.—An Int. J. Deal. All Asp. Plant Biol. 2021, 156, 969–981. [Google Scholar] [CrossRef]
  22. Cho, S.; Ser-Oddamba, B.; Batkhuu, N.-O.; Seok Kim, H. Comparison of water use efficiency and biomass production in 10-year-old Populus sibirica and Ulmus pumila plantations in Lun soum, Mongolia. Forest Sci. Technol. 2019, 15, 147–158. [Google Scholar] [CrossRef]
  23. Chen, S.; Wang, D.; Sheng, X.; Zhang, C.; Li, W.; Xiao, N.; Wang, L.; Lu, Z. Comparison of Stomatal Structure and Distribution between Ovules and Leaves in Ginkgo biloba. Forests 2022, 13, 1801. [Google Scholar] [CrossRef]
  24. Yan, X.L.; Dai, T.F.; Jia, L.M. Evaluation of the cumulative effect of drip irrigation and fertigation on productivity in a poplar plantation. Ann. For. Sci. 2018, 75, 5. [Google Scholar] [CrossRef]
  25. Byambadorj, S.-O.; Park, B.B.; Hernandez, J.O.; Dulamsuren, N.; Sainbuyan, Z.; Altantugs, O.; Sharavdorj, K.; Seong, I.K. Optimal Irrigation Regime for Woody Species Potentially Suitable for Effective and Sustainable Afforestation in the Desert Region of Mongolia. Land 2021, 10, 212. [Google Scholar] [CrossRef]
  26. Wang, Z.; Li, G.; Sun, H.; Ma, L.; Guo, Y.; Zhao, Z.; Gao, H.; Mei, L. Effects of drought stress on photosynthesis and photosynthetic electron transport chain in young apple tree leaves. Biol. Open 2018, 7, bio035279. [Google Scholar] [CrossRef] [PubMed]
  27. Hartmann, H.; Bahn, M.; Carbone, M.; Richardson, A.D. Plant carbon allocation in a changing world—Challenges and progress: Introduction to a Virtual Issue on carbon allocation: Introduction to a virtual issue on carbon allocation. New Phytol. 2020, 227, 981–988. [Google Scholar] [CrossRef] [PubMed]
  28. Carrillo, Y.; Tissue, D.T.; Bruna, S.; Maier, C.; Dijkstra, F.A. Drought Impacts on Tree Root Traits Are Linked to Their Decomposability and Net Carbon Release. Front. For. Glob. Change 2022, 5, 836062. [Google Scholar] [CrossRef]
  29. Ma, X.; Ma, F.; Li, C.; Mi, Y.; Bai, T.; Shu, H. Biomass accumulation, allocation, and water-use efficiency in 10 Malus rootstocks under two watering regimes. Agrofor. Syst. 2010, 80, 283–294. [Google Scholar] [CrossRef]
  30. Liao, C.; Luo, Y.; Fang, C.; Chen, J.; Li, B. The effects of plantation practice on soil properties based on the comparison between natural and planted forests: A meta-analysis. Glob. Ecol. Biogeogr. 2012, 21, 318–327. [Google Scholar] [CrossRef]
  31. Ulziykhutag, N. Overview of the Flora of Mongolia; State Publishing: Ulaanbaatar, Mongolia, 1989. [Google Scholar]
  32. Wesche, K.; Miehe, S.; Miehe, G. Plant communities of the Gobi Gurvan Sayhan National Park (South Gobi Aymak, Mongolia). Candollea 2005, 60, 149–205. [Google Scholar]
  33. Batkhuu, N.-O.; Khaulenbek, A.; Bayasgalan, D.; Batkhishig, O.; Janchivdorj, L.; Tsagaantsooj, N.; Ser-Oddamba, B. Mongolia-Korea Joint “Green Belt” Project Research Report; Art Soft LLC: Ulaanbaatar, Mongolia, 2012. [Google Scholar]
  34. NAMEM The National Agency for Meteorology and Environmental Monitoring of Mongolia. Weather Data. Available online: http://namem.gov.mn/eng/?p=56 (accessed on 2 October 2020).
  35. Batkhishig, O. Soil classification of Mongolia. J. Mong. Soil Sci. 2016, 1, 18–31. [Google Scholar]
  36. Thompson, J.R.; Schultz, R.C. Root system morphology of Quercus rubra L. planting stock and 3-year field performance in Iowa. New For. 1995, 9, 225–236. [Google Scholar] [CrossRef]
  37. Böhm, W. Methods of Studying Root Systems; Springer-Verlag: Berlin, Germany, 1979; ISBN 978-3-642-67282-8. [Google Scholar]
  38. Zobel, R.W.; Waisel, Y. A plant root system architectural taxonomy: A framework for root nomenclature. Plant Biosyst. 2010, 144, 507–512. [Google Scholar] [CrossRef]
  39. Pearson, T.R.H.; Brown, S.L.; Birdsey, R.A. Measurement Guidelines for the Sequestration of Forest Carbon; US Department of Agriculture, Forest Service, Northern Research Station: Washington, DC, USA, 2007; Volume 18, 42p.
  40. Chow, P.; Rolfe, G. Carbon and hydrogen contents of short-rotation biomass of five hardwood species. Wood fiber Sci. 1989, 21, 30–36. [Google Scholar]
  41. MacDicken, K.G. A Guide to Monitoring Carbon Storage in Forestry and Agroforestry Projects; Winrock International Institute for Agricultural Development: Arlington, VA, USA, 1997. [Google Scholar]
  42. Eggleston, H.S.; Miwa, K.; Srivastava, N.; Tanabe, K. IPCC 2006 IPCC Guidelines for National Greenhouse Inventories—A Primer, Prepared by the National Greenhouse Gas Inventories Programme. Available online: https://www.osti.gov/etdeweb/biblio/20880391 (accessed on 10 October 2023).
  43. Thurner, M.; Beer, C.; Santoro, M.; Carvalhais, N.; Wutzler, T.; Schepaschenko, D.; Shvidenko, A.; Kompter, E.; Ahrens, B.; Levick, S.R.; et al. Carbon stock and density of northern boreal and temperate forests. Glob. Ecol. Biogeogr. 2014, 23, 297–310. [Google Scholar] [CrossRef]
  44. Meragiaw, M.; Singh, B.R.; Woldu, Z.; Martinsen, V. Carbon stocks of above- And belowground tree biomass in Kibate Forest around Wonchi Crater Lake, Central Highland of Ethiopia. PLoS ONE 2021, 16, e0254231. [Google Scholar] [CrossRef] [PubMed]
  45. Nelson, D.; Sommers, L.E. Total Carbon, Organic Carbon, and Organic Matter. In Methods of Soil Analysis. Part 3. Chemical Methods; Sparks, D., Ed.; SSSA, ASA: Madison, WI, USA, 1996; pp. 961–1010. [Google Scholar]
  46. ASTM D4373-96; Standard Test Method for Calcium Carbonate Content of Soils. ASTM International: West Conshohocken, PA, USA, 1996.
  47. ISO 10390:2001; Soil Quality. Determination of pH. International Standard: Vernier, Geneva, 2001.
  48. MNS 3310:1991; The Soil. Methods of Determination of the Agrochemical Characteristics of Soil. International Standard: Vernier, Geneva, 1991.
  49. SSIR Soil survey laboratory methods manual. In Soil Survey Investigations Report No.42; Burt, R. (Ed.) USDA-NRCS: Lincoln, NE, USA, 2004; pp. 610–613. [Google Scholar]
  50. SAS Institute Inc. SAS Software 9.4; SAS Inst. Inc.: Cary, NC, USA, 2014; p. 25. [Google Scholar]
  51. Hammer, Ø.; Harper, D.A.; Ryan, P. PAST: Paleontological Statistics Software Package for Education and Data Analysis, Version 4.03; Palaeontologia Electronica: Seattle, DC, USA, 2001. [Google Scholar]
  52. R Core Team R: A Language and Environment for Statistical Computing 2021. Available online: https://www.gbif.org/tool/81287/r-a-language-and-environment-for-statistical-computing (accessed on 15 April 2023).
  53. Systat Software, I. Sigma Plot Version 12.5; Systat Softw. Inc.: San Jose, CA, USA, 2013. [Google Scholar]
  54. FAO Helping Forests Take Cover: On forest Protection, Increasing Forest Cover and Future Approaches to Reforesting Degraded Tropical Landscapes in Asia and the Pacific; FOA: Bangkok, Thailand, 2005.
  55. Del Campo, A.D.; González-Sanchis, M.; García-Prats, A.; Ceacero, C.J.; Lull, C. The impact of adaptive forest management on water fluxes and growth dynamics in a water-limited low-biomass oak coppice. Agric. For. Meteorol. 2019, 264, 266–282. [Google Scholar] [CrossRef]
  56. Kambo, D.; Danby, R. Factors influencing the establishment and growth of tree seedlings at Subarctic alpine treelines.pdf. Ecosphere 2018, 9, e02176. [Google Scholar] [CrossRef]
  57. García-Morote, F.A.; López-Serrano, F.R.; Martínez-García, E.; Andrés-Abellán, M.; Dadi, T.; Candel, D.; Rubio, E.; Lucas-Borja, M.E. Stem biomass production of Paulownia elongata × P. fortunei under low irrigation in a semi-arid environment. Forests 2014, 5, 2505–2520. [Google Scholar] [CrossRef]
  58. Tian, Q.; Zhang, X.; Yi, H.; Li, Y.; Xu, X.; He, J.; He, L. Plant diversity drives soil carbon sequestration: Evidence from 150 years of vegetation restoration in the temperate zone. Front. Plant Sci. 2023, 14, 1191704. [Google Scholar] [CrossRef] [PubMed]
  59. Aponte, C.; Kasel, S.; Nitschke, C.R.; Tanase, M.A.; Vickers, H.; Parker, L.; Fedrigo, M.; Kohout, M.; Ruiz-Benito, P.; Zavala, M.A.; et al. Structural diversity underpins carbon storage in Australian temperate forests. Glob. Ecol. Biogeogr. 2020, 29, 789–802. [Google Scholar] [CrossRef]
  60. Besnard, S.; Santoro, M.; Cartus, O.; Fan, N.; Linscheid, N.; Nair, R.; Weber, U.; Koirala, S.; Carvalhais, N. Global sensitivities of forest carbon changes to environmental conditions. Glob. Change Biol. 2021, 27, 6467–6483. [Google Scholar] [CrossRef]
  61. Poudel, K.P.; Temesgen, H. Methods for estimating aboveground biomass and its components for Douglas-fir and lodgepole pine trees. Can. J. For. Res. 2015, 46, 77–87. [Google Scholar] [CrossRef]
  62. Bloom, A.J.; Chapin, F.S.; Mooney, H.A. Resource limitation in plants—An economic analogy. Annu. Rev. Ecol. Syst. 1985, 16, 363–392. [Google Scholar] [CrossRef]
  63. Herrera-Ramírez, D.; Muhr, J.; Hartmann, H.; Römermann, C.; Trumbore, S.; Sierra, C.A. Probability distributions of nonstructural carbon ages and transit times provide insights into carbon allocation dynamics of mature trees. New Phytol. 2020, 226, 1299–1311. [Google Scholar] [CrossRef] [PubMed]
  64. He, Y.; Xi, B.; Li, G.; Wang, Y.; Jia, L.; Zhao, D. Influence of drip irrigation, nitrogen fertigation, and precipitation on soil water and nitrogen distribution, tree seasonal growth and nitrogen uptake in young triploid poplar (Populus tomentosa) plantations. Agric. Water Manag. 2021, 243, 106460. [Google Scholar] [CrossRef]
  65. Abdoun, K.A.; Altahir, O.A.; Alsagan, A.A.; Alsaiady, M.Y.; Alshaikhi, A.M.; Alshamiry, F.A.; Al-Haidary, A.A. Effect of irrigation frequency and selenium fertilization on the vegetative growth and biomass yield of Moringa oleifera and Moringa peregrina. Sci. Rep. 2022, 12, 22379. [Google Scholar] [CrossRef] [PubMed]
  66. Noulèkoun, F.; Khamzina, A.; Naab, J.B.; Lamers, J.P.A. Biomass allocation in five semi-arid afforestation species is driven mainly by ontogeny rather than resource availability. Ann. For. Sci. 2017, 74, 78. [Google Scholar] [CrossRef]
  67. He, Y.; Xi, B.; Bloomberg, M.; Jia, L.; Zhao, D. Effects of drip irrigation and nitrogen fertigation on stand growth and biomass allocation in young triploid Populus tomentosa plantations. For. Ecol. Manag. 2020, 461, 117937. [Google Scholar] [CrossRef]
  68. Imada, S.; Matsuo, N.; Acharya, K.; Yamanaka, N. Effects of salinity on fine root distribution and whole plant biomass of Tamarix ramosissima cuttings. J. Arid Environ. 2015, 114, 84–90. [Google Scholar] [CrossRef]
  69. Zhao, J.; Xu, W.; Li, R. Visual preference of trees: The effects of tree attributes and seasons. Urban For. Urban Green. 2017, 25, 19–25. [Google Scholar] [CrossRef]
  70. David, M.; Eissenstat, R.D.Y. Root Life Span, Efficiency, and Turnover. In Plant Roots; CRC Press: Boca Raton, FL, USA, 2002; p. 28. ISBN 9780429221859. [Google Scholar]
  71. Gu, J.; Wang, Y.; Fahey, T.J.; Wang, Z. Effects of root diameter, branch order, soil depth and season of birth on fine root life span in five temperate tree species. Eur. J. For. Res. 2017, 136, 727–738. [Google Scholar] [CrossRef]
  72. Brunner, I.; Herzog, C.; Galiano, L.; Gessler, A. Plasticity of fine-root traits under long-term irrigation of a water-limited scots pine forest. Front. Plant Sci. 2019, 10, 701. [Google Scholar] [CrossRef]
  73. Liu, F.; You, Q.; Xue, X.; Peng, F.; Huang, C.; Ma, S.; Pan, J.; Shi, Y.; Chen, X. The Stem Sap Flow and Water Sources for Tamarix ramosissima in an Artificial Shelterbelt With a Deep Groundwater Table in Northwest China. Front. Plant Sci. 2022, 13, 794084. [Google Scholar] [CrossRef]
  74. Cordeiro, A.L.; Norby, R.J.; Andersen, K.M.; Valverde-Barrantes, O.; Fuchslueger, L.; Oblitas, E.; Hartley, I.P.; Iversen, C.M.; Gonçalves, N.B.; Takeshi, B.; et al. Fine-root dynamics vary with soil depth and precipitation in a low-nutrient tropical forest in the Central Amazonia. Plant-Environ. Interact. 2020, 1, 3–16. [Google Scholar] [CrossRef]
  75. Vieira, D.A.; Martins, T.O.; Matias, R.A.M.; Silva, P.H.F.; Valadão, M.B.X.; Barbosa, P.V.G.; Gatto, A.; Pinto, J.R.R.; Bussinguer, A.P.; Ribeiro, F.P. Relationships between soil properties and species establishment in the restoration of mined soils in the Cerrado biome. PLoS ONE 2022, 17, e0277193. [Google Scholar] [CrossRef]
  76. He, Z.; Hu, Q.; Zhang, Y.; Cao, H.; Nan, X. Effects of irrigation and nitrogen management strategies on soil nitrogen and apple yields in loess plateau of China. Agric. Water Manag. 2023, 280, 108220. [Google Scholar] [CrossRef]
  77. Zhao, Z.; Zheng, W.; Ma, Y.; Wang, X.; Li, Z.; Zhai, B.; Wang, Z. Responses of soil water, nitrate and yield of apple orchard to integrated soil management in Loess Plateau, China. Agric. Water Manag. 2020, 240, 106325. [Google Scholar] [CrossRef]
Figure 1. (a) Location and (b) Planting scheme of the study site. Each plot (25 m × 25 m) refers to one of three tree species tested and to a different irrigation regime. Each plot included 36 seedlings of the experimental site within the Green belt plantation in Dalanzadgad soum, Umnugobi province, Mongolia.
Forests 15 00046 g001
Figure 2. Mean annual temperature (solid line) and rainfall (broken, dotted line) in the experimental site are obtained from the period of January–December (1991–2020).
Forests 15 00046 g002
Figure 3. Plant height (cm) (a), root collar diameter (RCD, cm) (b) and root length (cm) (c) of U. pumila, T. ramosissima and E. moorcroftii measured during the last growing season (2020) on trees grown at different irrigation regimes (12 L h−1, 8 L h−1 and 4 L h−1) (n = 5 ± SE). Different letters indicate significant differences (p < 0.05) between treatments for each species.
Forests 15 00046 g003
Figure 4. TB (a), BG (b) and AG (c) for U. pumila, T. ramosissima and E. moorcroftii in different irrigation regimes (12 L h−1, 8 L h−1 and 4 L h−1) (n = 5 ± SE). Different letters indicate significant differences (p < 0.05) between treatments for each species.
Forests 15 00046 g004
Figure 5. LB (a); SB (b), and BB (c) in U. pumila, T. ramosissima and E. moorcroftii grown with different irrigation regimes (12 L h−1, 8 L h−1 and 4 L h−1) (n = 5 ± SE). Different letters indicate significant differences (p < 0.05) between treatments for each species.
Forests 15 00046 g005
Figure 6. Measurement of root biomass divided into categories. FRB (a); SRB (b); MRB (c); LRB (d); VLR (e); TRB (f) of U. pumila, T. ramosissima, and E. moorcroftii treated with different irrigation treatments (12 L h−1, 8 L h−1, and 4 L h−1) (n = 5 ± SE). Different letters indicate significant differences (p < 0.05) between irrigation treatments for each species.
Forests 15 00046 g006
Figure 7. Principal component analysis and heatmap for morphological parameters under different irrigation treatments (12 L h−1, 8 L h−1, and 4 L h−1). (a) PCA biplot of all individual samples for PCA 1 and PCA 2. The data shows three species with three watering regimes and four replicates. FRB (Fine Roots Biomass), SRB (Small Roots Biomass), MRB (Medium Roots Biomass), LRB (Large Root Biomass), VLR (Very Large Roots), TRB (Taproot Biomass), BG (Below-Ground Biomass), ToTB (Total Tree Biomass), LB (Leaf Biomass), BB (Branch Biomass), SB (Stem Biomass), AG (Above-Ground Biomass). (b) Heat-map of T. ramosissima; (c) Heat-map of U. pumila; (d) Heat-map of E. moorcroftii.
Forests 15 00046 g007
Figure 8. Total biomass found in the trees present per hectare, total carbon sequestered by the trees (i.e., TC stock) present per hectare, and total CO2 sequestered in the plantation per hectare. Lowercase letters indicate significant differences (p < 0.05) between treatments and species. (n = 5 ± SE).
Forests 15 00046 g008
Table 1. The ratio between LB, BB, SB, BG, and AG against Total Tree Biomass (ToTB) total biomass of U. pumila, T. ramosissima, and E. moorcroftii grown with different irrigation regimes (12 L h−1, 8 L h−1, and 4 L h−1) (n = 5 ± SE).
Plant
Species
Treatments%, LB/ToTB%, BB/ToTB%, SB/ToTB%, AG/ToTB%, BG/ToTB
U. pumila12 L h−111.49 ± 1.29 a24.62 ± 1.58 b18.2 ± 1.43 a,b54.32 ± 5.05 a45.67 ± 3.45 a
8 L h−18.23 ± 1.13 b24.94 ± 1.65 b22.05 ± 1.44 a55.24 ± 5.12 a44.75 ± 3.48 a
4 L h−111.5 ± 1.25 a31.5 ± 1.72 a15.86 ± 1.38 b58.87 ± 5.35 a41.12 ± 3.21 a
T. ramosissima12 L h−16.47 ± 0.98 b49.74 ± 2.58 a12.5 ± 1.12 b68.72 ± 5.14 a31.27 ± 2.24 a
8 L h−18.43 ± 1.25 a35.95 ± 2.85 b22.29 ± 1.25 a66.68 ± 6.12 a33.31 ± 2.35 a
4 L h−18.12 ± 1.21 a40.17 ± 1.89 a,b16.82 ± 1.24 a,b65.11 ± 5.12 a34.88 ± 2.65 a
E. moorcroftii12 L h−18.24 ± 1.28 b44.42 ± 5.42 a14.9 ± 2.85 a67.56 ± 6.87 a32.43 ± 3.18 a
8 L h−19.49 ± 1.56 b29.26 ± 3.48 b18.63 ± 2.47 a57.39 ± 6.49 b42.6 ± 3.25 a
4 L h−119.16 ± 2.36 a33.82 ± 3.87 a15.62 ± 2.34 a68.61 ± 6.98 a31.38 ± 2.98 a
Letters indicate significant differences (p < 0.05) among actors for each species.
Table 2. The ratio between the biomass of a specific root class against the biomass of the total root biomass (BG) in tree species (U. pumila, T. ramosissima and E. moorcroftii) grown with different irrigation regimes (12 L h−1, 8 L h−1 and 4 L h−1) (n = 5 ± SE). TRB = TapRoot Biomass; FRB = Fine Root Biomass; SRB = Small Root Biomass; MRB = Medium Root Biomass; LRB = Large Root Biomass; VLRB = Very Large Root Biomass.
Plant
Species
Treatments%, TRB/BG%, FRB/BG%, SRB/BG%, MRB/BG%, LRB/BG%, VLRB/BG
U. pumila12 L h−148.87 ± 4.03 a3.76 ± 1.14 a9.32 ± 1.59 a9.89 ± 1.64 a12.73 ± 1.54 a15.39 ± 2.25 a
8 L h−158.61 ± 4.65 a2.45 ± 1.08 ab8.53 ± 1.48 a,b8.32 ± 1.58 a9.18 ± 1.39 b16.1 ± 2.37 a
4 L h−153.67 ± 4.69 a1.47 ± 0.98 b6.39 ± 1.35 b10.99 ± 1.72 a11.06 ± 1.42 a16.38 ± 2.39 a
T. ramosissima12 L h−159.11 ± 4.12 b1.82 ± 01.08 ± 0.12 a,b4.15 ± 0.85 a16.93 ± 2.45 a25.13 ± 2.24 a,b
8 L h−163.76 ± 4.54 a,b-2.7 ± 0.01 a2.9 ± 0.02 a,b7.63 ± 1.11 b31.13 ± 2.35 a
4 L h−172.35 ± 5.51 a-0.28 ± 0.01 b2.11 ± 0.02 b12.54 ± 1.45 a14.19 ± 2.14 b
E. moorcroftii12 L h−163.22 ± 7.01 ab0.68 ± 0.01 b2.35 ± 1.01 b13.61 ± 1.25 a9.6 ± 2.11 b15.05 ± 2.14 a
8 L h−169.73 ± 6.52 a1.18 ± 0.02 b1.72 ± 0.98 b10.76 ± 1.12 a7.63 ± 1.85 b17.23 ± 2.16 a
4 L h−152.54 ± 6.12 b2.5 ± 0.02 a6.3 ± 1.25 a16.42 ± 1.36a13.25 ± 1.26 a13.42 ± 2.05 a
Letters indicate significant differences (p < 0.05) among actors for each species.
Table 3. Changes in soil chemical properties in different irrigation regimes (12 L h−1, 8 L h−1 and 4 L h−1) for U. pumila, T. ramosissima and E. moorcroftii values represent the mean of soil depth.
Plant
Species
TreatmentspHCaCO3Organic MatterEC2.5Nitrate-
Nitrogen
P2O5K2O
%%dS/mmg kg−1mg/100 g
U. pumila12 L h−18.14 ± 0.03 a4.25 ± 0.13 b1.27 ± 0.03 b0.109 ± 0.007 b0.66 ± 0.03 c4.39 ± 0.08 a9.2 ± 0.11 a
8 L h−18.09 ± 0.05 a7.28 ± 0.04 a,b1.32 ± 0.03 a,b0.138 ± 0.008 a,b3.18 ± 0.06 a1.08 ± 0.10 b8.0 ± 0.05 a
4 L h−18.42 ± 0.13 a9.67 ± 0.17 a1.41 ± 0.03 a0.241 ± 0.04 a1.35 ± 0.05 b1.66 ± 0.04 a,b7.4 ± 0.1 a
T. ramosissima12 L h−17.83 ± 0.03 a5.45 ± 0.02 b1.83 ± 0.06 a0.163 ± 0.005 a0.87 ± 0.05 c1.39 ± 0.04 a9.8 ± 0.39 a
8 L h−18.11 ± 0.05 a5.45 ± 0.12 b1.25 ± 0.07 c0.155 ± 0.02 b1.28 ± 0.03 b0.75 ± 0.07 a9.8 ± 0.60 a
4 L h−17.99 ± 0.05 a10.91 ± 0.05 a1.45 ± 0.02 b0.163 ± 0.005 a2.38 ± 0.03 a2.24 ± 0.11 a8.0 ± 0.20 a
E. moorcroftii12 L h−18.14 ± 0.02 a11.51 ± 0.28 a1.23 ± 0.05 a0.126 ± 0.01 a3.58 ± 0.07 b1.27 ± 0.03 a,b6.2 ± 0.03 b
8 L h−18.13 ± 0.08 a7.88 ± 0.01 a,b1.20 ± 0.05 a0.106 ± 0.01 a4.55 ± 0.12 c0.17 ± 0.01 b6.2 ± 0.23 b
4 L h−18.03 ± 0.08 a4.45 ± 0.24 b1.78 ± 0.06 a0.189 ± 0.01 a6.92 ± 0.10 a3.87 ± 0.03 a11.2 ± 0.39 a
Control-8.02 ± 0.0710.91 ± 0.201.49 ± 0.040.132 ± 0.022.85 ± 0.073.93 ± 0.1210.5 ± 0.65
Letters indicate significant differences (p < 0.05) among actors for each species.
Disclaimer/Publisher’s Note: The statements, opinions and data contained in all publications are solely those of the individual author(s) and contributor(s) and not of MDPI and/or the editor(s). MDPI and/or the editor(s) disclaim responsibility for any injury to people or property resulting from any ideas, methods, instructions or products referred to in the content.

