Article

Growth Responses to Climate and Drought in Relict Cork Oak Populations as a Benchmark of the Species Tolerance

by
J. Julio Camarero
1,*,
Antonio Gazol
1,
Cristina Valeriano
1,
Michele Colangelo
2 and
Álvaro Rubio-Cuadrado
1,3
1
Instituto Pirenaico de Ecología (IPE-CSIC), Avda. Montaña 1005, 50192 Zaragoza, Spain
2
Scuola di Scienze Agrarie, Forestali, Alimentari e Ambientali, Università della Basilicata, Viale dell’Ateneo Lucano 10, 85100 Potenza, Italy
3
Departamento de Sistemas y Recursos Naturales, Escuela Técnica Superior de Ingeniería de Montes, Forestal y del Medio Natural, Universidad Politécnica de Madrid, Ciudad Universitaria s/n, 28040 Madrid, Spain
*
Author to whom correspondence should be addressed.
Forests 2024, 15(1), 72; https://doi.org/10.3390/f15010072
Submission received: 14 December 2023 / Revised: 27 December 2023 / Accepted: 27 December 2023 / Published: 29 December 2023
(This article belongs to the Special Issue Tree Growth in Relation to Climate Change)

Abstract

:
We still lack information on the long-term growth responses to climate of relict tree populations, which often persist in topoclimatic refugia. To fill that research gap, we studied three relict cork oak (Quercus suber) populations located in northern Spain using dendrochronology. The sites were subjected to humid (Zarautz), continental (Bozoó) and xeric (Sestrica) climate conditions. Cool–wet conditions during the current spring enhanced growth in Bozoó and Sestrica, whereas wet conditions in the previous October enhanced growth in Zarautz. In this site, growth also increased in response to dry conditions in the prior winter linked to high North Atlantic Oscillation indices. Correlations between the precipitation summed from the previous September to the current May peaked at the driest site (Sestrica). The strongest growth responses to drought severity were also found at this site, where growth negatively responded to 9-month early-summer droughts, followed by the continental Bozoó site, where growth was constrained by 1-month July droughts. Growth declined in response to 6-month January droughts in the wettest site (Zarautz), where cork oak was vulnerable to previous late-summer to autumn drought stress. Despite warmer and drier spring conditions that would negatively impact cork oak at the Bozoó and Sestrica sites, trees from these populations could tolerate further aridity.

Graphical Abstract

1. Introduction

The Mediterranean Basin is a climate change hotspot subjected to increasingly warming conditions and ongoing aridification and an area where further warming and drying are forecasted [1,2]. In this region, forests have been used and managed by people for millennia to extract timber, charcoal, fodder, fruits and also cork from the cork oak (Quercus suber L.) bark [3]. However, climate warming may menace the persistence of some cork oak populations because hotter droughts lead to growth decline and increase mortality due to severe water deficits or greater pathogen incidence [4,5,6,7,8,9,10]. Furthermore, in addition to dieback and growth decline, climate change may result in a 20% decrease in cork production by the late 21st century [11]. Therefore, a better long-term assessment of climate impacts and growth responses to drought is needed for cork oak, given its wide distribution (ca. 2.5 million ha) and socio-economic and ecological relevance in the western Mediterranean basin.
The cork oak is an evergreen tree species with diffuse-porous wood widely distributed in areas with mild climate conditions characterized by acidic, often nutrient-poor soils, where it is usually managed for cork production [12]. Cork is stripped from the trunks of mature trees at intervals ranging from 8 to 14 years [12]. Cork oak provides multiple ecological services, such as enhancing biodiversity, promoting carbon sequestration, protecting soils from erosion and supplying economic (cork, wood, timber) and cultural services [3]. This oak responds to the typical Mediterranean summer drought through changes in several traits (leaf osmotic adjustments, rapid stomata closure, isohydric behavior, uptake of deep water sources, reduction in xylem vessel diameter), which make it a drought-avoiding species [13,14,15,16,17,18]. The drought-avoiding strategy of cork oak should help it to alleviate the negative impacts of severe water shortages on radial growth and reduce the risk of hydraulic failure through controlling stomatal conductance, tissue hydration, xylem embolism and root access to deep water sources [13,14,15,16,17,18,19]. Nevertheless, it may also succumb in response to severe, lasting droughts [5,20]. Declining trees have shown tissue dehydration and low water-use efficiency, suggesting poor resistance to severe droughts [21].
As in other Mediterranean oaks, growth decline in cork oak associated with canopy dieback and drought stress is reflected not only by lower radial growth rates (narrow tree rings) but also by reduced cork production (narrow cork rings) [22]. In cork oak, intra-annual radial growth peaks in late spring (June), shows minimum values in summer and winter (dormancy) and is constrained by dry conditions in the previous winter [22]. Therefore, dry conditions in the winter prior to tree-ring growth should induce lower growth rates, leading to higher adult mortality rates as drought stress intensifies [21,23]. Adult mortality is high in cork oak populations from xeric sites subjected to increasing aridity, albeit survival and growth also depend on stand density and pathogen incidence (e.g., Phytophthora cinnamomi Rands.) [24]. Consequently, a lower growth rate and higher growth responsiveness or sensitivity to climate stressors, including drought, could be expected in the most arid sites. According to studies based on cork oak seedlings, it was concluded that greater aboveground (root) development is expected in humid (xeric) sites [25,26]. Therefore, higher growth rates are expected in humid sites subjected to mild conditions (e.g., coastal sites), while sites subjected to continental conditions (e.g., inland sites) could be negatively impacted by low temperatures in winter and early spring.
Here, we compared the growth responses to climate variables (maximum and minimum temperatures, precipitation) and a drought index of three relict cork oak populations located in northern Spain using dendrochronology. Isolated, relict tree populations, often located in harsh sites, constitute ideal settings to assess growth sensitivity to climate and drought stress because they may have adapted to marginal site conditions through phenotypic plasticity and/or genotypic variation [27,28]. We compared three cork oak populations situated in a humid coastal site (Zarautz), a humid continental site (Bozoó) and a xeric continental site (Sestrica). We expected that the trees growing in the driest (wettest) sites would display the lowest (highest) growth rates and the highest (lowest) responsiveness (change in growth rate, correlation coefficient) to precipitation and drought, whereas trees growing in the coldest site would be more responsive to cold conditions in the early growing season (spring) when cambium resumption occurs [22].

2. Materials and Methods

2.1. Study Sites and Field Sampling
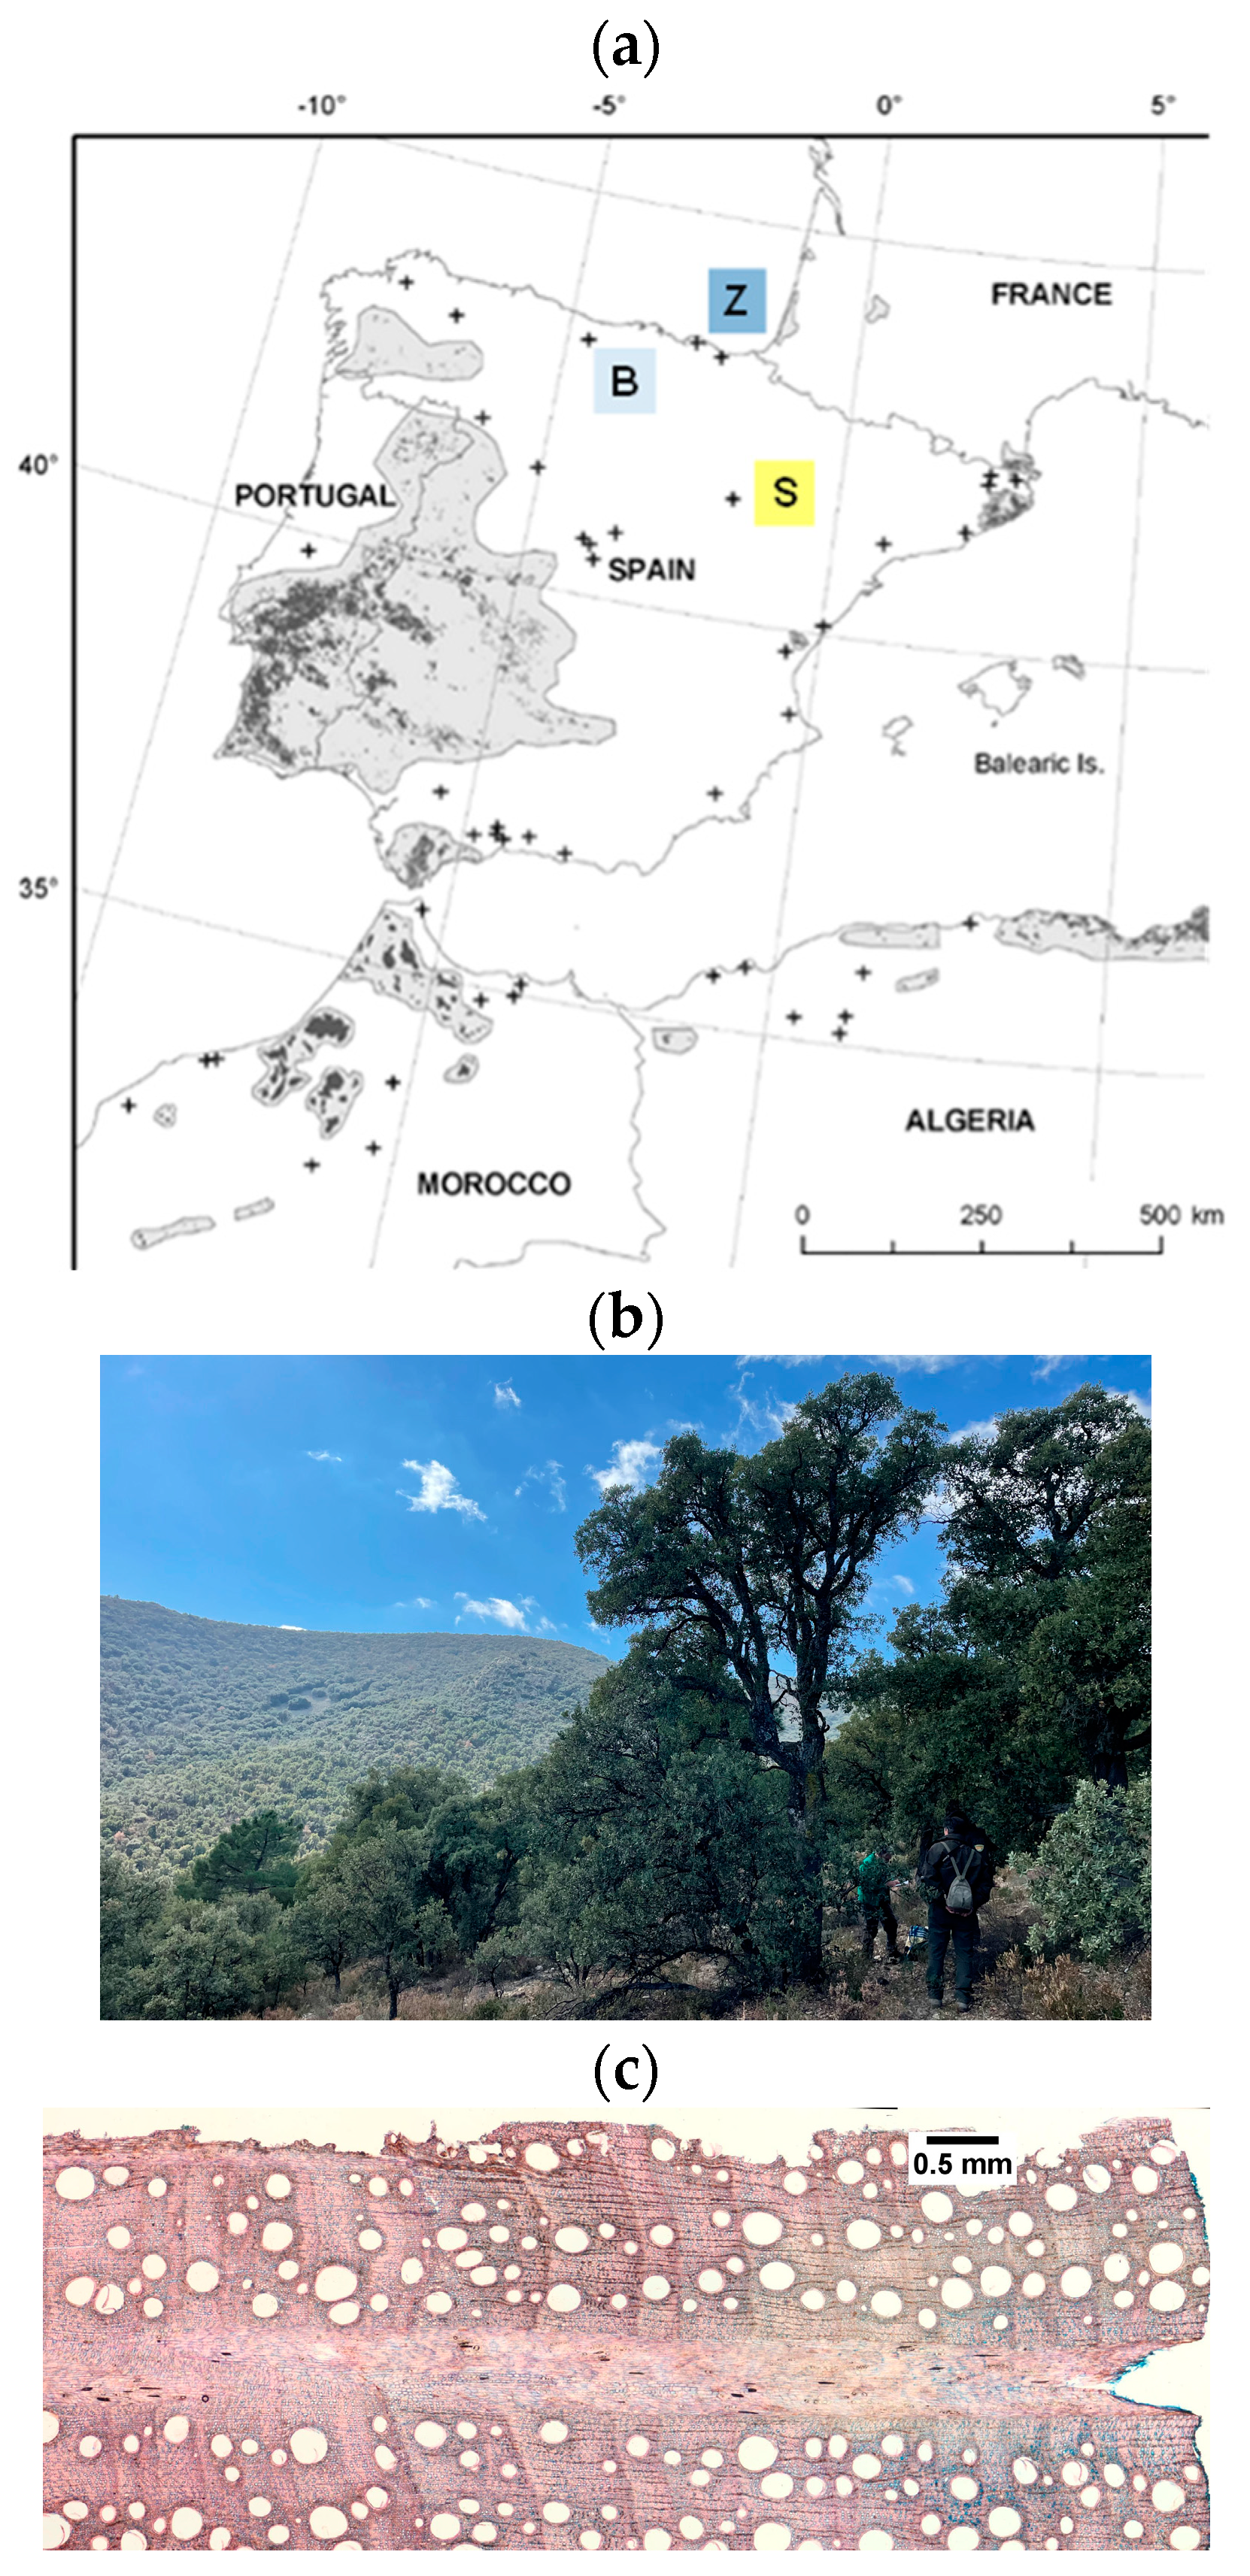
We selected three relict cork oak populations subjected to contrasting climatic conditions in northern Spain (Figure 1 and Figure 2, Table 1). In the three sites, the last debarking of trees to extract cork occurred at least 15–20 years before sampling. Therefore, the study sites were considered not to be managed for the past two decades. We measured the location and elevation of trees using a GPS with a 5 m resolution. We also recorded the mean slope and exposition of each site. The stand composition (main accompanying tree species in terms of relative basal area) was also characterized. The main tree species, in addition to cork oak, were holm oak (Quercus ilex L.) and maritime pine (Pinus pinaster Ait.).
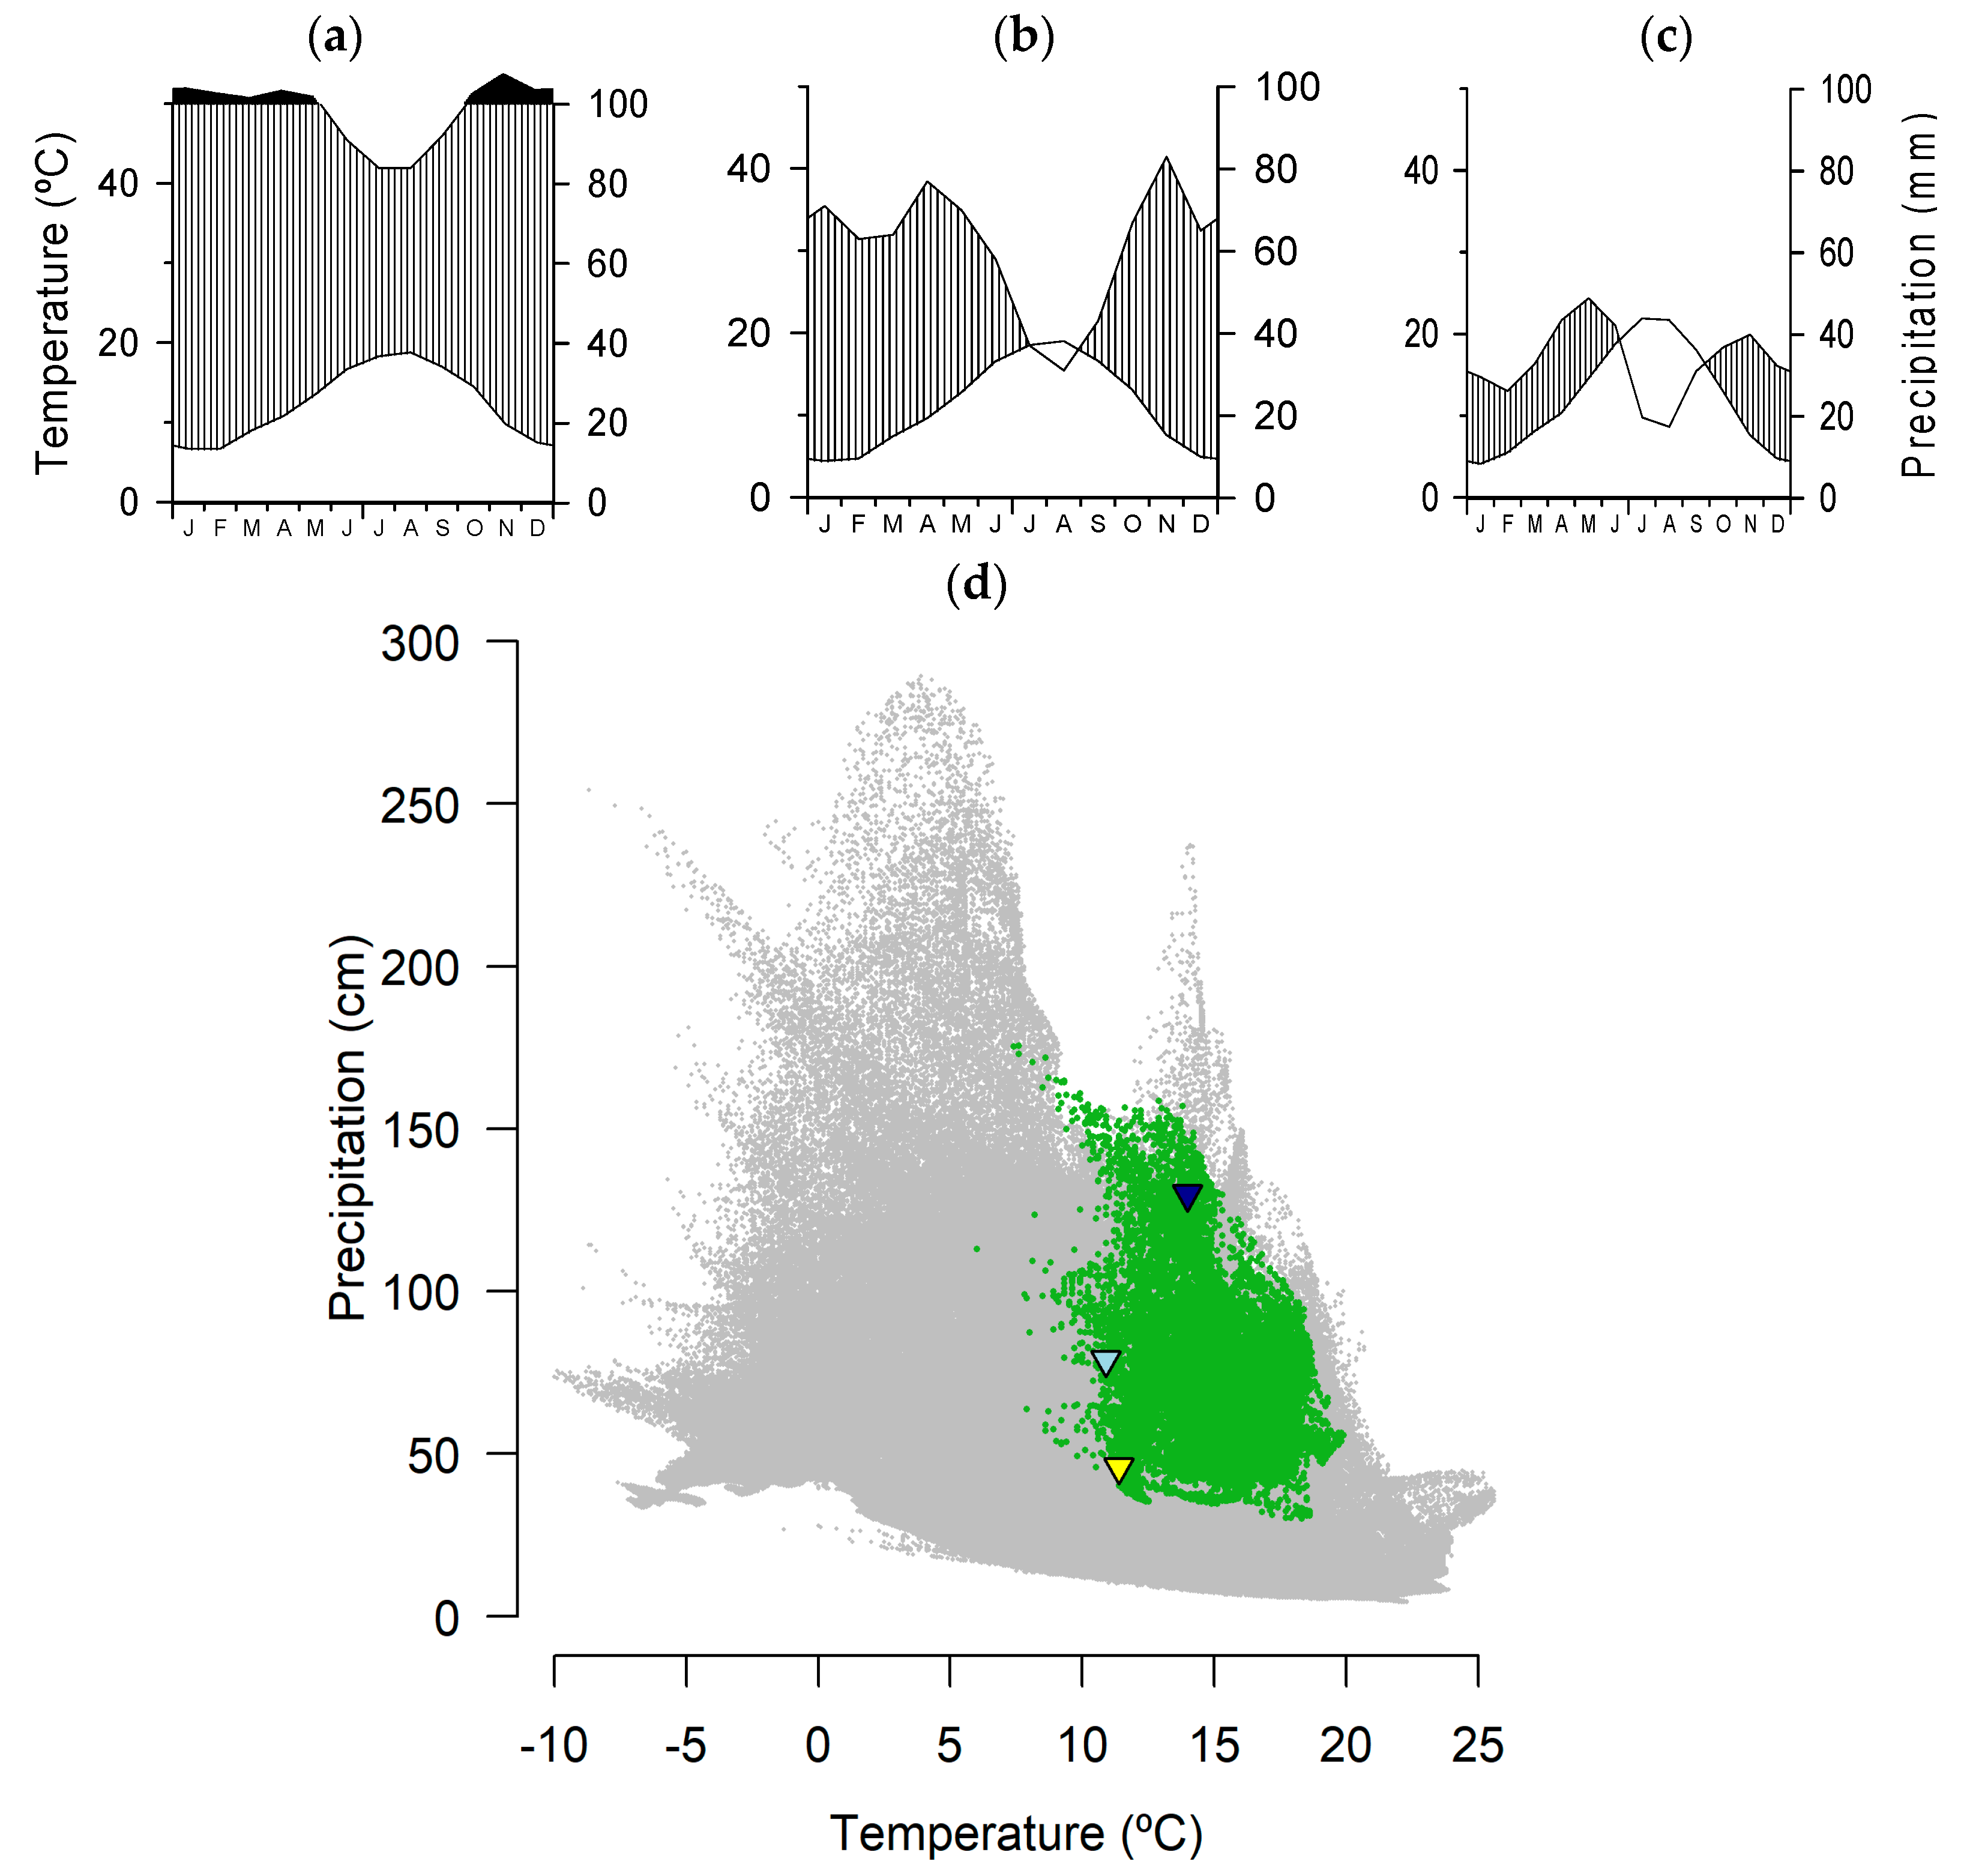
According to 0.1°-gridded climate data [29], Zarautz and Sestrica were the wettest and driest study sites, whereas Bozoó was the most continental site, showing the widest thermal range (Table 1). In all sites, soils were acidic and sandy, but soil rockiness was particularly notable in Sestrica. The Zarautz and Bozoó forests are public, but the Sestrica forest is private. The summer drought was evident in Bozoó and Sestrica.
Figure 1. (a) Distribution of cork oak (Q. suber) in the western Mediterranean Basin and locations of the three relict populations sampled in northern Spain (Z, Zarautz, dark blue square; B, Bozoó, light blue square; S, Sestrica, yellow square). Light gray is the species distribution; dark gray is the data from forest inventories; and crosses are isolated or relict populations. Modified from [30]. (b) View of sampled site in Sestrica. (c) Cross-section of a cork oak core sampled at the same site and showing annual rings.
Forests 15 00072 g001
Figure 2. Climate diagrams of the three study sites ((a) Zarautz, (b) Bozoó and (c) Sestrica) and (d) locations in the climatic space. In the lower plots, the grey and green dots show annual temperature and precipitation data for Europe (12° W–60° E, 32–72 °N) and for those dominated by cork oak, respectively. The study sites are represented using dark blue (Zarautz), light blue (Bozoó) and yellow (Sestrica) triangles.
Forests 15 00072 g002
Sampling was carried out in spring 2022. In each site, we selected 10 to 14 mature, apparently healthy cork oak trees for sampling across an area of ca. 2 ha. We measured their diameter at breast height (dbh) and total height using tapes and a laser rangefinder, respectively (Nikon Forestry Pro II, Nikon, Japan). Then, two cores per tree were taken at 1.3 m and perpendicular to the maximum slope using 5-mm Pressler increment borers (Haglöf, Långsele, Sweden). The mean basal area of cork oak was similar among sites, with values ranging from 12.2 (Sestrica) to 15.7 (Zarautz) m2 ha−1.

2.2. Climate Data and Drought Index

To avoid problems with heterogeneity or missing values, we obtained 0.1°-gridded monthly climate (maximum and minimum temperatures, total precipitation) data from the European E-OBS v. 28.0e dataset [30]. To measure drought severity, we used the standardized precipitation-evapotranspiration index (SPEI) for the period 1970–2021. The SPEI is a standardized multi-scalar drought index based on the accumulated water deficit, calculated as differences between precipitation and potential evapotranspiration, with negative (positive) values indicating dry (wet) conditions [31]. We used weekly SPEI data and considered 1- (SPEI 1), 3- (SPEI 3), 6- (SPEI 6) and 9-month (SPEI 9) SPEI temporal resolutions. These data were downloaded at a 1.1 km2 spatial resolution from the Spanish SPEI dataset [32]. For the analyses performed with daily climate, the 5 km grid calculated by the Spanish Meteorological Agency (AEMET) from more than 3200 and 1800 precipitation and temperature local stations, respectively, located in Spain, was used (https://www.aemet.es/es/serviciosclimaticos/cambio_climat/datos_diarios?w=2, accessed on 11 June 2023).
To characterize the climatic marginality of the study relict populations, we first obtained distribution data of the species in Europe, considering the area encompassed by coordinates 12° W–60° E and 32–72° N [33]. Then, two relevant climatic variables (mean annual temperature, total precipitation) were downloaded at 1-km2 spatial resolution from the Worldclim database, considering the period 1970–2000 [34]. Finally, the raster R package was used to select the 1-km2 grids where cork oak was present [35]. The three sites occupied marginal locations within the cork oak climatic distribution space in Europe, with the Zarautz and Sestrica sites corresponding to the wettest and driest locations, respectively (Figure 2d).

2.3. Processing Wood Samples and Tree-Ring Width Data

Cores were air-dried in the laboratory. Then, they were glued onto wooden mounts and sanded until tree rings were clearly visible [36]. All samples were visually cross-dated, and tree-ring width was measured with a 0.001 mm resolution using scanned images (EPSON 10,000 XL, Nagano, Japan) obtained at 2400 dpi resolution. Ring widths were measured and cross-dated using the CooRecorder and CDendro software v. 9.3.1 [37]. The quality of cross-dating was checked using the COFECHA software, which calculates moving correlations between individual series of ring width values and the mean site chronologies [38]. In some trees, particularly those most difficult to cross-date, thin (15–25 μm) wood cross-sections were prepared to help with their accurate cross-dating (Figure 1c). Wood cross-sections were obtained by using a sledge microtome, and the resulting samples were stained using safranin [39]. The estimation of tree age was based on cores taken at a height of 1.3 m and reaching the pith.
Individual tree-ring width series were detrended using negative linear or exponential functions. The resulting ring width indices were pre-whitened by fitting an autoregressive model and removing the first-order autocorrelation. A bi-weight robust mean was used to calculate the mean site residual (pre-whitened) series or chronologies of ring width indices. Then, to describe ring width data and chronologies, several dendrochronological statistics were calculated [40]: the mean tree-ring width and its first-order autocorrelation, a measure of year-to-year growth persistence, the mean sensitivity, which measures relative changes in standardized (not pre-whitened) ring width indices, and the mean correlation among the series of pre-whitened ring width indices (rbar). These analyses were carried out using the dplR package [41]. We also calculated the Expressed Population Signal (EPS) of indexed ring width site series to assess their internal coherence and replication [42].

2.4. Statistical Analyses

Comparisons between sites of tree size (dbh, height) and tree-ring statistics (ring width, first-order autocorrelation, mean sensitivity) were performed using Mann–Whitney tests. Pearson correlations were used to assess relationships between growth indices, climate variables and the SPEI drought index. Correlations with monthly climate variables were calculated from September of the previous year up to September of the growth year. Correlations were also calculated with the summed precipitation from the previous September until the current May, which accounts for most of the precipitation of the hydrological year. In this case, slopes were used as a measure of responsiveness to climate, and they were compared among sites using ANCOVAs. A similar analysis was carried out by relating estimated tree age and mean tree-ring width.
Correlations between weekly SPEI data and ring width indices were calculated from January to November, when most of the annual ring was already formed. Relationships between pre-whitened series of ring width and climate variables or drought indices were assessed using the R package treeclim [43].
Since the winter climate conditions over northern Spain are tightly coupled with the North Atlantic Oscillation (NAO), moving correlations between the NAO index of the previous November and ring width indices were calculated using 20-year intervals shifted year by year. The NAO variability is related to shifts in the position of the Iceland low-pressure and Azores high-pressure systems linked to changes in the direction and strength of the westerlies [44]. High (low) NAO values in late autumn and winter are related to low (high) precipitation over most of the northern Iberian Peninsula [45]. Therefore, if relationships between winter precipitation and ring width indices are negative (positive), we would expect correlations with NAO indices to be positive (negative).
Radial growth is a continuous process that is not limited by monthly boundaries. Furthermore, the study of growth–climate relationships can give very different results depending on whether continuous periods of time are used or whether the climate of each month is analyzed separately [46]. To address this issue, we calculated, for each climatic variable, the time period in which the growth–climate relationship is maximal (best climate window) using the R package climwin [47,48], which offers important advantages in the field of dendroecology [46]. To select the best climatic window based on daily climate data, all possible linear and quadratic models relating a series of ring width indices and the climate variable are first fitted. In each model, a different climate window is tested. Then, the model that minimizes the corrected Akaike Information Criterion (AICc) is chosen [49]. The mean and sum of temperatures and precipitation, respectively, in each time window considered were used as the aggregate statistics. The large numbers of models that are fitted to test all possible climatic windows increase the possibility of obtaining models with low AICc by chance. To solve this problem, randomization tests were performed with 1000 replications to obtain a probability value (p AICc), which determines the likelihood that the AICc value of the selected model has occurred by chance [47,48]. All statistical analyses were performed within the R software [50].

3. Results

3.1. Growth Patterns and Variability

The smallest trees were sampled in the continental Bozoó site, whereas the largest trees were sampled in the humid Zarautz site (Table 1 and Table 2). The estimated age ranged between 54 and 65 years. The mean ring width was the highest in Zarautz (2.27 mm) and lowest in Bozoó (1.14 mm) (Figure 3), while mean sensitivity was highest in Sestrica (0.45) as well as rbar (0.70) (Table 2). The highest first-order autocorrelation (0.74) corresponded to Bozoó. The common, best-replicated period was 1967–2021, albeit EPS values were below the 0.85 threshold, which is usually considered to define well-replicated and coherent chronologies. There were negative relationships between tree age and mean ring width, which were significant (p < 0.05) in all sites except Bozoó (Figure S1).
Both the Bozoó and Sestrica series of tree-ring widths showed significant (p < 0.001) negative trends (r = −0.92 and r = −0.78, respectively; Figure 3a). This growth decline is a common ontogenetic pattern that does not correspond to a loss in tree vigor (dieback). No significant correlation was found between the site series of ring width indices, indicating they did not share common regional climate signals (Figure 3b).

3.2. Relationships between Climate Variables, Drought and Growth Indices

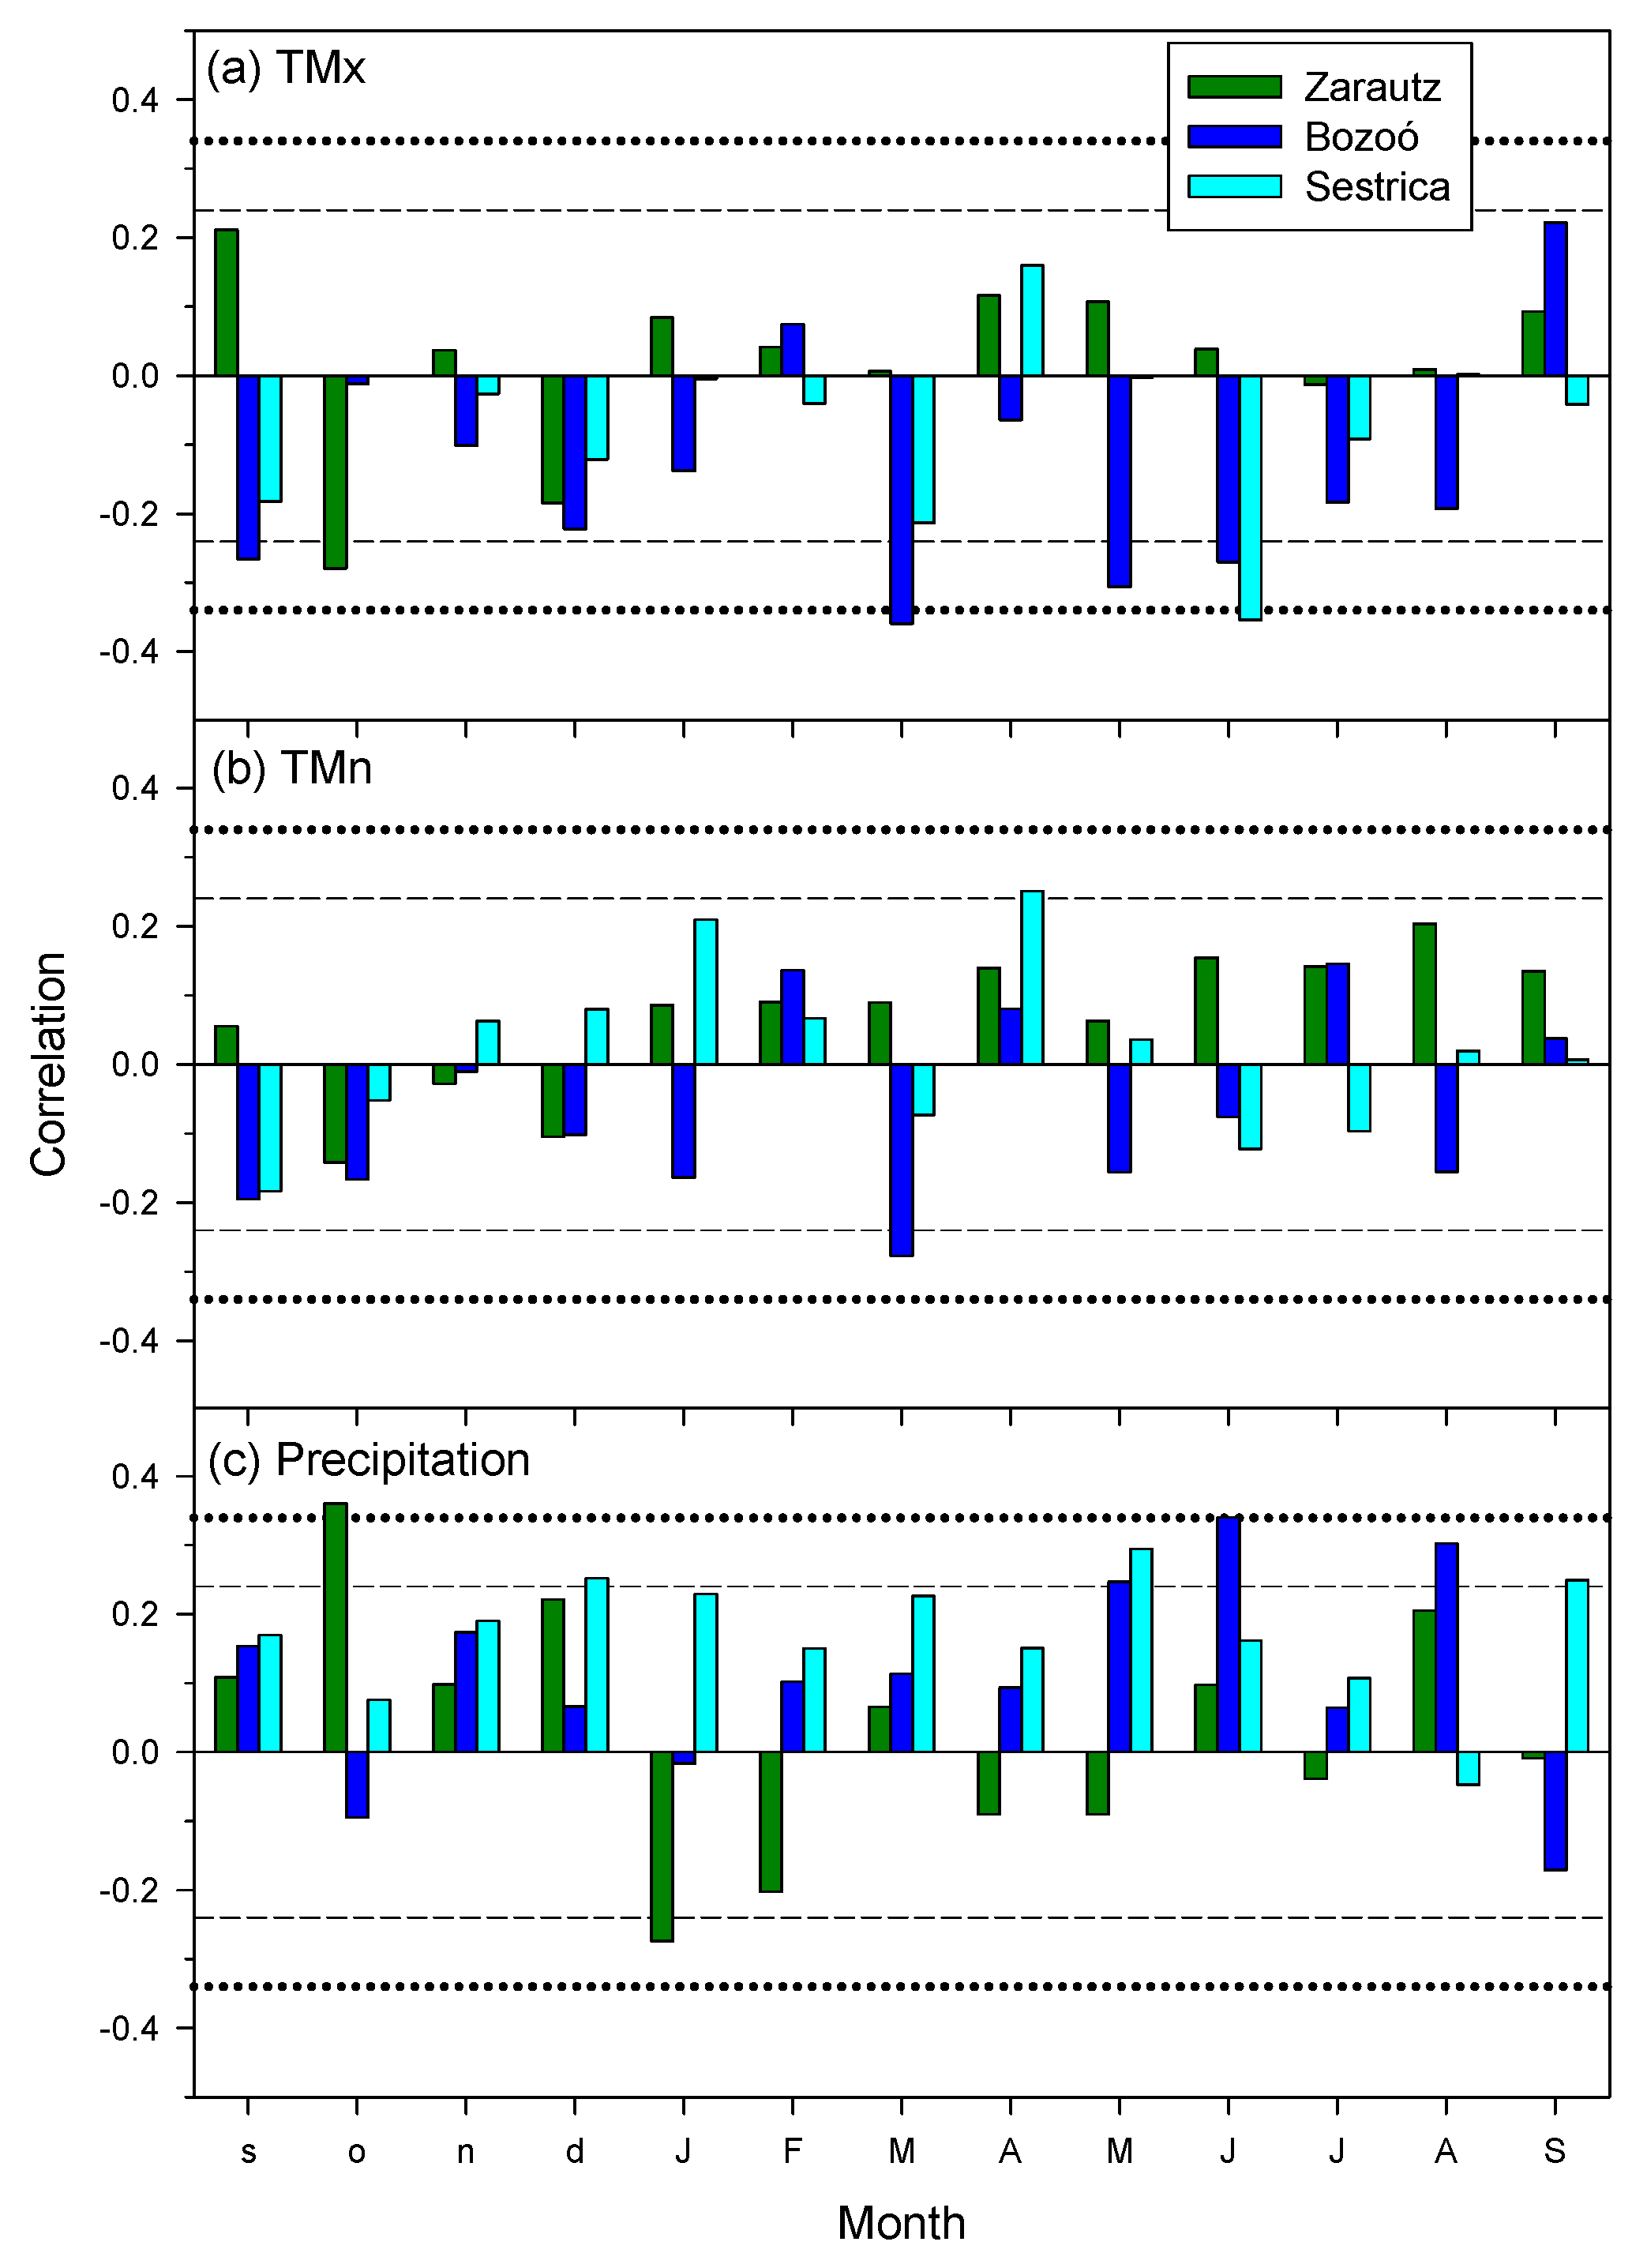
The correlations between climate variables and ring width indices showed that cork oak growth was constrained by warm and dry spring and early summer conditions in Bozoó and Sestrica (Figure 4). In Zarautz, cool and wet conditions in the previous October enhanced growth. In Sestrica, high minimum temperatures in April and elevated precipitation in the prior winter, spring and current September improved growth. However, some relationships with precipitation were of the opposite sign in Zarautz, where elevated precipitation in January reduced growth indices. This was related to the positive correlation found between ring width and the NAO indices of the previous year (r = 0.43, p = 0.001) in Zarautz (Figure S2). This association weakened in the 2010s–2020s.
The correlations between the precipitation summed from the previous September to the current May and the series of ring width indices yielded the highest coefficients and were positive and significant at the driest Bozoó and Sestrica sites (Figure 5). Cumulative precipitation explained 12% and 30% of the variability of ring width indices in Bozoó and Sestrica, respectively. The slope was significantly higher (F = 4.43, p = 0.038) in Sestrica than in Bozoó.
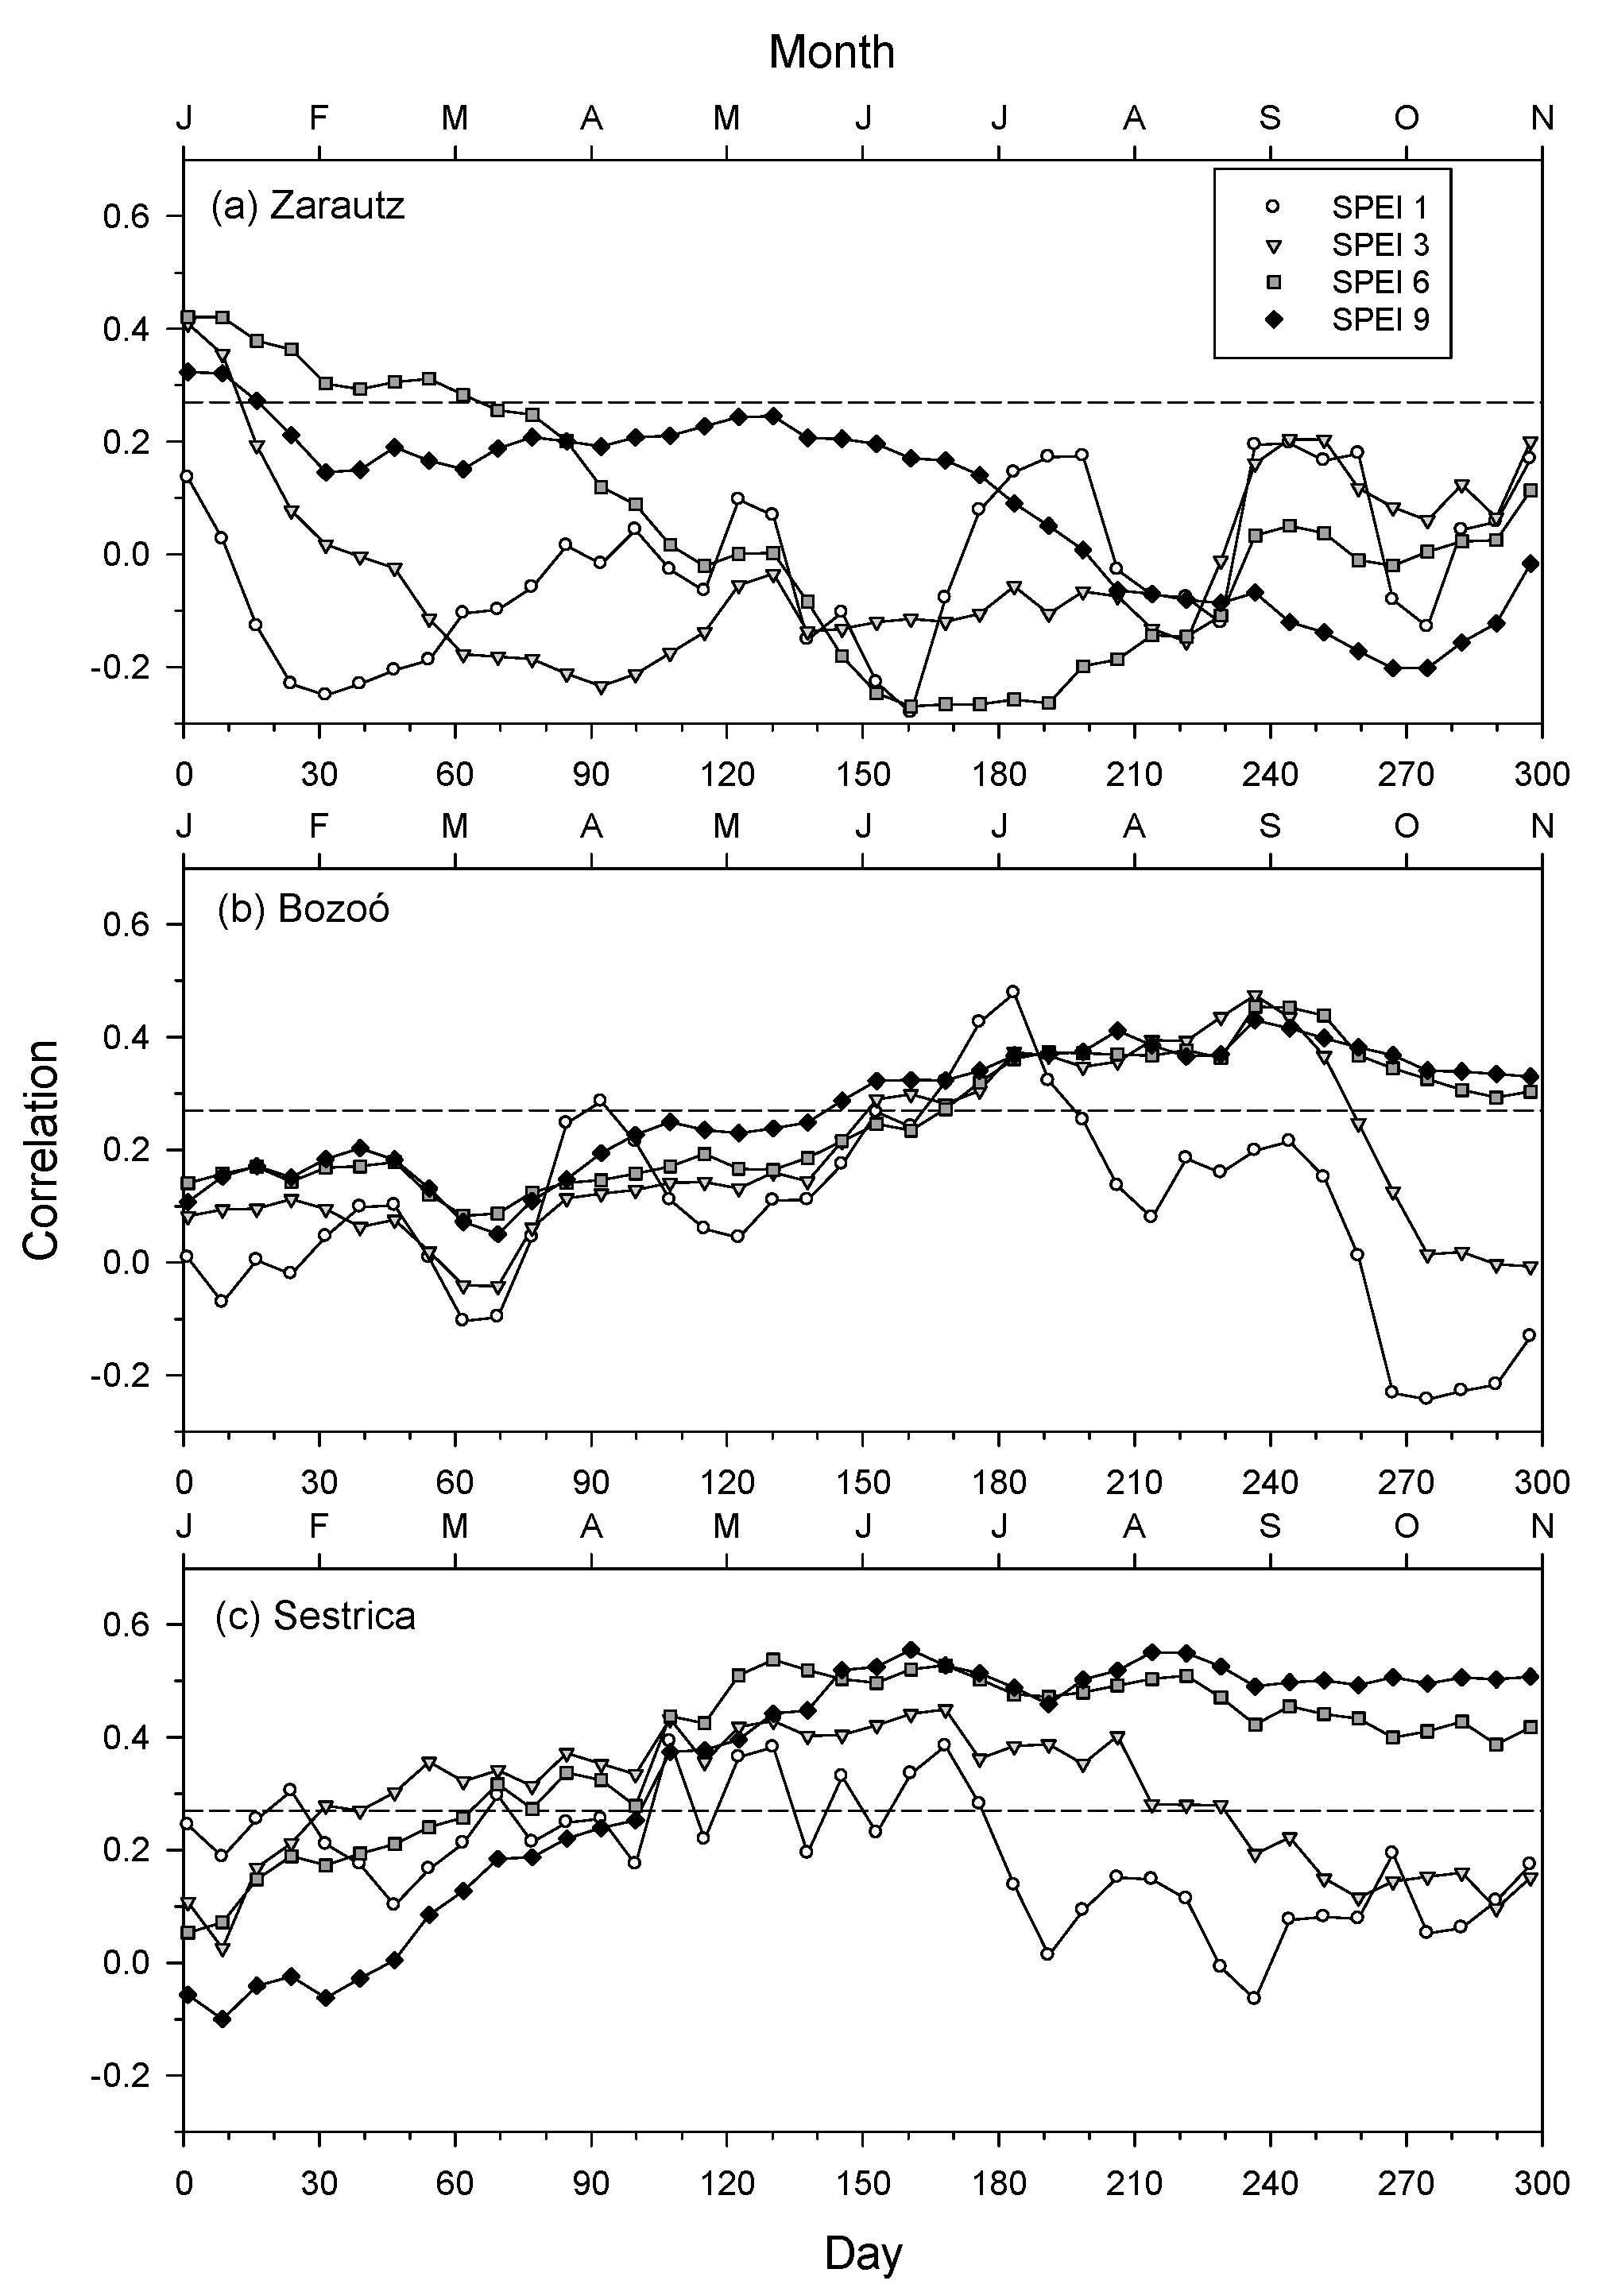
The highest correlation coefficient found between the values of the SPEI drought index and ring width indices (r = 0.56, p < 0.001) corresponded to early June considering 9-month-long SPEI scales, and it was found in the driest Sestrica site (Figure 6).
The continental Bozoó site presented the second highest correlation (r = 0.48, p = 0.0003) in early July for 1-month-long SPEI values. In Sestrica and Bozoó, 6-month SPEI values also showed strong positive correlations with cork oak ring width indices. Finally, in the wettest Zarautz site, the highest correlation (r = 0.42, p = 0.0019) was found in early January for 6-month-long SPEI values.

3.3. Analyses of Climate–Growth Relationships Based on Climwin

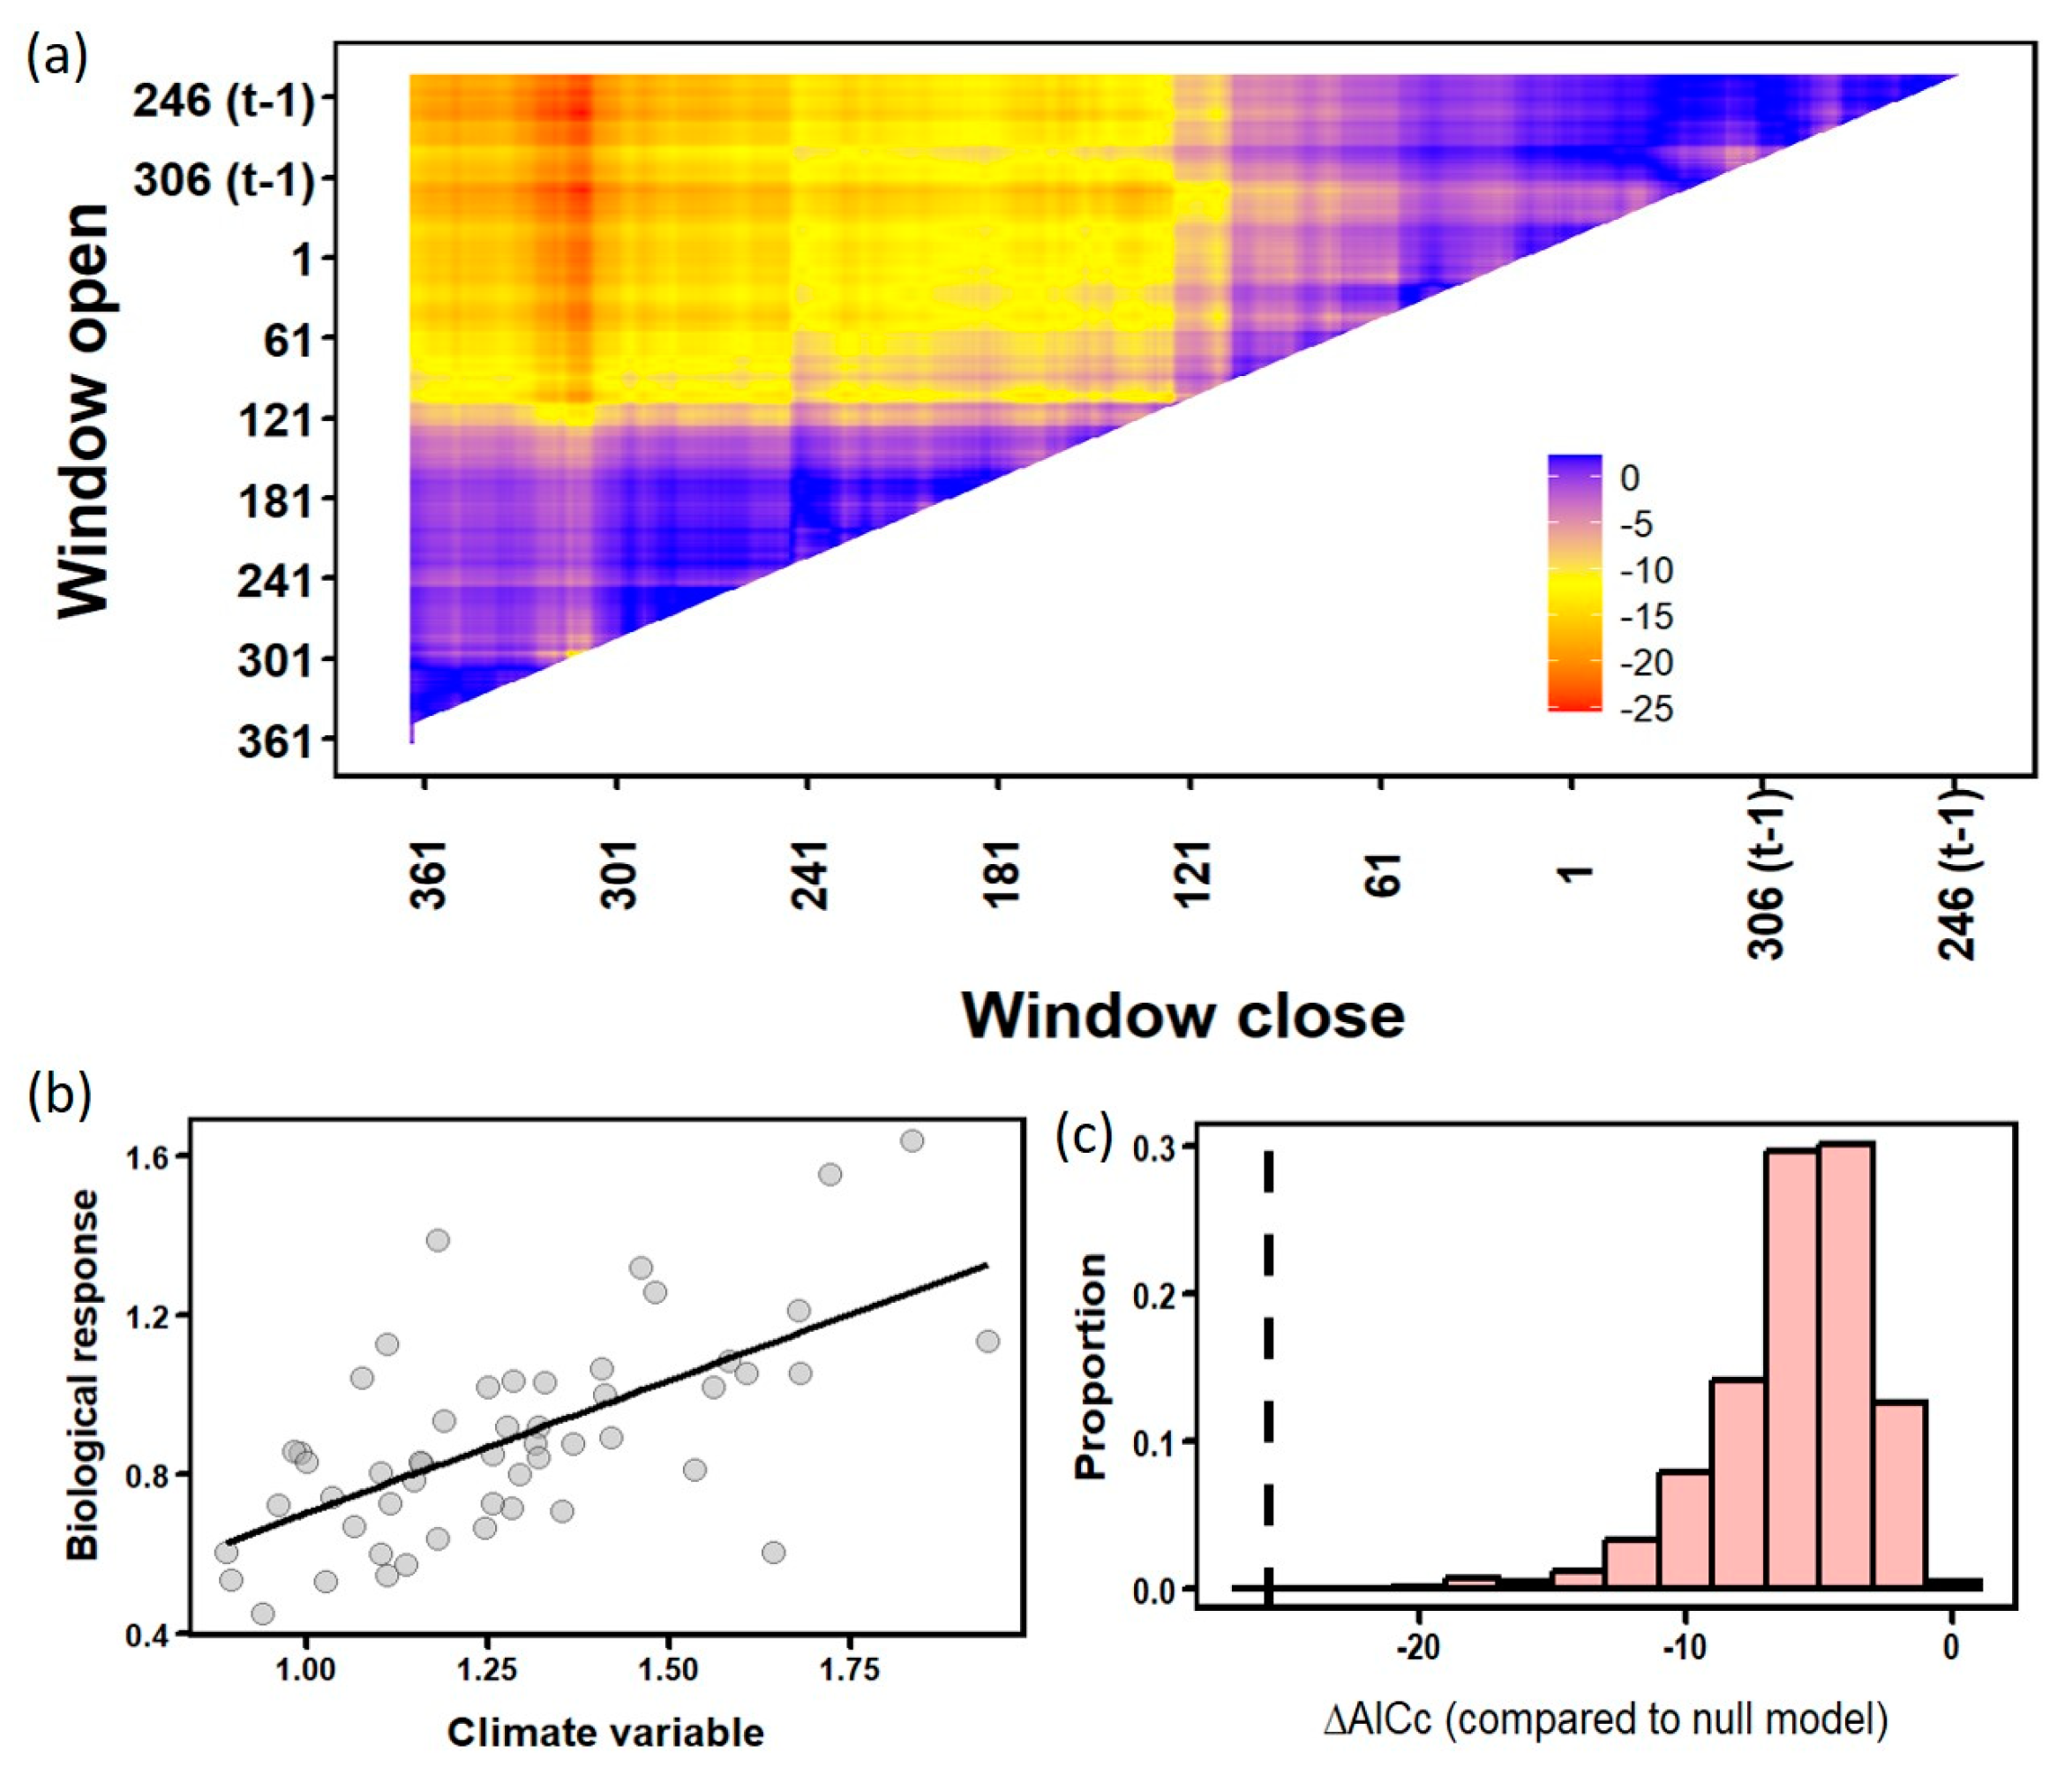
Regarding climwin analyses, the highest coefficient of determination (R2) was found for precipitation in Sestrica, which explained 41% of the variability of ring width indices (Table 3). In this case, precipitation had a positive effect, followed by a linear relationship, and its impact on growth indices spanned from previous September until current November (Figure 7). Precipitation showed similar impacts on growth indices in Zarautz and Bozoó, where it explained 34% and 21% of the growth indices variability, respectively, but along different temporal windows, previous September–October and current June–August, in that order. The relationships between growth indices and precipitation were mostly linear, but nonlinear models also showed good fits (Figure S3). Maximum temperatures showed negative correlations with the ring width indices, explaining from 13% (Sestrica) to 22% (Zarautz) of growth variability, but with very different temporal windows (Zarautz, September–October; Bozoó, March; Sestrica, June; see Figure 4). Lastly, minimum temperature exerted a negative effect on growth in Bozoó, explaining 20% of the variability and corresponding to January temperature values. In the other sites, the influences of minimum temperature on growth indices were positive, explaining 12% and 14% of growth variability in Zarautz and Sestrica, respectively, and peaking the correlations in August and April, correspondingly. In any case, the relationships between temperature and growth were not significant, according to randomization tests.

4. Discussion

As expected, the cork oaks from the driest site (Sestrica) showed the highest responsiveness (correlation coefficient, precipitation–growth slope) to spring–summer drought, but the lowest growth rates were found in the continental site (Bozoó), indicating that cork oak growth was particularly constrained by cold spring conditions at that site. Unexpectedly, we also found that cork oak growth in the wettest site (Zarautz) was limited by low precipitation in the previous autumn, suggesting a marked sensitivity to late-summer drought stress. In addition, elevated precipitation in the previous winter also reduced growth in this humid site, indicating a negative influence of cloudy and rainy conditions on spring growth through lagged effects. The highest sensitivity of radial growth to water shortage in the driest site could have been exacerbated by its steep slopes and E aspect.
From a methodological point of view, we have to emphasize that applying dendrochronology to cork oak is challenging because annual rings are hard to distinguish, cross-date and measure. Nevertheless, we were able to develop robust tree-ring chronologies with the help of anatomical cross-sections developed at some sites. The continentality of some sites (e.g., Bozoó) and the marked and long summer drought of others (e.g., Sestrica) contributed to a clear seasonality and the formation of annual growth rings. This would explain the lowest coherence statistics (rbar, EPS) found in the mesic Zarautz site, located near the Atlantic coast and subjected to temperate conditions.
There have been a few studies on climate–growth relationships in cork oak, particularly in southern Portugal, i.e., in the distribution core area [51,52,53]. They also found that cork oak growth was enhanced by higher cumulative precipitation from the previous autumn until early spring [52]. These authors also found a positive effect of warmer September conditions on growth [52], a correlation similar to that found with maximum temperatures in the continental Bozoó site, albeit it was not significant in our case. In addition, a positive effect of warmer spring temperatures (as we found in Bozoó) and a negative effect of summer maximum temperatures (as we found in Bozoó and Sestrica) were reported on growth [51]. These thermal influences may be explained by a higher cambial activity in spring triggered by warmer night conditions and a higher evapotranspiration rate induced by warmer day conditions in summer, making cork oak trees more dependent on deeper soil water sources and reducing their photosynthesis rates and meristem activity [14,15,16,19]. Overall, these studies and our findings support the importance of soil water recharge during autumn and winter prior to the start of the growing season. Such an effect has already been noted in several Mediterranean conifers and could explain the different temporal scales of SPEI-growth correlations [54].
Cork oak is a drought-avoiding species that reduces leaf conductance to water vapor through efficient stomatal control of transpiration [55]. This isohydric strategy is maintained during the dry Mediterranean summer through the uptake of deep underground water, despite radial growth rates being very low in summer [14,15,16,22]. In this study, cork oak growth was notably constrained by 9-month and 1-month-long droughts ending in June (i.e., dry conditions from prior October to current June) or July (i.e., dry conditions from current June to July) in the Sestrica and Bozoó sites, respectively. This agrees with the growth sensitivity of cork oak to spring–summer precipitation observed in these two sites, particularly in Sestrica, where the highest R2 value (0.41) was found for precipitation in the selected climwin models. The contrasting growth responses to different timings and durations of drought also suggest different growth phenologies, with a more delayed growth onset in Bozoó. This idea could be tested through xylogenesis analyses and/or using dendrometers. In Zarautz, growth responded to 6-month-long SPEI values in January (i.e., dry conditions from prior August to current January), indicating that late-summer drought stress in the previous year could constrain cork oak growth in this site through legacy effects (e.g., carbohydrate consumption due to warm conditions and high respiration rates, fine root and bud formation, etc.). In this wet site, the positive correlation of ring width indices with prior November NAO indices is explained because of the negative association between growth indices and the January precipitation. Such a negative relationship could be caused by wet, cloudy winter conditions reducing photosynthetic rates and leading to lower growth rates in spring.
Cork oak radial growth may also be reduced by cork extraction, which can intensify the negative impact of droughts on cork oak [52,53,56,57], but we discarded this effect by selecting stands that have not been subjected to cork harvesting during the past two decades. Furthermore, cork oak growth positively depends on tree basal area and tree diameter [53], which could partially explain the lowest growth rates found in Bozoó, where the trees with the smallest diameter were also sampled. Tree-to-tree competition could also modulate cork oak growth responses to climate, particularly precipitation, but the sampled stands were usually open forests, and the basal area was similar. Masting could also influence cork oak growth responses to climate, but long series of acorn production are not available for the study sites.
Our findings have profound implications for the management and conservation of the studied relict cork oak populations. These forests persist in topoclimatic refugia as isolated populations within adverse regional climate conditions under drought (Sestrica) or cold (Bozoó) stress. In addition to evolutionary factors leading to genetic differences among populations, which we did not analyze, contrasting growth responses to climate may represent key mechanisms implied in population persistence [58]. For instance, the highest responsiveness to spring–summer drought in the driest site (Sestrica) indicates a remarkable capacity to tolerate water shortage, whereas the negative response to prior winter precipitation in the wettest site (Zarautz) may correspond to a reduction in carbohydrate formation due to cloudy–rainy conditions. Nevertheless, the Zarautz site is the most sensitive to drier conditions in the prior autumn, which could lead to growth decline even in such mesic conditions. Lastly, in the most continental Bozoó site, forecasted warmer spring conditions would enhance tree growth more than in the other sites. If this site is considered the “winner” in response to projected and ongoing climate warming, Sestrica could be regarded as the “loser” if further aridity in spring and summer leads to growth decline and dieback once a drought tolerance threshold is surpassed. Nevertheless, no recent dieback episode has been observed at the Sestrica site, to the best of our knowledge, indicating that this population is a valuable genetic source for assisted migration of cork oak under more arid conditions. Finally, the cork oaks at the wettest Zarautz site could also be negatively impacted by hotter droughts in late summer and autumn.

5. Conclusions

The study of the three relict cork oak populations in northern Spain evidenced the plastic and contrasting climate–growth relationships observed under different topoclimatic conditions. Relict tree populations persist in topographic and climatic refugia and may have developed adaptations to withstand climatic stressors. Cork oak growth was severely limited by cold spring conditions in the continental site (Bozoó) and by spring–summer warm–dry conditions during the growing season in that site and also in the xeric site (Sestrica). In contrast, growth was limited by prior autumn droughts and wet winters in the humid site (Zarautz), subjected to more oceanic influence, including cloudier winter–spring conditions. If climate keeps warming and drying, the persistence of the relict cork oak populations located in the continental and xeric sites may be threatened. However, these stands have not shown recent symptoms of crown dieback or increased mortality despite recent hotter droughts in the past four decades. Therefore, trees from isolated relict stands under drought stress, such as those in Sestrica, represent valuable genetic pools for assisted migration under forecasted more arid conditions.

Supplementary Materials

The following supporting information can be downloaded at: https://www.mdpi.com/article/10.3390/f15010072/s1, Figure S1: Associations found between tree age and mean growth rate; Figure S2: Series of ring width indices from Zarautz and the previous November NAO index; Figure S3: Quadratic relationships observed between precipitation (standardized climate variable) and cork oak series of ring width indices (biological response).

Author Contributions

Conceptualization, J.J.C. and A.G.; methodology, J.J.C., A.G., C.V., M.C. and Á.R.-C.; software, J.J.C., A.G., C.V. and Á.R.-C.; validation, J.J.C. and A.G.; formal analysis, J.J.C., Á.R.-C. and A.G.; investigation, J.J.C.; resources, J.J.C.; data curation, J.J.C.; writing—original draft preparation, J.J.C.; writing—review and editing, J.J.C., A.G., C.V., M.C. and Á.R.-C.; visualization, J.J.C.; supervision, J.J.C.; project administration, J.J.C.; funding acquisition, J.J.C. and A.G. All authors have read and agreed to the published version of the manuscript.

Funding

This research was funded by the Spanish Ministry of Science and Innovation, grants numbers PID2021-123675OB-C43 and TED2021-129770B-C21. ARC acknowledges support from the Margarita Salas postdoctoral fellowship (reference RCMS-22-G1T6IW-17-NLHJ80) of the Universidad Politécnica de Madrid.

Data Availability Statement

Data are available on request to the first author.

Acknowledgments

We thank Roberto del Val for his help during field sampling in Sestrica.

Conflicts of Interest

The authors declare no conflicts of interest.

References

  1. Giorgi, F.; Lionello, P. Climate change projections for the Mediterranean region. Glob. Planet. Chang. 2008, 63, 90–104. [Google Scholar] [CrossRef]
  2. Lionello, P.; Scarascia, L. The relation between climate change in the Mediterranean region and global warming. Reg. Environ. Chang. 2018, 18, 1481–1493. [Google Scholar] [CrossRef]
  3. Aronson, J.; Pereira, J.S.; Pausas, J.G. (Eds.) Cork Oak Woodlands on the Edge: Ecology, Adaptive Management, and Restoration; Island Press: Washington, DC, USA, 2009. [Google Scholar]
  4. Brasier, C.M. Oak tree mortality in Iberia. Nature 1992, 360, 539. [Google Scholar] [CrossRef]
  5. David, T.S.; Cabral, M.T.; Sardinha, R. A mortalidade dos sobreiros e a seca. Finisterra 1992, 27, 17–24. [Google Scholar]
  6. Costa, A.; Pereira, H.; Madeira, M. Analysis of spatial patterns of oak decline in cork oak woodlands in Mediterranean conditions. Ann. For. Sci. 2010, 67, 204. [Google Scholar] [CrossRef]
  7. Gentilesca, T.; Camarero, J.J.; Colangelo, M.; Nolè, A.; Ripullone, F. Drought-induced oak decline in the western mediterranean region: An overview on current evidences, mechanisms and management options to improve forest resilience. iForest-Biogeosci. For. 2017, 10, 796–806. [Google Scholar] [CrossRef]
  8. Sánchez-Cuesta, R.; Ruiz-Gómez, F.J.; Duque-Lazo, J.; González-Moreno, P.; Navarro-Cerrillo, R.M. The environmental drivers influencing spatio-temporal dynamics of oak defoliation and mortality in dehesas of Southern Spain. For. Ecol. Manag. 2021, 485, 118946. [Google Scholar] [CrossRef]
  9. Sánchez-González, M.; Beltrán, R.S.; Lanzo Palacios, R.; Prades, C. Analysis of cork quality and cork tree health in stands of western Spain. For. Ecol. Manag. 2023, 539, 121012. [Google Scholar] [CrossRef]
  10. Touhami, I.; Chirino, E.; Aouinti, H.; Khorchani, A.E.; Elaieb, M.T.; Khaldi, A.; Nasr, Z. Decline and dieback of cork oak (Quercus suber L.) forests in the Mediterranean basin: A case study of Kroumirie, Northwest Tunisia. J. For. Res. 2020, 31, 1461–1477. [Google Scholar] [CrossRef]
  11. Palma, J.H.N.; Paulo, J.A.; Faias, S.P.; Garcia-Gonzalo, J.; Borges, J.G.; Tomé, M. Adaptive management and debarking schedule optimization of Quercus suber L. stands under climate change: Case study in Chamusca, Portugal. Reg. Environ. Ch. 2015, 15, 1569–1580. [Google Scholar] [CrossRef]
  12. Pereira, H. Cork: Biology, Production and Uses; Elsevier: Amsterdam, The Netherlands, 2007. [Google Scholar]
  13. Aranda, I.; Castro, L.; Pardos, M.; Gil, L.; Pardos, J.A. Effects of the interaction between drought and shade on water relations, gas exchange and morphological traits in cork oak (Quercus suber L.) seedlings. For. Ecol. Manag. 2005, 210, 117–129. [Google Scholar] [CrossRef]
  14. David, T.S.; Henriques, M.O.; Kurz-Besson, C.; Nunes, J.; Valente, F.; Vaz, M.; Pereira, J.S.; Siegwolf, R.; Chaves, M.M.; Gazarini, L.C.; et al. Water-use strategies in two co-occurring Mediterranean evergreen oaks: Surviving the summer drought. Tree Physiol. 2007, 27, 793–803. [Google Scholar] [CrossRef] [PubMed]
  15. Kurz-Besson, C.; Otieno, D.; Lobo do Vale, R.; Siegwolf, R.; Schmidt, M.; Herd, A.; Nogueira, C.; David, T.S.; David, J.S.; Tenhunen, J.; et al. Hydraulic lift in cork oak trees in a savannah-type Mediterranean ecosystem and its contribution to the local water balance. Plant Soil 2006, 282, 361–378. [Google Scholar] [CrossRef]
  16. Kurz-Besson, C.; Lobo do Vale, R.; Rodrigues, M.L.; Almeida, P.; Herd, A.; Grant, O.M.; David, T.S.; Schmidt, M.; Otieno, D.; Keenan, T.F.; et al. Cork oak physiological responses to manipulated water availability in a Mediterranean woodland. Agric. For. Meteorol. 2014, 184, 230–242. [Google Scholar] [CrossRef]
  17. Mendes, M.P.; Ribeiro, L.; David, T.S.; Costa, A. How dependent are cork oak (Quercus suber L.) woodlands on groundwater? A case study in southwestern Portugal. For. Ecol. Manag. 2016, 378, 122–130. [Google Scholar] [CrossRef]
  18. Otieno, D.O.; Kurz-Besson, C.; Liu, J.; Schmidt, M.W.T.; Vale do Lobo, R.; David, T.S.; Siegwolf, R.; Pereira, J.S.; Tenhunen, J.D. Seasonal variations in soil and plant water status in a Quercus suber L. stand: Roots as determinants of tree productivity and survival in the Mediterranean-type ecosystem. Plant Soil 2006, 283, 119–135. [Google Scholar] [CrossRef]
  19. Vaz, M.; Pereira, J.S.; Gazarini, L.C.; David, T.S.; David, J.S.; Rodrigues, A.; Maroco, J.; Chaves, M.M. Drought induced photosynthetic inhibition and autumn recovery in two Mediterranean oak species (Quercus ilex and Quercus suber). Tree Physiol. 2010, 30, 946–956. [Google Scholar] [CrossRef]
  20. Cabral, M.T.; Ferreira, M.C.; Moreira, T.; Carvalho, E.C.; Diniz, A.C. Diagnóstico das causas da anormal mortalidade dos sobreiros a sul do Tejo. Sci. Gerund 1992, 18, 205–214. [Google Scholar]
  21. Camilo-Alves, C.S.P.; Vaz, M.; Da Clara, M.I.E.; Ribeiro, N.A. Chronic cork oak decline and water status: New insights. New For. 2017, 48, 753–772. [Google Scholar] [CrossRef]
  22. Costa, A.; Pereira, H.; Oliveira, A. Variability of radial growth in cork oak mature trees under cork production. For. Ecol. Manag. 2003, 175, 239–246. [Google Scholar] [CrossRef]
  23. Camilo-Alves, C.S.P.; Da Clara, M.I.E.; Ribeiro, N.M.D.A. Decline of Mediterranean oak trees and its association with Phytophthora cinnamomi: A review. Eur. J. For. Res. 2013, 132, 411–432. [Google Scholar] [CrossRef]
  24. Matías, L.; Abdelaziz, M.; Godoy, O.; Gómez-Aparicio, L. Disentangling the climatic and biotic factors driving changes in the dynamics of Quercus suber populations across the species’ latitudinal range. Div. Distrib. 2019, 25, 524–535. [Google Scholar] [CrossRef]
  25. Morillas, L.; Leiva, M.J.; Pérez-Ramos, I.M.; Cambrollé, J.; Matías, L. Latitudinal variation in the functional response of Quercus suber seedlings to extreme drought. Sci. Total Environ. 2023, 887, 164122. [Google Scholar] [CrossRef] [PubMed]
  26. Ramírez-Valiente, A.; Valladares, F.; Gil, L.; Aranda, I. Population differences in juvenile survival under increasing drought are mediated by seed size in cork oak (Quercus suber L.). For. Ecol. Manag. 2009, 257, 1676–1683. [Google Scholar] [CrossRef]
  27. Linares, J.C.; Camarero, J.J.; Carreira, J.A. Interacting effects of climate and forestcover changes on mortality and growth of the southernmost European fir forests. Glob. Ecol. Biogeogr. 2009, 18, 485–497. [Google Scholar] [CrossRef]
  28. Camarero, J.J.; Manzanedo, R.D.; Sánchez-Salguero, R.; Navarro-Cerrillo, R.M. Growth response to climate and drought change along an aridity gradient in the southernmost Pinus nigra relict forests. Ann. For. Sci. 2013, 70, 769–780. [Google Scholar] [CrossRef]
  29. Cornes, R.; van der Schrier, G.; van den Besselaar, E.J.M.; Jones, P.D. An ensemble version of the E-OBS temperature and precipitation datasets. J. Geophys. Res. Atmos. 2018, 123, 9391–9409. [Google Scholar] [CrossRef]
  30. Aronson, J.; Pereira, J.S.; Pausas, J.G. (Eds.) Introduction. In Cork Oak Woodlands on the Edge; Island Press: Washington DC, USA, 2009. [Google Scholar]
  31. Vicente-Serrano, S.M.; Beguería, S.; López-Moreno, J.I. A Multi-scalar drought index sensitive to global warming: The Standardized Precipitation Evapotranspiration Index—SPEI. J. Clim. 2010, 23, 1696–1718. [Google Scholar] [CrossRef]
  32. Vicente-Serrano, S.M.; Tomas-Burguera, M.; Beguería, S.; Reig, F.; Latorre, B.; Peña-Gallardo, M.; Luna, M.Y.; Morata, M.; González-Hidalgo, J.C. A High Resolution Dataset of Drought Indices for Spain. Data 2017, 2, 22. [Google Scholar] [CrossRef]
  33. Caudullo, G.; Welk, E.; San-Miguel-Ayanz, J. Chorological maps for the main European woody species. Data Brief 2017, 12, 662–666. [Google Scholar] [CrossRef]
  34. Fick, S.E.; Hijmans, R.J. WorldClim 2: New 1km spatial resolution climate surfaces for global land areas. Int. J. Climatol. 2017, 37, 4302–4315. [Google Scholar] [CrossRef]
  35. Hijmans, R. Raster: Geographic Data Analysis and Modeling; R Package Version 3.6-21. 2023. Available online: https://rspatial.org/raster (accessed on 10 May 2023).
  36. Fritts, H.C. Tree Rings and Climate; Academic Press: London, UK, 1976. [Google Scholar]
  37. Larsson, L.A.; Larsson, P.O. CDendro and CooRecorder, v. 9.3.1; Manual; Cybis Elektronik and Data AB: Saltsjöbaden, Sweden, 2018. [Google Scholar]
  38. Holmes, R.L. Computer-assisted quality control in tree-ring dating and measurement. Tree-Ring Bull. 1983, 43, 69–78. [Google Scholar]
  39. Gärtner, H.; Lucchinetti, S.; Schweingruber, F.H. A new sledge microtome to combine wood anatomy and tree-ring ecology. IAWA J. 2015, 36, 452–459. [Google Scholar] [CrossRef]
  40. Briffa, K.R.; Jones, P.D. Basic chronology statistics and assessment. In Methods of Dendrochronology; Cook, E.R., Kairiukstis, L.A., Eds.; Kluwer: Dordrecht, The Netherlands, 1990; pp. 137–152. [Google Scholar]
  41. Bunn, A.; Korpela, M.; Biondi, F.; Campelo, F.; Mérian, P.; Qeadan, F.; Zang, C. dplR: Dendrochronology Program Library in R, R Package Version 1.7.1; CRAN: Vienna, Austria, 2020. [Google Scholar]
  42. Wigley, T.M.; Briffa, K.R.; Jones, P.D. On the average value of correlated time series, with applications in dendroclimatology and hydrometeorology. J. Clim. Appl. Meteorol. 1984, 23, 201–213. [Google Scholar] [CrossRef]
  43. Zang, C.; Biondi, F. Treeclim: An R package for the numerical calibration of proxy-climate relationships. Ecography 2015, 38, 431–436. [Google Scholar] [CrossRef]
  44. Hurrell, J. Decadal trends in North Atlantic Oscillation and relationship to regional temperature and precipitation. Science 1995, 269, 676–679. [Google Scholar] [CrossRef]
  45. Hurrell, J.; Van Loon, H. Decadal variations in climate associated with the North Atlantic Oscillation. Clim. Chang. 1997, 36, 301–326. [Google Scholar] [CrossRef]
  46. Rubio-Cuadrado, A.; Camarero, J.J.; Bosela, M. Applying climwin to dendrochronology: A breakthrough in the analyses of tree responses to environmental variability. Dendrochronologia 2022, 71, 125916. [Google Scholar] [CrossRef]
  47. Bailey, L.; van de Pol, M. Climwin: An R toolbox for climate window analysis. PLoS ONE 2016, 11, e0167980. [Google Scholar] [CrossRef]
  48. van de Pol, M.; Bailey, L.D.; McLean, N.; Rijsdijk, L.; Lawson, C.R.; Brouwer, L. Identifying the best climatic predictors in ecology and evolution. Methods Ecol. Evol. 2016, 7, 1246–1257. [Google Scholar] [CrossRef]
  49. Burnham, K.P.; Anderson, D.R. Model Selection and Multimodel Inference: A Practical Information-Theoretic Approach; Springer: New York, NY, USA, 2004. [Google Scholar]
  50. R Core Team. R: A Language and Environment for Statistical Computing; R Foundation for Statistical Computing: Vienna, Austria, 2023. [Google Scholar]
  51. Costa, A.; Pereira, H.; Oliveira, A. A dendroclimatological approach to diameter growth in cork-oak adult trees under cork production. Trees Struct. Funct. 2001, 15, 438–443. [Google Scholar] [CrossRef]
  52. Leal, S.; Nunes, E.; Pereira, H. Cork oak (Quercus suber L.) wood growth and vessel characteristics variations in relation to climate and cork harvesting. Eur. J. For. Res. 2008, 127, 3341. [Google Scholar]
  53. Mendes, M.P.; Cherubini, P.; Plieninger, T.; Ribeiro, L.; Costa, A. Climate effects on stem radial growth of Quercus suber L.: Does tree size matter? Forestry 2019, 92, 73–84. [Google Scholar] [CrossRef]
  54. Pasho, E.; Camarero, J.J.; de Luis, M.; Vicente-Serrano, S.M. Impacts of drought at different time scales on forest growth across a wide climatic gradient in North-Eastern Spain. Agric. For. Meteorol. 2011, 151, 1800–1811. [Google Scholar] [CrossRef]
  55. Nardini, A.; LoGullo, M.A.; Salleo, S. Competitive strategies for water availability in two Mediterranean Quercus species. Plant Cell Environ. 1999, 22, 109–116. [Google Scholar] [CrossRef]
  56. González-Adrados, J.R.; Gourlay, I. Applications of Dendrochronology to Quercus suber L. In Cork Oak and Cork. Proceedings of the European Conference on Cork Oak and Cork; Pereira, H., Ed.; Centro de Estudos Florestais: Lisboa, Portugal, 1998; pp. 162–166. [Google Scholar]
  57. Costa, A.; Nunes, L.C.; Spiecker, H.; Graça, J. Insights into the responsiveness of cork oak (Quercus suber L.) to bark harvesting. Econ. Bot. 2015, 69, 171–184. [Google Scholar] [CrossRef]
  58. Hampe, A.; Jump, A.S. Climate relicts: Past, present, future. Ann. Rev. Ecol. Evol. Syst. 2011, 42, 313–333. [Google Scholar] [CrossRef]
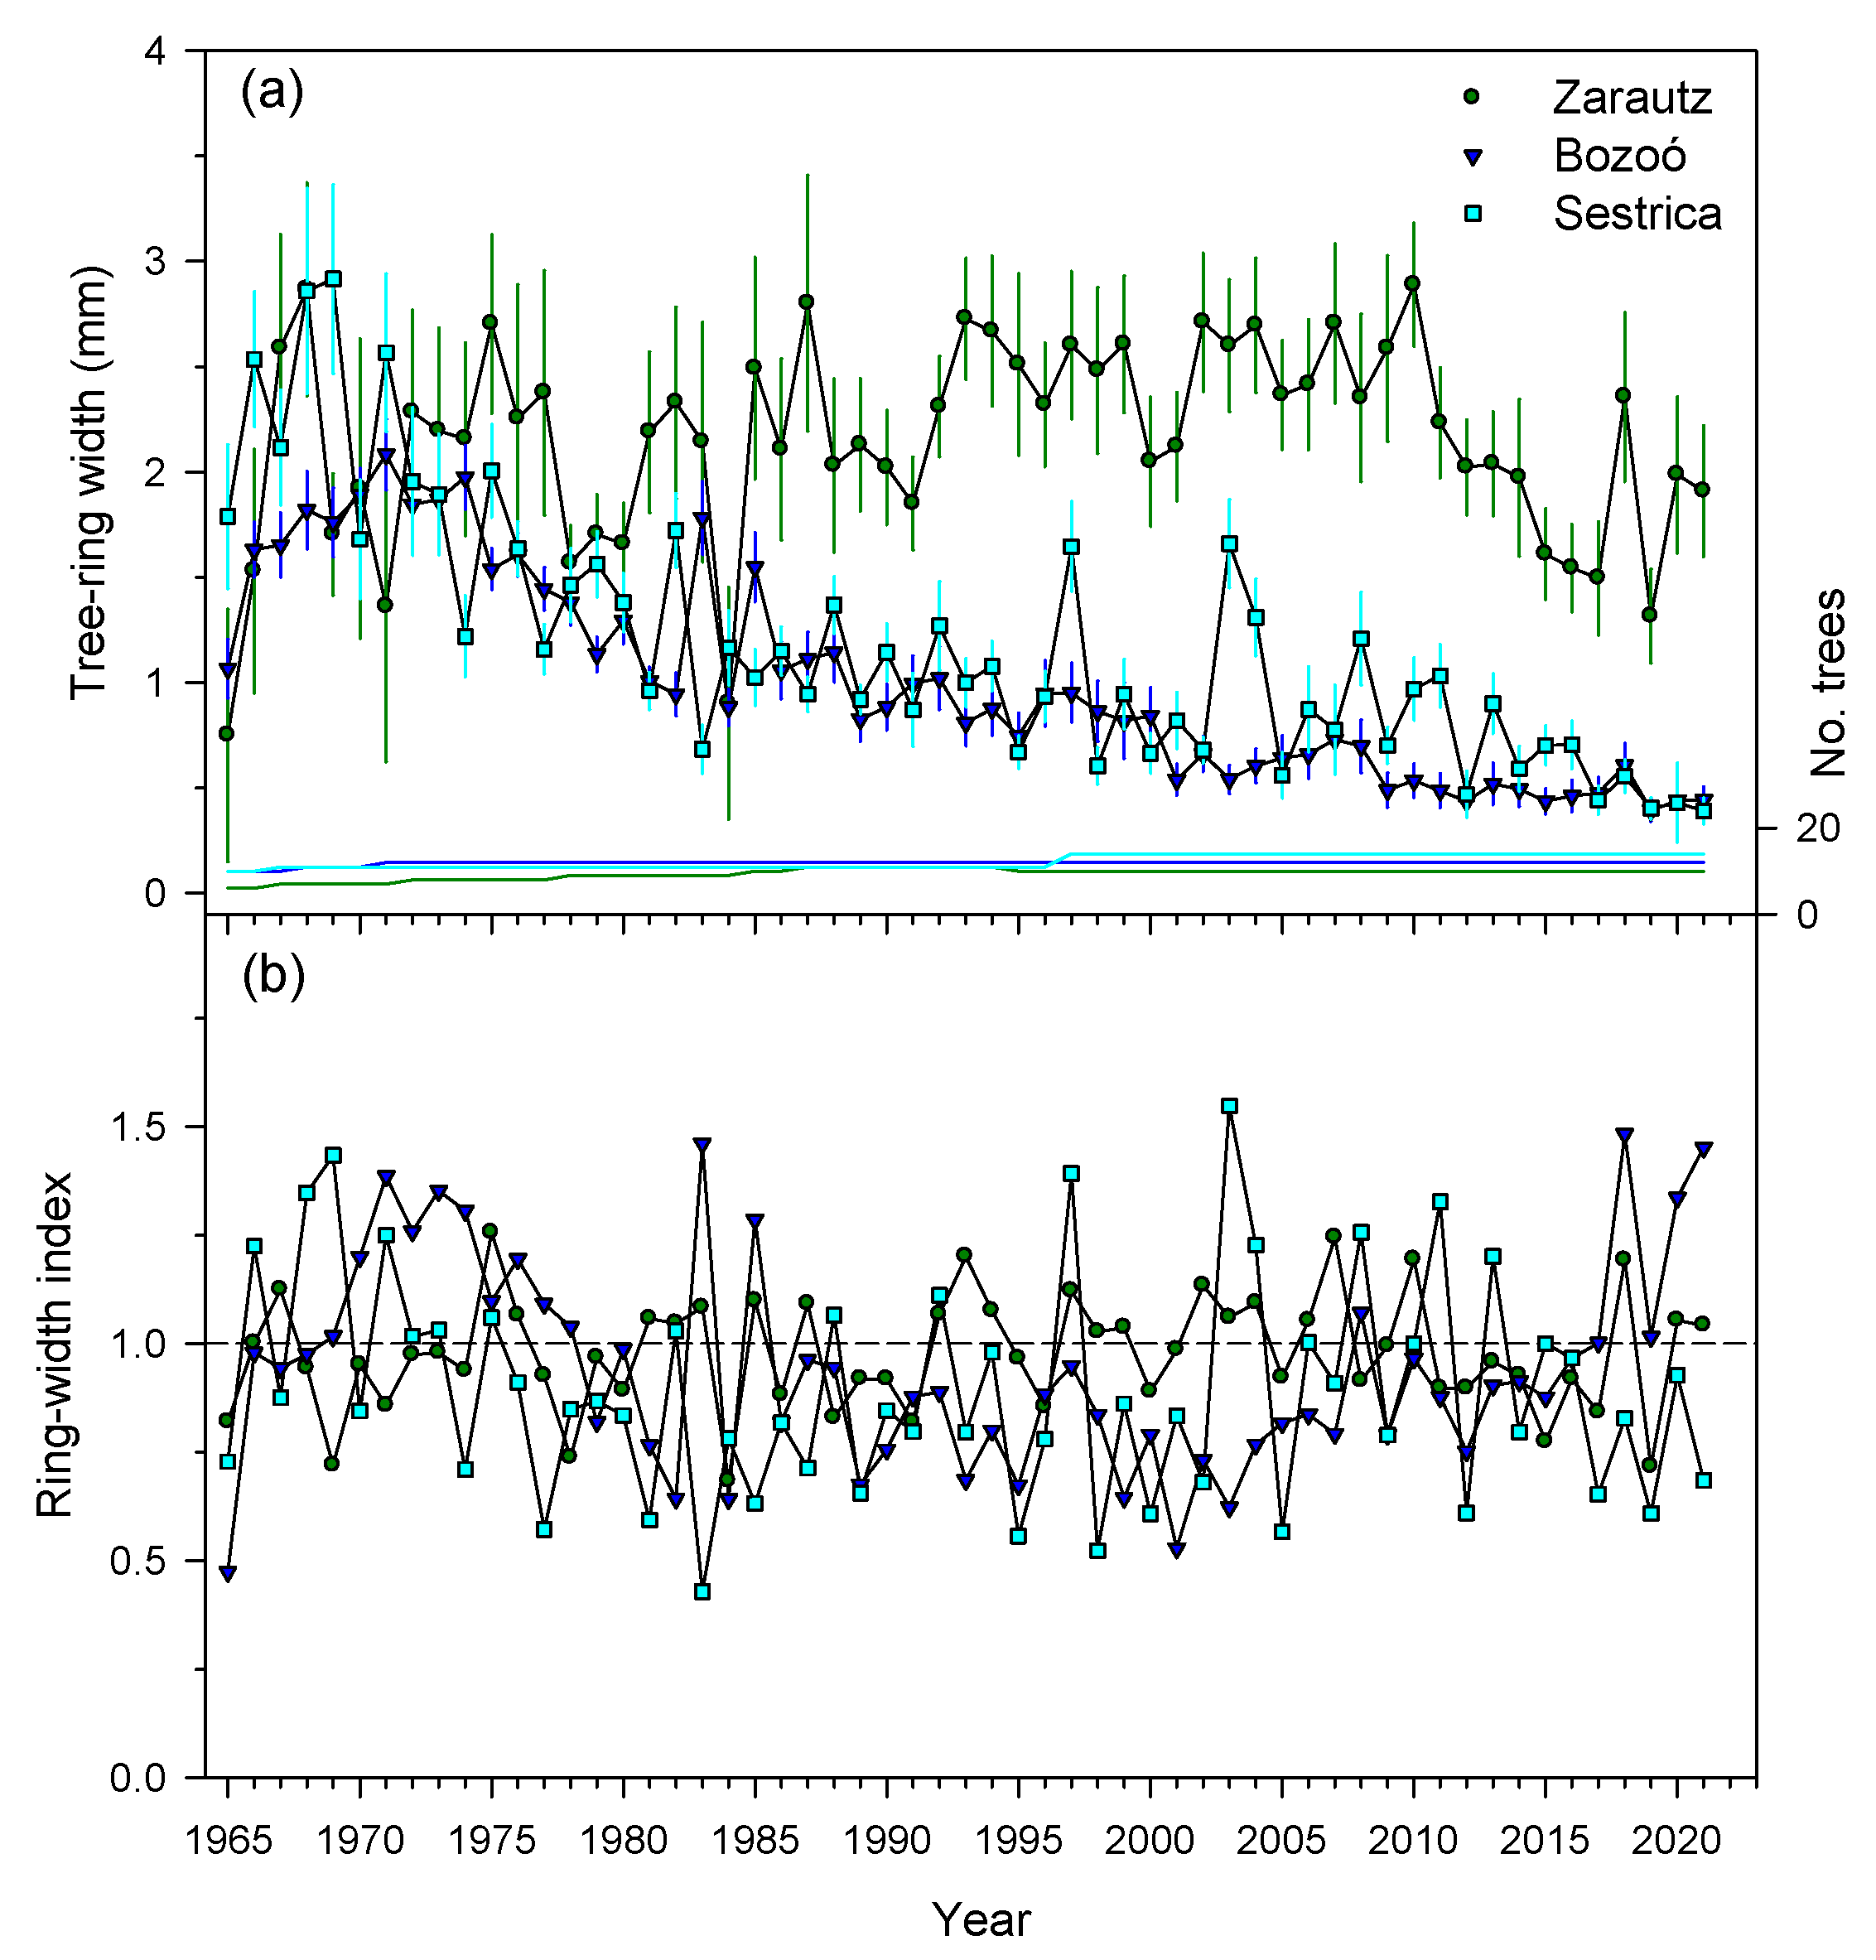
Figure 3. Mean site series of (a) ring width data (means ± SE) and (b) residual ring width indices of the three study sites (Zarautz, Bozoó and Sestrica). In the upper plot, the sample size (annual number of measured trees, lower lines of different colors) is shown on the right y axis.
Forests 15 00072 g003
Figure 4. Relationships between monthly climate variables ((a), TMx, mean maximum temperature; (b), TMn, mean minimum temperature; (c), precipitation) and site series of ring width indices of the three study sites. The bars are Pearson correlation coefficients (r), and the dashed and dotted horizontal lines indicate the 0.05 and 0.01 significance levels, respectively. The correlation window spans from previous September to current September, with months of the prior year abbreviated with lowercase letters.
Forests 15 00072 g004
Figure 5. Relationships between precipitation summed from the previous (year t − 1) September to the current (year t) May and ring width indices in the three study cork oak populations. The Pearson correlation coefficients (r), their significance levels (p) and the slopes corresponding to fitted linear regressions are shown in the box.
Forests 15 00072 g005
Figure 6. Correlations calculated between SPEI weekly values and the site series of ring width indices considering the common interval 1967–2021 and the temporal window from January to October. Dashed lines show the 0.05 significance levels.
Forests 15 00072 g006
Figure 7. Plots summarizing climwin analyses between precipitation (climate variable in the scatter plot) and the site series of ring width indices (biological response in the scatter plot) in the Sestrica site. The upper plot (a) shows temporal windows and best fits (see Table 3) as red grids corresponding to lowest ΔAICc values (shown in the histogram). The ΔAICc is a subtraction between the model AICc and the AICc value of the null model. Dates of the previous year are indicated with “(t − 1)”. The bottom plots show (b) the relationship between the climate of the best supported window and the growth indices, and (c) the histogram of ΔAICc values of the models fitted on randomized data with a vertical dashed line showing the ∆AICc of the best model fitted on the observed data.
Forests 15 00072 g007
Table 1. Main characteristics of the three study sites, including the mean annual temperature (MAT) and the total annual precipitation (TAP). Dbh is the diameter at breast height. Different letters indicate significant (p < 0.05) differences between sites according to Mann–Whitney tests.
SiteLatitude NLongitude WElevation (m a.s.l.)ExpositionSlope (%)MAT, Range (°C)TAP (mm)KOI 1Dbh (cm)Height (m)Other Tree Species
Zarautz43°17′20″2°10′52″141E15–2012.4, 3.9–22.8141726.334.8 ± 1.9 c7.5 ± 1.2 bArbutus unedo, Laurus nobilis
Bozoó42°44′15″3°06′31″759NE5–1010.1, −2.5–23.478921.527.3 ± 1.6 a5.9 ± 0.3 aQuercus ilex, Pinus pinaster
Sestrica41°30′02″1°38′11″865E, SE10–4511.8, −1.6–27.845515.331.4 ± 1.2 b6.6 ± 0.9 abQuercus ilex, Quercus faginea
1 KOI is the Kerner Oceanity Index, which is the ratio of the mean monthly air temperature difference between October and April and the difference between mean monthly temperatures of the warmest and coldest months. Small and large KOI values indicate oceanic—high continentality (11 ≤ KOI < 20)—and hyperoceanic—low continentality (21 ≤ KOI < 50)—conditions, respectively.
Table 2. Variables and statistics related to tree-ring data. Values are means ± SD. Different letters indicate significant (p < 0.05) differences between sites according to Mann–Whitney tests. Abbreviations: rbar, mean correlation among all series; EPS, expressed population signal.
SiteNo. Trees (No. Radii)PeriodEstimated Tree Age (yrs.)Tree-Ring Width (mm)First-Order AutocorrelationMean SensitivityrbarEPS
Zarautz10 (14)1949–202154 ± 112.27 ± 0.22 c0.50 ± 0.09 a0.27 ± 0.04 a0.390.61
Bozoó12 (21) 1940–202164 ± 101.14 ± 0.16 a0.74 ± 0.11 b0.30 ± 0.05 a0.570.72
Sestrica14 (23)1937–202165 ± 141.71 ± 0.18 b0.51 ± 0.06 a0.45 ± 0.09 b0.700.81
Table 3. Variables of climwin analyses relating series of ring width indices and monthly climate variables (Tmax, mean maximum temperature; Tmin, mean minimum temperature; Prec, precipitation). The previous year is indicated with “(t − 1)”. DOY is the day of the year. The ΔAICc is a subtraction between the model AICc and the AICc value of the null model. The p AICc is the probability value obtained in the randomization test.
SiteClimate VariableWindow Open (DOY)Window Close (DOY)CoefficientpR2ΔAICcp AICc
ZarautzTmax244 (t − 1)292 (t − 1)−0.046<0.0010.22−10.850.079
Tmin2102280.0410.0110.12−4.490.661
Prec238 (t − 1)296 (t − 1)0.043<0.0010.34−19.690.002
BozoóTmax7085−0.044<0.0010.21−10.160.144
Tmin360 (t − 1)10−0.048<0.0010.20−9.40.167
Prec1472380.206<0.0010.21−10.280.116
SestricaTmax152170−0.0360.0090.13−4.850.904
Tmin1041260.0630.0070.14−5.40.431
Prec258 (t − 1)3120.665<0.0010.41−25.6<0.001
Disclaimer/Publisher’s Note: The statements, opinions and data contained in all publications are solely those of the individual author(s) and contributor(s) and not of MDPI and/or the editor(s). MDPI and/or the editor(s) disclaim responsibility for any injury to people or property resulting from any ideas, methods, instructions or products referred to in the content.