Article

Dynamic Shifts in Soil Fungal Functional Group Characteristics across Distinct Vegetation Types during Ecological Restoration in Degraded Red Soil Regions

1
College of Forestry, Fujian Agriculture and Forestry University, Fuzhou 350002, China
2
Key Laboratory of Soil and Water Conservation of Southern Red Soil Region, State Forestry and Grassland Administration, Fuzhou 350002, China
3
National Positioning Observation and Research Station of Red Soil Hilly Ecosystem, Changting, Longyan 364000, China
4
Collaborative Innovation Center for Soil and Water Conservation in Red Soil Region on Both Sides of the Taiwan Strait, Fuzhou 350002, China
5
Bangor College China, Joint Unit of Bangor University and Central South University of Forestry and Technology, Changsha 410004, China
*
Author to whom correspondence should be addressed.
Forests 2024, 15(1), 89; https://doi.org/10.3390/f15010089
Submission received: 10 November 2023 / Revised: 26 December 2023 / Accepted: 27 December 2023 / Published: 2 January 2024
(This article belongs to the Section Forest Soil)

Abstract

:
The red soil region in southern China has become the second-largest soil erosion area after the Loess Plateau. The evolutionary trajectory of soil fungi during vegetation restoration in acidic red soil regions remains a subject of inquiry. The investigation focused on the restoration process of an ecosystem facing intense degradation in the southern regions of China by studying four distinctive vegetation types: barren land (BL), pure Pinus massoniana forest (CF), mixed coniferous (CBF), and broad-leaved forest (BF). The outcomes revealed considerable enhancements in soil properties’ attributes, evident through a gradual reduction in the bulk density of soil (SBD) and a corresponding increment in soil moisture content (MC), total nitrogen (TN), total carbon (TC), total potassium (TK), soil organic matter (SOM), and available potassium (AK) as vegetation restoration advanced. An intriguing trend emerged where the relative abundance of Ascomycota fungi displayed a declining trajectory, whereas Basidiomycota fungi exhibited an ascending trend with the progression of vegetation restoration. Specifically, broad-leaved forests exhibited a significantly greater relative abundance of Penicillium fungi compared to other stages of vegetation restoration. The diversity of soil fungal communities increased in tandem with vegetation restoration. A redundancy analysis illuminated a strong and positive relationship between the abundance of major soil fungi and soil pH, TN, and TC (key influencers of acidic red soil fungal populations). This study provided additional evidence of an elevation in ectomycorrhizal and saprophytic trophic fungi, signifying a transition that enhances the vegetation’s ability to capture water and nutrients. This, in turn, contributes to the overall enrichment and diversity of vegetation communities during the progression of restoration.

1. Introduction

Due to its soil characteristics and natural factors like rainfall and terrain, the red soil region of south China has emerged as the second-largest area affected by soil erosion behind the Loess Plateau [1,2]. Changting County, Fujian Province, is a representative soil erosion area in southern red soil. Long-term soil erosion has caused severe ecosystem degradation, resulting in a vast expanse of land degraded by intense erosion. Changting’s soil erosion area has developed various types of vegetation restoration after decades of intensive management [3,4]. However, under the conditions of artificial interference promotion, the succession direction of vegetation communities for vegetation restoration in Changting remains uncertain due to soil erosion, which severely restricts the formulation of subsequent management measures and the maintenance of restoration effects [5,6]. Therefore, understanding the inherent ecological mechanisms involved in the process of vegetation restoration across various degraded regions is of significant importance. Specifically, in the Changting soil erosion area, revealing these mechanisms and applying them in practice have become an urgent task. This research aims to delve into the vegetation restoration process in the Changting area to uncover the ecological mechanisms involved in the ecological restoration of this region and beyond.
Soil is the medium for vegetation growth, and the characteristics of soil ecosystems are closely related to the vegetation communities they can support [7,8]. Microorganisms are an essential component of soil ecosystems, participating in biochemical processes such as soil organic matter (SOM) degradation, humus synthesis, and nutrient cycling. These are important drivers of vegetation community succession [9,10]. Southern China is a typical area of acidic red soil, and fungi are the principal decomposers of acidic soil. Soil fungi play a vital role in the energy flow, nutrient cycling, and SOM transformation in acidic forest soils and are crucial for the diversity and functional restoration of forest ecosystems [11,12]. The changes in the composition and structure of soil fungal communities can serve as early indicators of changes in soil characteristics and as important indicators for assessing the quality of the ecological environment [13].
The changes in vegetation communities and the soil environment have a driving effect on soil fungal communities, resulting in alterations in the composition and community structure of soil fungi when adapting to new environmental conditions. The changes in soil fungal groups are strongly associated with vegetation types and stages of restoration [14,15,16]. Research has demonstrated that the dominant fungi in the soil at different stages of vegetation restoration in karst rocky desertification areas are Ascomycota, Basidiomycota, and Conjugata, and the relative abundance of Ascomycota decreases with the progression of vegetation restoration stages [17]. Fungi perform diverse ecological functions concerning certain trophic strategies [18]. Abiotic factors and vegetation characteristics mainly cause temporal changes in soil fungal communities with the duration of vegetation restoration. Soil conditions directly affect soil fungal diversity and community composition [19]. Different dominant groups of soil fungi are found in diverse types of vegetation in the rocky desertification region of western Hunan. The number of soil fungal species and the diversity index in mixed forests are higher than those in single pure forests. Soil organic carbon (SOC), total nitrogen (TN), and soil pH are the main soil factors influencing the changes in fungal communities [20]. The vegetation restoration in mining areas on the Loess Plateau has enhanced soil fungal diversity, and soil moisture is the main factor affecting the fungal community structure [21]. Currently, there is relatively little research on the changes in the soil fungal community structure and diversity during vegetation restoration in acidic red soil-degraded areas in southern China.
To address the above issues, we formulated two hypotheses: (i) acidic red soil fungi are closely linked with plant composition and function during vegetation restoration; (ii) the diversity and composition of fungi have an indirect regulatory effect on vegetation communities. Changting County, Fujian Province, a typical red ultisol region in southern China, was used as the research object to verify the aforementioned hypotheses. A long-term positioning observation sample plot established in Changting was used to investigate and measure the soil’s physicochemical characteristics of four typical vegetation types during the vegetation restoration process of the degraded red soil intensity. High throughput-sequencing technology was used to determine the structure and diversity changes of soil fungal communities and composition and the impact of diverse vegetation restoration on soil fungal communities. The internal link between soil fungus and flora types was investigated during the ecological restoration of degraded land. The results of this study can further enhance the understanding of the structure and composition of soil fungal communities in the ecological system of southern red soil erosion areas, as well as provide a scientific foundation for the response of soil fungi to vegetation changes during the ecological restoration of degraded red ultisol.

2. Materials and Methods

2.1. Overview of the Experimental Site

As shown in Figure 1, the experimental site is situated in Hetian Town, Changting County, Fujian Province, China (116°25′57″–116°30′36″ E, 25°37′18″–25°44′02″ N). It has a subtropical humid monsoon climate, with plentiful rainfall throughout the year. The annual average temperature is 17–19.5 °C, and the annual average precipitation is 1700 mm. The vegetation type is subtropical evergreen broad-leaved forest, with the main vegetation including Pinus massoniana, Schima superba, Liquidambar formosana, Cinnamomum camphora, and Dicranopteris dichotoma. As a typical red soil area, the soil is severely desilicated and enriched in aluminum. The clay minerals are mainly kaolinite, and the soil is acidic with low salt saturation. Long-term soil erosion has inflicted severe damage on the ecological environment of Changting. According to the 1985 remote sensing survey, the soil erosion area of Changting County accounts for 31.5% of the total land area, with a soil erosion modulus of 5000–12,000 t·km−2, and vegetation coverage of 5%–40%.
The degraded land caused by soil erosion in the 1980s was selected as the research object. Four typical vegetation types were selected during the vegetation restoration process of the degraded land, including bare land (BL), pure P. massoniana forest (CF), mixed coniferous (CBF), and broad-leaved forest (BF) (Figure 1). Each vegetation type sampling site was set with three plots with an elevation of 297–308 m, a slope degree of 13–18°, and a slope direction of approximately the same (southwest slope). A total of 12 plots were set up. Among them, eroded bare land was an area formed by intense soil erosion in the 1980s and has not been treated, with each sample area exceeding 2000 m2. The P. massoniana coniferous forest was formed by aerial seeding and afforestation in 1990, with each sample area exceeding 2 km2. The CBF and BF forest was transformed into a P. massoniana coniferous forest in 2008, with the addition of broad-leaved trees such as L. formosana and S. superba, and each plot covered an area of over 2 km2. The broad-leaved forest is a well-protected natural succession forest that has not been interfered with by humans in the past 100 years, with each sampling area exceeding 5000 m2 [4].

2.2. Soil Sample Collection and Processing

Soil sampling was conducted at four typical vegetation patches, each comprising three plots measuring 10 m × 10 m. From each plot, the top layer of soil humus was removed, and approximately 1 kg of soil samples was collected from the 0–10 cm depth soil layer, representing the lower, middle, and upper parts of each sampling area. After removing any litter, roots, and gravel from the soil samples, they were placed in soil sampling bags for transport back to the laboratory. In total, 36 samples were collected. All collected samples underwent a series of steps, including air-drying, removal of debris such as stones and plant roots, and grinding through a 2 mm sieve. A portion of the soil that passed through the 2 mm sieve was used to determine the total nutrient content. Subsequently, the quartering method was used to select a portion that passed through a 0.25 mm sieve for the determination of available nutrient content. In parallel, approximately 300 g of fresh soil was promptly placed in dry ice foam wooden boxes and transported back to the laboratory for soil fungal sequencing. After removing the surface humus layer, a cutting ring was used to collect undisturbed soil samples from the upper, middle, and lower parts of each area, specifically from the 0–10 cm depth, for measuring soil bulk density and water-holding characteristics. This resulted in a total of 36 samples for these measurements.

2.3. Determination of Soil Physiochemical Properties

The soil moisture content (SMC) and soil bulk density (SBD) were determined using the cutting ring weighing method [22]. Soil chemical properties were analyzed following the forest soil analysis method outlined in the forestry industry standard of the People’s Republic of China [23]. Soil pH was measured using the potentiometric method, employing a water-to-soil ratio of 2.5:1. For the analysis of total nitrogen (TN) and total carbon (TC), an elemental analyzer (German Elemental, Vario, Elemental Company, Frankfurt, Germany) was employed. The determination of total phosphorus (TP) and total potassium (TK) content in the soil was carried out through HF-HClO4-HNO3 digestion and analyzed using an inductively coupled plasma emission spectrometer (PE-OPTIMA 8000, Perkin Elmer, Waltham, MA, USA). To assess soil organic matter (SOM), a high-temperature exothermic potassium dichromate volumetric method was employed. Ammonium nitrogen (NO3) and nitrate nitrogen (NH4+) were determined through potassium chloride extraction and a continuous flow analysis using a Skalar San++ instrument from the Netherlands. Available phosphorus in the soil (AP) was analyzed using HSO4-HCl extraction and the molybdenum antimony colorimetric method. Available potassium in the soil (AK) was determined through ammonium acetate extraction and flame photometry.

2.4. Soil DNA Extraction, PCR Amplification, and Sequencing

Total DNA was extracted from soil samples utilizing the HiPure Soil DNA Kit (model D3142, Guangzhou Meiji Biotechnology Co., Ltd., Guangzhou City, China). The concentration and purity of the extracted DNA were assessed using a NanoDrop 2000 instrument (Thermo Fisher Technology, MA, USA). Additionally, DNA purity and concentration were verified through agarose gel electrophoresis (1%). For PCR amplification, the primers ITS1-F (CTTGGTCATTTAGAGATAA) and ITS2 (GCTGCGTTCTTCATCGATGC) were selected. The amplification process was conducted in a PCR instrument (model ETC811, Dongsheng Xingye Scientific Instrument Co., Ltd., Beijing, China) with a reaction volume of 50 μL. The amplification protocol consisted of an initial denaturation step at 94 °C for 2 min, followed by 30 cycles, each comprising denaturation at 98 °C for 10 s, annealing at 62 °C for 30 s, and extension at 68 °C for 30 s. A final extension step at 68 °C for 5 min was performed. The amplified products underwent purification using AMPure XP Beads and quantification using the ABI StepOnePlus Real-Time PCR System (Life Technologies, MA, USA). Subsequently, sequencing was carried out using the PE250 mode pooling on a Novaseq 6000 platform.

2.5. OTU Clustering and Annotation

The initial filtration of raw data obtained from the Illumina platform was conducted using FASTP (version 0.18.0). The resulting filtered clean reads were then employed for assembly analysis. To merge these clean reads into tags, FLASH (version 1.2.11) was utilized, with a minimum overlap requirement of 10 base pairs and a maximum permissible mismatch rate of 2%. Following the filtering criteria established by Bokulich, low-quality tags were excluded to yield a collection of high-quality clean tags. The subsequent step involved the utilization of UPARSE (version 9.2.64) to process the clean tags, clustering them into operational taxonomic units (OTU) based on a similarity threshold of ≥97%. Each OTU represented a unique sequence in the ITS2 database (version update_2015). To classify and annotate these OTUs at the species level, the RDP annotation software (version 2.2) was employed, utilizing a confidence threshold range set between 0.8 and 1.

2.6. Statistical Analysis

An analysis of the data was performed utilizing IBM SPSS Statistics 22 to conduct a significance analysis via one-way ANOVA. A redundancy analysis of bacterial communities and soil physicochemical properties was conducted using Canoco5 software (Version: 5.1.1). To visualize the species abundance stack map, R language’s ggplot2 package (Version: 3.3.5) was utilized, and the circular layout of species distribution was presented using circos software (Version: 0.69-11). For comparing the Alpha diversity index, Tukey’s HSD test and the Kruskal–Wallis H test were performed using the R Language Vegan package (version 2.5.3). To analyze the dissimilarity between the samples, the Bray–Curtis distance matrix was computed based on OTU and species abundance tables, employing the R Language Vegan package (version 2.5.3). A principal coordinates analysis (PCA) was then conducted based on the Bray–Curtis distance matrix, and the Adonis (Permanova) test was performed using the R Language Vegan package to assess beta distance differences among groups. The analysis of species’ abundance differences across multiple groups was carried out using the R Language Vegan package. This analysis incorporated both Tukey’s HSD test and the Kruskal–Wallis H test to explore and assess potential differences among the groups. In the partial least squares model, RStudio was employed, utilizing the PLS-PM package, Vegan package, and ggplot2 package. Collinearity among factors was addressed by removing those with absolute loading values less than 0.7, and negative loading values were treated as absolute values. Factors retained in the PLS-PM model were ensured to be free from collinearity, and their loading values were all greater than 0.7.

3. Results

3.1. Soil Physical and Chemical Properties of Different Vegetation Types

According to Table 1, soil TN, TC, TK, SOM, AK, and MC showed an upward trend with vegetation restoration, while SBD showed the opposite trend. The soil TN, TC, TK, SOM, and MC of CBF and BF vegetation types were significantly higher than those of BL and CF (p < 0.05). The AK content of BF was considerably higher than that of the other three vegetation types (p < 0.05). There was no significant difference in soil pH among different vegetation types (p > 0.05). The TP content of CF type soil was significantly higher than that of CBF and BF, but there was no significant difference compared to BL. The content of AP in the BF type was greater than that in BL, while there was no significant difference among other vegetation types. The content of SBD in the BL type was significantly higher than that in BF, while there was no significant difference among other vegetation types. The nitrate nitrogen content in the CF and CBF types of soil was significantly higher than that in the BL and BF types, while BF had no significant difference from BL. The ammonium nitrogen content showed a decreasing and then increasing trend with vegetation restoration, and the BF vegetation type reached its maximum value. In summary, with the restoration of vegetation, the soil’s physical and chemical properties have significantly improved, mainly reflected in aspects such as total nutrients, soil bulk density, and soil moisture content.

3.2. Sequencing Results of Soil Fungi

As shown in Figure 2, the Shannon–Wiener index curve tended to flatten out (Figure 2a), and the library coverage rate was greater than 99%, indicating that the sequencing data were sufficient to reflect the true situation of soil fungal communities in different vegetation types during the restoration stages. The number of soil OTU in different vegetation types during different restoration stages showed an increasing trend, with BF > CF > CBF > BL. However, there was little difference between the CF and CBF types, with the BF types being 1.26, 1.15, and 1.16 times higher than BL, CF, and CBF, respectively. The unique OTU content in the BL, CF, CBF, and BF vegetation types of soil was 277, 242, 184, and 386, respectively, showing a trend of first decreasing and then increasing, with the BF type reaching its maximum value (Figure 2b).

3.3. Composition of Soil Fungal Community

As shown in Figure 3, the dominant phyla of soil fungi in the four typical vegetation types during different vegetation restoration processes were Ascomycota and Basidiomycota, with relative abundances of 62.62%, 77.10%, 65.60%, and 59.00% in Ascomycota and 21.49%, 20.20%, 27.11%, and 28.57% in Basidiomycota, respectively. There are five low-abundance phyla of soil fungi, namely Mucormycota, Mortierellomycota, Glomeromycota, Calcarisporillomycota, and Chytridiomycota. Although these five phyla have low abundance, they have been detected at different stages of vegetation restoration and are common rare fungi in the soil of the southern red soil region. The dominant phyla of soil fungi were consistent among different vegetation types, but the relative abundance was different. Ascomycota’s relative abundance decreased with vegetation restoration, while the relative abundance of Basidiomycota increased.
As shown in Figure 4, the dominant genera of soil fungi in different vegetation types were Penicillium, Leohumicola, and Russula. The relative abundance of Penicillium was 2.89%, 9.08%, 8.23%, and 16.99%, respectively. The relative abundance of Penicillium in BF was significantly higher than that in BL, and the relative abundance of Leohumicola was 17.08%, 4.52%, 4.28%, and 0.41%, respectively. The relative abundance of Russula was 0.13%, 1.74%, 1.26%, and 19.48%, respectively. With the restoration of vegetation, the relative abundance of Penicillium in the soil showed an upward trend, while the relative abundance of Leohumicola genera showed a downward trend. There were six other genera of soil fungi with low abundance in different vegetation types, namely Sagenomela (0.54%–12.01%), Rhizopogon (0.08%–10.13%), Tomentella (1.7%–3.1%), Oidiodendron (0.83%–5.42%), Trichoderma (0.35%–5.49%), and Amphinema (0.17%–3.79%). These six genera had a low proportion, but they were present in all vegetation types. It is a common rare fungus genus in the southern red soil region. The relative abundance of Trichoderma in the CBF type soil was significantly higher than that of the other three types. The maximum abundance of Sagenomella genus appeared in the CF type, while that of Sarcopterygium genus appeared in the BL type. In summary, the types of dominant fungal genera in the soil of typical vegetation types during different vegetation restoration stages were similar, but there were significant differences in relative abundance.

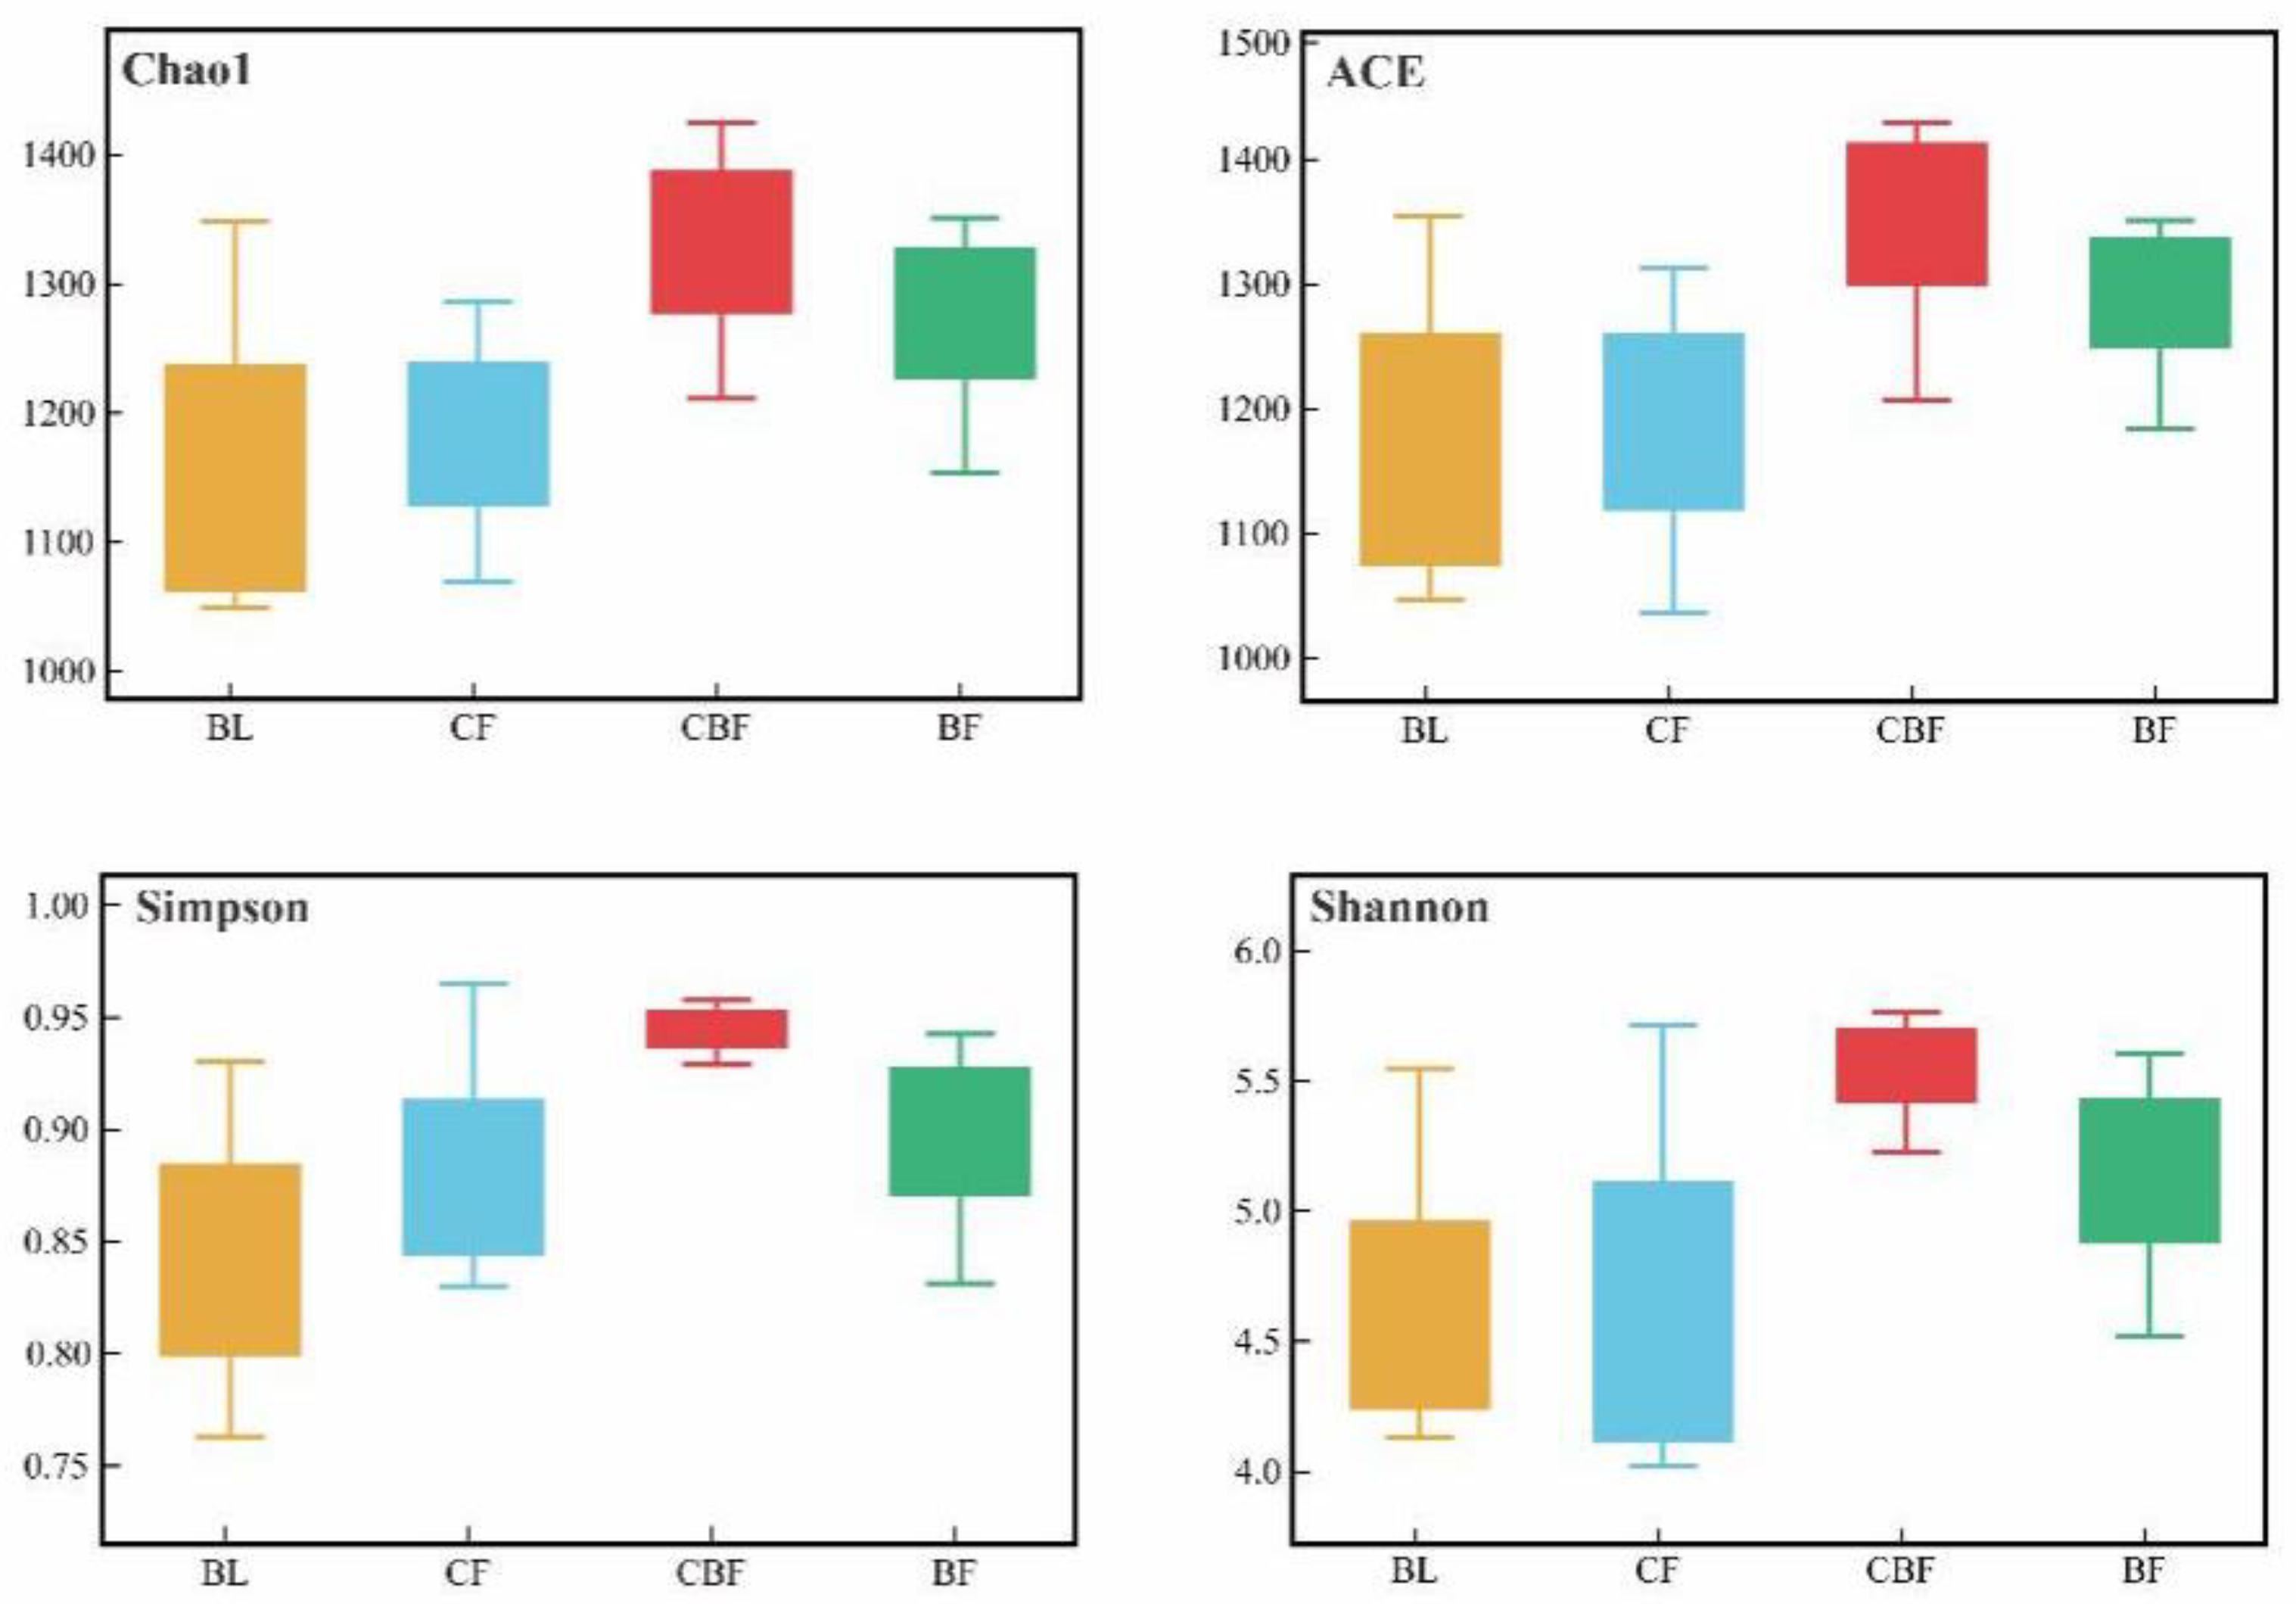
3.4. Alpha Diversity of Soil Fungi

As shown in Figure 5, the trends of changes in soil bacterial Chao1, ACE, Shannon, and Simpson indices were consistent with vegetation restoration, with the CBF and BF stages being greater than the BL and CF stages, with the CBF stage reaching its maximum value. The enhancement in richness and diversity of soil fungal communities was evident, indicating that vegetation restoration has a positive impact.

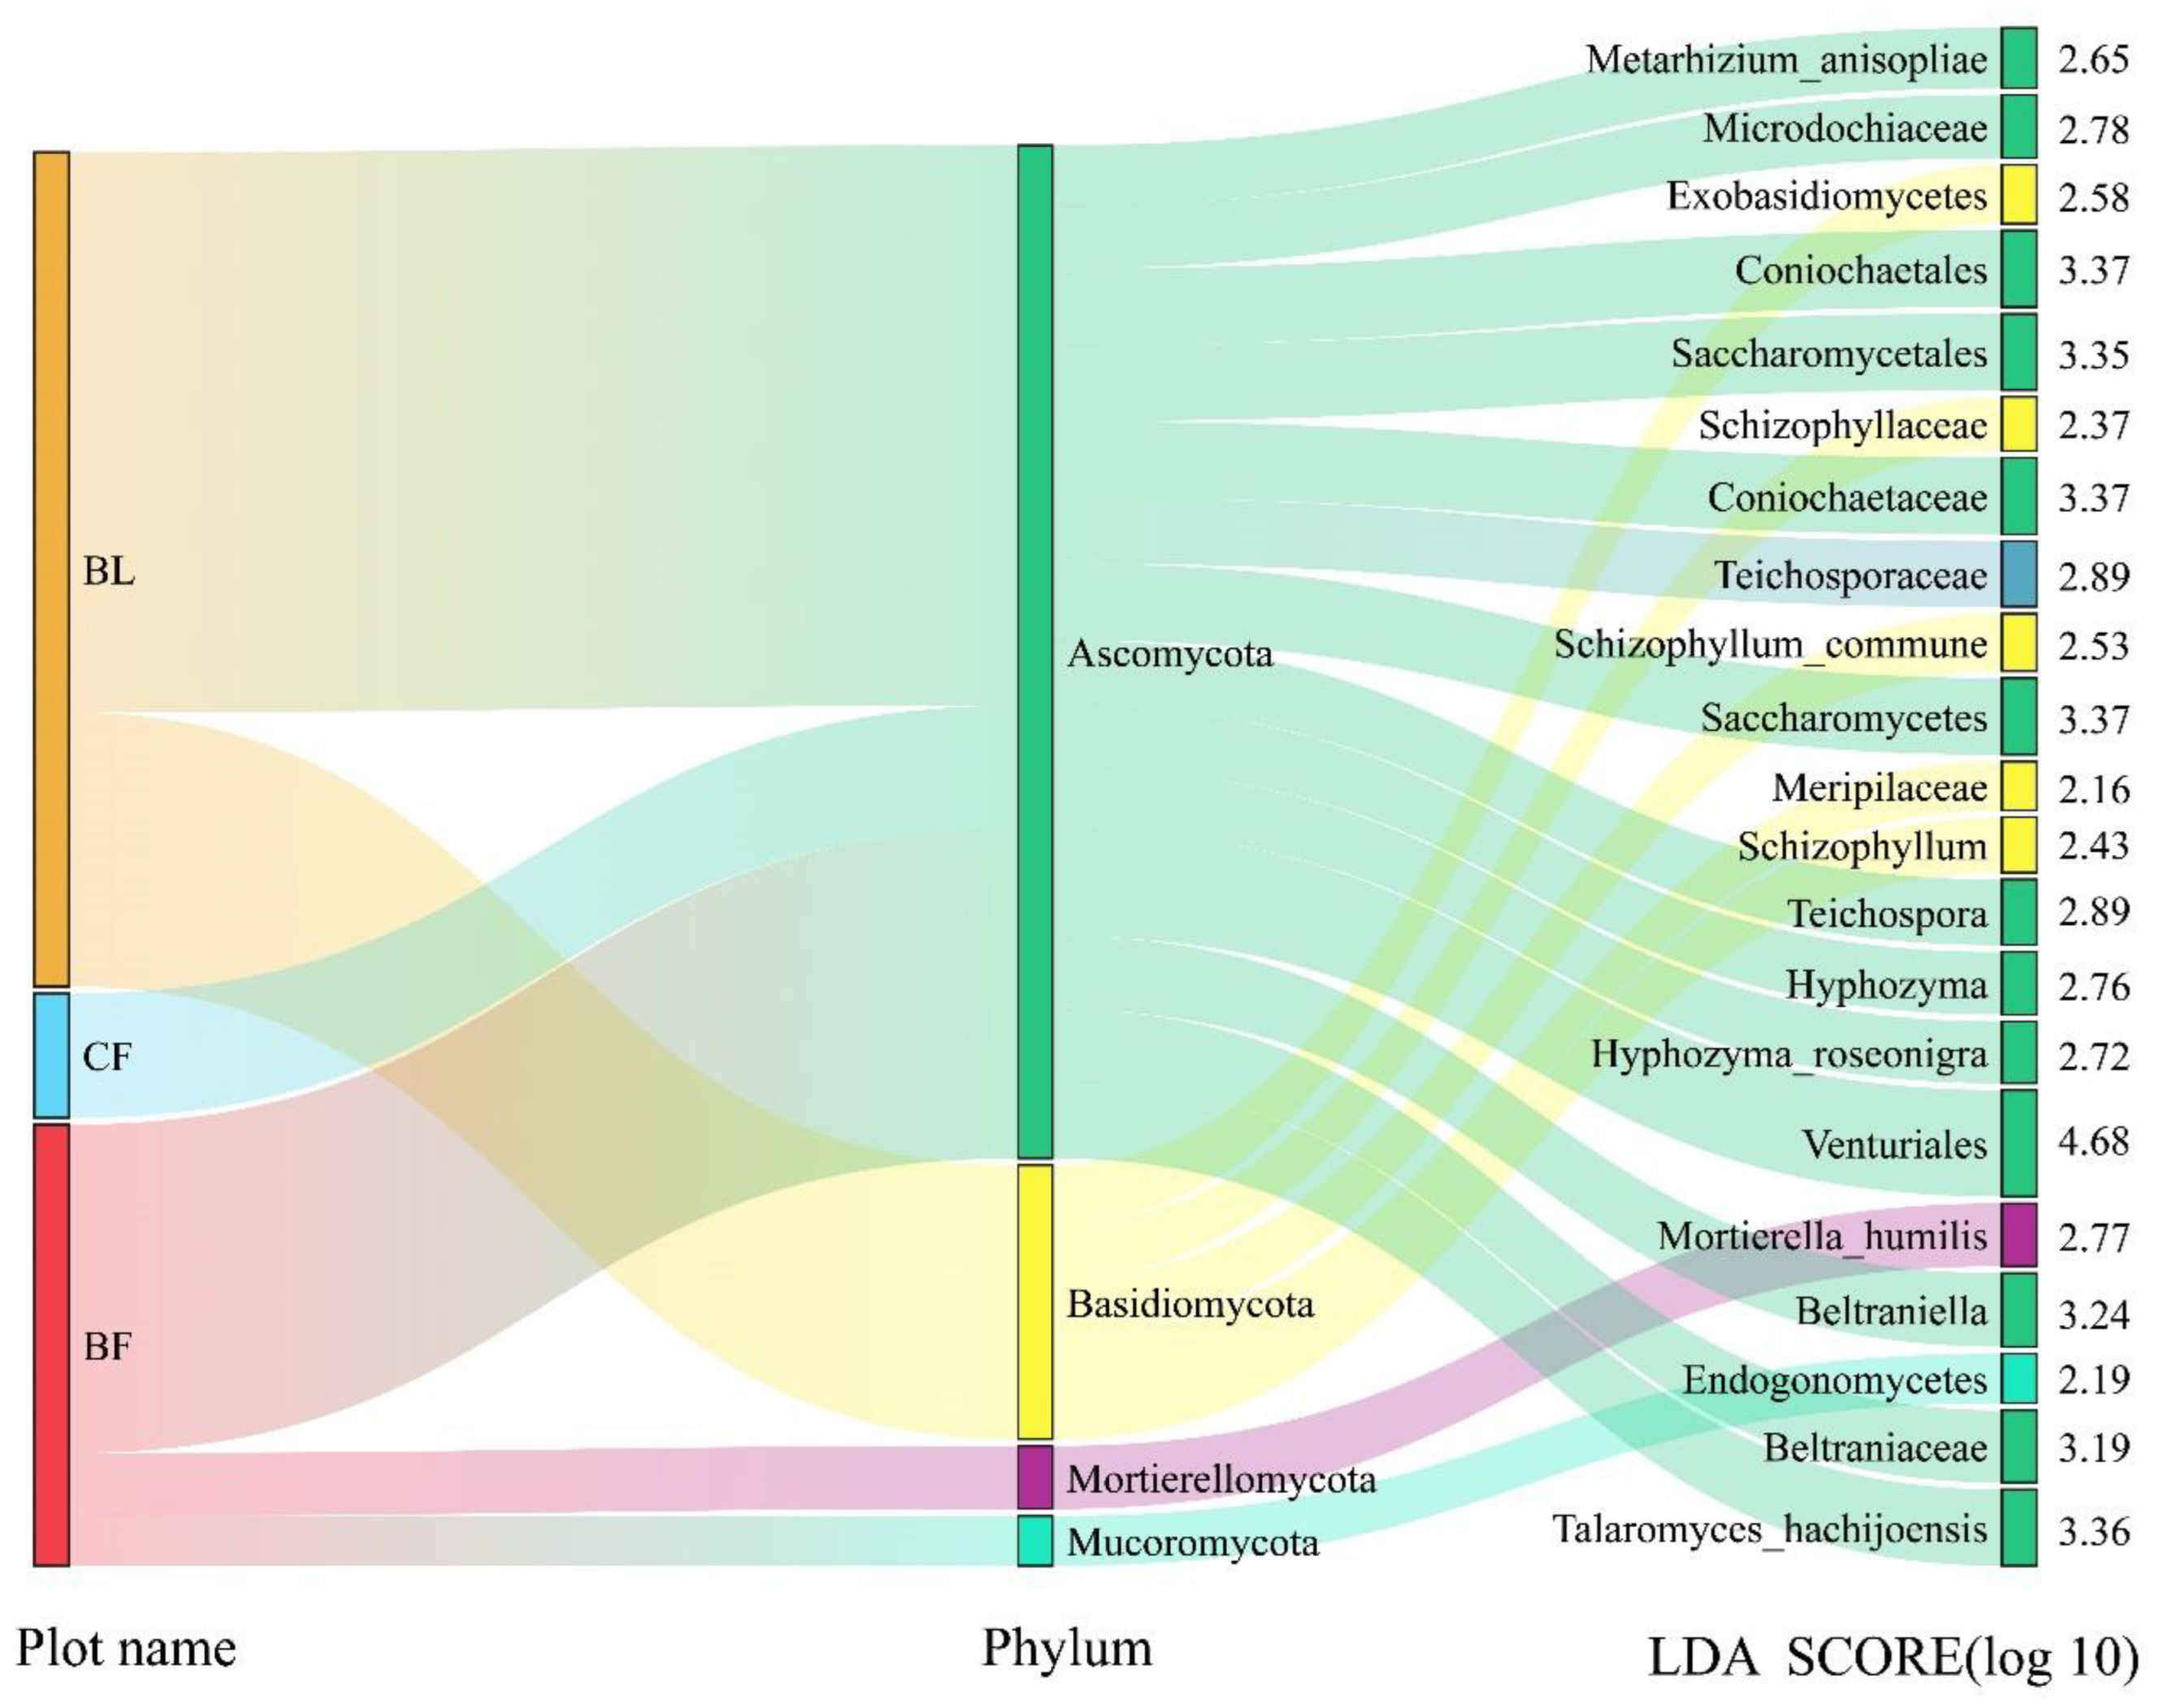
3.5. Analysis of Beta Diversity and Indicator Species of Soil Fungi

Figure 6 shows the principal coordinates analysis (PCA) of soil fungi based on the Bray–Curtis distance and combined with the non-parametric Adonis (permanova) test. The soil fungal samples of the BL, CF, and BF types had no overlapping areas, while the Bray–Curtis distance of the samples was relatively far, indicating significant differences in the soil fungal community structure during the BL, CF, and BF stages (R2 = 0.326, p = 0.025). The CBF type soil fungal samples had overlapping areas with the BL, CF, and BF types, and Bray’s distance was relatively close, suggesting that the community structure of CBF closely resembled that of BL, CF, and BF.
Figure 7 illustrates the results of the linear discriminant analysis effect size (LEfSe) analysis, highlighting fungal family genus indicators in various vegetation types. The fungal family genus indicators in BL were Metarhizium anisopliae, Microdochiaceae, Exobasidomycetes, Coniochaetales, Saccharomycetes, Schizophyllaceae, Coniochaetaceae, Teichosporaceae, Schizophylla, Meripilaceae, Schizophyllum, and Teichospora. The fungal family genus indicators in CF were Hypozyma and Hypozyma roseonigra. The fungal indicator families in BF were Venturales, Mortierella humilis, Beltraniella, Endogonomycetes, Beltraniaceae, and Talaromyces hachijoensis. There were no fungal family genus indicators in the mixed coniferous and CBF. This is consistent with the principal coordinates analysis (PCA) based on the Bray–Curtis distance (Figure 6), which shows that the soil fungal samples of CBF were similar to those of the other three vegetation types. These fungal family genus indicators included 14 species from the Ascomycota phylum, 5 species from the Basidiomycota phylum, and 2 species from the Follicularia and Mortierella phylum, respectively. These fungal family genus indicators were one of the main reasons for the structural differences in soil fungal communities.

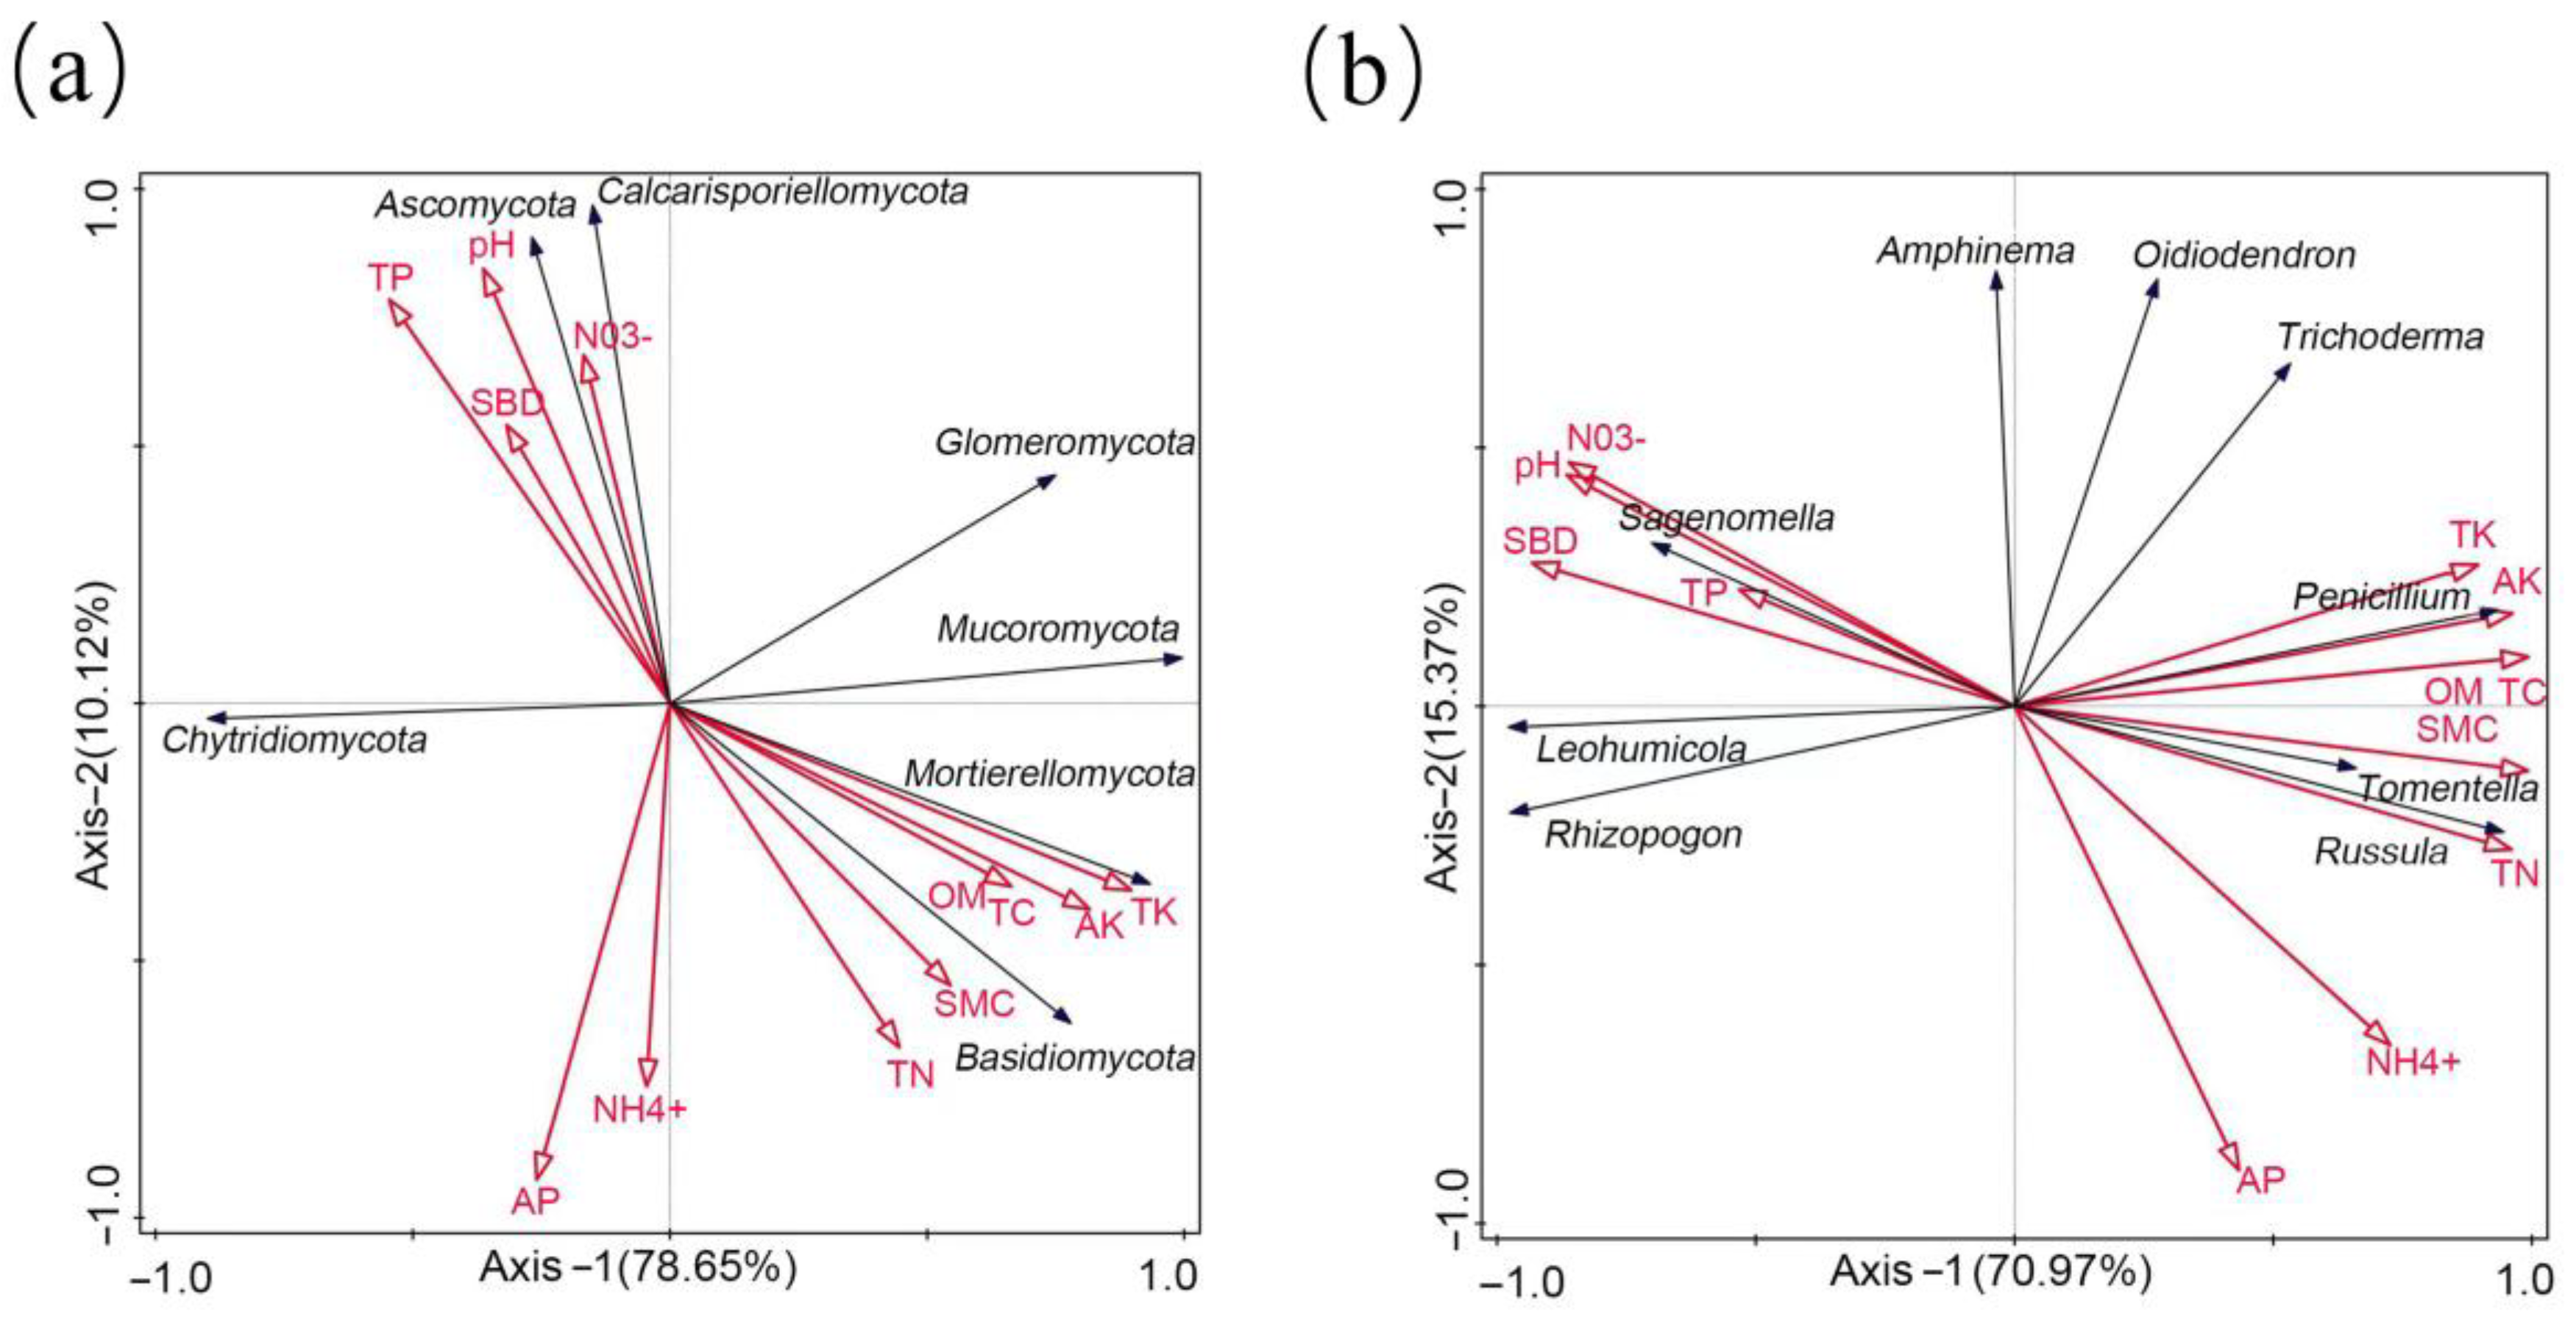
3.6. Correlation Analysis between Soil Fungi and Soil Properties

Figure 8 shows the redundancy analysis (RDA) of the soil physicochemical properties and relative abundance of fungi. The interpretation rates of the first and second axes were over 85%, indicating that both axes can reflect the impact of the soil’s environmental factors on soil fungi. The Envfit test analysis showed that the key soil factors affecting soil fungal communities were pH (R2 = 0.565, p = 0.013), TN (R2 = 0.681, p = 0.002), and TC (R2 = 0.701, p = 0.001). The classification level of phylum: Ascomycota and Mucor were positively correlated with soil TP, SBD, pH, and nitrate nitrogen, while Basidiomycota and Mortierella were positively correlated with soil TN, TC, SOM, TK, AK, and SMC. The relative abundance of the phyla Trichospermata, Chlamydomonas, and Saccharomycota was less affected by soil factors. The classification level of genus: The relative abundance of Sagenomella genus was positively correlated with soil BD, TP, pH, and NN. The relative abundance of Penicillium was positively correlated with soil TK, AK, SOM, and TC.

3.7. Notes on the Functions of Soil Fungal Communities

The FUNGuild database was employed to forecast the nutrient types associated with soil fungi in typical vegetation types during the process of vegetation restoration in degraded red soil areas. Figure 9 shows that the functions of soil fungi were similar, but there were differences in abundance. There were significant variances in the main nutrient types of soil fungal communities among different vegetation types. The relative abundance of undefined saprophytes, plant pathogens, and animal pathogens was higher in eroded bare land. The relative abundance of ectomycorrhizal-undefined saprophytic fungi, ectomycorrhizal fungal parasitic fungi plant saprophytic fungi woody saprophytic fungi, and animal pathogenic fungi fungal parasitic fungi-undefined saprophytic fungi was higher in CBF. The relative abundance of ectomycorrhizal fungi, plant saprophytic fungi—wood saprophytic fungi, and wood saprophytic fungi was highest in BF. It can be seen that the nutrient structure of soil fungal communities in different vegetation types was basically similar, with saprophytic and symbiotic nutrient types as the main nutrient types. However, there were differences in the relative abundance of nutrient types in different soil fungal communities, that is, each vegetation type had its own characteristic nutrient types.
A correlation analysis showed that soil TN, NH4+, and SMC were significantly positively correlated with fungal functional abundance. Additionally, plant saprophytic fungi—wood saprophytic fungi were positively correlated with soil TN and SMC, while wood saprophytic fungi were positively correlated with soil TN, NH4+, and SMC. There was a significant negative correlation between soil pH, TC, NO3, AK, and BD and soil fungal functional abundance.
In addition, the analysis results based on functional genera indicated that the top ten fungal genera in terms of relative abundance belonged to the genera of ectomycorrhizal fungi and saprophytic nutrients, respectively (Figure 10). The relative abundance of ectomycorrhizal fungi and saprophytic nutrients varied between different vegetation restoration stages, with significant changes in relative abundance for certain specific genera. The genera with the highest abundance of saprophytic nutrients were Penicillium and Leohumicola, which are mainly distributed in BF and eroded BL. Leohumicola was the dominant genus of ectomycorrhizal fungi, with the highest relative abundance in BF. Overall, the relative abundance of ectomycorrhizal fungi, except for the Rhizopogon genus, is increasing. The relative abundance of saprophytic nutrients in different vegetation restoration stages did not show significant changes, indicating that each vegetation restoration stage has saprophytic nutrient bacteria belonging to a specific environment.

3.8. Model Analysis Driving Changes in Soil Fungal Communities

The partial least squares model was used to reveal the possible pathways by which vegetation restoration stages and soil physicochemical properties affected soil fungal communities and fungal functions (Figure 11). By adjusting the partial least squares model, we ultimately obtained three best fit models with goodness-of-fit values of Alpha diversity (0.839) (Figure 11a), Beta diversity (0.874) (Figure 11b), and fungal function (0.797) (Figure 11c), respectively. Figure 10a shows that there was a significant positive effect relationship between typical vegetation types and soil’s total nutrients (0.936), available nutrients (0.976), and soil physical properties (0.942) during the vegetation restoration process. Soil fungal Alpha diversity had a positive effect relationship with typical vegetation types (0.884), total nutrients (0.636), and available nutrients (0.404) during the vegetation restoration process, and a negative effect relationship with soil’s physical properties (−0.112).
Figure 11b shows that there was a significant positive effect relationship between typical vegetation types and soil total nutrients (0.942), available nutrients (0.976), and soil physical properties (0.916) during vegetation restoration. There was a positive effect relationship between soil fungal Beta diversity and vegetation restoration types (0.930), total nutrients (0.166), and available nutrients (0.807), and a negative effect relationship with soil physical properties (−0.017). Figure 11c shows that there was a significant positive effect relationship between vegetation restoration types and total soil nutrients (0.939), available nutrients (0.977), and soil physical properties (0.942).
The functional structure of soil fungi had a positive effect relationship with vegetation restoration types (0.716), soil physical properties (0.298), and available nutrients (0.716), while there was a negative effect relationship with total nutrients (−0.341). These results indicate that vegetation restoration and soil physicochemical properties were direct factors that played an important role in shaping soil fungal diversity, community structure, and fungal function, while vegetation restoration can serve as indirect factors that affect soil fungal community changes by affecting soil physicochemical properties.

4. Discussion

Our study found that the restoration of vegetation in the degraded areas of intense erosion in southern red soil improved the physical and chemical characteristics of the soil, as indicated by a decrease in SBD, and an increase in TN, TC, SOM, ammonium nitrogen, and soil SMC (Table 1). Previous studies have shown that vegetation restoration can enhance soil’s physical and chemical properties and that there is a coupling association between soil nutrient accumulation and the forest vegetation restoration process [24,25]. We used a partial least squares model to analyze and validate the impact of vegetation restoration on soil quality, and the results showed a significant positive effect relationship between the vegetation restoration stage and soil quality. Meanwhile, our study revealed that the restoration of vegetation had little effect on the content of TP and AP in the soil. There was no significant difference in the TP content between evergreen broad-leaved forests and eroded bare land. Phosphorus deficiency may occur at different stages of vegetation restoration. Hence, it is advisable to focus on P supplementation during the vegetation restoration process in degraded red soil areas.
Our study found that the composition of dominant fungi in soil during different vegetation restoration stages was similar, with the dominant phyla being Ascomycota and Basidiomycota (Figure 3 and Figure 4). Other studies have also found that Ascomycota and Basidiomycota are dominant microbial groups under acidic soil conditions [26,27], which is consistent with our research results. We found that the relative abundance of Ascomycota increased first and then decreased with the succession of the vegetation restoration stage, reaching its maximum value in pure P. massoniana forests (Figure 3). The Ascomycota phylum is mostly saprophytic and nutritious fungi, which are the main decomposers of SOM. The dead leaves of pure forests of P. massoniana are mainly composed of difficult-to-decompose cellulose and lignin, providing a material and energy source for the Ascomycota phylum. We also found that the relative abundance of Basidiomycota increased with the succession of vegetation restoration stages, with the most prominent being in broad-leaved forests (Figure 3). Basidiomycota relies more on decayed wood components to obtain sufficient carbon sources for survival and reproduction [28]. In this study, although the abundance of Mucormycota, Mortierellomycota, Glomeromycota, Calcarisporillomycota, and Chytridiomycota accounted for a relatively low percentage of the four typical sample plots, these strains, which were important for plant nutrient uptake and stress alleviation, and Glomeromycota, in particular, were an important symbiont for most plant species [29].
However, the surface litter increased with the vegetation restoration stages, greatly supplementing the carbon sources required for the wood components of Basidiomycota. Our study found that the dominant genera of soil fungi in different vegetation restoration stages were Penicillium and Leohumicola genera (Figure 4). Penicillium and Trichoderma fungi can activate plant defense responses to resist plant pathogens, as well as activate plant hormones regulated by endogenous mechanisms to promote plant growth [30]. The abundance of Penicillium and Trichoderma species in the coniferous and broad-leaved forest stages of this study area significantly increased (Figure 4). Therefore, we infer that in the later stage of vegetation restoration, the vegetation community structure tends to stabilize, and the soil has strong resistance to soil-borne pathogens. Cotton fungus and Leohumicola genera belong to ectomycorrhizal fungi and play important roles in litter decomposition, nutrient cycling, and energy flow [31]. The abundance of cotton fungus and Leohumicola genera in the coniferous and broad-leaved mixed forest and broad-leaved forest stages was relatively high, and the rich litter layers in the coniferous and broad-leaved forest provided a material basis for them.
Our study found that vegetation restoration increased the Alpha diversity index of soil fungi but did not reach a significant level between different stages. Many studies have found that the fungal communities’ Alpha diversity, to some extent, is highly resistant to environmental changes, meaning that the Alpha diversity of soil fungal communities remains stable during environmental changes [32,33,34]. Other studies have also shown that soil fungal diversity in mixed forests is superior to other vegetation stages [35]. In addition, an increase in Alpha diversity weakens the dominant position of the most competitive fungal species in the ecosystem and promotes the harmonious symbiosis of soil fungal communities [36]. This study found that the Alpha diversity index of the coniferous broad-leaved mixed forest was higher than that of the other stages. There were no indicator species of soil fungi in the coniferous broad-leaved mixed forest stage, indicating that there was less competition among soil fungal groups in the coniferous broad-leaved mixed forest stage. They were in a harmonious symbiotic state. The Beta diversity of soil fungi showed significant differences in the soil fungal communities of eroded bare land, pure Pinus massoniana forest, and broad-leaved forest, while the soil fungal communities of coniferous and broad-leaved mixed forests were similar to the other three vegetation restoration stages (Figure 5). This is because the coniferous and broad-leaved mixed forest was an intermediate stage between the pure Pinus massoniana forest and broad-leaved forest and had a similar vegetation community structure to both stages. In addition, our partial least squares model analysis also indicated that the vegetation restoration stage can improve soil Alpha diversity by affecting the soil environment, and the differences in soil environment are also one of the reasons for the differences in soil fungal Beta diversity.
The contents of soil C, N, and pH were the main driving factors for the diversity of soil fungal communities. We also found that soil pH, TN, and TC were key factors affecting the changes of fungal communities in acidic red soil (Figure 8). Previous studies have shown that soil pH has the greatest impact on the saprophytic trophic Ascomycota phylum [37]. Under acidic soil conditions, the higher the soil pH, the higher the relative abundance of Ascomycota phylum. We also confirm this view that under acidic conditions in southern red soil, the relative abundance of Ascomycota phylum was positively correlated with soil pH, and the highest relative abundance of Ascomycota phylum was found in coniferous forests. Basidiomycota was positively correlated with soil nutrients. With vegetation restoration, soil nutrients were improved, and the relative abundance of Basidiomycota was greater in the later stage of vegetation restoration than in the early stage. The Tomentella and Russula genera were positively correlated with soil moisture content, TC, and TN, while negatively correlated with soil pH (Figure 9). This is because the Tomentella and Russula genera are ectomycorrhizal fungi that provide nutrients and water for parasitic tree species.
Moreover, studies have shown that the increase of ectomycorrhizal fungi leads to a faster rate of soil C and N cycling, increasing soil carbon and nitrogen content [38]. The saprophytic fungus Penicillium is positively correlated with higher soil nutrients, which may be attributed to their functional characteristics related to the decomposition of leaf litter in the soil [39]. Through the results of a redundancy analysis, we found that the soil environment was more closely related to dominant fungi and was most affected by changes in the soil environment. Furthermore, rare fungi were mainly affected by specific soil environments at each vegetation restoration stage. With the restoration of vegetation, the improved soil environment is conducive to the diverse distribution of soil fungal functions. A further analysis of fungal communities based on fungal functional trophic types can better understand their ecological functional specificity [40].
Ectomycorrhizal fungi can establish a mutually beneficial relationship with plant roots, promoting plant absorption of nutrients and water. Saprophytic fungi can decompose complex organic matter and transform nutrients [41]. Broad-leaved forests have rich vegetation types, and their roots can combine with more ectomycorrhizal fungi, which in turn promote the mutually beneficial symbiosis of nutrients to provide water and nutrients for parasitic tree species [42]. The abundance of plant and animal pathogens decreases with the succession of vegetation restoration stages, with the largest erosion in bare land and the smallest in broad-leaved forests (Figure 11). This is because the more complex the vegetation community structure, the better the soil health, thereby inhibiting the development of pathogen communities.

5. Conclusions

With the restoration of vegetation in eroded and degraded areas of red soil, soil nutrients and quality have been improved, but attention should be paid to phosphorus supplementation in the process of vegetation restoration. During the process of vegetation restoration, the soil-dominant microbial communities of typical vegetation types are similar. The dominant microbial communities are Ascomycota, Basidiomycota, Penicillium, and Leohumicola genera, but there are certain differences in relative abundance, and each has its own fungi of specific families and genera. The diversity of soil fungi shows an upward trend with vegetation restoration; notable differences have been observed in soil fungal communities across vegetation types. The composition and abundance of soil fungal communities are significantly correlated with soil factors such as pH, TN, and TC, which are the main factors affecting fungi. With the restoration of vegetation, the main nutrient functional fungi of soil saprophytic and ectomycorrhizal fungi gradually increase, accelerating nutrient cycling and enhancing vegetation community diversity.

Author Contributions

X.H. (Xiaolong Hou) designed and supervised the experimental set-up. J.Y. and Q.L. performed the field experiments and lab work. X.H. (Xiaolong Hou) and J.Y. drafted the manuscript. L.Z. performed the statistical and bioinformatics analyses. X.H. (Xuejie Han), T.H.F. and L.L. revised and edited the paper. All authors have read and agreed to the published version of the manuscript.

Funding

This work was supported by the National Key Research and Development Program of China (2023YFF1304403), the Natural Science Foundation of Fujian Province (2022J01121), the National Natural Science Foundation of China (32201572), and the Interdisciplinary Integration Fund of Fujian Agriculture and Forestry University (KFb22035XA).

Data Availability Statement

Data are contained within the article.

Acknowledgments

We express our gratitude to the Soil and Water Conservation Center of Changting County, Longyan City, Fujian Province, for generously providing the experimental materials.

Conflicts of Interest

The authors declare no conflicts of interest.

References

  1. Zhang, Y.; Qin, X.; Qiu, Q.; Yu, R.G.; Yao, Y.F.; Li, H.Q.; Shao, M.G.; Wei, X.R. Soil and water conservation measures reduce erosion but result in carbon and nitrogen accumulation of red soil in Southern China. Agric. Ecosyst. Environ. 2023, 346, 108346. [Google Scholar] [CrossRef]
  2. Gao, J.; Shi, C.Q.; Yang, J.Y.; Yue, H.; Liu, Y.; Chen, B.Z. Analysis of spatiotemporal heterogeneity and influencing factors of soil erosion in a typical erosion zone of the southern red soil region, China. Ecol. Indic. 2023, 154, 110590. [Google Scholar] [CrossRef]
  3. Chen, S.; Zha, X.; Bai, Y.H.; Wang, L. Evaluation of soil erosion vulnerability on the basis of exposure, sensitivity, and adaptive capacity: A case study in the Zhuxi watershed, Changting, Fujian Province, Southern China. Catena 2019, 177, 57–69. [Google Scholar] [CrossRef]
  4. Hou, X.L.; Han, H.; Tigabu, M.; Cai, L.P.; Meng, F.R.; Liu, A.Q.; Ma, X.Q. Changes in soil physico-chemical properties following vegetation restoration mediate bacterial community composition and diversity in Changting, China. Ecol. Eng. 2019, 38, 171–179. [Google Scholar] [CrossRef]
  5. Feng, T.J.; Wei, T.X.; Saskia, D.K.; Zhang, J.J.; Bi, H.X.; Wang, R.S.; Ping, W. Long-term effects of vegetation restoration on hydrological regulation functions and the implications to afforestation on the Loess Plateau. Agric. For. Meteorol. 2023, 330, 109313. [Google Scholar] [CrossRef]
  6. Schwartz, N.B.; Medvigy, D.; Tijerin, J.; Pérez-Aviles, D.; Rivera-Polanco, D.; Pereira, D.; German, V.G.; Leland, W.; Du, D.; Arnold, L.; et al. Intra-annual variation in microclimatic conditions in relation to vegetation type and structure in two tropical dry forests undergoing secondary succession. Forest Ecol. Manag. 2022, 511, 120132. [Google Scholar] [CrossRef]
  7. Wen, H.; Ni, S.M.; Wang, J.G.; Cai, C.F. Changes of soil quality induced by different vegetation restoration in the collapsing gully erosion areas of southern China. Int. Soil Water Cons. 2021, 9, 195–206. [Google Scholar] [CrossRef]
  8. Xia, J.B.; Ren, R.R.; Chen, Y.P.; Sun, J.; Zhao, X.M.; Zhang, S.Y. Multifractal characteristics of soil particle distribution under different vegetation types in the Yellow River Delta chenier of China. Geoderma 2020, 368, 114311. [Google Scholar] [CrossRef]
  9. Guan, H.L.; Fan, J.W.; Lu, X.L. Soil specific enzyme stoichiometry reflects nitrogen limitation of microorganisms under different types of vegetation restoration in the karst areas. Appl. Soil Ecol. 2022, 169, 104253. [Google Scholar] [CrossRef]
  10. Yan, J.K.; Lou, L.; Bai, W.H.; Zhang, S.Q.; Zhang, N.N. Phosphorus deficiency is the main limiting factor for re-vegetation and soil microorganisms in Mu Us Sandy Land, Northwest China. Sci. Total Environ. 2023, 900, 165770. [Google Scholar] [CrossRef]
  11. Buee, M.; Reich, M.; Murat, C.; Morin, E.; Nilsson, R.H.; Uroz, S.; Martin, F. Pyrosequencing analyses of forest soils reveal an unexpectedly high fungal diversity. New Phytol. 2009, 184, 449–456. [Google Scholar] [CrossRef] [PubMed]
  12. Li, H.; Ostermann, A.; Karunarathna, S.C.; Xu, J.C.; Hyde, K.D.; Mortimer, P.E. The importance of plot size and the number of sampling seasons on capturing macrofungal species richness. Fungal Biol. 2018, 122, 692–700. [Google Scholar] [CrossRef] [PubMed]
  13. Blagodatskaya, E.; Kuzyakov, Y. Mechanisms of real and apparent priming effects and their dependence on soil microbial biomass and community structure: Critical review. Biol. Fertil. Soils 2008, 45, 115–131. [Google Scholar] [CrossRef]
  14. White, C.; Tardif, J.C.; Adkins, A.; Staniforth, R. Functional diversity of microbial communities in the mixed boreal plain forest of central Canada. Soil Biol. Biochem. 2005, 37, 1359–1372. [Google Scholar] [CrossRef]
  15. Saetre, P.; Baê, E. Spatial variation and patterns of soil microbial community structure in a mixed spruce-birch stand. Soil Biol. Biochem. 2000, 32, 909–917. [Google Scholar] [CrossRef]
  16. Nagati, M.; Roy, M.; Manzi, S.; Richard, F.; Desrochers, A.; Gardes, M.; Bergeron, Y. Impact of local forest composition on soil fungal communities in a mixed boreal forest. Plant Soil 2018, 432, 345–357. [Google Scholar] [CrossRef]
  17. Liu, W.W.; Yu, L.F.; Yan, L.B.; Liu, N.; Zhao, Q. Composition of soil fungi communities in different stages of vegetation restoration in Karst rocky desertification area. Ecol. Environ. Sci. 2019, 28, 669–675. [Google Scholar] [CrossRef]
  18. Wang, J.C.; Rhodes, G.; Huang, Q.W.; Shen, Q.R. Plant growth stages and fertilization regimes drive soil fungal community compositions in a wheat-rice rotation system. Biol. Fertil. Soils 2018, 54, 731–742. [Google Scholar] [CrossRef]
  19. Marín, C.; Godoy, R.; Valenzuela, E.; Schloter, M.; Wubet, T.; Boy, J.; Gschwendtner, S. Functional land-use change effects on soil fungal communities in Chilean temperate rainforests. J. Soil Sci. Plant Nutr. 2017, 17, 985–1002. [Google Scholar] [CrossRef]
  20. Liu, L.L.; Zhou, G.Y.; Dang, P.; Chen, J.; Shang, H.; Qiu, L.Q.; Zhu, N.H. Differences of soil fungal community structure under three afforestation modes in rocky desertification region of Western Hunan Province. Acta Ecol. Sin. 2022, 42, 4150–4159. [Google Scholar] [CrossRef]
  21. Li, P.F.; Zhang, X.C.; Hao, M.D.; Cui, Y.X.; Zhang, Y.J.; Zhu, S.L. Effects of vegetation restoration on soil physicochemical properties, enzyme activities, and fungal community of reconstructed soil in a mining area on Loess Plateau. Bull. Soil Water Conserv. 2019, 39, 1–7. [Google Scholar] [CrossRef]
  22. Zeng, X.H.; Zhang, W.J.; Cao, J.S.; Liu, X.P.; Shen, H.T.; Zhao, X. Changes in soil organic carbon, nitrogen, phosphorus, and bulk density after afforestation of the Beijing-Tianjin Sandstorm Source Control program in China. Catena 2014, 118, 186–194. [Google Scholar] [CrossRef]
  23. Lu, R.K. Analytical Methods of Soil and Agricultural Chemistry; China Agricultural Science and Technology Press: Beijing, China, 1999; pp. 107–150. [Google Scholar]
  24. He, X.X.; Sheng, M.Y.; Wang, L.J.; Zhang, S.L.; Luo, N. Effects on soil organic carbon accumulation and mineralization of long-term vegetation restoration in Southwest China karst. Ecol. Indic. 2022, 145, 109622. [Google Scholar] [CrossRef]
  25. Zhang, H.F.; Wang, L.L.; Liu, H.M.; Zhao, J.N.; Li, G.; Wang, H.; Lai, X.; Li, J.; Xiu, W.M.; Yang, D.L. Nitrogen deposition combined with elevated precipitation is conducive to maintaining the stability of the soil fungal diversity on the Stipa baicalensis steppe. Soil Biol. Biochem. 2018, 117, 135–138. [Google Scholar] [CrossRef]
  26. Sun, Y.J.; He, C.X.; Xu, G.P.; Mo, L.; Gu, D.X.; Yao, Y.F.; Huang, Y.Q. Soil microbial properties under different vegetation types in Shiwan Mountain, Guangxi Province. Chin. J. Ecol. 2015, 34, 352–359. [Google Scholar] [CrossRef]
  27. Qiao, S.S.; Zhou, Y.N.; Chai, B.F.; Jia, T.; Li, C. Characteristics of fungi community structure and genetic diversity of forests in Guandi Mountains. Environ. Sci. 2017, 38, 2502–2512. [Google Scholar] [CrossRef]
  28. Tang, J.; Mo, Y.H.; Zhang, J.Y.; Zhang, R.D. Influence of biological aggregating agents associated with microbial population on soil aggregate stability. Appl. Soil Ecol. 2011, 47, 153–159. [Google Scholar] [CrossRef]
  29. Větrovský, T.; Kolaříková, Z.; Lepinay, C.; Hollá, S.A.; Davison, J.; Fleyberková, A.; Gromyko, A.; Jelínková, B.; Kolařík, M.; Krüger, M.; et al. GlobalAMFungi: A global database of arbuscular mycorrhizal fungal occurrences from high-throughput sequencing metabarcoding studies. New Phytol. 2023, 240, 2151–2163. [Google Scholar] [CrossRef]
  30. Macías-Rodríguez, L.; Contreras-Cornejo, H.A.; Adame-Garnica, S.G.; Del-Val, E.; Larsen, J. The interactions of Trichoderma at multiple trophic levels: Inter-kingdom communication. Microbiol. Res. 2020, 240, 126552. [Google Scholar] [CrossRef]
  31. Wu, D.; Zhang, M.M.; Peng, M.; Sui, X.; Li, W.; Sun, G.Y. Variations in soil functional fungal community structure associated with pure and mixed plantations in typical temperate forests of China. Front. Microbiol. 2019, 10, 1636. [Google Scholar] [CrossRef]
  32. She, W.W.; Bai, Y.X.; Zhang, Y.Q.; Qin, S.G.; Feng, W.; Sun, Y.F.; Zheng, J.; Wu, B. Resource availability drives responses of soil microbial communities to short-term precipitation and nitrogen addition in a desert shrubland. Front. Microbiol. 2018, 9, 186. [Google Scholar] [CrossRef] [PubMed]
  33. Li, D.H.; Li, X.W.; Su, Y.; Li, X.Z.; Yin, H.F.; Li, X.J.; Guo, M.J.; He, Y.X. Forest gaps influence fungal community assembly in a weeping cypress forest. Appl. Microbiol. Biot. 2019, 103, 3215–3224. [Google Scholar] [CrossRef] [PubMed]
  34. Zhang, Y.H.; Xu, X.L.; Li, Z.W.; Liu, M.X.; Xu, C.H.; Zhang, R.F.; Luo, W. Effects of vegetation restoration on soil quality in degraded karst landscapes of southwest China. Sci. Total Environ. 2019, 650, 2657–2665. [Google Scholar] [CrossRef] [PubMed]
  35. Jiang, Y.Q.; Chen, C.R.; Xu, Z.Z.; Liu, Y.Q. Effects of single and mixed species forest ecosystems on diversity and function of soil microbial community in subtropical China. J. Soil. Sediments. 2012, 12, 228–240. [Google Scholar] [CrossRef]
  36. Weber, C.; Lockhart, J.; Charaska, E.; Aho, K.; Lohse, K.A. Bacterial composition of soils in ponderosa pine and mixed conifer forests exposed to different wildfire burn severity. Soil Biol. Biochem. 2014, 69, 242–250. [Google Scholar] [CrossRef]
  37. Stephanie, N.; Hawkes, C.V. Tree species, spatial heterogeneity, and seasonality drive soil fungal abundance, richness, and composition in Neotropical rainforests. Environ. Microbiol. 2016, 18, 4662–4673. [Google Scholar] [CrossRef]
  38. Courty, P.E.; Buee, M.; Diedhiou, A.G.; Frey-Klett, P.; Le Tacon, F.; Rineau, F.; Turpault, M.P.; Uroz, S.; Garbaye, J. The role of ectomycorrhizal communities in forest ecosystem processes: New perspectives and emerging concepts. Soil Biol. Biochem. 2010, 42, 679–698. [Google Scholar] [CrossRef]
  39. Ceci, A.; Pinzari, F.; Russo, F.; Persiani, A.M.; Gadd, G.M. Roles of saprotrophic fungi in biodegradation or transformation of organic and inorganic pollutants in co-contaminated sites. Appl. Microbiol. Biotechnol. 2019, 103, 53–68. [Google Scholar] [CrossRef]
  40. Detheridge, A.P.; Comont, D.; Callaghan, T.M.; Bussell, J.; Brand, G.; Gwynn-Jones, D.; Scullion, J.; Griffith, G.W. Vegetation and edaphic factors influence rapid establishment of distinct fungal communities on former coal-spoil sites. Fungal Ecol. 2018, 33, 92–103. [Google Scholar] [CrossRef]
  41. Becquer, A.; Garcia, K.; Amenc, L.; Rivard, C.; Dore, J.; Trives-Segura, C.; Szponarski, W.; Russet, S.; Bazeza, Y.; Lassalle-Kaiser, B.; et al. The Hebeloma cylindrosporum HcPT2 Pi transporter plays a key role in ectomycorrhizal symbiosis. New Phytol. 2018, 220, 1185–1199. [Google Scholar] [CrossRef]
  42. Nguyen, N.H.; Song, Z.W.; Bates, S.T.; Branco, S.; Tedersoo, L.; Menke, J.; Schilling, J.S.; Kennedy, P.G. FUNGuild: An open annotation tool for parsing fungal community datasets by ecological guild. Fungal Ecol. 2016, 20, 241–248. [Google Scholar] [CrossRef]
Figure 1. Schematic diagram of the geographical location of the experimental sample plot. BL: bare land; CF: coniferous forest; CBF: conifer-broad-leaved forest; BF: broad-leaved forest.
Forests 15 00089 g001
Figure 2. Soil sequencing results of different vegetation restoration types. (a) Multi samples Shannon–Wiener curves. (b) Venn diagram depicting common and unique OTU in different vegetation types. BL: bare land; CF: coniferous forest; CBF: conifer-broad-leaved forest; BF: broad-leaved forest.
Forests 15 00089 g002
Figure 3. Phyla-level composition of soil fungi phylum in different vegetation restoration types. (a) Bar chart of soil fungal composition. (b) Visual circle of soil fungal composition. The upper half of the circle represents the fungal composition during different vegetation restoration stages, the outer colored band represents different vegetation restoration stages, the inner colored band represents different fungal species, and the length of the colored band represents the relative abundance of the species during the vegetation restoration stage. The lower half of the circle represents the distribution proportion of different species in different vegetation restoration stages at the taxonomic level. The outer colored band represents different species, the inner colored band represents different vegetation restoration stages, and the length of the colored band represents the distribution proportion of the species in the vegetation restoration stage. BL: bare land; CF: coniferous forest; CBF: conifer-broad-leaved forest; BF: broad-leaved forest.
Forests 15 00089 g003
Figure 4. Genera-level compositions of soil fungi in different vegetation restoration types. (a) Bar chart of soil fungi in classification level composition. (b) Visual circle of soil fungal composition. BL: bare land; CF: coniferous forest; CBF: conifer-broad-leaved forest; BF: broad-leaved forest.
Forests 15 00089 g004
Figure 5. Alpha diversity of soil fungi in different vegetation restoration types. BL: bare land; CF: coniferous forest; CBF: conifer-broad-leaved forest; BF: broad-leaved forest.
Forests 15 00089 g005
Figure 6. Principal component analysis (PCA) diagram of soil fungal community in different vegetation restoration types. BL: bare land; CF: coniferous forest; CBF: conifer-broad-leaved forest; BF: broad-leaved forest.
Forests 15 00089 g006
Figure 7. Indicator species analysis of different vegetation restoration types. The left image shows the evolutionary branch of fungal species, while the right image shows the LDA score. BL: bare land; CF: coniferous forest; BF: broad-leaved forest.
Forests 15 00089 g007
Figure 8. Redundancy analyses of fungal phylum and genus classification levels and soil physicochemical properties in different vegetation restoration types. (a) The classification level of the phylum fungi. (b) The classification level of the genus fungi.
Forests 15 00089 g008
Figure 9. Fungal functions and their relationship with soil physicochemical properties in different vegetation restoration types. BL: bare land; CF: coniferous forest; CBF: conifer-broad-leaved forest; BF: broad-leaved forest.
Forests 15 00089 g009
Figure 10. Relative abundance of (a) ectomycorrhizal fungi and (b) saprophytic fungi in different vegetation restoration types. BL: bare land; CF: coniferous forest; CBF: conifer-broad-leaved forest; BF: broad-leaved forest.
Forests 15 00089 g010
Figure 11. Partial least squares model analysis of fungal communities and soil physicochemical properties. V. N, C, K, NH4, NO3, AK, BD, and SMC represent vegetation restoration stage, nitrogen, carbon, potassium, ammonium nitrogen, nitrate nitrogen, available potassium, soil bulk density, and soil moisture content, respectively. Chao and ACE represent Alpha diversity, while PCO1 and PCO2 represent Beta diversity. US, PSWS, and WS represent undefined saprophytic fungi, plant saprophytic and wood rot fungi, and wood rot fungi. (ac) represents the figure number and the order of the figure. * represents the significant effect of connected paths in partial least squares models (p < 0.05).
Forests 15 00089 g011
Table 1. Soil’s physical and chemical properties of different vegetation restoration types. Values are means ± standard error (n = 9). Different small letters in the same row indicate significant differences among different vegetation types at p < 0.05. * The vegetation cover BL: bare land; CF: coniferous forest; CBF: conifer-broad-leaved forest; BF: broad-leaved forest.
Cover *BLCFCBFBF
pH 4.78 ± 0.37 a4.84 ± 0.14 a4.70 ± 0.12 a4.66 ± 0.09 a
TC g·kg11.83 ± 0.22 d5.06 ± 0.50 c6.30 ± 0.48 b9.66 ± 1.80 a
TN g·kg−10.22 ± 0.03 c0.26 ± 0.01 c0.32 ± 0.03 b0.58 ± 0.09 a
TP g·kg−10.16 ± 0.01 ab0.17 ± 0.02 a0.15 ± 0.01 b0.15 ± 0.01 b
TK g·kg−13.32 ± 0.17 b4.89 ± 0.50 b9.95 ± 1.90 a10.41 ± 2.43 a
SOM g·kg−13.16 ± 0.20 d8.72 ± 0.58 c10.87 ± 1.10 b16.65 ± 2.07 a
NH4+ mg·kg−113.22 ± 1.74 c15.67 ± 1.25 b13.19 ± 0.83 c22.55 ± 1.89 a
NO3 mg·kg−13.59 ± 0.24 b4.65 ± 0.09 a4.29 ± 0.18 a3.67 ± 0.82 b
AK mg·kg−110.48 ± 0.59 d12.67 ± 0.94 c16.81 ± 1.46 b18.41 ± 1.05 a
AP mg·kg−16.21 ± 0.37 b6.85 ± 0.05 ab6.83 ± 0.05 ab7.45 ± 1.22 a
SBD g·cm−31.52 ± 0.10 a1.43 ± 0.17 ab1.43 ± 0.08 ab1.32 ± 0.08 b
SMC %15.30 ± 1.31 c16.91 ± 0.34 bc18.01 ± 1.02 b21.92 ± 1.47 a
Disclaimer/Publisher’s Note: The statements, opinions and data contained in all publications are solely those of the individual author(s) and contributor(s) and not of MDPI and/or the editor(s). MDPI and/or the editor(s) disclaim responsibility for any injury to people or property resulting from any ideas, methods, instructions or products referred to in the content.

