Abstract
Our work aimed to compare the chip pile volumes calculated by laser ground scanning, UAV technology, and laser ground measurement and also to determine the accuracy, speed, and economic efficiency of each method. The large chip pile was measured in seven different ways: band measurement, laser measurement with Vertex, global navigation satellite system, handheld mobile laser scanner, terrestrial laser scanner, drone, and smartphone with a light detection and ranging sensor. All the methods were compared in terms of accuracy, price, user-friendliness, and time required to obtain results. The calculated pile volume, depending on the method, varied from 2588 to 3362 m3. The most accurate results were provided by the terrestrial laser scanning method, which, however, was the most expensive and the most demanding in terms of collecting and evaluating the results. From a time and economic point of view, the most effective methods were UAVs and smartphones with LiDAR.
1. Introduction
In the last decade, there has been dynamic development in precision forestry methods, which include the use of geographic information systems, global positioning systems, drones, laser ground scanning, and other technologies for measuring, collecting, processing, and analyzing data related to forest stands and ecosystems [1,2]. In addition to facilitating more detailed and accurate management of forest resources and the creation of forest growth models, these tools also enable a precise inventory of forest assets and quantification of harvested wood volume and forest biomass. They, thus, contribute to the more efficient management of forestry operations and provide better tools for the sustainable use and protection of forest resources. These approaches are increasingly important in connection with the growing need for the efficient use of natural resources and biodiversity protection [3,4,5,6].
Wood is a material of biological origin that cannot be characterized as uniform in terms of its morphology and growth process. The process of its growth is long term and highly diverse, depending on many factors. In connection with the inventory and economic management of forest resources, it is necessary to quantify the amount of wood in various stages of the production process and during its processing [7,8]. Various methods, including standard dendrometric procedures and precision forestry methods, are employed for this purpose [9,10]. However, in recent years, digital photogrammetry, laser ground scanning (terrestrial laser scanning and mobile terrestrial laser scanning approaches), and unmanned aerial vehicles (UAVs or drones) have demonstrated significant progress in this area.
These modern technologies offer advantages such as accuracy, speed, lower costs, and reduced demand on professional personnel compared with traditional dendrometric and appraiser approaches. Additionally, their imaging and resolution capabilities have significantly improved in recent years, increasing their flexibility and effectiveness in assessing forest status and parameters [11,12,13]. The existing studies have primarily focused on the use of precision forestry methods in assessing the health status of forest stands [14,15,16] and monitoring conditions within them [17,18]. Furthermore, they have concentrated on analyzing tree crowns [19,20,21], identifying individual tree species, and mapping deviations in their height growth [22,23], as well as quantifying tree diameters at a height of 1.3 m [24]. UAV technologies have also been utilized for forest fire monitoring and management [25,26].
These studies demonstrate the broad range of possibilities for utilizing precision forestry methods in assessing the state and quality of forests. Depending on the chosen method, they also illustrate their suitability for quantifying forest tree biomass as well as harvested wood [27,28,29].
During the processing of harvested wood into forest chips, large-capacity storage piles are often created in industrial plants, primarily for the production of heat or electricity. Operations often purchase biomass from multiple suppliers, resulting in variations in the quality, technical parameters, mass, or volume indicators. Due to the continuous intake and withdrawal of biomass in storage, the amount of stored biomass changes on a daily, often hourly, basis [30,31]. Accurately measuring and recording the current amount of biomass in storage, thus, presents a technological challenge. Some operations record biomass amounts based on truck weight parameters and weighing upon delivery, along with subsequent consumption recording. Others irregularly measure stored quantities using manual methods with a band tape measure and mathematical volume calculation, or laser manual measurement followed by calculation in specialized software.
The first studies aimed at determining the stored volume of biomass in large-capacity piles using UAVs were published in 2016 [32]. Our work aimed to compare several methods, which include laser ground scanning, UAV technology, ground photogrammetry, and laser ground measurement, in determining the volume of a large-capacity pile of forest chips in the operation of a municipal heating plant. Other works have also explored the use of drones for measuring the volume of forest chips, as well as the application of LiDAR-based photo-optical methods in iPad mobile devices [33,34]. There are currently photo-optical or photogrammetry-based solutions in the market developed for the same purpose, e.g., Pix4D Mapper, which automatically provides the volume estimation [35].
Our goal is not only to compare the volumes calculated by different methods but also to determine the accuracy, speed, and economic efficiency of individual methods. These results should help operations in deciding which method to choose considering their own economic and logistical possibilities for the effective management and monitoring of forest biomass stocks.
2. Materials and Methods
Determining the methodological approaches of individual biomass quantification methods was one of the important goals we aimed to achieve. The precise determination of the methodological procedures for each method and the possibility of their repetition are also important benefits of this work, as they represent a basic prerequisite for their use in measuring the volumes of piles of forest chips.
2.1. Study Site
The wood chip pile examined in this study is located at Hriňovská energetická, s.r.o., which operates the central heat production and distribution system in Hriňová, Slovakia (Figure 1). The pile of wood chips covers an area of approximately 30 × 60 m, and its height varies from approximately 5 to 15 m.
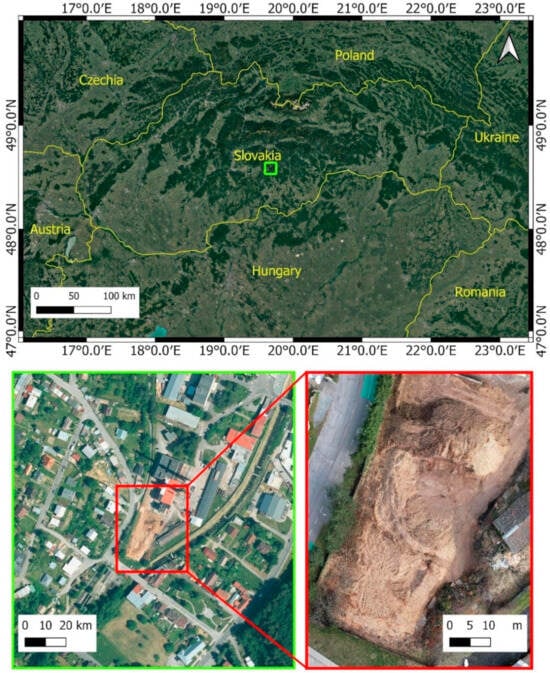
Figure 1.
Study site with wood chip pile in Hriňová, Slovakia.
This company provides heating for both the municipal and industrial sectors in the town. Hriňovská energetická, s.r.o., is one of the first Slovak energy companies to use biomass as an energy source, and today, it produces most of its heat from woody biomass. To ensure accurate data collection, the shape and volume of the pile were maintained throughout the experiment. Based on the company’s current records, there were 3325 m3 of wood chips in the pile on the day the experiment was conducted.
The operation of the heating plant in question takes place continuously, so during the heating season, biomass is continuously consumed from the stored pile and simultaneously imported by mobile means. Therefore, it was necessary to carry out all the measurements on a single day, during which the logistic flow was suspended, to ensure that the pile of stored wood chips did not change in volume or spatial parameters. The measurement was made on 21 March 2024. The weather was clear and windless. The average atmospheric temperature during the measurements was 17.3 °C, and the average relative humidity was 33.3%.
2.2. Measurement Methodology
The large chip pile was measured in seven different ways: band measurement, laser measurement with Vertex Laser Geo, global navigation satellite system (GNSS) measurement, handheld mobile laser scanner, terrestrial laser scanner, drone (UAV), and smartphone with a light detection and ranging (LiDAR) sensor. Each approach requires a different methodological setting, method of use, and subsequent processing and evaluation of the results. The difficulty of the volume estimation by the various methods was evaluated according to the subjective collective opinion of operators experienced in collecting, processing, and evaluating data of all the types used.
2.2.1. Band Tape Measurement
For the measurement of distances and heights for the tape-measurement-based volume estimation, a band with 50 m length was used. Before the process, a floor plan of the pile was sketched for orientation and to assign the measured lengths to the correct sides. During the measurements, the tape measure was kept adjacent to the surface of the wood chips. The heights of the pile were measured at regular intervals and at significant irregularities in height. To determine the height of the chips at the marked points, the horizontal and diagonal lengths were measured, from which the height was later derived [36,37]. In total, 13 height measurements were taken. These measurements, along with the corresponding lengths, were recorded on the plan (Figure 2). For the subsequent office calculations, the sketch was divided into smaller sections to facilitate a detailed analysis of the volume. The pile was segmented into 4 geometric shapes to enable precise volume estimation. The total time required to measure the lengths and heights using the measuring tape was 27 min.
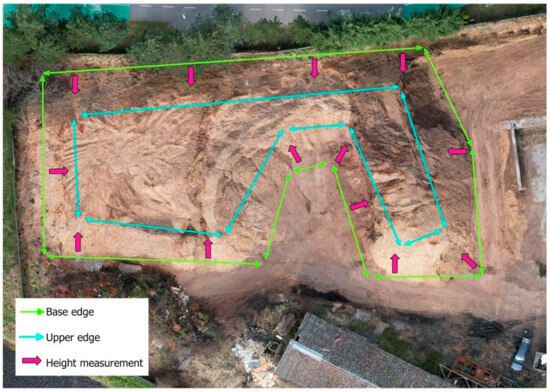
Figure 2.
Tape measurement scheme.
2.2.2. Vertex Laser Geo Device
As the first approach to estimate the volume of the wood chip pile, we used the Vertex Laser Geo laser rangefinder (Haglöf Sweden AB). The “Map Target” function was utilized for this purpose. Prior to the measurement process, a preliminary survey was conducted to determine the optimal standpoints for the subsequent point measurements. The number of Vertex standpoints was based on the irregularity and size of the pile, while the number of sections depended on the number of standpoints. In this study, the measurements were performed from nine distinct standpoints (Figure 3). The quantity of the measured points depended on the height and irregularity of the wood chip pile. It was imperative to capture the entire pile from multiple perspectives to construct an accurate three-dimensional (3D) model.
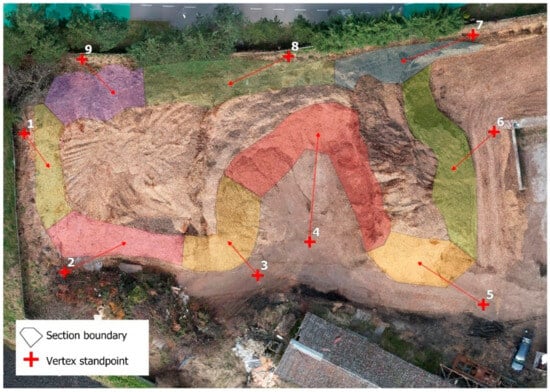
Figure 3.
Location of the laser rangefinder Vertex Laser Geo’s measured points and corresponding sections.
From each standpoint, the measurements were initially taken at the lower edge of the pile and then 0.5 m above the lower edge, with an additional 2–3 lines of target points higher to comprehensively capture each section of the pile. The number of lines of target measurement points depended on the height of the measured section. In total, 369 points were measured for the volume estimation (Table 1). The entire measurement process was completed in 51 min. The coordinates of the measured points were subsequently exported as a .txt file.

Table 1.
Number of target measurement points from each reference point (Ø—average number of points; ∑—sum of points).
2.2.3. GNSS Device
For the purpose of calculating the volume of the pile of wood chips using the RTK method (real-time kinematic) of global navigation satellite system (GNSS) technology, a detailed preliminary survey was required in order to effectively capture of the shape of the pile. The Stonex GNSS Receiver S700A (Stonex Paderno Dugnano, Italy) with the Cube-a app was used. In the first step, the pile was rounded along its lower edge, so that its shape on the ground was appropriately captured. This was followed by a similar procedure at the top of the pile. A total of 57 points were measured for this purpose (Figure 4), of which 23 points were on the ground and 34 on pile; the relatively straight edges were thoughtfully generalized and the distinctive structures at the top were measured to adequately describe the protruding structures. The total data collection time was 24 min. The positions of the points (X, Y, Z) were exported from the device as a .txt file.
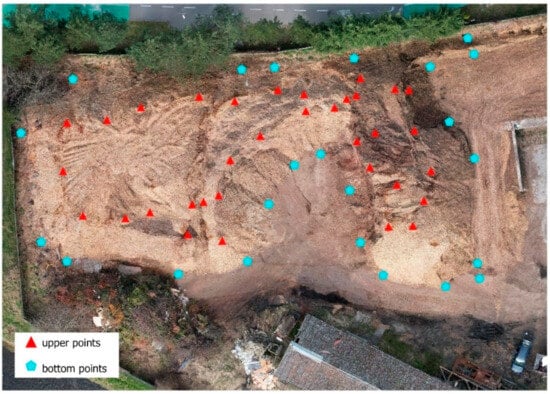
Figure 4.
Location of GNSS Stonex S700A receiver-measured points.
2.2.4. Handheld Mobile Laser Scanner
From the category of handheld mobile laser scanners (HMLSs), we used the Stonex X120GO (Stonex Paderno Dugnano, Italy). The Stonex X120GO SLAM has a collection rate of 320,000 points per second, a relative accuracy of 6 mm, and a range of 120 m. It uses an RGB camera with a resolution of 5 MPx and a viewing angle of 200° × 100°; as a result, the scanner can color point clouds. The devices use simultaneous localization and mapping (SLAM) technology to create a 3D map of the environment and localize themselves in it, and, based on their position relative to the captured objects, they subsequently modify the image of the environment.
It is controlled by the GO app in which scans are updated and displayed simultaneously, and it was possible to see the progress of scanning directly on the mobile phone. We used two versions of the data collection options: with an RTK module and without an RTK module. The trajectory was identical for both modifications (Figure 5). The total data collection time without RTK was 5:43 min; for the RTK version, it was 6:47 min. For the post-processing of the scanned data, the GOpost 1.0.5. software was used. During processing, we used default parameters and workflow. As part of the post-processing in the RTK method, a file containing information about the position of the device during the scan was added to the point cloud creating process.
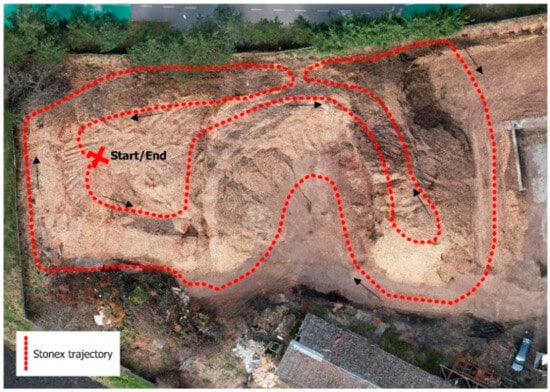
Figure 5.
Stonex X120GO SLAM data collection path.
2.2.5. Terrestrial Laser Scanner
From the category of terrestrial laser scanners, the Riegl VZ1000 (Riegl Laser Measurement Systems GmbH, Horn, Austria) and the Riegl VZ600i (Riegl Laser Measurement Systems GmbH, Horn, Austria) were used. The Riegl VZ1000 has a very long range of over 1400 m, with an accuracy of 8 mm and a precision of 5 mm. The device used was not equipped with cameras, so the resulting point clouds were not colored. We employed the 360-degree panorama method at 300 KHz and scanned from a total of 10 positions (Figure 6).
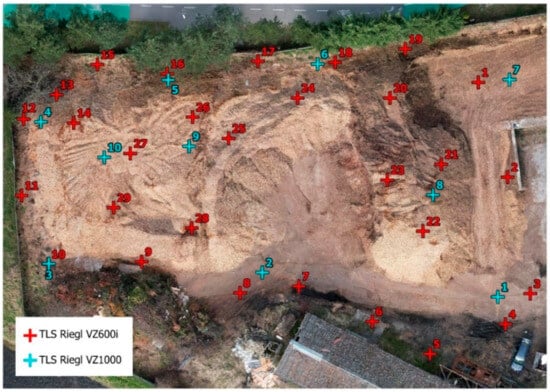
Figure 6.
Riegl VZ1000 and Riegl VZ600i scanner positions.
The total data collection time was 1 h and 17 min. The Riegl VZ600i is latest generation of professional TLS, with a range of 1000 m and accuracy up to 3 mm. The main differences compared with the VZ1000 are the scanning speed (60 positions per hour), the inertial unit that simplifies the merging of the scans, and the internal RGB camera. We employed the 360-degree panorama method at 600 KHz and scanned from a total of 29 positions (Figure 6). The total data collection time was 39 min. The collected data were processed in the Riegl RiScan 2.1.2 program.
2.2.6. Unmanned Aerial Vehicle
From the group of UAVs, the DJI Air 2S was utilized for imagery. We chose this device because of its low cost and lightweight (595 g) with its high-resolution (20 mpx) camera. Before the flight, we laid out reference targets and reference geodetic prisms on the pile and close to the pile for scaling purposes. The Map Pilot Pro planning application was used for the flight. The flight was carried out at a 25 m height above the ground with parallel strips to achieve at least 90% forward overlap and at least 80% lateral overlap (Figure 7 and Figure 8) [37]. The ground resolution achieved was 0.71 cm/px. The total data collection time was 7 min and 23 s, during which 145 photos were collected.
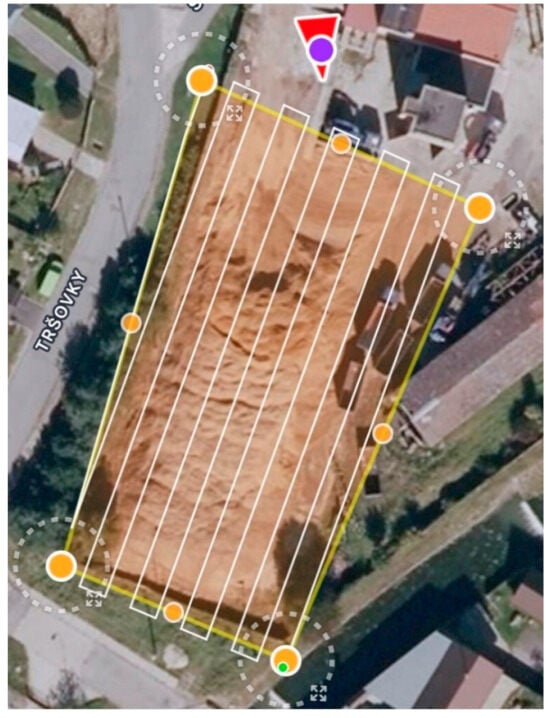
Figure 7.
DJI Air 2S flight plan from Map Pilot Pro app.
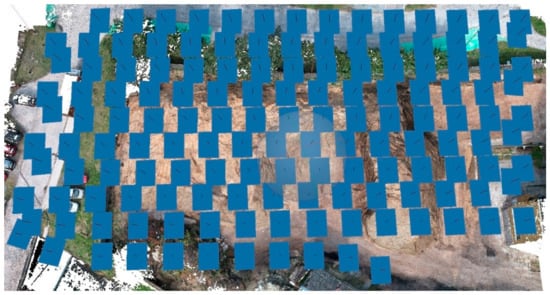
Figure 8.
Visualizations of the camera positions above UAV-based point cloud.
For the photogrammetric point cloud construction from the UAV imagery, we used the Agisoft Photoscan 2.0.3. software package. Firstly, the photos were aligned to groups of photos with reduced resolution, and then, the groups were aligned in a set resolution. To align the pictures, the high accuracy and generic pair preselection options were used. After successful alignment of the imagery, a dense point cloud was created with a high quality of performance and aggressive depth filtering. After successfully generated a dense point cloud, we proceeded to adjust the scale of objects based on the reference sticks. Red and white parts divided the reference geodetic prisms into 20 cm long sectors, on which were manually placed two markers defining just such a distance, which, after a subsequent update of the point cloud, were adjusted to scale [38,39,40].
2.2.7. Smartphone with LiDAR Sensor
From the LiDAR-equipped smartphones, we chose the iPhone 15 Pro Max. At the time when the data were collected, this device was the latest and was considered the best in its category. The device is equipped with a 48 Mpx camera and a LiDAR sensor with a 5 m range. The data collection was carried out with the 3D Scanner App using LiDAR advanced settings. The medium confidence interval was set with a scanning range of 5 m, no masking, and a resolution of 40 mm. Total data collection time was 5 min. The post-processing of the collected data took place directly on the smartphone using the 3D Scanner App, from which the finished point cloud was exported in the .LAS format in the second step. The trajectory for data collection is seen in Figure 9. Unlike other mobile devices that utilize SLAM technology, the iPhone does not offer such functionality. This limitation means that, if you scan the same area twice, the data will not be refined but overwritten, which is problematic since errors in mobile scanning typically increase with time. Additionally, the iPhone’s scanning range is limited to 5 m, which had to be taken into account.
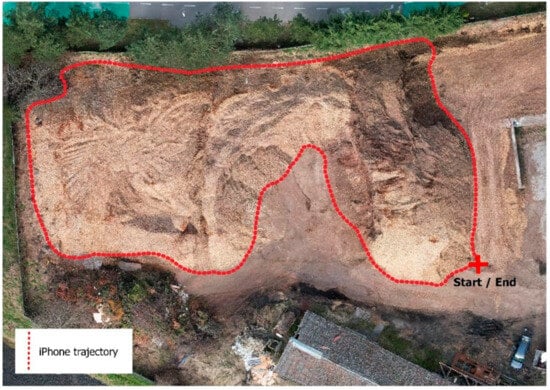
Figure 9.
iPhone 15 Pro Max data collection path.
3. Data Processing and Results
The data collected from all the seven methods had to be evaluated using the mentioned software and then processed into a comparable output.
3.1. Volume Estimation
As the data were collected by three different approaches, the basic procedure for calculating the final pile volume required slight variations due to the nature and quality of the input data. Depending on how the volume was calculated, we identified three basic categories of calculation: manual calculation based on the measurement of a line by a tape, calculation based on points (GPS, Vertex), and calculation based on a point cloud. To ensure absolute correctness of the results, the 3D Survey software (Version 2.18.1; Ljubljana, 2024) was used to determine the final volume for all methods except the tape method. As this experiment was conducted in a fully operational plant, it was not possible to completely remove the chip pile to record the reference plane needed for calculating the quantity of volume in stock. However, since the warehouse is situated on a flat surface with a concrete subfloor, we used a TLS-based (Riegl VZ600i) interpolated minimum-value surface as the reference plane.
3.1.1. Tape-Based Volume Estimation
Tape measurement was technically the simplest method for volume estimation. The wood chip pile was divided into four geometric shapes for volume estimation (Figure 10). When observing the dimensions of the pile, it was necessary to take into consideration the irregularities of the pile surface. As part of selecting appropriate shapes, irregularities and depressions were mentally smoothed into an average, smooth surface. In terms of time, the method was relatively efficient, with the major part being taken up by the office processing of the measured lengths and heights and the correct division of the pile into suitable geometrical shapes. As part of the office calculations, the pile of wood chips was divided into smaller parts that represented selected geometric shapes. For the purpose of calculating the wood chip pile’s estimated volume, the geometric shape formulas for irregular solids and half-ellipsoids were applied.
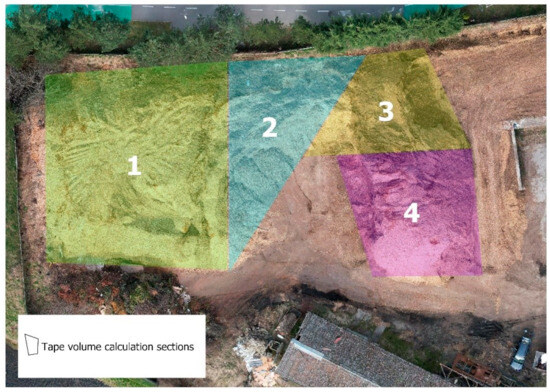
Figure 10.
Dividing the pile into sections.
The total volume of the pile measured using this method was 3053.11 m3. This method has significant limitations in its accuracy, as it does not calculate the volume of the pile objectively but is based on geometrical shapes.
3.1.2. Volume Calculation Based on Measurement of Position of Points
Since the result of data collection by Vertex and GNSS devices is a set of points with defined positions that identify only the breakpoints and edges of the object, in the first step, it was necessary to connect the points logically to each other so that the resulting 3D object corresponds to the real shape of the pile. Based on the triangulated points in the second step, a 3D mesh was created via the mesh tool in the 3D Survey software, i.e., the finished 3D pile surface model consisted of the collection of vertices, edges, and faces that define the shape of the object. Subsequently, the surface under the pile (terrain) was interpolated according to the surrounding environment, and then, the calculation of the differences between the surface and the terrain led to the determination of the resulting pile volume (Figure 11).
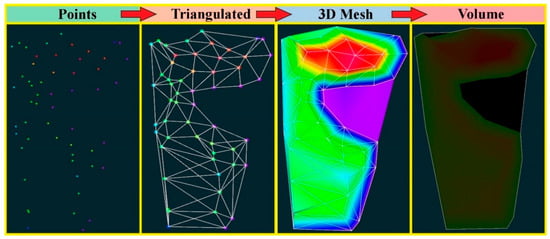
Figure 11.
The breakpoint-based volume calculation workflow visualization in 3D Survey software (the laser rangefinder Vertex Laser Geo and the GNSS Receiver Stonex S700A).
The volume of the pile determined by the Vertex Laser Geo method was 3086.78 m3, and, by the GNSS method with the Stonex S700A Receiver, it was 3126.46 m3. The difference between both methods was 39.7 m3, which is approximately 1.2% of the total pile volume.
3.1.3. Volume Calculation Based on Dense Point Cloud
As the result of the data collection by UAV photogrammetry, TLS, HMLS, and iPhone is a dense 3D point cloud, it was necessary to automatically create a 3D mesh from this cloud, namely, the above-mentioned closed 3D object. As these scanning methods have a high scanning range (from 100 m for HMLS and UAV to almost 1000 m for TLS) a CAD selection mask was created in 3D Survey to cut the target out of the point cloud. The same mask was used for all the methods so that an identical area was always selected for all the methods’ point clouds, which ensured the correctness of the experiment (Figure 12). The selection of the target pile was followed by a procedure identical to that described in the previous sections, in which the terrain beneath the pile was interpolated, forming the basis for the calculation of the resulting volume, and the volume was calculated by the difference between the surface and the terrain.
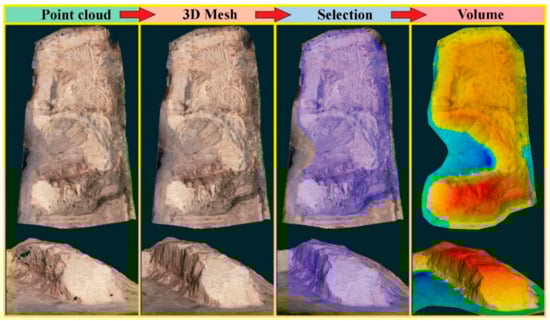
Figure 12.
The dense-point-cloud-based volume calculation workflow visualization in 3D Survey software (TLS Riegl VZ1000 and Riegl VZ600i, UAV DJI Air 2S, HMLS Stonex X120GO, iPhone 15 Pro Max).
The pile volumes determined by these methods ranged from 2588.02 m3 (iPhone 15 Pro Max) to 3362 m3 (Stonex X120GO). From this result, and in comparison with the results of the previous methods, it is clear that the evaluation of the volume using the iPhone 15 Pro Max significantly underestimated the total volume of the large-capacity pile.
3.2. Final Result Comparison
Table 2 shows the resulting comparison of all the detection methods. The measurement time, the price of the equipment used, and the detected volume of the large-capacity pile of chips were selected as parameters for the individual methods. For all the methods, it is also necessary to consider the processing time of the results, which can vary depending on the software used and the experience and knowledge of the operating personnel.
Table 2.
Comparison of different measurement methods. (Measuring time represents the time of data collection in the field. Price is the actual price of the equipment based on quotes and the Internet; we provide a price range due to differences between countries. Difference was calculated as the difference between reference and measured values).
The price of the individual devices varied significantly, ranging from the cheapest solutions (band measurement, UAV method) to the most expensive laser scanning devices, which could cost up to EUR 80 thousand. Altitude maps were also digitally created from the obtained and measured data of the individual methods (except for the band-measurement method). These elevation maps analyze the height distribution of the biomass storage in a large-capacity pile (Figure 13), providing an overview of the spatial distribution details that can identify the individual methods.
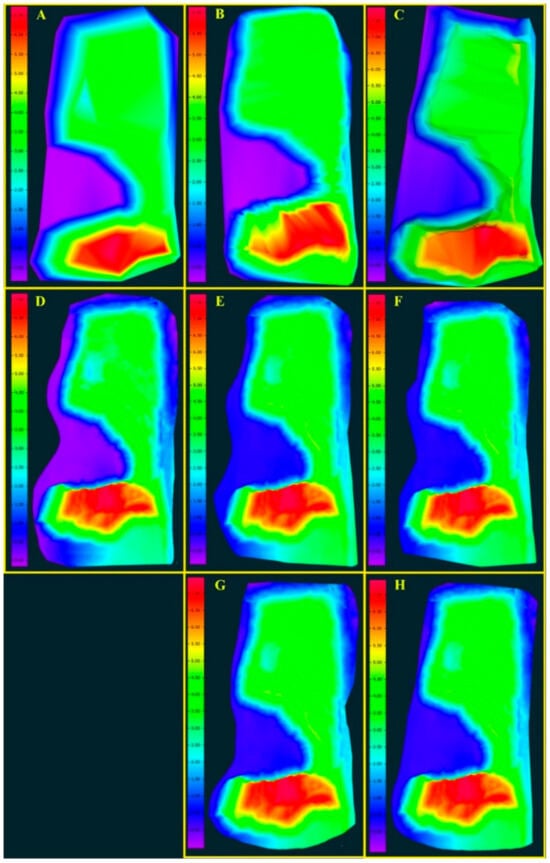
Figure 13.
Height-distribution maps for measurement methods (excluding tape measuring method). (A) Stonex S700A; (B) iPhone; (C) Vertex; (D) DJI Air 25; (E) Stonex X120GO; (F) Stonex X120GO RTK; (G) Riegl VZ1000; (H) Riegl VZ600i.
Figure 14 displays the optimization radar graph of the effectiveness of the individual measurement methods. The evaluation criteria include the purchase price of the equipment, the time required for analysis, the accuracy of the method, and the complexity of handling and evaluating the data.
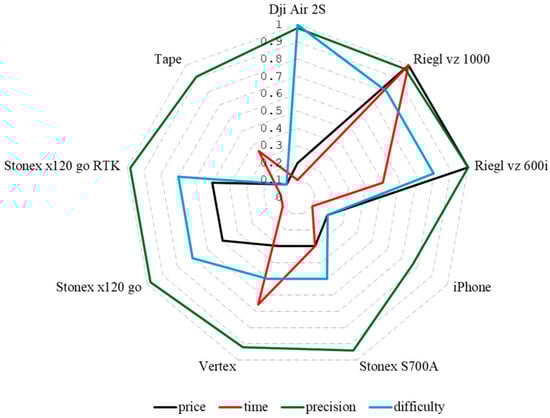
Figure 14.
Analytical radar chart for determining the optimal method in terms of price, time, accuracy, and difficulty criteria.
The highest accuracy was achieved by the TLS Riegl VZ600i; however, this device was also the most expensive, demanding significant operational efforts and time for both data collection and processing.
The DJI Air 2S UAV exhibited the highest difficulty in both data collection and processing. Despite this challenge, it offered high accuracy, time efficiency, and relatively low cost. In contrast, band measurement required the least user intensity for data collection and processing. Comparatively, its accuracy in determining the chip volume exceeded that of the iPhone device, while maintaining lower costs. From a user’s perspective, especially in-field operations, low time and processing requirements are advantageous, particularly when using an iPhone. Regarding user accessibility, accuracy, data collection time, and price, the Stonex X120GO and Stonex X120GO RTK devices placed in similar ranks. The addition of the RTK module did not significantly impact the resulting quality of the volume derivation. While these devices approached the accuracy of the TLS Riegl VZ600i, they were less operationally demanding, had lower prices, and offered significantly higher time efficiency. Comparable results in accuracy were also achieved using the Vertex altimeter and the Stonex S700A GNSS antenna, closely following the HMLS devices. While user-friendliness and price were balanced, the Stonex S700A GNSS antenna required less time for data collection. Overall, the land-based mobile approaches demonstrated high efficiency at a reasonable price, offering accurate volume outputs with low processing complexity. The aerial methods, though efficient in time, accuracy, and price, posed the greatest challenge in processing the obtained data for real results. Among the experimental static ground methods, users must decide whether to prioritize high input costs for the highest accuracy in volume derivation or opt for lower costs, potentially sacrificing accuracy in volume derivation.
4. Discussion
Analytical and measurement methods in the field of precision forestry have been developing dynamically, especially in the last two decades. Until now, precision forestry methods have mainly focused on determining the volume of biomass in the form of standing trees in forest stands or extracted trunks [41,42].
Relatively few studies address the use of precision forestry methods in determining the volume of extracted or subsequently disintegrated wood. In operational practice, the amount of disintegrated biomass, as well as the volume of wood logs, is mostly determined based on mass parameters and subsequent conversion with conversion coefficients according to the type of wood, relative humidity, etc. [43,44]. However, the quick assessment of volume without the need for weighing has advantages, especially for large-capacity piles, which are often found in heating and power plant operations. As part of the operational diary, these operations only have an indicative overview of the current volume at the landfill. The GNSS, UAV, and LiDAR methods have already been tested in determining the volume of other materials, such as laminated limestone [45]. In this study, the approach using the UAV was evaluated as the most accurate method, followed by GNSS and then LiDAR. While the differences in the accuracy of the results among these three approaches were not particularly striking, the UAV-assisted method for chip piles also provided very accurate results. Similarly, the accuracy of this method is also characterized in another paper [32]. The differences between the UAV and GNSS methods for the four pile types ranged from 7.9 to 12%. In our case, the difference in the determined pile volume between UAV and GNSS was only 5.24%. However, this can be influenced by several factors, the most important of which is the type of GNSS receiver used. Compared with LiDAR scanning, the UAV method has also been shown to be more accurate in assessing mineral volumes in stockpiles [46]. When using the Pix4D Mapper software v. 2.2, a deviation of only 2.6% from the actual volume was identified during drone-based mapping [35]. A similar deviation of 1–3% in determining the volume of chip piles with a drone was found when using differential models such as “Structure from Motion” [33]. Laser scanning can achieve high accuracy if the pile is scanned by a 3D scanner. This device uses the 2D laser scanner as the measurement module supplemented by the high-accuracy sensor to scan the 3D morphology surrounding the coal pile. In this case, the differences in the scanned piles of coal compared with the real volume were only up to 0.8% [47].
The problem with methods that demonstrate high accuracy is that they do not provide results immediately or within seconds of focusing on the stack. From an operational point of view, it is also a problem that piles change their volume quickly and frequently due to consumption and further supply of the material stored on them [48]. For practical use in operations, therefore, the time point of obtaining results appears to be one of the most important factors. The solution may also lie in storing materials in closed silos or geometric shapes, the volume of which can be easily calculated by mathematical formulas or modified algorithms [49]. However, this solution would, in many cases, require modification of the operating conditions and sufficient spatial, material, and mechanical equipment. After partial modification, the laser scanning method with subsequent calculation using the angle of repose can also be used for piles in the shape of cones. This method has been validated on buckwheat and maize piles and does not require a point cloud approach [50].
When summarizing the advantages and disadvantages of deriving the volume of a pile of chips by each method, it is important to first consider that inaccuracies in the volume calculation, particularly for simpler methods, stem from the limitations of the methods themselves. The simplest method (tape-based pile volume) offers the benefits of low time requirements and low acquisition costs but only provides an approximate volume estimate. Similarly, volumes derived using the Vertex Laser Geo and data from the S700A GNSS antenna share the advantage of relatively efficient fieldwork and favorable equipment costs. However, the subsequent post-processing steps can be inefficient and challenging compared with other technologies. For example, the purchase price of a UAV and its associated post-processing software is lower than that of a GNSS antenna, and the accuracy of volume determination is higher, with less human labor and time spent on post-processing. Volume estimation using iPhone devices offers an effective trade-off between cost and time, albeit with lower resulting accuracy, which might still be acceptable for tasks requiring only initial or informative estimates. Currently, it is possible to connect the iPhone to an RTK antenna, which could significantly improve model creation and yield much more accurate results. The purchase price of this kit is about EUR 2500, and, together with the necessary iPhone, it can still be considered a low-cost solution. For many users, the DJI Air 2S device and aerial photogrammetry method may be the most efficient way to determine pile volumes. Compared with the most accurate methods (TLSs), this method is time and labor efficient, produces low error in the resulting volume due to the high surface texture detail captured in photographs and the subsequent point cloud, and allows for batch post-processing without operator presence. The same can be said for the Stonex HMLS equipment, though it comes with a significantly higher acquisition cost, which can be a considerable drawback. However, the upside is its very high accuracy and time efficiency. One of the goals of this paper is to provide users with a comprehensive overview of the options available for deriving volume in similar tasks and the expected accuracy of each method.
5. Conclusions
The quick and accurate determination of the volume of large biomass piles, and of other materials, presents a significant challenge in operational practice. This challenge arises not only due to the frequent changes in the volume and shape of the stored material but also because of the time and expertise required by the available solutions. In our work, we analyzed the most modern technological solutions and approaches in terms of factors important for operational practice. It has been confirmed that achieving high accuracy typically requires a more time-consuming and expensive measurement approach. Our analysis provides several decision-making tools to assist in choosing a measurement approach based on the preferences and conditions of a specific operation.
From a time and cost perspective, measurement using a smartphone with a LiDAR sensor and the UAV method emerge as two of the most effective methods, despite requiring more time for processing results. Band measurement, from the user’s standpoint, is relatively straightforward and yields satisfactory accuracy.
Our results, thus, offer practical guidance for specific operations to decide on the measurement method for volume determination, taking into account their operational conditions and available personnel.
Author Contributions
Conceptualization, M.G.; methodology, J.V., D.T., M.S., M.M. and J.C.; software, J.V., D.T., M.S. and J.C.; validation, J.V., T.G. and M.G.; formal analysis, M.G.; investigation, J.V., D.T. and J.C.; resources, M.G., J.V. and T.G.; data curation, J.V.; writing—original draft preparation, M.G. and J.V.; writing—review and editing, M.G. and J.V.; supervision, M.G.; project administration, M.G. and M.L.; funding acquisition, M.G., J.V. and T.G. All authors have read and agreed to the published version of the manuscript.
Funding
This research was funded by Slovak Research and Development Agency, grant numbers APVV-22-0001; APVV-20-0391; APVV-20-0004 and “Cultural and Education Grant Agency Ministry of Education, Research Development, and Youth of the Slovak Republic”, grant number KEGA 004TUZ-4/2023.
Data Availability Statement
Data available on request.
Conflicts of Interest
The authors declare no conflicts of interest.
References
- Kovácsová, P.; Antalová, M. Precision Forestry—Definition and technologies. Sumar. List. 2010, 134, 603–611. [Google Scholar]
- Woo, H.; Cho, S.; Jung, G.; Park, J. Precision Forestry Using Remote Sensing Techniques: Opportunities and Limitations of Remote Sensing Application in Forestry. Korean J. Remote Sens. 2019, 35, 1067–1082. [Google Scholar] [CrossRef]
- Holmgren, P.; Thuresson, T.; Holm, S. Estimating forest characteristics in scanned aerial photographs with respect to requirements for economic forest management planning. Scand. J. Forest Res. 1997, 12, 189–199. [Google Scholar] [CrossRef]
- Pascual, A.; Pukkala, T.; Rodríguez, F.; de-Miguel, S. Using Spatial Optimization to Create Dynamic Harvest Blocks from LiDAR-Based Small Interpretation Units. Forests 2016, 7, 220. [Google Scholar] [CrossRef]
- Talbot, B.; Pierzchala, M.; Astrup, R. Applications of Remote and Proximal Sensing for Improved Precision in Forest Operations. Croat. J. For. Eng. 2017, 38, 327–336. [Google Scholar]
- Latterini, F.; Stefanoni, W.; Venanzi, R.; Tocci, D.; Picchio, R. GIS-AHP Approach in Forest Logging Planning to Apply Sustainable Forest Operations. Forests 2022, 13, 484. [Google Scholar] [CrossRef]
- Seidel, D.; Busch, G.; Krause, B.; Bade, C.; Fessel, C.; Kleinn, C. Quantification of Biomass Production Potentials from Trees Outside Forests—A Case Study from Central Germany. Bioenerg. Res. 2015, 8, 1344–1351. [Google Scholar] [CrossRef]
- Song, Q.; Albrecht, C.M.; Xiong, Z.T.; Zhu, X.X. Biomass Estimation and Uncertainity Quantification From Tree Height. IEEE J. Sel. Top. Appl. 2023, 16, 4833–4845. [Google Scholar] [CrossRef]
- Bertini, G.; Feretti, F.; Fabbio, G.; Raddi, S.; Magnani, F. Quantifying tree and volume mortality in Italian forests. Forest Ecol. Manag. 2019, 444, 42–49. [Google Scholar] [CrossRef]
- Abegg, M.; Bősch, R.; Kükenbrink, D.; Morsdorf, F. Tree volume estimation with terrestrial laser scanning—Testing for bias in a 3D virtual environment. Agr. Forest Meteorol. 2023, 331, 109348. [Google Scholar] [CrossRef]
- Brede, B.; Calders, K.; Lau, S.; Raumonen, P.; Bartholomeus, H.; Herold, M.; Kooistra, L. Non-destructive tree volume estimation through quantitative structure modelling: Comparing UAV laser scanning with terrestrial LiDAR. Remote Sens. Environ. 2019, 233, 111355. [Google Scholar] [CrossRef]
- Demol, M.; Wilkes, P.; Raumonen, P.; Krishna Moorthy, S.M.; Calders, K.; Gielen, B.; Verbeeck, H. Volumetric overestimation of small branches in 3D reconstructions of fraxinus excelsior. Silva Fenn. 2022, 56, 10550. [Google Scholar] [CrossRef]
- Saarinen, N.; Kankare, V.; Vastaranta, M.; Luoma, V.; Pyörälä, J.; Tanhuanpää, T.; Liang, X.; Kaartinen, H.; Kukko, A.; Jaakkola, A.; et al. Feasibility of terrestrial laser scanning for collecting stem volume information from single trees. ISPRS J. Photogramm. Remote Sens. 2017, 123, 140–158. [Google Scholar] [CrossRef]
- Shendryk, L.; Broich, M.; Tullbure, M.G.; McGrath, A.; Keith, D.; Alexandrov, S.V. Mapping individual tree health using full-waveform airborne laser scans and imaging spectroscopy: A case study for a floodplain eucalypt forest. Remote Sens. Environ. 2016, 187, 202–217. [Google Scholar] [CrossRef]
- Michez, A.; Piégay, H.; Lisein, J.; Claessens, H.; Lejeune, P. Classification of riparian forest species and health condition using multi-temporal and hyperspatial imagery from unmanned aerial system. Environ. Monit. Assess. 2016, 188, 146. [Google Scholar] [CrossRef]
- Fraser, B.T.; Congalton, R.G. Monitoring Fine-Scale Forest Health Using Unmanned Aerial Systems (UAS) Multispectral Models. Remote Sens. 2021, 13, 4873. [Google Scholar] [CrossRef]
- Koh, L.P.; Wich, S.A. Dawn of drone ecology: Low-cost autonomous aerial vehicles for conservation. Trop. Conserv. Sci. 2012, 5, 121–132. [Google Scholar] [CrossRef]
- Paneque-Galvez, J.; McCall, M.K.; Napoletano, B.M.; Wich, S.A.; Koh, L.P. Small drones for community-based forest monitoring an assessment of their feasibility and potential in tropical areas. Forests 2014, 5, 1481–1507. [Google Scholar] [CrossRef]
- Ferrarese, J.; Affleck, D.; Seielstad, C. Conifer crown profile models from terrestrial laser scanning. Silva Fenn. 2015, 49, 1106. [Google Scholar] [CrossRef]
- Chianucci, F.; Disperati, L.; Guzzi, D.; Bianchini, D.; Nardino, V.; Lastri, C.; Rindinella, A.; Corona, P. Estimation of canopy attributes in beech forests using true colour digital images from a small fixed-wing UAV. Int. J. Appl. Earth Obs. 2016, 47, 60–68. [Google Scholar] [CrossRef]
- Paris, C.; Kelbe, D.; van Aardt, J.; Bruzzone, L. A Novel Automatic Method for the Fusion of ALS and TLS LiDAR Data for Robust Assessment of Tree Crown Structure. IEEE Trans. Geosci. Remote Sens. 2017, 55, 3679–3693. [Google Scholar] [CrossRef]
- Zarco-Tejada, P.J.; Diaz-Varela, R.; Angileri, V.; Loudjani, P. Tree height quantification using very high resolution imagery acquired from an unmanned aerial vehicle (UAV) and automatic 3D photo-reconstruction methods. Eur. J. Agron. 2014, 55, 89–99. [Google Scholar] [CrossRef]
- Sedliak, M.; Sackov, I.; Kulla, L. Classification of tree species composition using a combination of multispectral imagery and airborne laser scanning data. Cent. Eur. For. J. 2017, 63, 1–9. [Google Scholar] [CrossRef]
- Chisholm, R.A.; Cui, J.; Lum, S.K.Y.; Chen, B.M. UAV LiDAR for below-canopy forest sureys. J. Unmanned Veh. Syst. 2013, 1, 61–68. [Google Scholar] [CrossRef]
- Sudhakar, S.; Vijayakumar, V.; Kumar, C.S.; Priya, V.; Ravi, L.; Subramaniyaswamy, V. Unmanned Aerial Vehicle (UAV) based Forest Fire Detection and monitoring for reducing false alarms in forest-fires. Comput. Commun. 2020, 149, 1–16. [Google Scholar] [CrossRef]
- Liu, Y.Q.; Zheng, C.; Liu, X.D.; Tian, Y.; Zhang, J.Z.; Cui, W.B. Forest Fire Monitoring Method Based on UAV Visual and Infrared Image Fusion. Remote Sens. 2023, 15, 3173. [Google Scholar] [CrossRef]
- Kankare, V.; Molopainen, M.; Vastaranta, M.; Puttonen, E.; Yu, X.W.; Hyyppä, J.; Vaaja, M.; Hyyppä, H.; Alho, P. Individual tree biomass estimation using terrestrial laser scanning. ISPRS J. Photogramm. 2013, 75, 64–75. [Google Scholar] [CrossRef]
- Beyene, S.M.; Hussin, Y.A.; Kloosterman, H.E.; Ismail, M.H. Forest Inventory and Aboveground Biomass Estimation with Terrestrial LiDAR in the Tropical Forest of Malaysia. Can. J. Remote Sens. 2020, 46, 130–145. [Google Scholar] [CrossRef]
- Lin, J.Y.; Chen, D.C.; Wu, W.J.; Liao, X.H. Estimating aboveground biomass of urban forest trees with dual-source UAV acquired point clouds. Urban For. Urban Green. 2022, 69, 127521. [Google Scholar] [CrossRef]
- Kimming, M.; Sundberg, C.; Nordbeg, A.; Baky, A.; Bernesson, S.; Norén, O.; Hansson, P.A. Biomass from agriculture in small-scale combined heat and power plants—A comparative life cycle assessment. Biomass Bioenerg. 2011, 35, 1572–1581. [Google Scholar] [CrossRef]
- Fagarazzi, C.; Tirinnanzi, A.; Cozzi, M.; Di Napoli, F.; Romano, S. The Forest Energy Chain in Tuscany: Economic Feasibility and Environmental Effects of Two Types of Biomass District Heating Plant. Energies 2014, 7, 5899–5921. [Google Scholar] [CrossRef]
- Mokroš, M.; Tabačák, M.; Lieskovský, M.; Fabrika, M. Unmanned Aerial Vehicle use for wood chips pile volume estimation. Int. Arch. Photogramm. Remote Sens. Spat. Inf. Sci. 2016, 41, 953–956. [Google Scholar] [CrossRef]
- Mund, J.M.; Katz, N.; Krause, S.; Cremer, T. Hackschnitzelhaufen mit Drohnentechnik vermessen (Measuring wood chip piles with drone technology). AFZ-DerWald 2017, 22, 36–39. [Google Scholar]
- Purfürst, T.; De Miguel-Díez, F.; Berendt, F.; Engler, B.; Cremer, T. Comparison of wood stack volume determination between manual, photo-optical, iPad-LiDAR and handheld-LiDAR based measurement methods. iForest 2023, 16, 243–252. [Google Scholar] [CrossRef]
- Matsimbe, J.; Mdolo, W.; Kapachika, C.; Musonda, I.; Dinka, M. Comparative utilization of drone technology vs. traditional methods in open pit stockpile volumetric computation: A case of njuli quarry, Malawi. Front. Built Environ. 2022, 8, 1037487. [Google Scholar] [CrossRef]
- Kuptz, D.; Schulmeyer, F.; Hüttl, K.; Dietz, E.; Turowski, P.; Zormaier, F.; Borchert, H.; Hartmann, H. Optimale Bereitstellungsverfahren für Holzhackschnitzel. Berichte Aus Dem TFZ 2015, 40, 324. [Google Scholar]
- Wright, C.S.; Balog, C.S.; Kelly, J.W. Estimating Volume, Biomass, and Potential Emissions of Hand-Piled Fuels; No. PNW-GTR-805; U.S. Department of Agriculture, Forest Service, Pacific Northwest Research Station: Portland, OR, USA, 2009. [Google Scholar] [CrossRef]
- Dandois, J.; Olano, M.; Ellis, E. Optimal Altitude, Overlap, and Weather Conditions for Computer Vision UAV Estimates of Forest Structure. Remote Sens. 2015, 7, 13895–13920. [Google Scholar] [CrossRef]
- Hardy, C.C. Guidelines for Estimating Volume, Biomass, and Smoke Production for Piled Slash; No. PNW-GTR-364; U.S. Department of Agriculture, Forest Service, Pacific Northwest Research Station: Portland, OR, USA, 1998. [Google Scholar] [CrossRef]
- Wallace, L.; Lucieer, A.; Watson, C.; Turner, D. Development of a UAV-LiDAR System with Application to Forest Inventory. Remote Sens. 2012, 4, 1519–1543. [Google Scholar] [CrossRef]
- Jayathunga, S.; Owari, T.; Tsuyuki, S. The use of fixed-wing UAV photogrammetry with LiDAR DTM to estimate merchantable volume and carbon stock in living biomass over a mixed conifer-broadleaf forest. Int. J. Appl. Earth Obs. 2018, 73, 767–777. [Google Scholar] [CrossRef]
- Zhou, L.; Li, X.J.; Zhang, B.; Xuan, J.; Gong, Y.L.; Tan, C.; Huang, H.G.; Du, H.Q. Estimating 3D Green Volume and Aboveground Biomass of Urban Forest Trees by UAV-Lidar. Remote Sens. 2022, 14, 5211. [Google Scholar] [CrossRef]
- Whitaker, C.; Yates, N.E.; Powers, S.J.; Misselbrook, T.; Shield, I. Dry matter losses and quality changes during short rotation coppice willow storage in chip or rod form. Biomass Bioenerg. 2018, 112, 29–36. [Google Scholar] [CrossRef] [PubMed]
- Jakubovski, M.; Praczyk, M. Weight loss of logwood piles stored under winter conditions in Poland. Balt. For. 2022, 28, 123–130. [Google Scholar] [CrossRef]
- Da Silva, C.A.; Duarte, C.R.; Souto, M.V.S.; Dos Santos, A.L.S.; Amaro, V.E.; Bicho, C.P.; Sabadia, J.A.B. Evaluating the accuracy in volume calculation in a pile of waste using UAV, GNSS and LiDAR. Bol. Ciências Geodésicas 2016, 22, 73–94. [Google Scholar] [CrossRef]
- Lawrence, J.; Letham, G. Mineral Stockpile Volumes From UAV Photogrammetry and Terrestrial LiDAR. Photogramm. Eng. Remote Sens. 2018, 84, 333–335. [Google Scholar] [CrossRef]
- Zhang, W.; Yang, D.S.; Li, Y.; Xu, W.H. Portable 3D Laser Scanner for Volume Measurement of Coal Pile. In Communications, Signal Processing, and Systems; SCPS 2018, Vol. III: Systems; Springer: Singapore, 2020; Volume 517, pp. 340–347. [Google Scholar] [CrossRef]
- Liu, S.; Yu, J.X.; Ke, Z.H.; Dai, F.J.; Chen, Y.B. Aerial-ground collaborative 3D reconstruction for fast pile volume estimation with unexplored surroundings. Int. J. Adv. Robot. Syst. 2020, 17, 1729881420919948. [Google Scholar] [CrossRef]
- Yigit, E. Development of an expression for the volume of off-centered conical pile inside a cylindrical silo. Measurement 2019, 146, 903–911. [Google Scholar] [CrossRef]
- Liu, M.J.; Dong, P.L.; Zhong, R.F. A rapid method for estimating the angle of repose and volume of grain piles using terrestrial laser scanning. Remote Sens. Lett. 2020, 11, 707–713. [Google Scholar] [CrossRef]


Disclaimer/Publisher’s Note: The statements, opinions and data contained in all publications are solely those of the individual author(s) and contributor(s) and not of MDPI and/or the editor(s). MDPI and/or the editor(s) disclaim responsibility for any injury to people or property resulting from any ideas, methods, instructions or products referred to in the content. |
© 2024 by the authors. Licensee MDPI, Basel, Switzerland. This article is an open access article distributed under the terms and conditions of the Creative Commons Attribution (CC BY) license (https://creativecommons.org/licenses/by/4.0/).