Article

National Park Double Boundary Delimitation: A Synergy-Based Approach Integrating Biodiversity and Ecosystem Services—An Example of Proposed Ailaoshan–Wuliangshan National Parks in China

1
College of Landscape Architecture and Horticulture, Southwest Forestry University, Kunming 650224, China
2
College of Architecture and Urban Planning, Beijing University of Civil Engineering and Architecture, Beijing 100044, China
3
Southwest Research Center for Landscape Architecture Engineering, State Forestry and Grassland Administration, Kunming 650224, China
*
Author to whom correspondence should be addressed.
Forests 2024, 15(12), 2159; https://doi.org/10.3390/f15122159
Submission received: 12 November 2024 / Revised: 1 December 2024 / Accepted: 3 December 2024 / Published: 6 December 2024
(This article belongs to the Special Issue Forest Wildlife Biology and Habitat Conservation)

Abstract

:
The demarcation of national park boundaries is crucial for comprehensive planning, effective management, and maintaining the integrity of ecosystems and biodiversity. This research uses the proposed ‘Ailaoshan–Wuliangshan’ National Park (AWNP) in Yunnan Province, China, as the study area and adheres to the principles of systematic conservation planning (SCP). It employs the Marxan 2.43, MaxEnt 3.4.4, and InVEST 3.14.2 models to predict suitable distribution areas for key endangered species within the AWNP, identifies core ecological source areas, priority conservation areas, and conservation gaps, and constructs a double boundary protection framework. The study’s findings indicate that the potentially suitable habitats for the major rare and endangered species, as predicted by the MaxEnt model, are predominantly located in the Ailaoshan and Wuliangshan areas, with a smaller portion distributed in the Konglonghe area. The InVEST model assessment of habitat quality revealed that the total area of the core ecological source areas is 4775.26 km2, accounting for 35.34% of the total study area. The Marxan model identified a total area of 1064.22 km2 as priority conservation areas, constituting 7.90% of the total study area. Additionally, it revealed conservation gaps of 302.1 km2, which represent 2.20% of the total area. Ultimately, by integrating biodiversity conservation and ecosystem services, the boundaries of the AWNP were optimized into a double boundary delineation model: the inner boundary, characterized by rigid control, spans an area of 1076.20 km2, while the outer boundary, characterized by elastic management, covers an area of 3056.92 km2. Corresponding management recommendations are proposed for the different areas. The double boundary delineation method proposed in this study can, to a certain extent, reconcile the conflict between biodiversity conservation and resource utilization, providing an appropriate reference for the demarcation and dynamic management of national park boundaries in China.

1. Introduction

National parks serve as bastions of biodiversity conservation, playing an indispensable role in maintaining ecological balance (a state of dynamic equilibrium in an ecosystem where the numbers of species, their genetic diversity, and the ecosystem’s diversity remain relatively stable) [1], ensuring regional ecological security (the state of a country’s ecological environment being relatively free from threats or destruction) [2], and promoting the development of ecological civilization (a vision for a more sustainable society that is based on ecological principles and values) [3]. National parks serve as an essential framework for the construction of ecological civilization, fulfilling the core functions of protecting natural ecosystems, preserving biodiversity, and providing ecosystem services. Their establishment aims to delineate the “ecological baseline” for protection, safeguarding intact natural ecosystems to foster harmonious coexistence between humans and nature. In 2019, China proposed the establishment of a nature reserve system with national parks as the mainstay, and the first batch of national parks, including Sanjiangyuan, Wuyishan, Hainan Tropical Rainforest, and Giant Panda, had been officially established by 2021. In the spatial planning of national parks, the delineation of boundaries represents a crucial initial step [4]. The established criteria for national parks emphasize the clarity of boundaries [5], which is crucial for the conservation of biodiversity and the integrity of ecosystems within the parks and for positively influencing the economic and social development of surrounding communities. Additionally, the establishment of national parks involves a process of rights allocation [6], necessitating a comprehensive consideration of various factors, including the characteristics of ecosystems, the features of conservation targets, and socio-economic development.
Scholars from both domestic and international backgrounds have developed theoretical frameworks and quantitative techniques for delineating national park boundaries from diverse perspectives. Su Yang et al. [7] emphasize that while ensuring the integrity of ecosystems, the delineation of national park boundaries should also balance biodiversity conservation, public management, policy coordination, and socio-economic development. Xue Bingjie et al. [8] argued that the core of national park boundary delineation lies in the identification of ecological sources and ecological corridors. Based on ecological patterns, they proposed an evaluation index system for assessing ecological authenticity, aiming to quantitatively guide the delineation of national park boundaries. Yu Hu et al. [9] proposed a method for delineating potential national park boundaries based on six key indicators: ecosystem integrity, ecological significance, authenticity, biodiversity, natural landscape value, and cultural heritage value. Ma Bingran et al. [10] employed models such as MaxEnt, InVEST, Fragstats, and Marxan to propose a quantitative approach that integrates species, ecosystem, and landscape conservation for demarcating the boundaries and functional zones of the Sanjiangyuan National Park. Li Yehan et al. [11] leveraging the InVEST and SWAT models to assess conservation costs and ecological benefits, proposed a method for optimizing the boundaries of protected areas. Wang Qi et al. [6] utilized the MSPA and MCR models to establish a boundary delineation model for national parks based on ecological security patterns. Feng Jiang et al. [12] utilized the MaxEnt and Marxan models to simulate the suitable spatial distribution of wildlife within Kunlunshan National Park, with the aim of exploring the park’s boundary limits, functional zoning, and conservation gaps.
Current research predominantly focuses on ecosystem integrity [13], biodiversity conservation [14], ecological security patterns, and management rights [15], employing quantitative methods such as species distribution forecasting [13,16], landscape connectivity assessment [17], ecological value evaluation, wilderness degree assessment [18], priority conservation area identification, and cost–benefit analysis [19]. However, existing studies seldom consider the delineation of national park boundaries from multiple dimensions, including biodiversity conservation, ecosystem services, and anthropogenic disturbances. Most national park boundaries, once delineated, are difficult to alter. This rigidity limits their ability to adapt to the dynamic nature of ecosystems, overlooking the diverse demands of stakeholders and the hierarchical nature of planning and management [20]. If the delineation of national park boundaries deviates from the optimal ecological boundaries, it will weaken the ecosystem integrity and biodiversity of the protected area while increasing the complexity and cost of management. For example, the ecological functions of a national park may be compromised, potentially leading to the fragmentation of core ecological sources and corridors, weakening ecosystem connectivity and functionality [21]. This could result in more disputes over land ownership and management conflicts, increasing coordination costs and societal resistance. Poorly defined boundaries might increase the workload and difficulty for patrolling staff. Furthermore, unclear boundaries could create management blind spots, heightening the risk of poaching, illegal logging, and other unlawful activities. Unreasonable boundaries may require frequent adjustments, undermining the sustainability of the national park. Considering the ambiguity, gradual transitions, and dynamic nature of national park boundaries, these characteristics will not disappear simply because of human-defined boundaries [7]. On the contrary, they may even lead to problems such as unreasonable, unclear, and fragmented boundary delineation [22]. In addition, considering the potential boundary adjustments caused by the inherent uncertainty of national parks’ spatial expansion and their spatial associations with surrounding stakeholders [7], the delineation of national park boundaries as a double boundary is proposed to meet the specific needs of ecological spaces to better address ecological conservation challenges. Therefore, it is imperative to advance the research on the double boundary delineation method for national parks to achieve more scientific, dynamic, and adaptive boundary management. A double boundary refers to the core resource protection area that adopts static demarcation and rigid control, while the peripheral control zone implements dynamic balance and elastic management. This approach achieves an organic integration of baseline control and coordinated management, aiming to adapt to the dynamic changes in ecosystems, meet the diverse needs of various stakeholders, and reflect the hierarchical nature of planning and management. It seeks to mitigate potential conflicts between national parks and surrounding areas, achieving the strict protection of natural resources and the sustainable development of the socio-economy.
Systematic conservation planning (SCP), as one of the core methods in biodiversity planning, has been widely adopted and applied in conservation planning practices across various scales, including national, regional, provincial, and county levels [23,24]. This approach employs site selection optimization algorithms to comprehensively evaluate the costs of conservation and its objectives, construct and refine the ecological protection system, and maximize the effectiveness of biodiversity conservation [25,26]. SCP plays a significant role not only in the establishment and adjustment of nature reserves and marine protected areas but also in the emerging field of national park boundary optimization, although research in this area is still in its infancy [27,28]. The SCP approach is capable of preserving biodiversity while fostering the rational use of resources and optimizing ecological protection patterns [29,30]. These capabilities have been demonstrated in various studies, highlighting SCP’s theoretical robustness and practical efficacy in addressing complex conservation challenges. Consequently, applying the SCP method to the delineation of national park boundaries holds significant advantages and potential.
This study uses the Ailaoshan–Wuliangshan National Park (AWNP) as a case study. Based on the principles of systematic conservation planning (SCP), this research defines conservation objectives, quantifies the conservation value and cost of each area, and aims to support scientific decision-making and optimize the conservation network. Through an in-depth analysis of key areas of the ecosystem, this study identifies priority areas with the highest conservation value and emphasizes the dynamic and adaptive nature of conservation planning. Furthermore, this study integrates biodiversity conservation with ecosystem services and proposes a double boundary delineation method for national parks to optimize the boundary demarcation of the AWNP. This study aims to provide a scientific basis for the quantitative boundary delineation and dynamic management of national parks and protected areas, with potential applications in other counties (“counties” refer to administrative divisions within a country, typically functioning as local governance units) and areas.

2. Materials and Methods
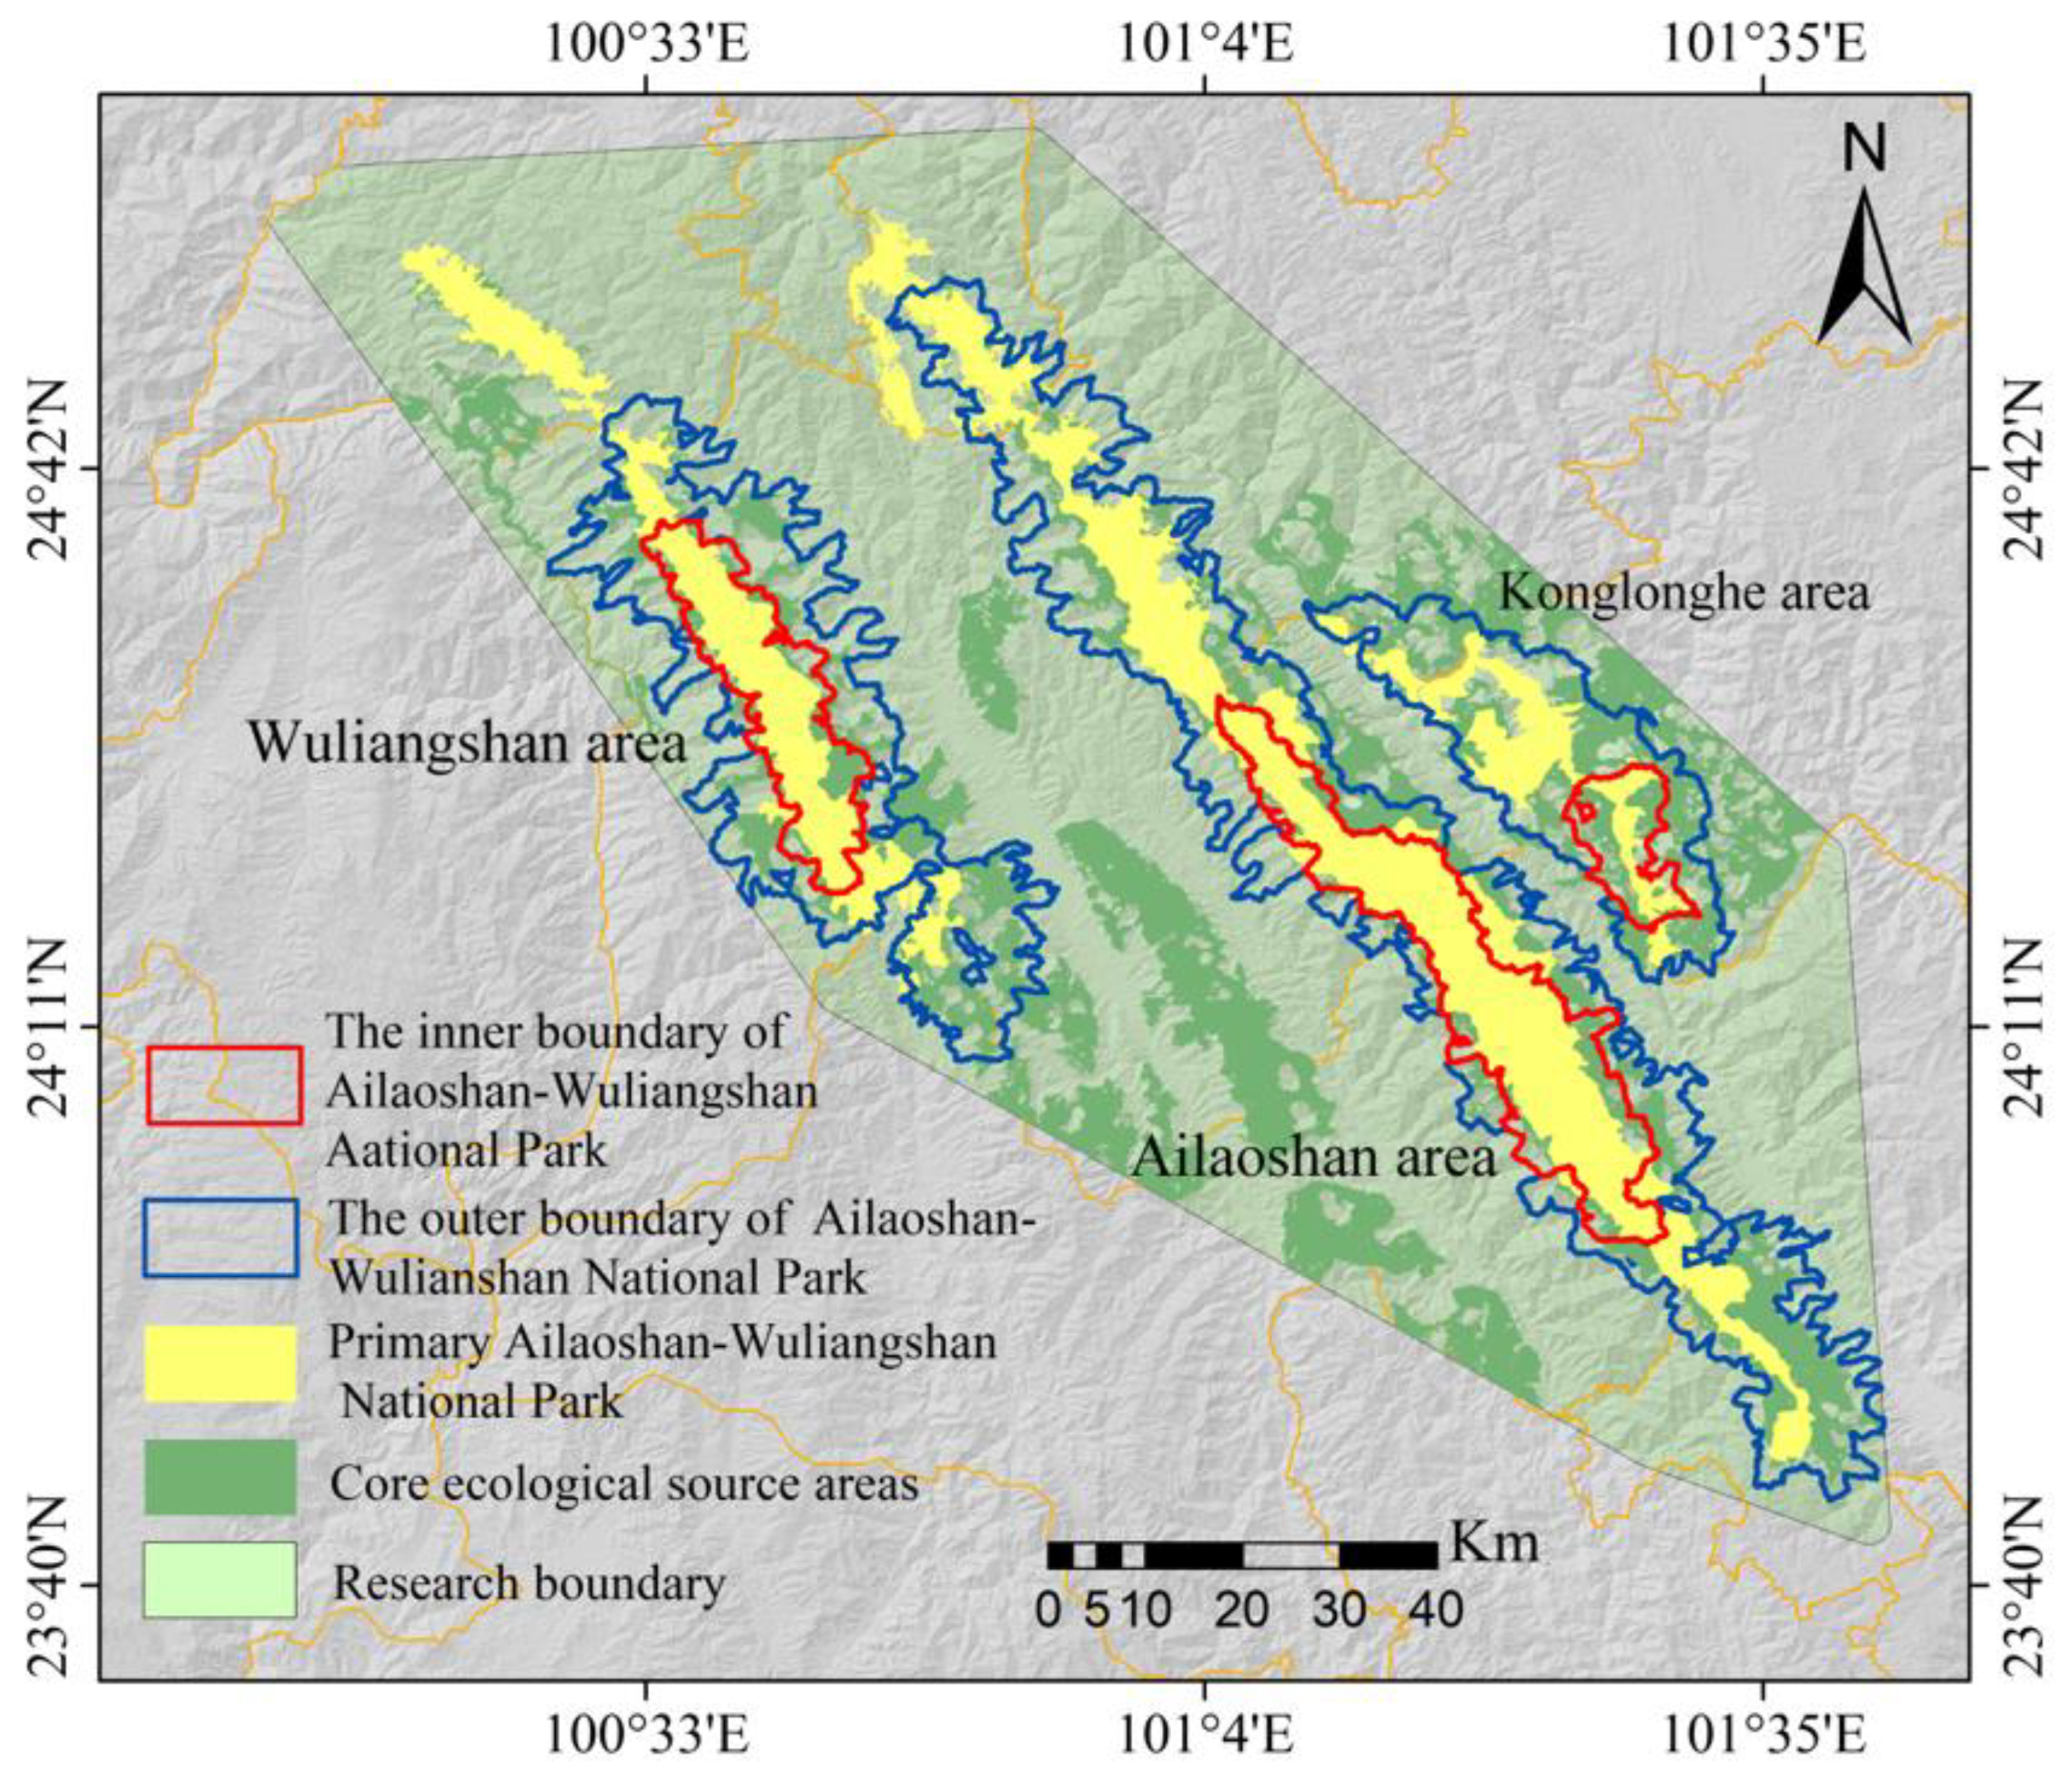
In this study, we utilized the MaxEnt, Marxan, and InVEST models, leveraging their complementary strengths in conservation planning. The MaxEnt model is highly efficient in predicting suitable habitat areas based on environmental variables, particularly for species distribution modeling. The Marxan algorithm was used to identify priority conservation areas and optimize cost-effective conservation plans by balancing ecological value, connectivity, and spatial costs. Finally, the InVEST model was applied to identify core ecological source areas, with a focus on protecting ecosystem services and ecological functions. Each model contributes to different aspects of conservation planning, enabling a comprehensive study from multiple complementary perspectives. The research process is detailed as follows: (1) Collect biodiversity and environmental variable data within the AWNP region and employ the Maxent model to forecast the spatial distribution frameworks of species. (2) Utilize the Habitat Quality module of the InVEST model to assess habitat quality within the AWNP, and based on these assessments, identify the core ecological source areas. (3) Define planning units, construct datasets for species distribution and conservation costs, and apply the Marxan model to predict priority conservation areas within the AWNP. Conduct spatial overlay analysis with the existing boundaries of the AWNP to identify conservation gaps. (4) Conduct a spatial overlay analysis between the simulated priority conservation areas of the AWNP and the identified core ecological source areas to construct a double boundary protection framework for the AWNP.

2.1. Study Area

The “Ailaoshan–Wuliangshan” National Park (AWNP), located in the central part of Yunnan Province, China, marks the junction between the western Hengduan Mountains and the eastern Yunnan Plateau. The park spans across several counties, including Jingdong, Zhenyuan, Xinping, Chuxiong, Shuangbai, Nanhua, and Nanjian. Its total area is 1493.41 km2, and it is composed of three distinct regions: the Ailaoshan area (900.94 km2), the Wuliangshan area (418.04 km2), and the Konglonghe area (175.43 km2). The AWNP is renowned for its rich biodiversity and serves as a transitional zone in terms of flora and fauna. It is a transition zone from the ancient tropical plant region to the pan-Arctic plant region, where the geographical components of plant species from the east and west intersect, forming a transitional zone from the tropical to the temperate regions of the Asian continent. It is also an important corridor for species migration and genetic exchange. The park serves as a habitat for 12 species of nationally protected first-class wild animals. These species, which are considered to be at the highest risk of extinction, receive the strongest legal protections and are the top priority for conservation efforts. Additionally, the park is home to 72 species of second-class protected wild animals. Although these species are also legally protected, they are considered to be at a somewhat lower risk of extinction compared to the first-class species. Notably, the western black-crowned gibbon (Nomascus concolor) and the green peafowl (Pavo muticus) are emblematic species in the park, serving as flagship and umbrella species, respectively [31]. The Ailaoshan and Wuliangshan regions together represent the primary habitat for the global population of the western black-crowned gibbon, which accounts for over 90% of the existing population. Furthermore, these areas are critical habitats for both the green peafowl and Phayre’s leaf monkey (Trachypithecus phayrei), both of which are listed as first-class protected animals in China. The AWNP encompasses typical ecological systems of China’s subtropical plateau region, which includes evergreen broadleaf forests, monsoon forests, wetlands, and other ecosystems. These ecosystems play a crucial role in maintaining biodiversity and providing essential ecosystem services, such as water conservation, carbon storage, soil protection, and climate regulation. The AWNP and its surrounding areas are rich in the unique cultural heritage of various ethnic minorities, such as the Yi, Hani, Lahu, Dai, Bai, and Yao peoples, as well as the mysterious culture of the ancient Ailao Kingdom. The region also boasts a wealth of human landscape resources, including the ancient Tea Horse Road, renowned temples, historic battlefields, and the Sakura Valley, all of which are Grade A tourism resources. The park integrates natural landscapes, cultural landscapes, and intangible cultural heritage, making it an area of significant value in both research and conservation.
According to relevant studies in the literature [32,33], protected areas exhibit edge effects on surrounding regions, typically within a 0–15 km range from the reserve’s periphery. This study considers the edge effects arising from the mutual influences between the ecosystems within the AWNP and its surrounding areas, particularly in terms of material and energy flows, economy, and society. Therefore, this study defines the boundary of the research area by applying China’s national park boundary demarcation standards (which aim to minimize overlap with urban development) and considering the actual land use situation within the AWNP. A 10 km buffer was applied beyond the AWNP boundary, resulting in a research boundary that encompasses all regions between the three areas. The total area of the research boundary (which includes both the national park boundary and the buffer zone) is 13,510.95 km2 (Figure 1).

2.2. Data Sources and Processing

This study utilizes various data sources, including geographical information, satellite imagery, and spatial environmental data, such as climate and species distribution within the nature reserve. Specifically, the land use vector data within the AWNP boundary and its buffer zone were both derived from the Second National Land Survey [34]. Satellite imagery and DEM raster data were provided by the Geographer Spatial Data Cloud Platform of the Computer Network Information Center, Chinese Academy of Sciences (http://www.gscloud.cn, accessed on 23 September 2024). Bioclimatic variables were obtained from the WorldClim website (http://www.worldclim.org/, accessed on 27 September 2024), specifically the current climate data (1950–2000). Vector data for river systems, settlements, and roads were downloaded using the Bigema 2024 GIS Office software. The vector data for rare and endangered flora and fauna were provided by the National Park Research Group at Southwest Forestry University and supplemented by the relevant literature and data from the China National Specimen Resource Platform (http://www.nsii.org.cn, accessed on 29 September 2024), the Chinese Virtual Herbarium (https://www.cvh.ac.cn/, accessed on 29 September 2024), and the Global Biodiversity Information Facility (https://www.gbif.org/, accessed on 30 September 2024). Human footprint intensity data were provided by the Urban Environment Monitoring and Modeling Group at the College of Land Science and Technology, China Agricultural University (https://pan.baidu.com/s/1X9OB1xjQdo2x4uk6lHJHNg?pwd=tvm7, accessed on 16 August September 2024). All data were processed on the ArcGIS 10.7 platform, including mask extraction, cropping, and resampling to a uniform grid cell size of 30 m × 30 m using the GCS_WGS_1984 coordinate system.

2.3. Methods

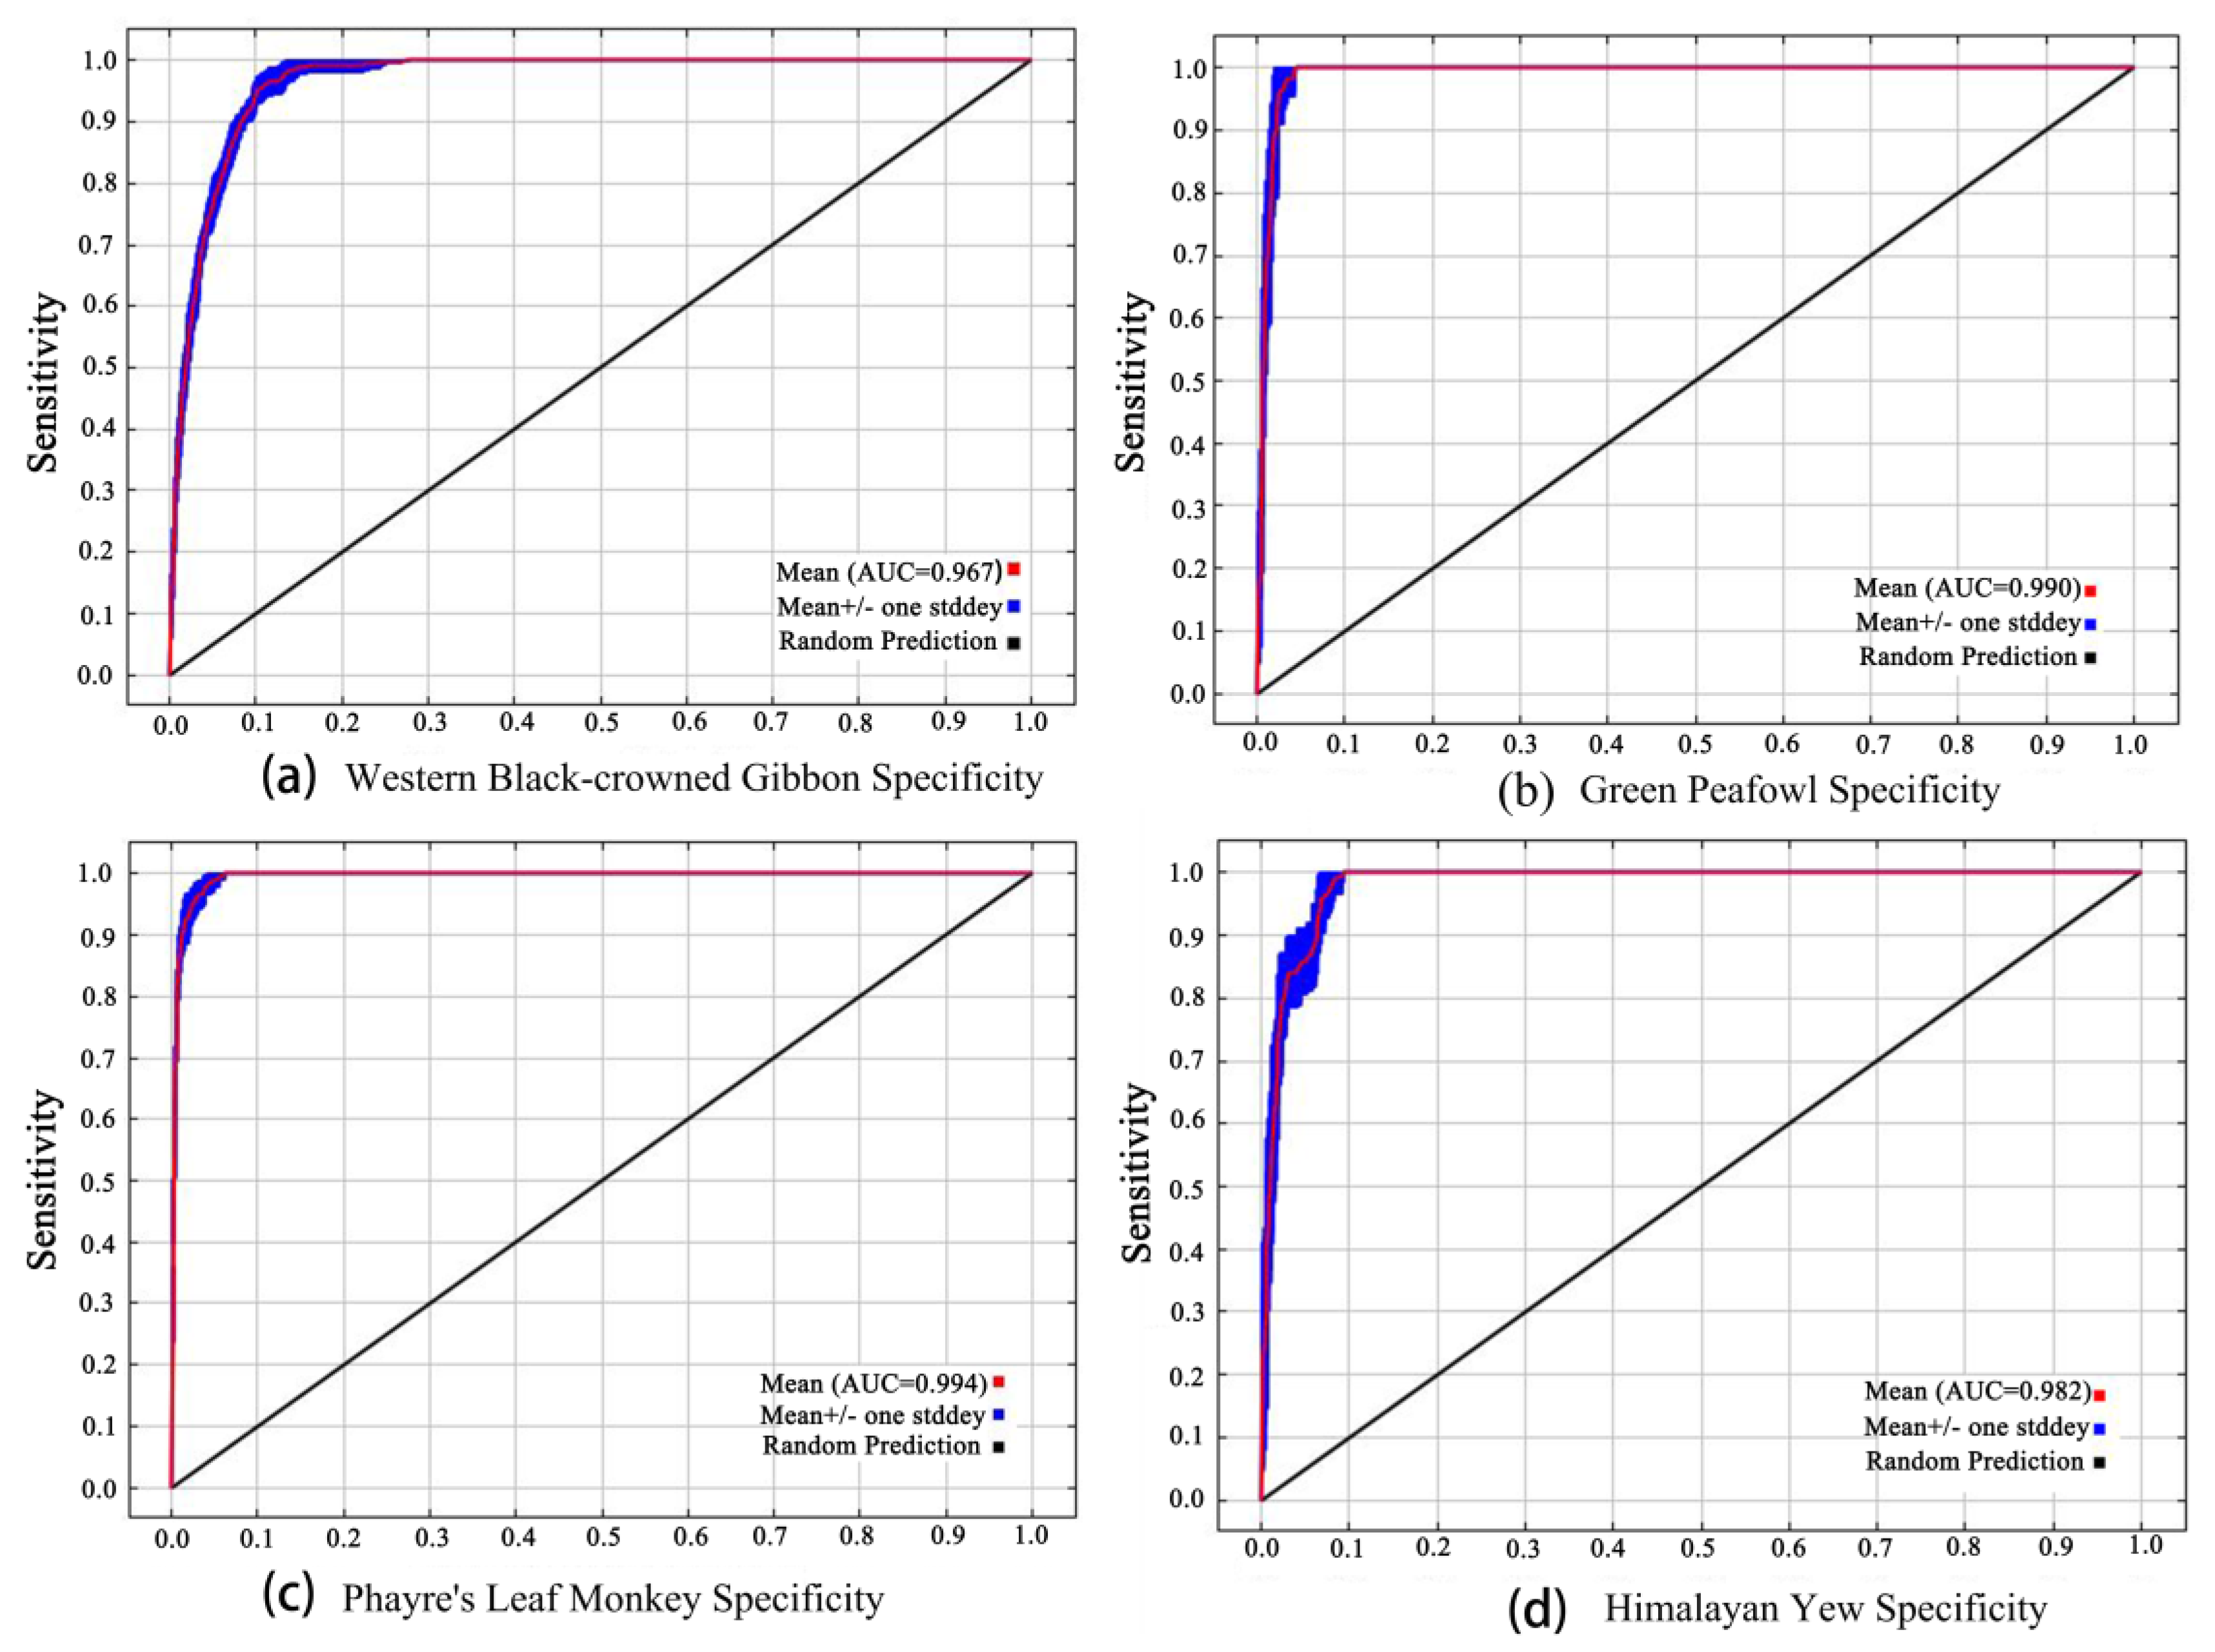
2.3.1. Species Distribution Prediction

Umbrella species, flagship species, rare and endangered species, and ecosystems are key components of natural ecosystems. They provide irreplaceable ecological services and serve as vital indicators of ecosystem integrity. In this study, we selected the western black-crowned gibbon (Nomascus concolor) as the flagship species, the green peafowl (Pavo muticus) as the umbrella species, and Phayre’s leaf monkey (Trachypithecus phayrei) and the Himalayan yew (Taxus wallichiana) as the rare and endangered species within the AWNP as conservation targets (Table 1). We employed the MaxEnt model to predict the spatial distribution of these four species. Grounded in niche theory, the MaxEnt model utilizes existing species distribution data along with various spatiotemporal environmental variables to construct models that simulate the potential distribution ranges of species. According to relevant studies [35], we initially considered a total of 23 environmental variables (Table S1), of which 19 are bioclimatic variables, including the annual mean temperature, mean diurnal temperature range, maximum temperature of the warmest month, and others. Three topographic factors were also considered, including slope, elevation, and aspect, along with one proximity factor, the distance to water areas. These were incorporated into the model to simulate and predict species distributions. To avoid overfitting due to multicollinearity, we conducted a Pearson correlation analysis on all environmental variables [36,37]. When the absolute value of the correlation coefficient exceeded 0.8 (|r| ≥ 0.80), we employed the Jackknife method within the MaxEnt model to remove variables with lesser contributions [38]. As a result, 11 environmental variables were selected for inclusion in the MaxEnt model (Table 2).

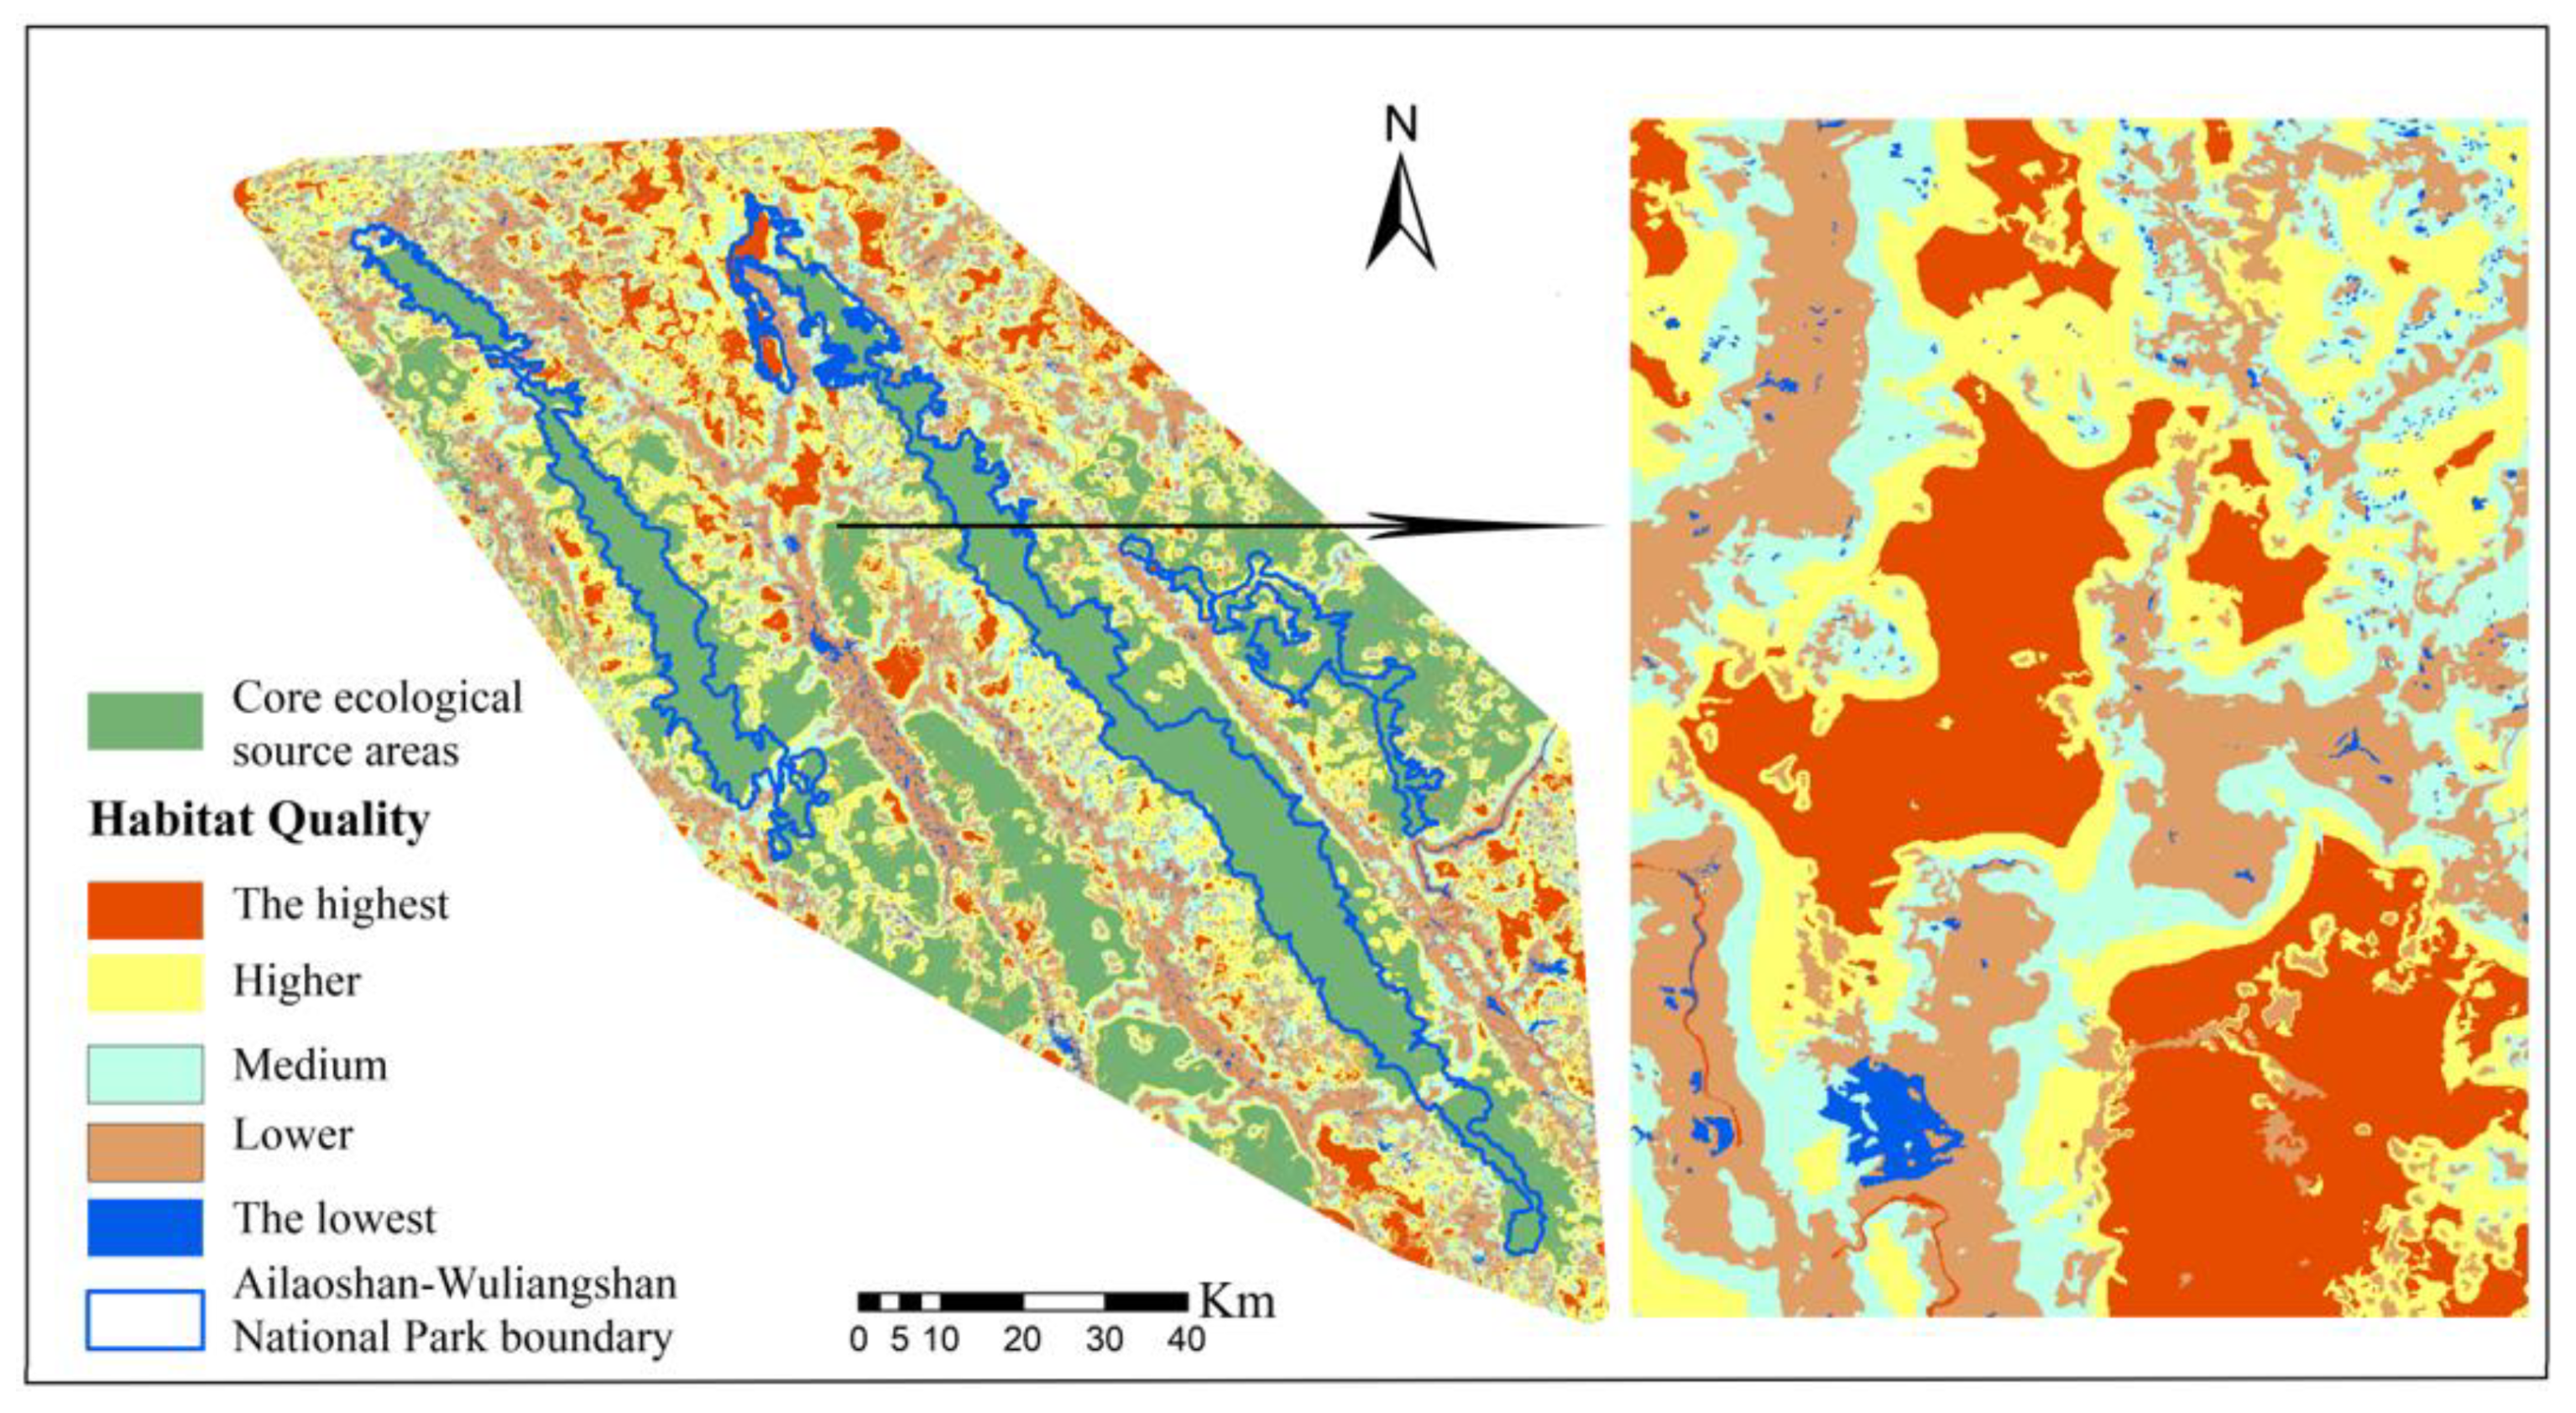
2.3.2. Habitat Quality Assessment

The InVEST model, developed by the Natural Capital Project in the United States, utilizes its Habitat Quality module to comprehensively assess the sensitivity of habitat types to various threat factors, the intensity of these threats, and the spatial relationships (e.g., distance, weight, and influence) between habitats and threat factors. This approach enables a quantitative analysis of habitat quality in a study area, providing a convenient and effective tool for evaluation [39]. In this study, we employed the Habitat Quality module of the terrestrial ecosystem in InVEST version 3.14.2 to assess the habitat quality of the study area. The calculation formula is as follows:
Q x j = H j ( 1 ( D x j z D x j z + K z ) )
In Equation (1), represents the habitat quality index of habitat type j at grid cell x (∈[0,1]); denotes the suitability score of habitat type j; is the degradation degree of habitat type j at grid cell x; z is a scaling constant, typically set to 2.5; and k is the half-saturation constant, equal to half of the maximum habitat degradation value.
Incorporating the geographical context and land use characteristics of the AWNP and drawing on existing studies [14], this research identified four threat factors: proximity to urban construction land, cropland, main highways, and other roads. After comparison and calibration, we determined the maximum impact distances, weights, and decay rates for these threat factors (Table 3).
Referencing the InVEST model user manual [40], relevant studies [41,42], and expert opinions and considering the actual land use conditions within the AWNP, we selected 10 habitat types, including woodland, shrubland, cropland, and grassland. Based on the research findings of Li Yi et al. [43], we assigned a habitat quality score of 0.9 to woodland and water areas, 0.8 to shrubland, and allowed the habitat quality index for other land uses to range from 0 to 1, with values closer to 1 indicating better habitat quality. In addition, we adjusted other model parameters to reflect the specific conditions of habitat types within the AWNP, thereby localizing the parameters (Table 4).

2.3.3. Identification of Priority Conservation Areas

  • Delineation of planning units
In systematic conservation planning models, square grids, hexagonal tessellations, or sub-watershed catchment areas can be selected as planning units. Compared to other types of planning units, sub-watershed catchment areas more accurately reflect the natural patterns of ecosystems and are more conducive to preserving the integrity of species, habitats, and geomorphological units [44]. Considering the connectivity of the AWNP ecosystem, this study adopted sub-watershed catchment areas as the fundamental units for conservation planning. Using the hydrological analysis module of ArcGIS in combination with the digital elevation model (DEM) data of the study area, sub-watershed catchment area planning units were delineated. Utilizing the ArcGIS-Hydrology tool, a total of 5247 sub-watershed (Figure S1) catchment areas were extracted as planning units, with an average area of 2.57 km2 per unit.
Construction of species distribution dataset
Based on the spatial distribution predictions from the MaxEnt model for the western black-crowned gibbon (Nomascus concolor), the green peafowl (Pavo muticus), Phayre’s leaf monkey (Trachypithecus phayrei), and the Himalayan yew (Taxus wallichiana), this study used the “Zonal Statistics as Table” tool in ArcGIS 10.7 to calculate the distribution area of each target species’ habitat within each planning unit [45]. In alignment with the 20% international biodiversity conservation target benchmark set by the Convention on Biological Diversity (CBD) and considering the endangered status, distribution range, and habitat requirements of the species 30 and 50, conservation targets were determined as follows: for species under national first-class protection and classified as critically endangered by the IUCN, the conservation target was set at 50%; for those under national first-class protection and classified as endangered by the IUCN, the conservation target was set at 30%. Using these data, a species distribution dataset was further constructed.
2.
Construction of conservation cost dataset
In this study, roads (including highways, secondary roads, class III highways, and county and township roads), human footprint intensity, and land use types were considered indirect factors affecting the conservation costs of the sub-watershed catchment area planning units. Based on these factors, a conservation cost dataset for each catchment area was constructed [46]. The specific rules for assigning conservation costs are detailed in Table 5.
3.
Simulated prediction of priority conservation areas in the AWNP
The Marxan model, based on the principles of systematic conservation planning, complementarity, and simulated annealing algorithms, selects the optimal combination of planning units through iterative calculations [47]. In this study, the Marxan model was used in conjunction with data on planning units, species distributions, conservation targets, and protection costs to simulate the priority conservation areas for the AWNP. The specific operational function is as follows:
S e l e c t = p u C o s t + B L M p u B o u n d a r y + S P F p u p e n a l t y
In Equation (2), pu denotes the planning unit; Cost represents the conservation cost of the planning unit; Boundary refers to the cumulative length of boundaries of the selected priority planning units, which is adjusted by the Boundary Length Modifier (BLM), with a shorter total boundary length indicating a more compact planning scheme; and Penalty is the punitive value assigned when species conservation targets are not met, implemented by setting the Species Penalty Factor (SPF).
The prevailing view holds that a conservation area configuration with high connectivity and aggregation is more conducive to the maintenance of biodiversity and the implementation of wetland protection efforts. However, overly concentrated protected areas may increase the cost of land resource utilization [48]. To balance the relationship between conservation costs and the aggregation of protected areas, this study employed the Zonae Cogito 2.6 software to conduct a sensitivity analysis on the boundary length (BLM). Through iterative exploration, we aimed to identify the optimal BLM value, with the initial value calculated using Equation (3):
B L M 0 = C o s t m a x B o u n d a r y   L e n g t h m a x
The Species Penalty Factor (SPF) is incorporated as a penalty term in the objective function when the priority conservation areas fail to fully achieve all conservation targets. In this study, we utilized the SPF Calibration feature within the ArcMarxan toolbox and selected the ‘As group’ mode with a gradient value of 0.1 to determine the most appropriate SPF value. By employing this factor, we can estimate the additional costs required to achieve the remaining conservation objectives, with the goal of aligning the cost structure of the objective function’s protective characteristics closely with the costs associated with meeting all preset targets.
During the execution of the Marxan model, the model was configured to iterate 100 times. Each planning unit has a value within the range of (0–100), representing the frequency with which the unit is selected across 100 iterations, thereby indicating the irreplaceability of each planning unit. By analyzing the irreplaceability values of each planning unit, priority conservation areas within the AWNP were selected. Subsequently, the simulated priority conservation areas were overlaid with the existing national park boundaries to identify conservation gaps within the park.

3. Results and Analysis

3.1. Species Distribution Prediction Results

We imported data for four species and eleven environmental factor layers into the MaxEnt 3.4.4 software, allocating 75% of the data to a training set for model construction and the remaining 25% to a test set for validating the model’s accuracy. The Jackknife method was employed for ten repeated analyses. Subsequently, the model results were evaluated using the Receiver Operating Characteristic (ROC) curve and the Area Under the Curve (AUC) value. The results derived from the MaxEnt model are depicted in Figure 2. The average AUC value for the western black-crowned gibbon (Nomascus concolor) is 0.97 (Figure 2a), for the green peafowl (Pavo muticus), it is 0.99 (Figure 2b), for Phayre’s leaf monkey (Trachypithecus phayrei), it is 0.99 (Figure 2c), and for the Himalayan yew (Taxus wallichiana), it is 0.98 (Figure 2d). The average AUC values for all species exceed 0.90, indicating a high level of accuracy in the predicted results. Therefore, all species have been incorporated into the systematic conservation planning.
The suitable distribution areas for the four species vary significantly (Figure 3). The suitable distribution area for the western black-crowned gibbon (Nomascus concolor) is relatively concentrated, primarily in contiguous patches within the Ailaoshan and Wuliangshan areas, with smaller, scattered distribution points around these areas. In contrast, the Konglonghe area is not conducive to the survival of the western black-crowned gibbon. Overall, the suitable distribution area for the western black-crowned gibbon is largely encompassed within the existing boundaries of the AWNP. The suitable distribution area for the green peafowl (Pavo muticus) is predominantly concentrated in the Konglonghe area, while the Ailaoshan and Wuliangshan areas are not conducive to the survival of the green peafowl. Furthermore, only a small portion of the green peafowl’s suitable distribution area falls within the current boundaries of the AWNP. The suitable distribution area for Phayre’s leaf monkey (Trachypithecus phayrei) is primarily located within the Ailaoshan and Wuliangshan areas, with the Konglonghe area being unsuitable for the species. Overall, the majority of Phayre’s leaf monkey’s suitable distribution area is not included within the current boundaries of the AWNP. The suitable distribution area for the Himalayan yew (Taxus wallichiana) is also predominantly found in the Ailaoshan and Wuliangshan areas, with the Konglonghe area being unsuitable for its growth. Overall, the suitable distribution area for the Himalayan yew is largely encompassed within the boundaries of the AWNP. In summary, the suitable distribution areas for the four species are predominantly concentrated in the Ailaoshan and Wuliangshan areas, with only a minority of individuals observed in the Konglonghe area.

3.2. Habitat Quality Assessment Results

Utilizing the InVEST model, we obtained the habitat quality assessment results for the AWNP (Figure 4). The model output is presented as raster layers, with the habitat quality index ranging from (0–1). Using the natural breaks classification method, we stratified the habitat quality index into five distinct levels: highest (0.79–1), higher (0.63–0.79), moderate (0.45–0.63), lower (0.17–0.45), and lowest (0–0.17). The comprehensive habitat quality assessment of the study area revealed that the overall habitat condition is relatively favorable. Specifically, the area with high habitat quality is 4775.26 km2, which accounts for 35.34% of the total study area; the area with medium habitat quality is 3386.18 km2, representing 25.06%; and the area with low habitat quality is 3053.47 km2, comprising 22.60% of the total area. Within the AWNP, the habitat quality is exceptionally high, with nearly the entire area characterized by the highest quality habitats. This is particularly evident in the Ailaoshan and Wuliangshan areas, where the habitat quality is notably higher and exhibits a pattern of continuous and concentrated patches. These areas, being densely forested and rich in biodiversity and ecological resources, hold significant ecological conservation value. In contrast, the high-quality habitat areas in the Konglonghe area are more fragmented and dispersed. Overall, the habitat quality in the study area displays a distinct spatial distribution pattern, with high quality at the core and low quality at the edges.

3.3. AWNP Priority Conservation Areas Simulation Results

Utilizing the Marxan model to simulate priority conservation areas within the AWNP, a balance between the aggregation of conservation configuration and protection costs was achieved with the BLM value set at 0.1. The simulation results (Figure 5) indicate that the optimal solution selected 408 planning units as priority conservation areas within the AWNP. The total boundary length is 470.10 km, and the total area amounts to 1064.22 km2, which accounts for 7.90% of the total area of the study region, with a conservation gap of 302.10 km2. Upon closer examination, the Ailaoshan area has priority conservation areas covering 599.67 km2, with a conservation gap of 113.83 km2; the Wuliangshan area encompasses priority conservation areas of 343.41 km2, with a conservation gap of 101.84 km2; and the Konglonghe area includes priority conservation areas of 154.41 km2, with a conservation gap of 86.43 km2.

3.4. AWNP Double Boundary Delineation

This study overlayed the simulated priority conservation areas with the core ecological source areas, defined as patches with habitat quality values greater than 0.79. These areas are characterized by their critical ecological functions and high ecological value, providing essential conditions to support ecological processes and maintain species survival and reproduction [49]. To prevent the excessive fragmentation of core ecological source patches and to preserve the integrity of the national park’s ecosystem protection, the boundary delineation process only included landscape patches larger than 10 km2, with connectivity for overlay [50]. This approach helps avoid irrational boundary demarcation and ensures that the national park’s ecosystem remains cohesive [51]. Planning units designated by both the priority conservation areas and the core ecological source areas were delineated as the inner boundary of the national park, with strict and permanent protective measures implemented in this area. Planning units selected solely by either the priority conservation areas or the core ecological source areas were designated as the outer boundary of the national park. The area situated between the inner and outer boundaries was designated as the potential range of the national park and is subject to flexible management.
Ultimately, the delineation results for the AWNP double boundary are presented in (Figure 6). The optimized total area of the AWNP is approximately 4133.12 km2, representing an increase of 2639.71 km2 from the original size, with a total boundary length of about 1784.14 km. Within this area, the inner boundary (encompassing planning units designated by both the priority conservation areas and the core ecological source areas) covers approximately 1076.20 km2, with a boundary length of about 521.57 km. The outer boundary (including planning units designated by either the priority conservation areas or the core ecological source areas, but not both) spans an area of approximately 3056.92 km2.
The optimized areas for each of the three sectors are as follows: The Ailaoshan area, after optimization, spans approximately 2197.54 km2, representing 53.17% of the total area, and it has expanded by 1296.6 km2 compared to its original size. Within this, the inner boundary area is about 597.29 km2, and the outer boundary area is approximately 1600.25 km2. The Wuliangshan area encompasses a total area of approximately 1245.61 km2, representing 30.14% of the total area, with an increase of 827.57 km2 from its original size. Within this area, the inner boundary spans about 304 km2, while the outer boundary covers approximately 941.61 km2. The Konglonghe area has a total area of approximately 687.97 km2, constituting 16.65% of the total area, with an increase of 512.54 km2 from its original size. Within this area, the inner boundary covers about 89.54 km2, and the outer boundary spans approximately 598.43 km2.

4. Discussion

4.1. Species Distribution Suitable Area Prediction

A primary objective in delineating national park boundaries is to preserve ecosystem integrity and protect biodiversity, with particular emphasis on conserving endangered and rare species. Research suggests utilizing the suitable distribution zones of flagship, umbrella, and endangered species as key indicators for adjusting national park boundaries to address the challenges of habitat fragmentation, external pressures, insufficient management resources, and declining habitat quality in existing protected areas for the conservation of important wildlife habitats [52]. This study included all the predicted suitable distribution areas for species within the AWNP boundaries [24]. This approach not only increases boundary adaptability but also partially mitigates habitat fragmentation within the national park. Furthermore, research in geometric population theory within spatial ecology suggests that isolated habitat patches alone cannot sustain long-term species diversity [53]. Therefore, this study considered the habitats of flagship and umbrella species, among other endangered species, as key conservation targets, aiming to enhance the protection of the AWNP ecosystem and biodiversity.

4.2. Ecosystem Assessment

The delineation of national park boundaries differs from that of urban spatial boundaries. As ecological spaces, national parks serve as guardians of intact ecosystems, which are organic entities interconnected with surrounding areas, demonstrating the interactions and transitional characteristics between different regions within the ecosystem [6]. In this study, we used the habitat quality assessment module from the ecosystem services evaluation framework to identify core ecological source areas and incorporate them into national park boundaries [54]. This approach effectively differentiates protected areas from production and living spaces, emphasizing their heterogeneity. However, there is often a discrepancy between actual conditions and ideal goals, as most regions provide one or more ecological functions. Consequently, a comprehensive assessment of ecosystem services is essential for ensuring the sustainable development of regional ecological functions [55]. Furthermore, there may be contradictions and trade-offs among ecosystem services within protected areas. Future research should leverage multi-scale data mining techniques, such as big data analytics, to more accurately identify ecosystem services and improve the precision of ecological boundary delineation within protected areas [7].

4.3. The Establishment of Priority Conservation Areas

In this study, we employed the Marxan model and integrated human footprint intensity data into systematic conservation planning to ensure that human impacts were adequately considered when devising conservation strategies. Ignoring the influence of human activities on ecosystems and wildlife can significantly undermine the effectiveness of conservation measures [56,57]. While traditional research has predominantly focused on ecosystem functions [13], services, and economic costs [15], this study builds upon previous work by incorporating the effects of human activities into systematic conservation planning, thus achieving a comprehensive approach that considers both natural and anthropogenic factors [35,58]. Specifically, we conducted an integrated assessment of the potential distribution areas of rare and endangered species, habitat quality, and spatial constraints imposed by human activities to identify priority conservation areas within the AWNP. This approach integrates natural ecology with human activities, offering a novel perspective for planning and decision-making. The priority conservation areas identified in this study are predominantly located within the existing boundaries of the AWNP, thereby validating the effectiveness of previous conservation efforts. Furthermore, by identifying conservation gaps—regions that lie outside the original boundaries of the AWNP—we refined the park’s borders. These areas are now incorporated into the AWNP protective ambit, where stricter management and conservation measures will be implemented. Prioritizing conservation areas as a key criterion for boundary optimization aims to enhance the effective protection of biodiversity and ecosystems within the national park.

4.4. Optimization and Dynamic Adjustment of National Park Boundaries

Following the optimization of the AWNP boundaries in this study, the area increased by 2639.71 km2, a result that partially supports the proposal by Yang Rui et al. [59] to designate at least 50% of the national territory (national territory refers to the geographical area over which a country has sovereign authority, including its land, water bodies, airspace, and other associated regions) as protected areas. The conclusion of this study aligns with the “Other Effective Area-Based Conservation Measures (OECMs)” promoted by the Convention on Biological Diversity (CBD), highlighting the significant role of areas beyond protected sites in biodiversity conservation. Despite China’s terrestrial nature reserves covering 18% of the land and containing 32 priority biodiversity conservation areas, the challenge of establishing large-scale nature reserves in the future makes the implementation of OECMs especially important [60]. This also represents an urgent issue to be addressed in future research.
Furthermore, with the development of society, there is a growing demand from the public for green spaces and equitable access to greenery. National parks serve not only as spaces for nature conservation but also as platforms for providing natural experiences and educational opportunities. Balancing the protection of unique ecosystems and biodiversity within national parks while allowing ecological tourism in a responsible manner has become a complex issue that spans multiple dimensions and interdisciplinary fields [61]. This study provides a reference for achieving a balance between ecotourism and environmental protection through the delineation of dual boundaries. Considering the ambiguity, gradual transitions, and dynamism of national park boundaries [24], these characteristics cannot be erased by arbitrary human demarcation. Therefore, it is necessary to allocate some space for growth and expansion to ensure ecological security. Boundary delineation should not be static; instead, it should undergo real-time assessments at different stages, with dynamic adjustments made to the rigid control of the internal boundary and the flexible management of the external boundary, thereby achieving a dynamic balance in land use.

5. Conclusions and Recommendations

This study introduces a novel approach for the delineation of national park boundaries and their associated management strategies, aimed at optimizing national park boundaries and achieving effective dynamic management of both the inner and outer boundaries. Adhering to the principles of systematic conservation planning, this study integrates biodiversity conservation and ecosystem services to optimize national park boundaries and create a double boundary protection framework. Within this framework, the inner boundary is governed by rigid control measures, while the outer boundary employs elastic management practices. This approach provides a scientific foundation for the dynamic management of national parks and establishes a strong basis for ecosystem and biodiversity conservation. The findings of this study not only offer significant guidance for the development of the Yunnan–Guizhou Plateau’s national park cluster and the advancement of ecological civilization but also demonstrate that the boundary optimization approach is not limited to national parks; it can be extended to broader regions, including the identification of ‘Other Effective Area-Based Conservation Measures’ (OECMs). Our double boundary delineation model offers a novel perspective and methodological framework for demarcating and managing national park boundaries, providing a reference for advancing ecological conservation and the rational use of national parks and broader areas alike.
Based on the conservation pattern established by the AWNP double boundary, this study proposes the following recommendations for each respective area:
(1)
The inner boundary is characterized by strict control. The area covers 1076.20 km2, representing 26.04% of the total area, with a boundary length of approximately 521.57 km. Boundary optimization is not solely based on artificial or natural boundaries, such as administrative divisions, existing protected area boundaries, topographical features, roads, or rivers. Rather, it is guided by the need to conserve intact ecosystems, selecting an appropriate landscape scale to define the rigid control boundaries. The core conservation focus of the national park is on the representative, intact ecosystems of the area. Therefore, within the controlled boundaries, only strict resource protection measures and activities with controllable environmental impacts that serve public welfare are permitted.
(2)
The outer boundary is characterized by elastic management. The area covers 3056.92 km2, accounting for 73.96% of the total area, with an approximate boundary length of 1784.14 km. Considering the inherent growth and expansion needs of the national park, as well as its spatial interconnectivity with surrounding stakeholders, the outer boundary was delineated with a focus on adaptive management to accommodate the unique requirements of ecological spaces. This demarcation is not a simple application of the deflection or topographic methods based on the inner boundary. Instead, it incorporates areas of ambiguity from the inner boundary delineation, surrounding communities closely linked to the national park, and regions requiring ecological protection. These elements form a potential range beyond the national park’s inner boundary, representing an intersection of multiple stakeholders’ interests, including traditional villages, the ancient Tea Horse Road, and Class A tourist sites. These stakeholders can engage in a mutually beneficial co-construction and sharing relationship with the national park, preventing it from becoming an isolated ecological preservation area disconnected from the broader socio-economic context [20]. National parks can not only enhance their ecological conservation effectiveness and tourism appeal through the integration of local cultural and natural resources, but they can also achieve a win–win situation in terms of both economic and social benefits through the active involvement of local communities. This mutually beneficial collaboration not only contributes to the protection of natural resources but also promotes the sustainable development of local communities, driving the overall prosperity of the region.
This study, while offering valuable insights, also has its limitations and areas that warrant further improvement. The data available prior to this study were limited, and the boundary delineation process involved some subjective assumptions. Additionally, this study did not fully explore the issue of functional zoning. The delineation of functional zones is not only part of boundary demarcation but also critical to the formulation of specific management policies. This process requires thorough justification and the active involvement of stakeholders. This study primarily assessed the appropriate scope of national parks from a regional and macro perspective to aid in boundary delineation without addressing the specific areas of internal functional zoning within the parks. Therefore, future research is needed to explore functional zoning in greater depth and provide additional insights.

Supplementary Materials

The following supporting information can be downloaded at: https://www.mdpi.com/article/10.3390/f15122159/s1, Figure S1: Sub-watershed-planning units; Table S1: Environmental factors.

Author Contributions

Conceptualization, M.G. and J.Q.; funding acquisition, J.Q.; investigation, M.G. and J.L.; methodology, M.G. and J.Q.; software, M.G. and J.L.; data curation, M.G. and J.Q.; project administration, J.Q.; resources, J.Q.; supervision, J.Q.; validation, M.G.; visualization, J.L.; writing—original draft, M.G. and J.L.; writing—review and editing, M.G. and J.L. All authors have read and agreed to the published version of the manuscript.

Funding

This research was funded by the National Natural Science Foundation of China (NSFC). Funding number: 32460419.

Data Availability Statement

Data are contained within the article.

Acknowledgments

The authors gratefully acknowledge the support of the funding.

Conflicts of Interest

The authors declare no conflicts of interest.

References

  1. Luan, C.; Liu, R.; Li, Y.; Zhang, Q. Comparison of Various Models for Multi-Scenario Simulation of Land Use/Land Cover to Predict Ecosystem Service Value: A Case Study of Harbin-Changchun Urban Agglomeration, China. J. Clean. Prod. 2024, 478, 144012. [Google Scholar] [CrossRef]
  2. Zhu, Q.; Cai, Y. Integrating Ecological Risk, Ecosystem Health, and Ecosystem Services for Assessing Regional Ecological Security and Its Driving Factors: Insights from a Large River Basin in China. Ecol. Indic. 2023, 155, 110954. [Google Scholar] [CrossRef]
  3. Zhang, Y. Beautiful Village Construction in the Perspective of Ecological Civilization: Objectives, Problems and Paths. J. Manag. Soc. Dev. 2024, 1, 145–152. [Google Scholar] [CrossRef]
  4. Liu, Q.Q.; Yu, H. Functional Zoning Mode and Management Measures of Qianjiangyuan National Park Based on Ecological Sensitivity Evaluation. J. Resour. Ecol. 2020, 11, 617–623. [Google Scholar] [CrossRef]
  5. GB/T 39737-2021; National Park Establishment Standards. Standards Press of China: Beijing, China, 2021.
  6. Wang, Q.; Wang, H.; Yu, H. Demarcation of national park boundary based on ecological security pattern: A case study of Yarlung Zangbo Grand Canyon National Park. J. Nat. Resour. 2023, 38, 951–965. [Google Scholar] [CrossRef]
  7. Su, Y. Planning, Boundary Setting, and Zoning: How to Divide Interests?—Interpretation of the “Overall Plan for Establishing a National Park System”. China Dev. Obs. 2018, 17, 42–47. [Google Scholar]
  8. Xue, B.J.; Zhang, Y.J.; An, T.T.; Wang, Z.C.; Jiang, Y.F. Discussion on the Methods of National Park Boundary Delineation Based on Ecological Pattern: The Example of Qinling National Park. Planners 2020, 36, 26–31. [Google Scholar]
  9. Yu, H.; Zhong, L.S.; Zeng, Y.X. Research on Identification of Potential Regions of National Parks in China. J. Nat. Resour. 2018, 10, 1766–1780. [Google Scholar] [CrossRef]
  10. Ma, B.; Zeng, W.; Xie, Y.; Wang, Z.; Hu, G.; Li, Q.; Cao, R.; Zhuo, Y.; Zhang, T. Boundary delineation and grading functional zoning of Sanjiangyuan National Park based on biodiversity importance evaluations. Sci. Total Environ. 2022, 825, 154068. [Google Scholar] [CrossRef]
  11. Li, Y.H.; Liu, N.; Wu, X.F. A Multi-dimensional Ecological Assessment Method to Reconfigure Protected Area Boundary: An Empirical Study in Huanghe River Source Park in Sanjiangyuan National Park. Chin. Landsc. Archit. 2024, 40, 119–125. [Google Scholar] [CrossRef]
  12. Jiang, F.; Song, P.; Gu, H.; Zhang, J.; Xu, B.; Li, B.; Liang, C.; Gao, H.; Cai, Z.; Zhang, M.; et al. New shortcut for boundary delimitation and functional zoning of national parks based on keystone species in China: A case study of Kunlun Mountains National Park. Ecol. Indic. 2024, 159, 111675. [Google Scholar] [CrossRef]
  13. Gu, T.; Tong, Y.; Wang, S.; You, Z.; Li, D.; Jiang, Y.; Rafaqat, A.; Wang, C.; Zhang, Q. Identifying the priority areas for ecological protection considering ecological connectivity and ecosystem integrity: A case study of Xianyang City, China. Ecol. Indic. 2024, 163, 112102. [Google Scholar] [CrossRef]
  14. Huang, Z.; Qian, L.; Cao, W. Developing a Novel Approach Integrating Ecosystem Services and Biodiversity for Identifying Priority Ecological Reserves. Resour. Conserv. Recycl. 2022, 179, 106128. [Google Scholar] [CrossRef]
  15. Que, Z.; Islam, Z.M. How to Conserve the Biodiversity on Collective Land in National Park: Conservation Easements in China. Land 2024, 13, 1151. [Google Scholar] [CrossRef]
  16. Feng, X.; Peng, Q.; Chen, Y.; Li, W. A Case Study of the Snow Leopard in Sanjiangyuan National Park Boundaries regarding Park Boundary Divergence. Land 2022, 11, 813. [Google Scholar] [CrossRef]
  17. Lu, Z.; Zhuang, Y.; Zhang, Y.; Zhang, S. Evaluation of landscape sustainability of protected areas and identification of its correlation factors: A case study of Beijing, China. Landsc. Ecol. 2024, 39, 98. [Google Scholar] [CrossRef]
  18. Cao, Y.; Yang, R. Systematic Conservation Strategies of China’s Wilderness Areas under the Background of the Post-2020 Global Biodiversity Framework. Chin. Landsc. Archit. 2022, 38, 6–9. [Google Scholar] [CrossRef]
  19. Xu, H.; Wang, Z.; Li, Y.; He, J.; Wu, X. Spatial distribution and priority conservation areas identification in Three-River-Source National Park considering the multifaceted values of plants. J. Environ. Manag. 2024, 370, 122594. [Google Scholar] [CrossRef]
  20. Chen, X.; Tang, B.; Liang, S. Delimitation Idea and Suggestion of National Park Boundary from Double Perspectives. Planners 2019, 35, 17–22. [Google Scholar]
  21. Li, C.; Hao, Y.; Zheng, Z.; Xu, X.; Cui, L.; Guan, M.; Guan, S.; Li, T.; Pang, Z.; Li, L.; et al. Determination of priority conservation areas in the Yellow River source region based on ecosystem integrity evaluations. Glob. Ecol. Conserv. 2024, 49, e02800. [Google Scholar] [CrossRef]
  22. Waheed, M.; e Hani, U.; Arshad, F.; Jabeen, A.; Alamri, S.; Siddiqui, M.H.; Haq, S.M.; Shoaib, M.; Bussmann, R.W. Exploring Botanical Diversity, Ecological Traits, and Edaphic Determinants in Kala Chitta National Park, Pakistan: Implications for Conservation and Management. Environ. Sustain. Indic. 2024, 24, 100501. [Google Scholar] [CrossRef]
  23. Márquez, C.R.; Pressey, R.L. Systematic conservation planning. Nature 2000, 405, 243–253. [Google Scholar]
  24. Zhang, X.L.; Jin, X.; Wu, X.; Liang, X.Y.; Han, Y.; Sun, R.; Zhou, Y.K. Delimitation of flexible ecological protection space based on the concept of systematic conservation: Take Maoming City of Guangdong Province as an example. Acta Ecol. Sin. 2021, 41, 7393–7405. [Google Scholar]
  25. Li, X.W.; Lü, J.T.; Zhi, L.H. Optimization of integrated ecological conservation and restoration pattern by trading off the targets, costs, and ecological benefitn. Acta Ecol. Sin. 2023, 43, 3625–3635. [Google Scholar] [CrossRef]
  26. Zhang, L.; Ouyang, Z.; Xu, W. Theory, work frame and hot issues of systematic conservation planning. Acta Ecol. Sin. 2015, 35, 1284–1295. [Google Scholar] [CrossRef]
  27. Liang, C. Assessment on the Efficiency of Wetlands Conservation System and Systematic Conservation Planning for Wetlands in China. Master’s Thesis, Beijing Normal University, Beijing, China, 2012. [Google Scholar]
  28. Feng, Z.X.; Zhou, J.; Yang, F.L.; Wu, R.D. Systematic conservation planning by integrating ecosystem services and biodiversity. Acta Ecol. Sin. 2023, 43, 522–533. [Google Scholar]
  29. Harms, M.J.M.; Estévez, A.R.; Miranda, Á.E. Conservation Triage in Action: Planning, Governance and Knowledge Co-Production for Biodiversity Protection. J. Appl. Ecol. 2024, 61, 2328–2334. [Google Scholar] [CrossRef]
  30. Wang, X.; Wang, X.; Tu, Y.; Yao, W.; Zhou, J.; Jia, Z.; Ma, J.; Sun, Z. Systematic Conservation Planning Considering Ecosystem Services Can Optimize the Conservation System in the Qinling-Daba Mountains. J. Environ. Manag. 2024, 368, 122096. [Google Scholar] [CrossRef]
  31. Zhou, J. Expert Consultation on the “Proposal for the Establishment of Ailao Mountain-Wuliang Mountain National Park”. Ph.D. Thesis, Institute of Science and Technology, Chinese Academy of Sciences, Kunming, China, 25 January 2022. [Google Scholar]
  32. Zhu, Q.; Zhou, W.M.; Jia, X.; Zhou, L.; Yu, D.P.; Dai, L.M. Ecological vulnerability assessment on Changbai Mountain National Nature Reserve and its surrounding areas, Northeast China. Chin. J. Appl. Ecol. 2019, 30, 1633–1641. [Google Scholar] [CrossRef]
  33. Zuo, D.D.; Luo, P.; Yang, H.; Mou, C.X.; Li, Y.J. Assessing the space neighborhood effects and the protection effectiveness of aprotected area—A case study from Zoige Wetland National Nature Reserve. Chin. J. Appl. Environ. Biol. 2019, 25, 854–861. [Google Scholar] [CrossRef]
  34. Zhao, Q.; Bai, Z.; Yang, Z.; Xin, L. Yunnan Province Second National Land Survey Report; China Science and Technology Press: Beijing, China, 2015. [Google Scholar]
  35. Gao, W.; Song, Q.; Zhang, H.; Wang, S.R. Selection of priority conservation areas based on ecosystem service functions and wildlife habitat suitability evaluation: A case study in the Sanjiang-yuan Region. Ecol. Environ. Sci. 2024, 33, 1318–1328. [Google Scholar] [CrossRef]
  36. Guo, F.; Liu, X.; Chen, X.; Li, H.; Mamat, Z.; Liu, J.; Liu, R.; Wang, R.; Xing, L.; Li, J. Assessment of the Spatiotemporal Dynamics of Suitable Habitats for Typical Halophytic Vegetation in China Based on Maxent Model and Landscape Ecology Theory. Forests 2024, 15, 1757. [Google Scholar] [CrossRef]
  37. Liu, L.; Qin, F.; Liu, Y.; Hu, Y.; Wang, W.; Duan, H.; Li, M. Forecast of potential suitable areas for forest resources in Inner Mongolia under the Shared Socioeconomic Pathway 245 scenario. Ecol. Indic. 2024, 167, 112694. [Google Scholar] [CrossRef]
  38. Chen, S.; Zhang, R.; Zhang, X.; Zhao, W.; Rong, Y.; Deng, B.; Wang, L.; Liu, Q.; Liu, L. Potential distribution of Apocynum based on MaxEnt optimization model. J. Beijing Norm. Univ. Nat. Sci. 2023, 59, 377–387. [Google Scholar] [CrossRef]
  39. Nelson, E.; Mendoza, G.; Regetz, J.; Polasky, S.; Tallis, H.; Cameron, D.; Chan, K.M.; Daily, G.C.; Goldstein, J.; Kareiva, P.M.; et al. Modeling multiple ecosystem services, biodiversity conservation, commodity production, and tradeoffs at landscape scales. Front. Ecol. Environ. 2009, 7, 4–11. [Google Scholar] [CrossRef]
  40. Sharp, R.; Tallis, H.T.; Ricketts, T.; Guerry, A.D.; Wood, S.A.; Chaplin-Kramer, R.; Nelson, E.; Ennaanay, D.; Wolny, S.; Olwero, N.; et al. InVEST User’s Guide; The Natural Capital Project, Stanford University, University of Minnesota: Minneapolis, MN, USA, 2019. [Google Scholar]
  41. Chu, L.; Zhang, X.R.; Wang, T.W.; Li, Z.X.; Cai, C.F. Spatial-temporal evolution and prediction of urban landscape pattern and habitat quality based on CA-Markov and InVEST model. Chin. J. Appl. Ecol. 2018, 29, 4106–4118. [Google Scholar] [CrossRef]
  42. Hao, Y.; Zhang, N.; Du, Y.J.; Wang, Y.H.; Zheng, Y.D.; Zhang, C.C. Construction of ecological security pattern based on habitat quality in Tang County, Hebei, China. Chin. J. Appl. Ecol. 2019, 30, 1015–1024. [Google Scholar] [CrossRef]
  43. Li, Y.; Zhao, X.-M.; Guo, X.; Zhou, B.-J.; Huang, X.-Y.; Yi, D.; Ding, H. Optimization of ecological red line in the hilly region of Southern China based on InVEST and MCR model. Nat. Resour. J. 2021, 36, 2980–2994. [Google Scholar] [CrossRef]
  44. Liang, C.; Mu, Y.; Zhi, L.; Liang, F.; Li, X.; Bai, J.; Li, P. Systematic conservation planning of freshwater wetlands in Pearl River Basin. J. Beijing Norm. Univ. Nat. Sci. 2021, 57, 142–150. [Google Scholar] [CrossRef]
  45. Xie, W.D.; Jia, J.; Bu, C.L.; Ma, L.M.; Guo, J.G.; Song, K.; Li, X.H.; Sun, Y.H.; Fang, Y. Comprehensive Assessment of Habitats of National Key Protected Birds and GAP Analysis of National Nature Reserves in Yanshan Mountains, China. Chin. J. Zool. 2022, 57, 170–184. [Google Scholar] [CrossRef]
  46. Zhu, Q.; Yu, K.J.; Li, D.H. The width of ecological corridor in landscape planning. Acta Ecol. Sin. 2005, 25, 2406–2412. [Google Scholar]
  47. Watt, M.E.; Ball, I.R.; Stewart, R.S.; Klein, C.J.; Wilson, K.; Steinback, C.; Lourival, R.; Kircher, L.; Possingham, H.P. Marxan with Zones: Software for optimal conservation-based land- and sea-use zoning. Environ. Model. Softw. 2009, 24, 1513–1521. [Google Scholar] [CrossRef]
  48. Mu, Y.L.; Liang, C.; Li, X.W.; Bai, J.H.; Cui, B.S.; Zhi, L.H.; Liang, F.Y.; Li, P.; Cheng, W.J.; Xiao, Z.Y. Identification of wetland conservation priority areas and gaps based on systematic conservation planning in Haihe River Basin, China. Acta Ecol. Sin. 2021, 41, 3836–3845. [Google Scholar]
  49. Dong, X.; Wang, F.; Fu, M. Research Progress and Prospects for Constructing Ecological Security Pattern Based on Ecological Network. Ecol. Indic. 2024, 168, 112800. [Google Scholar] [CrossRef]
  50. Niekerk, A.V. A comparison of land unit delineation techniques for land evaluation in the Western Cape, South Africa. Land Use Policy 2010, 27, 937–945. [Google Scholar] [CrossRef]
  51. Peng, J.; Guo, X.N.; Hu, Y.N.; Liu, Y.X. Constructing ecological security patterns in mountain areas based on geological disaster sensitivity: A case study in Yuxi city, Yunnan province, China. Chin. J. Appl. Ecol. 2017, 28, 627–635. [Google Scholar] [CrossRef]
  52. Zhang, L.; Li, J. Identifying priority areas for biodiversity conservation based on Marxan and InVEST model. Landsc. Ecol. 2022, 37, 3043–3058. [Google Scholar] [CrossRef]
  53. Xie, X.; Liang, C.; Li, X.W.; Wang, X.Y. Constructing a Priority Wetland Conservation Pattern and Identifying Conservation Gaps in the Liao River Basin. Wetl. Sci. 2021, 19, 451–457. [Google Scholar]
  54. Gao, J.X.; Xu, D.L.; Qiao, Q.; Zou, C.X.; Wang, Y.; Tian, M.R.; Wang, Y. Pattern construction of natural ecological space and planning theory exploration. Acta Ecol. Sin. 2020, 40, 749–755. [Google Scholar]
  55. Mie Re Yi-Habudechuke’er; Jicai, L.; Changle, S.; Li, J. Habitat quality assessment of desert ungulates in Kalamaili National Park based on MaxEnt-InVEST model. Nat. Prot. Areas 2024, 11, 1–16. [Google Scholar]
  56. Yang, R.; Hou, S.Y.; Zhang, Y.; Zhao, Z.C. The necessity and feasibility of constructing conservation compatible land in China. Biodivers. Sci. 2024, 32, 23454. [Google Scholar] [CrossRef]
  57. Wang, S.; Ma, Y.; Yao, W.; Shang, E.; Zhang, S.; Chen, F.; Zeng, Y. Ecological Assessment and Identification Strategy of Key Conservation Areas: A Case Study of the South Taihang Mountains Region. Biol. Conserv. 2024, 15, 110705. [Google Scholar] [CrossRef]
  58. Lin, J.L. Integrating Biodiversity with Ecosystem Services into Priority Areas Identification for Marine Ecological Protection: A Case Study of Nearshore Waters of Beibu Gulf in Guangxi, China. Ph.D. Thesis, Shanghai Ocean University, Shanghai, China, 2024. [Google Scholar]
  59. Yang, R.; Cao, Y. On the Prospective Scale of China’s Nature Reserves. Chin. Landsc. Archit. 2018, 34, 5–12. [Google Scholar]
  60. Tang, X.P.; Tian, H.; Jiang, Y.F.; Zhang, B.L. System optimization of in situ biodiversity conservation patterns. Res. Environ. Sci. 2024, 37, 2093–2099. [Google Scholar] [CrossRef]
  61. Li, M.; Zhong, L.S.; Wang, J.W. National Park Tourism Research in China: Research Course, Framework, and Prospect. Chinese J. Agric. Resour. Reg. 2024, 6. Available online: https://link.cnki.net/urlid/11.3513.S.20240624.1830.012 (accessed on 1 December 2024).
Figure 1. Geographical location map of the “Ailaoshan–Wuliangshan” National Park.
Forests 15 02159 g001
Figure 2. The ROC curve validation for major rare and endangered species of the AWNP.
Forests 15 02159 g002
Figure 3. Suitable distribution areas in the AWNP for major rare and endangered species.
Forests 15 02159 g003
Figure 4. Habitat quality assessment of the AWNP.
Forests 15 02159 g004
Figure 5. Priority conservation areas of the AWNP.
Forests 15 02159 g005
Figure 6. Double boundary conservation framework of the AWNP.
Forests 15 02159 g006
Table 1. Main biotic conservation objects of the AWNP.
Serial NumberSpecies NamesConservation Status in ChinaIUCN StatusUmbrella Species,
Flagship Species Type
1The western black-crowned gibbon (Nomascus concolor)Level ICRFlagship species
2the green peafowl
(Pavo muticus)
Level IENUmbrella species
3Phayre’s leaf monkey (Trachypithecus phayrei)Level IENRare and endangered species
4Himalayan yew
(Taxus wallichiana)
Level IENRare and endangered species
Notes: IUCN: International Union for Conservation of Nature. CR: critically endangered. EN: endangered. Flagship species are species that have high visibility or symbolic value and are often used to raise public awareness of the importance of conservation efforts. The ecological services they provide include education and awareness-raising, as well as having cultural and tourism value. Flagship species frequently become key attractions for tourists, driving ecotourism and increasing local economic income. Umbrella Species are those whose conservation has a broad coverage effect. Protecting these species often leads to the protection of habitats for other species. The ecological services they provide include habitat protection, as conserving the habitat of umbrella species indirectly protects the habitats of many other species, thus enhancing biodiversity; and ecosystem stability, as these species maintain the food chain and ecological balance, contributing to the health and stability of ecosystems. Rare and endangered species are those with very small populations that face the risk of extinction. Their conservation is crucial for maintaining the health of ecosystems.
Table 2. Environmental factors used for the MaxEnt model.
TypeCodeEnvironmental Variables
Bioclimatic VariablesBio2Mean diurnal temperature range (°C)
Bio3Isothermality (annual range/diurnal range) (°C)
Bio5Maximum temperature of warmest month (°C)
Bio14Precipitation of driest month (mm)
Bio15Precipitation seasonality (m) (coefficient of variation)
Bio17Precipitation of driest quarter (mm)
Bio19Precipitation of coldest quarter (mm)
Topographic Factors SloSlope
AltAltitude
AspAspect
Proximity Factors DisDistance to water area
Table 3. Parameters for threat factors.
ThreatMax-DistWeightDecay
Urban construction land50.8Exponential
Cropland0.50.5Exponential
Main highways (highways, secondary roads)30.8Linear
Other roads (class III highways and county and township roads)10.6Linear
Table 4. Sensitivity of different habitat types to threat factors.
LULCHabitat TypeHabitat QualityThreat Factors
Urban Construction LandCroplandMain RoadsOther Roads
0No data00000
1Woodland0.90.80.80.80.6
4Shrubland0.80.70.60.50.4
10Sparse forest land0.60.60.60.50.6
6Other forest land (nursery site, forestry supporting production land)10.80.80.50.3
3Cropland0.40.50.250.30.2
8Grassland0.60.30.10.20.2
5Water area0.900.10.30.2
2Construction land00000
9Other land uses0.200.40.10.1
7Unused land (asture land)00000
Table 5. Assignment of conservation Cost.
Cost FactorCost Factor EffectConservation Cost
Highways (20–30 m\100–120 km/h)Influence zone of 5 km buffer70
Influence zone of 2 km buffer50
Secondary roads (8–12 m\60–80 km/h)Influence zone of 3 km buffer60
Influence zone of 1 km buffer40
Class III highways (6–8 m\40–60 km/h)Influence zone of 3 km buffer60
Influence zone of 1 km buffer40
County and township roads (4.5–6 m\20–40 km/h)Influence zone of 1 km buffer40
Influence zone of 500 m buffer20
Human footprint intensityDensity 20.25–49.1650
Density 11.51–20.2530
Density 3.08–11.5110
Land useConstruction Land70
Cropland, Unused Land, Other Land Uses50
Shrubland, Grassland30
Other Forest Land, Sparse Forest Land20
Woodland, Water Area10
Disclaimer/Publisher’s Note: The statements, opinions and data contained in all publications are solely those of the individual author(s) and contributor(s) and not of MDPI and/or the editor(s). MDPI and/or the editor(s) disclaim responsibility for any injury to people or property resulting from any ideas, methods, instructions or products referred to in the content.

