Article

Climate Change Threatens the Habitat of Pinus massoniana in China

1
Heihe Remote Sensing Experimental Research Station, Key Laboratory of Remote Sensing of Gansu Province, Northwest Institute of Eco-Environment and Resources, Chinese Academy of Sciences, Lanzhou 730000, China
2
School of Geography, Liaoning Normal University, Dalian 116029, China
3
Faculty of Geographical Science, Beijing Normal University, Beijing 100875, China
4
Qinghai Research and Design Institute of Environmental Science, Xining 810008, China
5
College of Eco-Environmental Engineering, Qinghai University, Xining 810016, China
*
Author to whom correspondence should be addressed.
These authors contributed equally to this work.
Forests 2024, 15(2), 323; https://doi.org/10.3390/f15020323
Submission received: 15 November 2023 / Revised: 8 January 2024 / Accepted: 30 January 2024 / Published: 8 February 2024
(This article belongs to the Section Forest Meteorology and Climate Change)

Abstract

:
Pinus massoniana Lamb. is one of the main timber tree species. There is a large artificial planting area in South China, and this tree has important economic and ecological value. In this research, we built a comprehensive habitat suitability model based on 115 current data and 22 environmental variables to analyze the potential suitable habitat distribution of this species. Future climate change scenarios were defined as four shared socioeconomic pathways (SSPs): SSP 1–2.6, SSP 2–4.5, SSP 3–7.0, SSP 5–8.5) and four periods (including 2021–2040, 2041–2060, 2061–2080, and 2081–2100) based on nine global circulation model datasets. To fully consider the potential distribution of P. massoniana under specific climate change conditions and soil conditions, we constructed an ensemble model using four commonly used model algorithms. The results indicated that the current suitable habitat for P. massoniana covers approximately 1.10 × 10⁶ km2 in southeastern China. In the future, the model results showed that under different climate change scenarios and at different times, the change in suitable habitat for P. massoniana varied; moreover, under moderate climate change scenarios, the average temperature decreased by less than 3 °C and the suitable habitat area decreased slightly, with an area larger than 0.95 × 10⁶ km2. However, under intense warming scenarios, for which the average temperature increased above 3 °C, the suitable habitat for P. massoniana decreased. In the most severe warming scenario, the suitable habitat area for P. massoniana was reduced to 44% of the base climate conditions with severe habitat fragmentation, which should be fully considered in future planting initiatives and plant protection.

1. Introduction

Plant growth and distribution are influenced predominantly by climate, with temperature and precipitation regulating water and heat conditions [1,2,3]. Climate change, characterized by global warming, has emerged as one of the most significant environmental challenges worldwide [4,5]. Consequently, plants migrate toward higher latitudes and altitudes, leading to changes in regional species diversity patterns, which can impact regional ecological security and ecosystem functions [6,7,8]. As biodiversity conservation under climate change has gained increased attention, niche models have become popular tools for investigating the impact of climate change on plant distributions [9,10,11,12]. Considering species dispersal limitations, the habitat area of most forest tree species is significantly reduced, posing a challenge to future forest management, utilization, and preservation [13]. However, previous studies have mainly focused on the biota of natural forests and commercially popular timber species, while native timber species, such as Pinus massoniana Lamb., have received comparatively limited scholarly attention. This species is the dominant plantation tree in the region, where it is grown in pure stands. As such, changes in habitat can have extensive impacts on ecosystems and socioeconomic systems [14,15]. Consequently, modeling the shifts in the distribution ranges of plantation tree species under projected climate change scenarios is both practical and theoretically important.
Niche modeling, a robust predictive instrument, leverages species occurrence data and environmental factors to mathematically represent species niches [16,17]. This approach facilitates the mapping of species’ potential distributions across landscapes and forecasts spatial and temporal distribution shifts [12,16]. In recent decades, a multitude of statistical algorithms have been devised to enhance the precision and applicability of niche modeling. Among these, MaxEnt, random forest (RF), the generalized boosted model (GBM), and the generalized additive model (GAM) have gained popularity [18,19,20,21,22]. MaxEnt is the most widely used algorithm, owing to its high precision, robustness, and fast runtime, and is based on the maximum entropy principle [18,19]. The RF algorithm employs an ensemble classifier to construct numerous decision trees, each based on a randomly selected subset of training samples and variables [20]. The GBM is a data processing algorithm that employs boosting to significantly improve the accuracy of weak classification algorithms [21]. The GAM is a commonly used statistical regression model that can effectively simulate nonlinear relationships between variables and is adaptable to different types of variables, making it highly precise and versatile [22]. Recently, an ensemble model (EM) strategy has been proposed to mitigate uncertainty associated with algorithm selection; this approach significantly enhances the model’s accuracy and applicability, thereby concurrently diminishing uncertainty [23,24,25].
P. massoniana is a prominent timber species in China and is distinguished by its rapid growth, robust adaptability, drought resistance, and low environmental requirements [15,26,27]. It has been widely planted, covering more than 20% of the afforestation area in China, and is capable of growing in poor site conditions and regenerating naturally as a secondary succession pioneer species following disturbances, playing a crucial role in regional community succession and ecological protection and management [27]. Moreover, as a major resin-producing tree species with multiple advantages, such as medicinal value, timber stock, pulp fiber, and firewood, P. massoniana has high economic value [28]. Therefore, forecasting future shifts in its distribution under various climate scenarios is crucial for informing the cultivation strategies and resource stewardship of P. massoniana.
In this study, we constructed a comprehensive habitat suitability (CHS) model based on 115 current data and 22 environmental variables to predict the distribution of suitable habitat areas for P. massoniana under basic climate conditions and quantified its relationship with environmental variables. Then, we predicted the suitable habitat of these species under four shared socioeconomic pathways (SSPs: SSP 1–2.6, SSP 2–4.5, SSP 3–7.0, and SSP 5–8.5) [29,30] and four periods (including 2021–2040, 2041–2060, 2061–2080, and 2081–2100) based on data from nine global circulation models. This research provides a theoretical basis for artificial plant planning and plant protection.

2. Materials and Methods

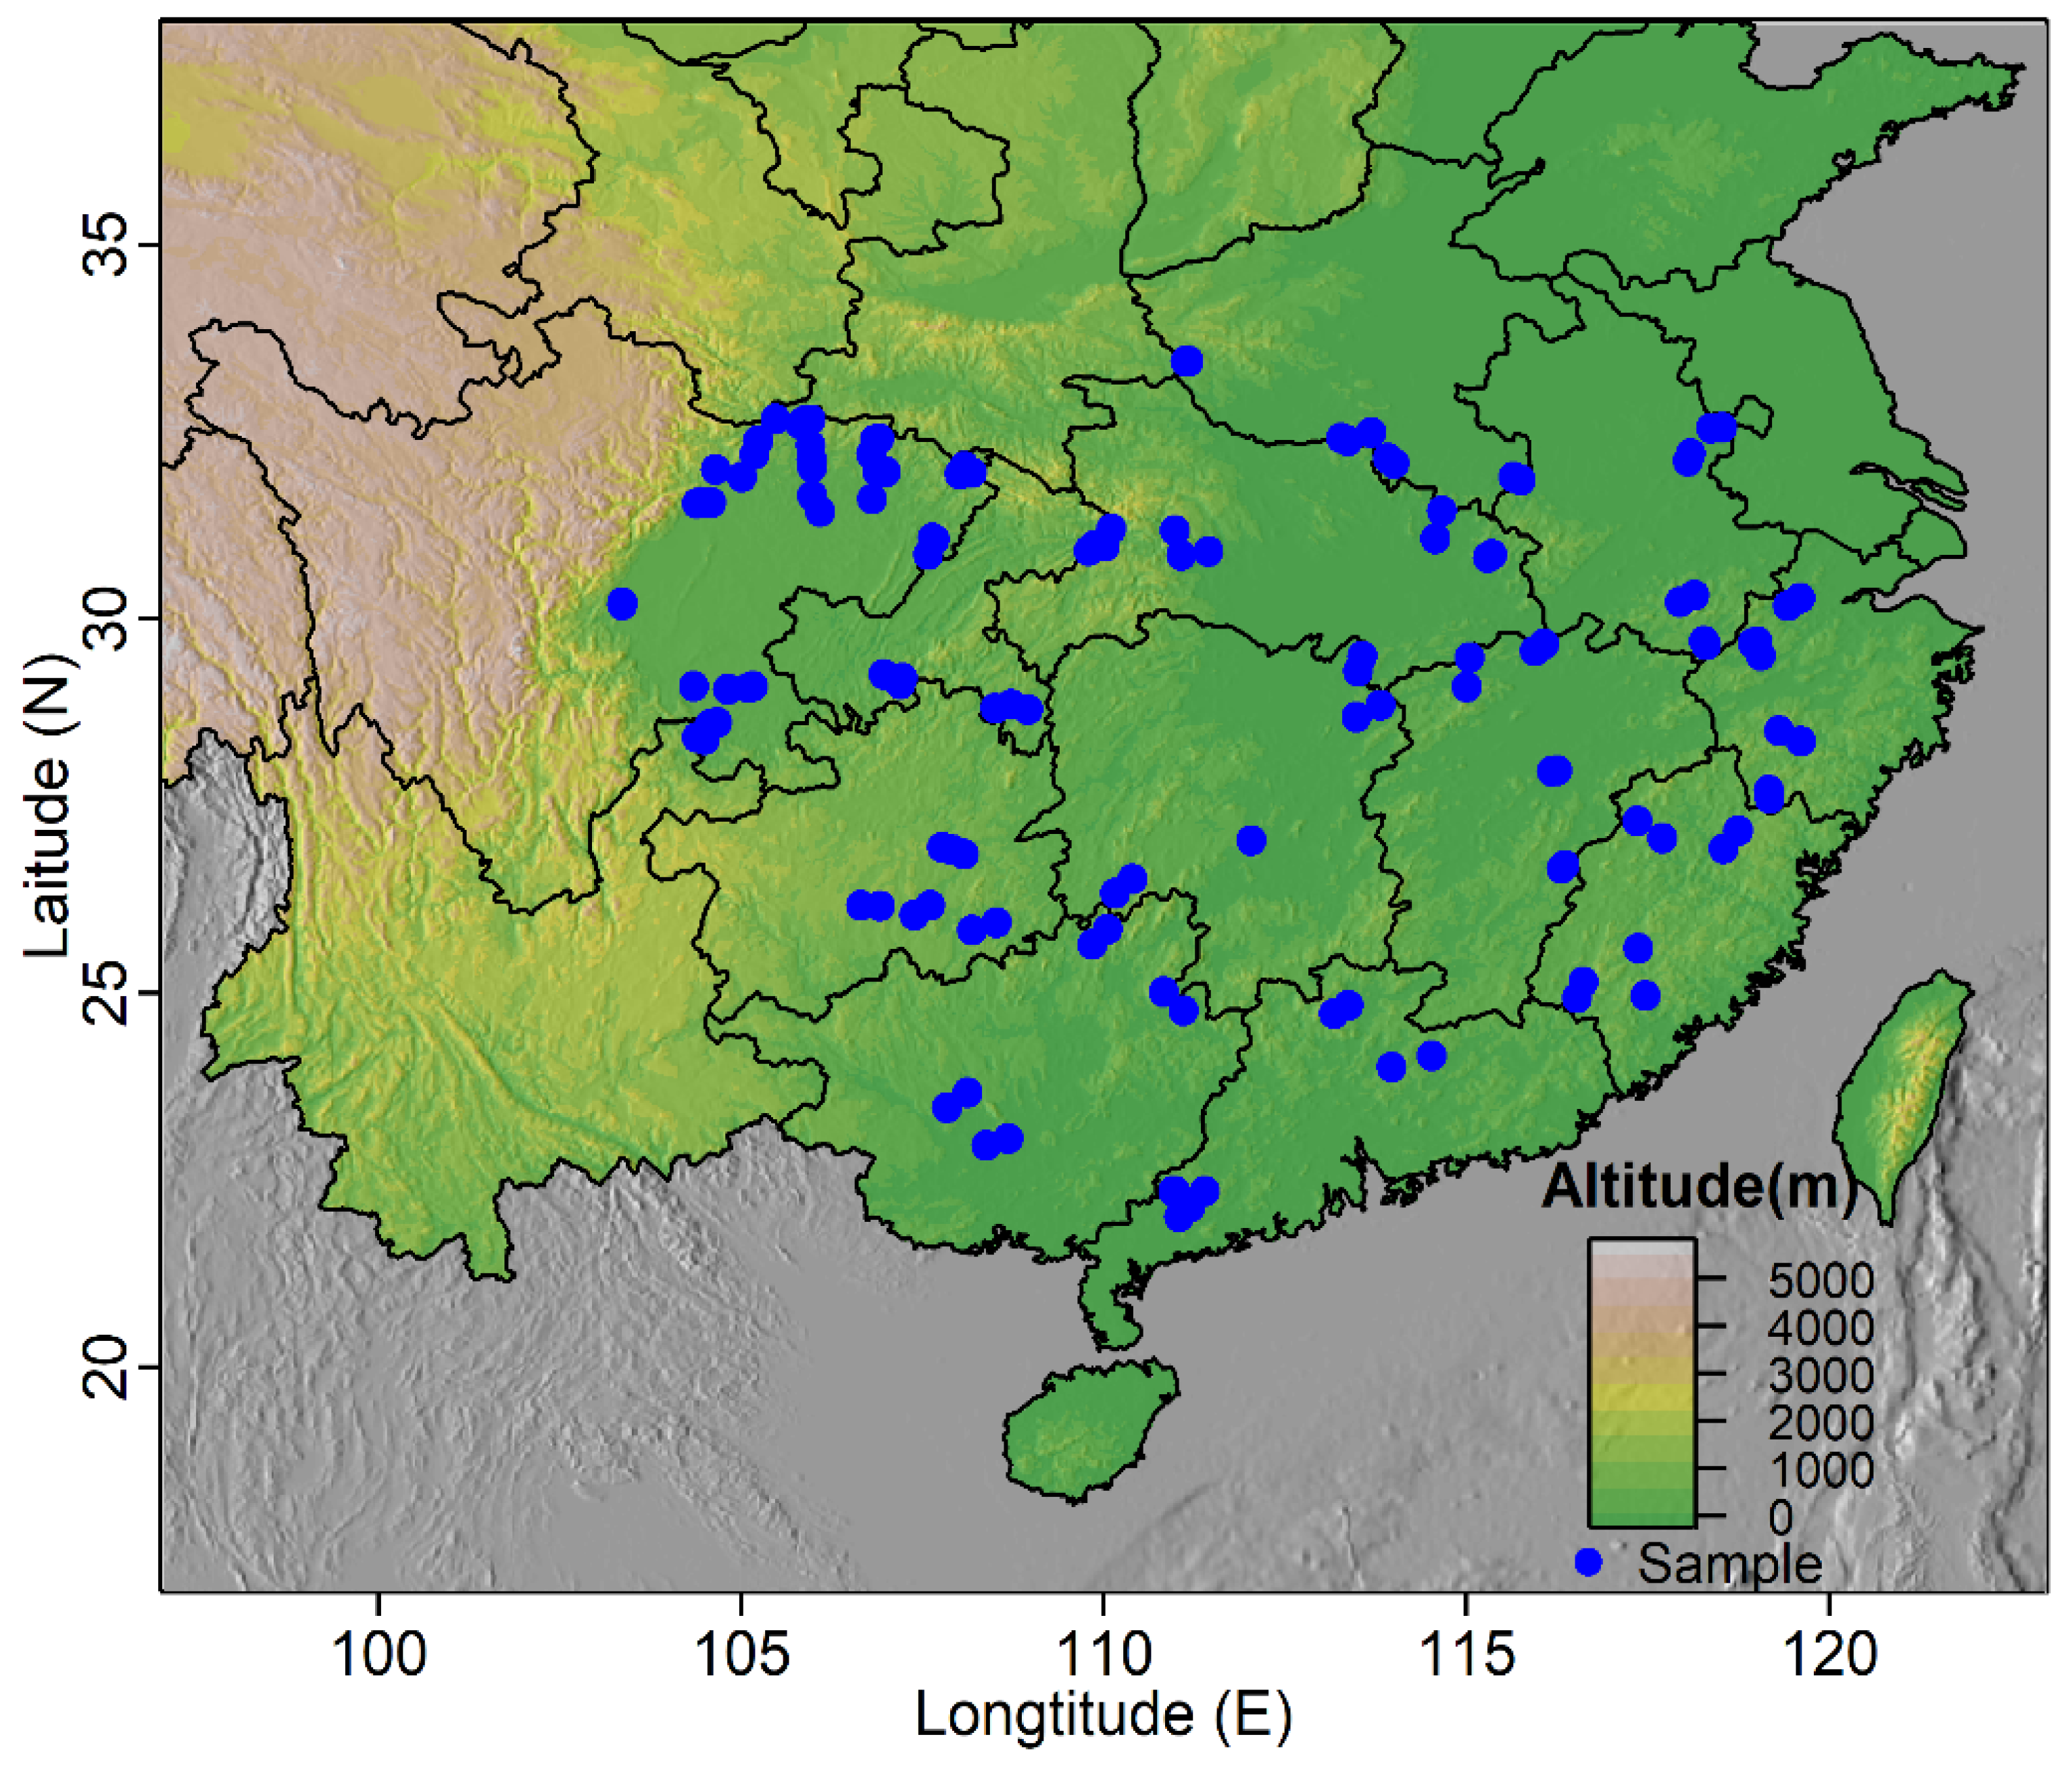
2.1. Species Occurrence Data

In this study, occurrence data for P. massoniana were obtained from the previously published scientific literature [28,31,32]. To ensure the accuracy and reliability of the data, we included only data with precise latitude and longitude information, which were typically obtained through field surveys in previous studies. Duplicate coordinates and incomplete information were removed from the dataset. Additionally, to ensure the resolution of the environmental variables, we further refined the data to ensure that each evaluation unit (grid range) contained no more than one sample site. Ultimately, we obtained a dataset of 115 occurrence data points that were used to construct the model (Figure 1).

2.2. Environmental Variables

The success of niche modeling relies on the accuracy and comprehensiveness of the environmental variables data used in the model [33,34,35]. In this study, we selected 2 types of environmental datasets, climate, and soil, consisting of a total of 44 environmental variables to simulate the potential distribution of P. massoniana. The climate dataset included 19 bioclimatic variables [36], 12 monthly average radiation variables, and topographical variables such as elevation, slope, and aspect. The soil variables were obtained from the Harmonized World Soil Database (HWSD), which integrates various soil databases, including the 1:1 million Chinese soil databases, and we selected 10 topsoil properties to build the model. These variables were selected based on previous studies and the known habitat conditions of P. massoniana.
This study utilized nine global circulation models (GCMs) to derive future climate change scenario data. These models, namely BCC-CSM2-MR, CNRM-CM6-1, CNRM-ESM2-1, CanESM5, GFDL-ESM4, IPSL-CM6A-LR, MIROC-ES2L, MIROC6, and MRI-ESM2-0, are often employed in species distribution modeling due to their comprehensive data availability. Among these, BCC-CSM2-MR, developed by the China National Climate Center, is especially recognized for its adept simulation of China’s climate, highlighting its significance in climate research. These scenarios were developed based on four shared socioeconomic pathways (SSPs) that include SSP1-2.6 (warming to below 2 °C), SSP2-4.5 (around 3 °C) by 2100, SSP3-7.0 (middle of the road temperature increase of 2.7 °C to 3.6 °C), and SSP5-8.5 (worst-case increase of 3.0 °C to 5.7 °C) [29,30]. Employing these climate change projections, we modeled the potential distribution of suitable habitats for P. massoniana across four future periods: 2021–2040, 2041–2060, 2061–2080, and 2081–2100.
Prior research indicates that multicollinearity among environmental variables may amplify uncertainty in model outcomes by disproportionately accentuating certain environmental gradients [23,37]. Thus, it is necessary to screen environmental variables to reduce the effect of multi-collinearity. In this study, we employed principal component analysis (PCA) and correlation analysis to select climate variables in groups [23,38,39]. First, we conducted PCA on the 19 bioclimatic variables and selected bio2 (mean diurnal temperature range) and bio19 (precipitation of the coldest quarter) as dominant variables based on the long axis of the species niche ellipse, which was drawn in the mathematical space derived from environmental variables (Figure 2). We then used correlation analysis to select additional bioclimatic variables with a correlation coefficient less than 0.75, resulting in the selection of bio1 (annual mean air temperature), bio7 (annual temperature range), bio12 (annual precipitation), bio15 (precipitation seasonality), and bio19. Similar methods were applied to select radiation variables (srad_01, srad_05, srad_08, and srad_09) and topographic variables (slope and aspect), while altitude was excluded due to its strong correlation with the bio1 variable. In total, 12 climate-related environmental variables were included in the model (Table 1), and PCA was conducted again (Figure 2), which revealed that the climate variables were evenly distributed in the mathematical space, with more than half of them being located around the long axis of the P. massoniana niche. As all the correlation coefficients in the 10 soil variables were less than 0.6, we included all of them in the model.

2.3. Model Evaluation

In this study, we constructed both a climate suitability model and a distribution limitation model. Subsequently, we derived the CHS model outcomes by intersecting the outputs of these two models. The climate suitability model predicts the migratory trends of species distribution under scenarios of climate change (Supplementary Table S1), while the distribution limitation model projects the potential maximum extent of suitable habitats constrained by soil factors (Supplementary Table S2).

2.3.1. Climate Suitability Model

This study employed an ensemble modeling (EM) strategy, integrating four prevalent algorithms—MaxEnt, RF, the GBM, and the GAM—into a unified framework to build a climate suitability model for simulating the potential distribution of P. massoniana under designated climatic scenarios. The modeling was executed via the biomod2 package in the R (V4.1.0) programming environment. Specifically, biomod2 interfaced with the external MaxEnt software (V3.4.3) for simulations, while for RF, it employed an algorithm noted for its effective prediction capabilities as cited in [40], with foundational code from [41]. The GBM relied on the principle of residual minimization to iterate the algorithm and generated a classifier with the best result by averaging all weak classifiers [21]. In the practical modeling process, we followed the technical framework introduced by Guisan et al. [23]. This involved using the same pseudo-absence points across all four algorithms, comprising 2000 randomly generated points distributed throughout China. To address the uncertainty stemming from this randomization, we generated five distinct sets of pseudo-absence points for each model iteration. Alongside this, we implemented a five-fold cross-validation method for every sample data group to facilitate model training and error estimation.
The performance of the model was evaluated using the true skill statistic (TSS), which is a commonly used metric for evaluating the accuracy of species distribution models. The TSS concentration was calculated using Equation (1) as follows:
T S S = a d b c   ( a + c ) ( b + d )
where a represents the number of true positives, b refers to the number of false positives, c refers to the number of false negatives, and d refers to the number of true negatives. Given that the model algorithm generates a continuous output from 0 to 1, it necessitates a threshold to transmute these continuous values into binary outcomes. Variations in classification thresholds correspond to different TSS values for the model. We define the optimal TSS value as TSSmax.
In this research, an EM approach was utilized to mitigate uncertainty stemming from algorithmic variability. Initially, each of the four algorithms was executed ten times. Subsequently, only the models yielding a TSSmax exceeding 0.7 were incorporated into the EM construction. The weight of each model in the EM was determined by dividing its TSSmax value by the sum of all models’ TSSmax values. The equation for calculating the weight of each model in the EM is shown below:
E M i = j = 1 n W j × X i j
where EMi refers to the result of the EM model of evaluation unit (grid) i; wj refers to the weight of the results of model j; and xij refers to the value of evaluation unit i in the results of model j. We used the threshold of TSSmax to binarize the results of the EM, namely suitable habitat and unsuitable habitat. Technical details on the applied ensemble model can be found in [23].

2.3.2. Distribution Limitation Model

Soil plays a pivotal role in shaping the potential distribution of P. massoniana, with soil type serving as an indicator of the physical and chemical properties of soil. Currently, among niche models, only MaxEnt is capable of effectively incorporating qualitative data as environmental variable inputs [18]. Here, we utilized ten soil variables alongside occurrence data of P. massoniana to construct a MaxEnt model aimed at assessing soil suitability requirements. We employed the TSS to gauge model performance. The model outputs a probability value between 0 and 1. We established a threshold value, which was set as the minimum required to ensure that the evaluation unit captures over 90% of the species’ occurrences with a probability higher than this threshold. This method effectively categorizes the results into two distinct classes: suitable and unsuitable soil habitats.

2.3.3. Comprehensive Habitat Suitability Model

In this research, we developed a CHS model to evaluate the potential distribution of suitable P. massoniana habitats. This model was constructed by integrating the outcomes of both the climate suitability model and the distribution limitation model, with the final distribution being determined by the intersection of these two models. For each evaluation unit (grid), a CHS value was assigned, representing the convergence of climate suitability and distribution limitations, to provide a nuanced assessment of habitat viability for P. massoniana.
CHSi = TMiLi
where CHSi represents the comprehensive habitat suitability in evaluation unit i, TMi is the result of the climate suitability model in evaluation unit i under different climate change scenarios in the present and future, and Li is the result of the distribution restriction model in evaluation unit i.

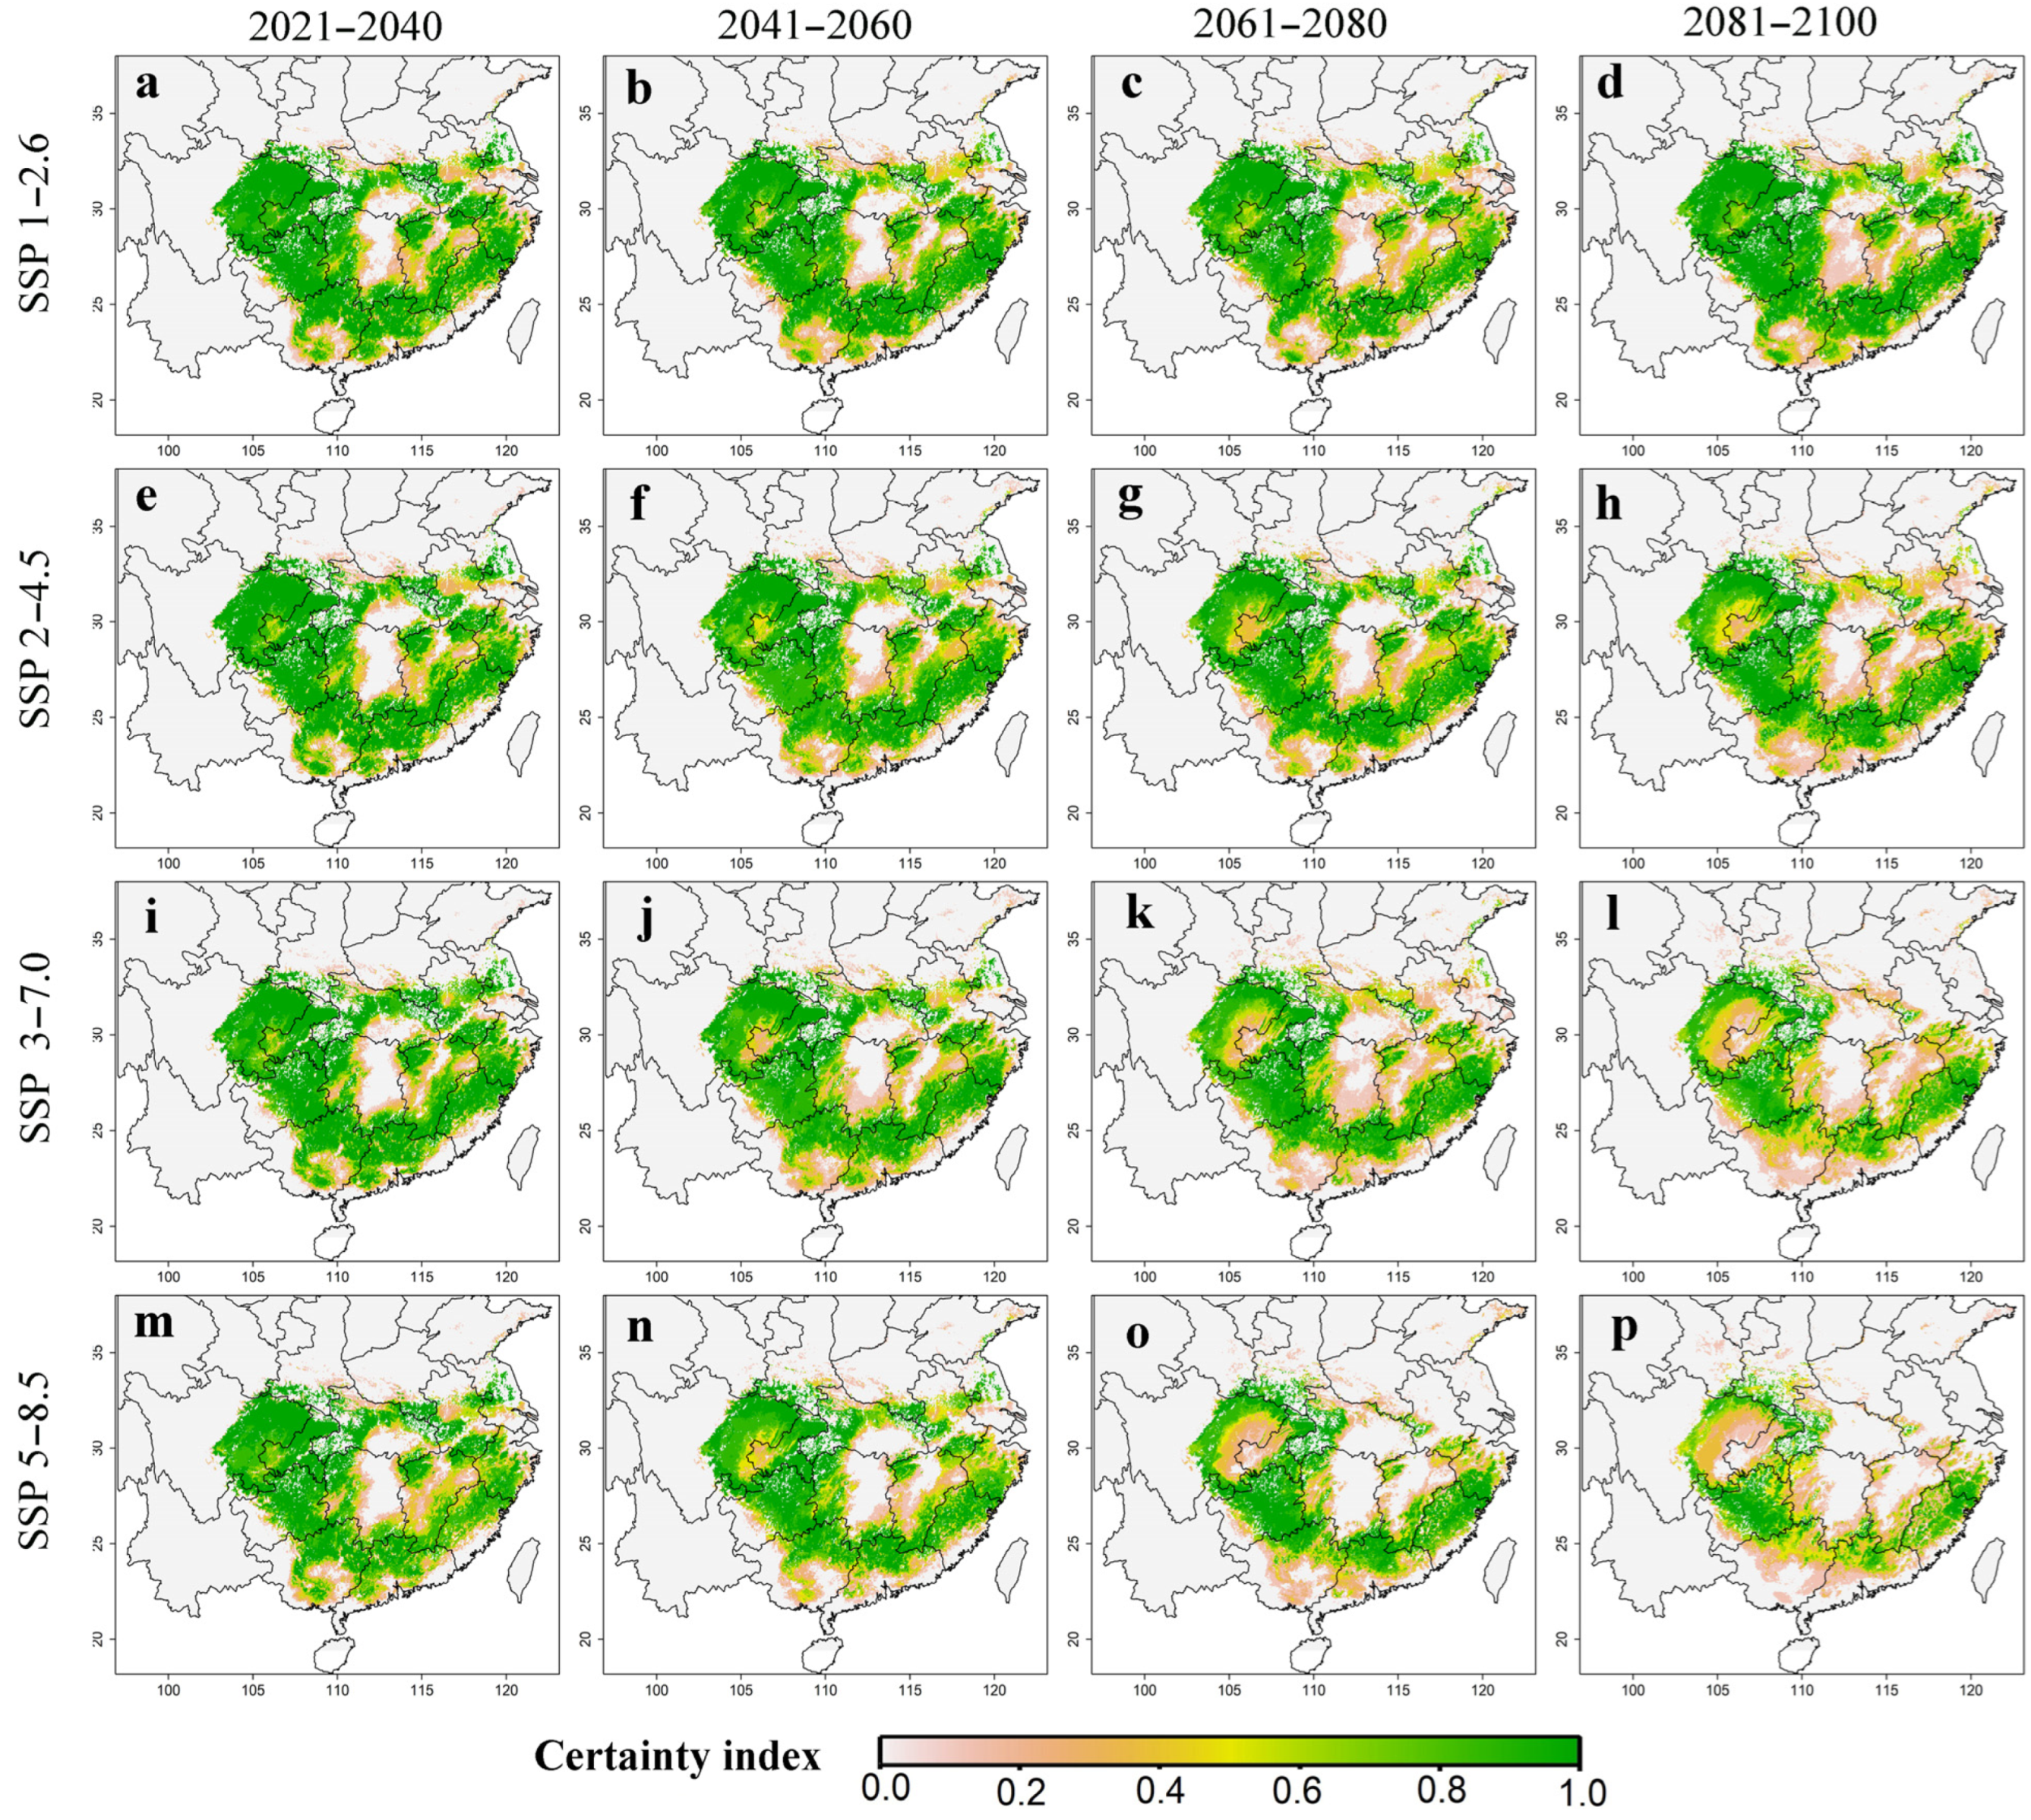
2.4. The Certainty Index of the Suitable Habitat of P. massoniana in the Future

Future climate scenarios predicted by different atmospheric general circulation models can introduce significant uncertainty to the model results. To address this issue, we computed a certainty index (Ci, Equation (4)) to estimate the confidence of future projections of suitable habitat for P. massoniana under specific climate change scenarios.
C i = 1 m C H S i j m
We evaluated 16 climate change scenarios comprising 4 shared socioeconomic pathways (SSPs) and four time periods. The Ci value was computed by summing the CHS model (CHSij) of evaluation unit i under the j-th GCM and then dividing it by the number of GCMs (m) used for the calculation under a particular climate change scenario. The certainty index employs a voting algorithm in the result calculation process. A specific grid cell was deemed a suitable habitat only if more than half of the GCM simulation results indicated its suitability. This method was adopted to reduce potential errors inherent in GCM simulations.

3. Results

3.1. Model Precision

In this research, model precision was gauged by the TSS. The mean TSS for all four algorithms employed in the climate suitability assessment exceeded 0.70, with individual operational TSS scores from these algorithms consistently above 0.65, indicating that the model results were scientifically sound (Figure 3). Additionally, the TSS value of the EM was 0.87, which was higher than all four model algorithms used in the climate suitability model, demonstrating the success of the model and the improved accuracy achieved through this approach. The TSS value of the distribution limited model was 0.83, which indicated that the model was successful and had a precise result.

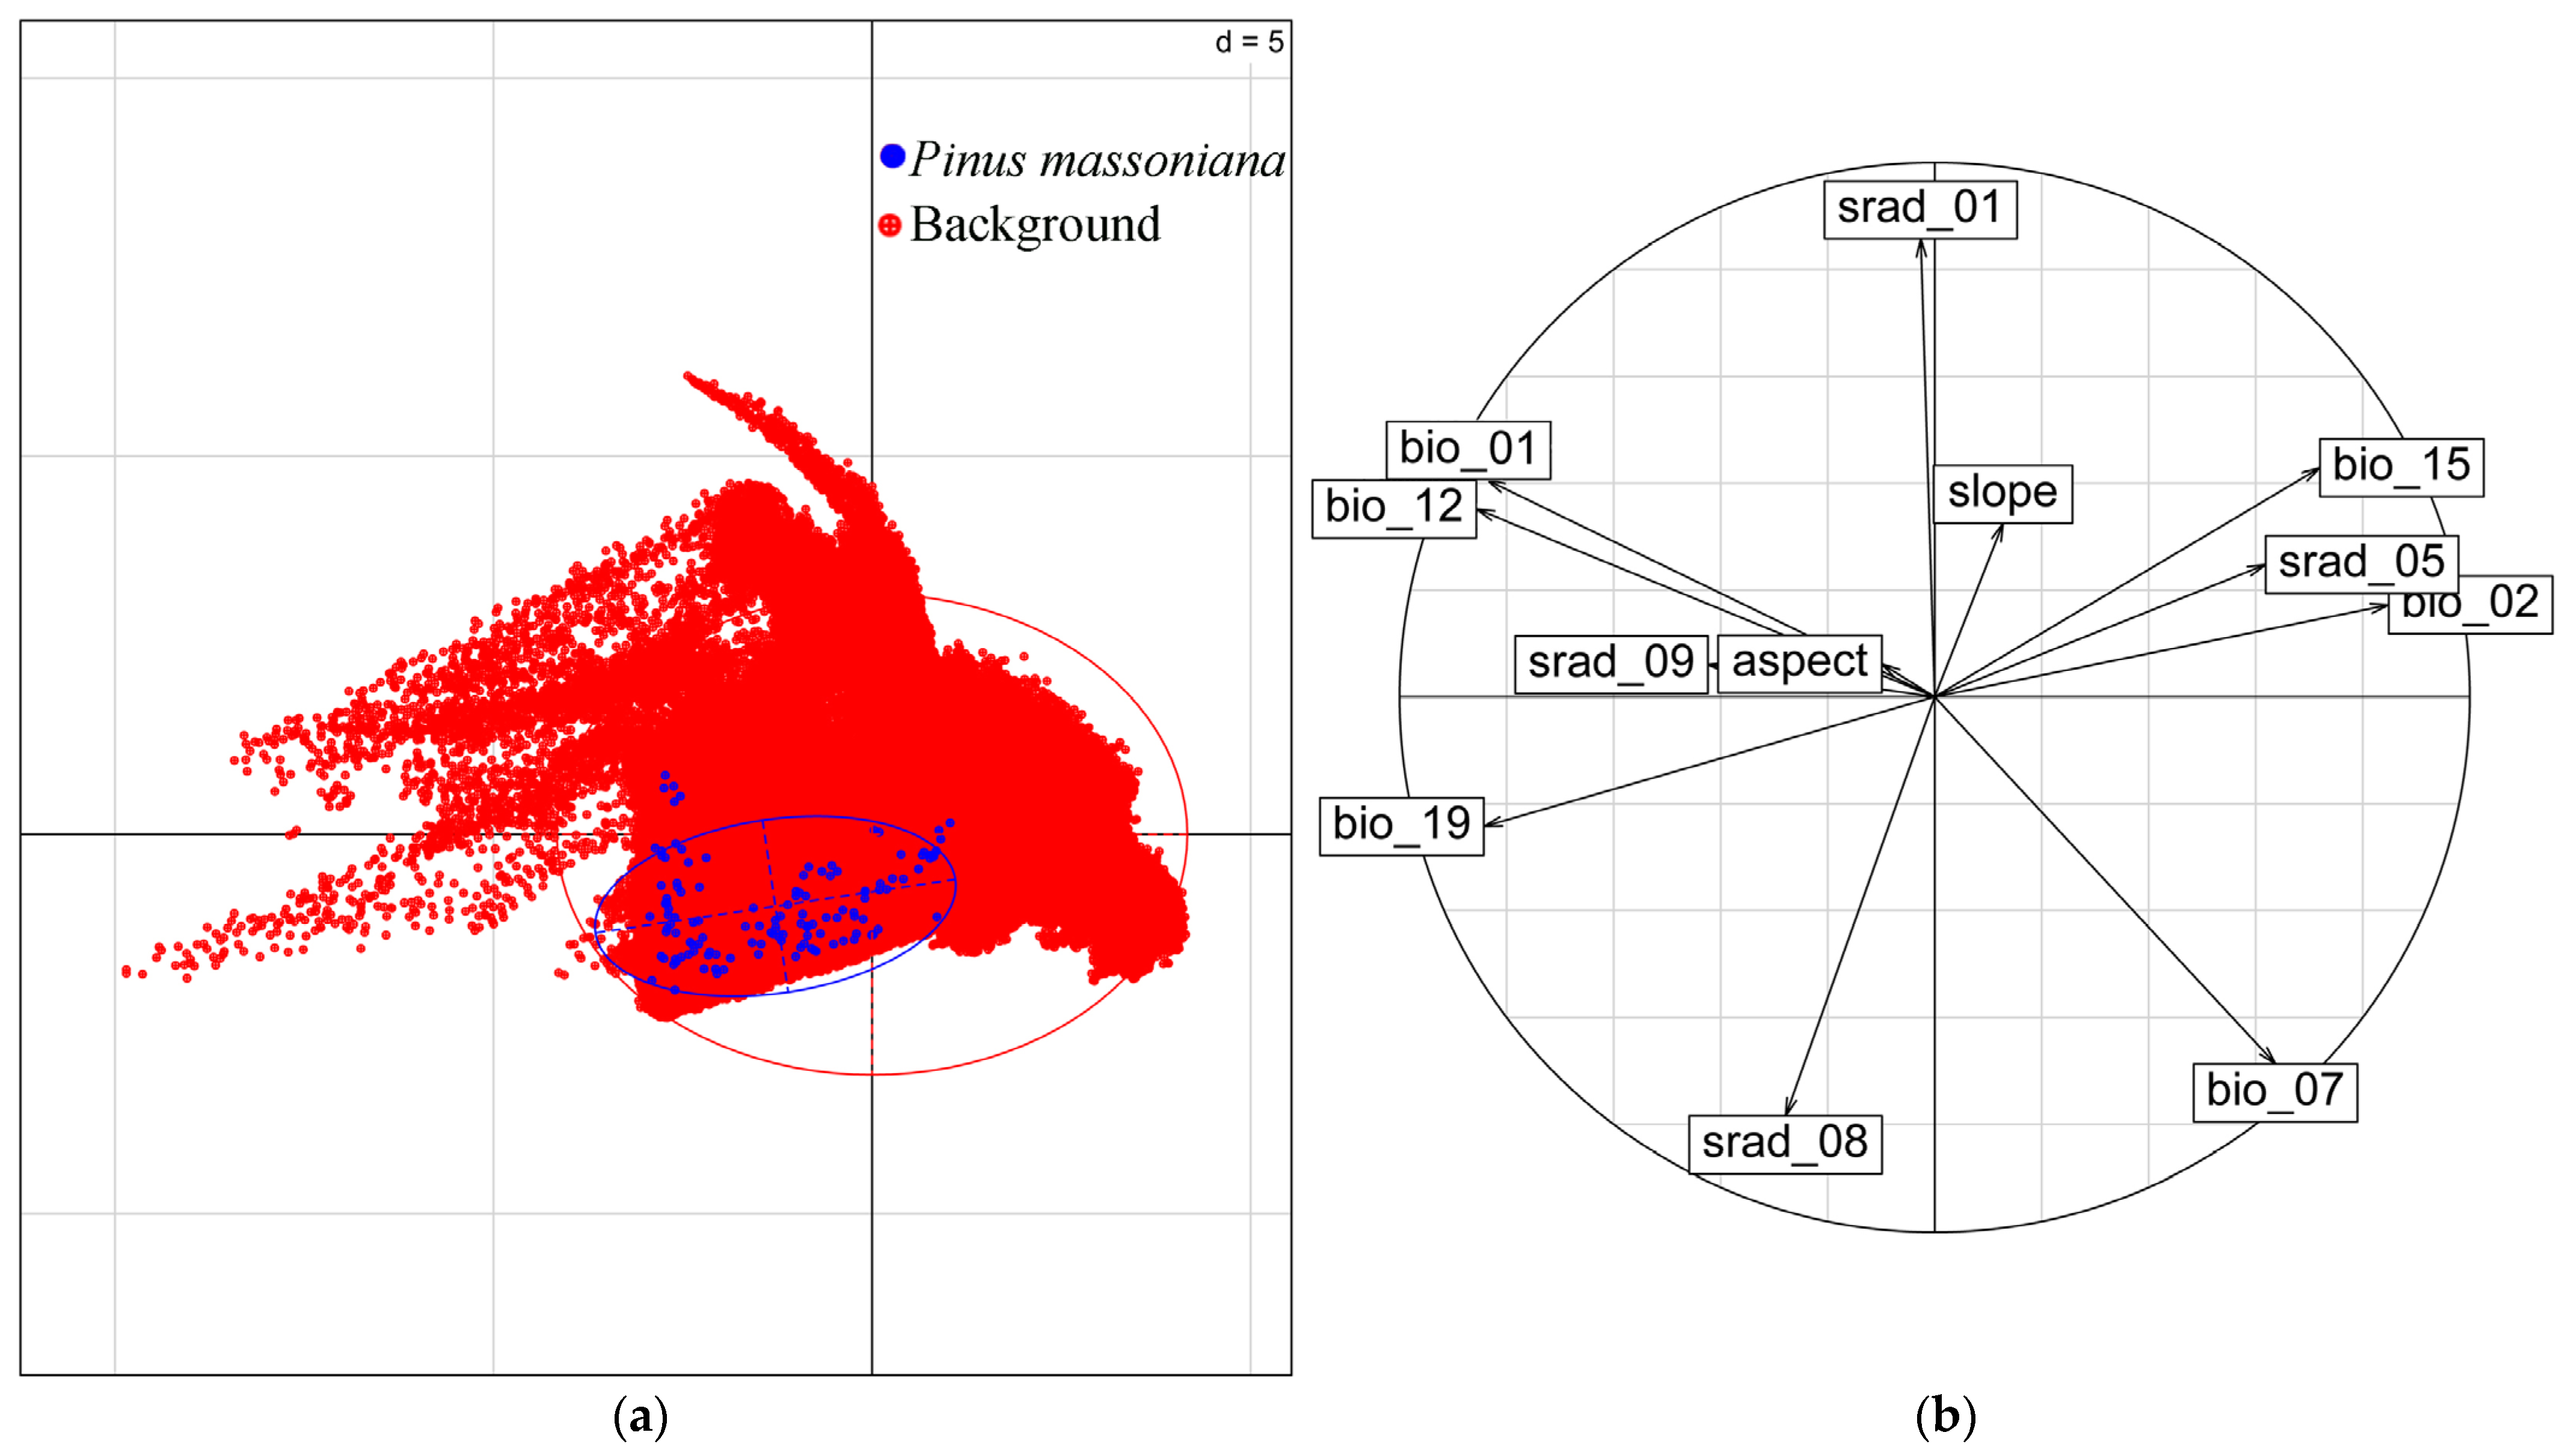
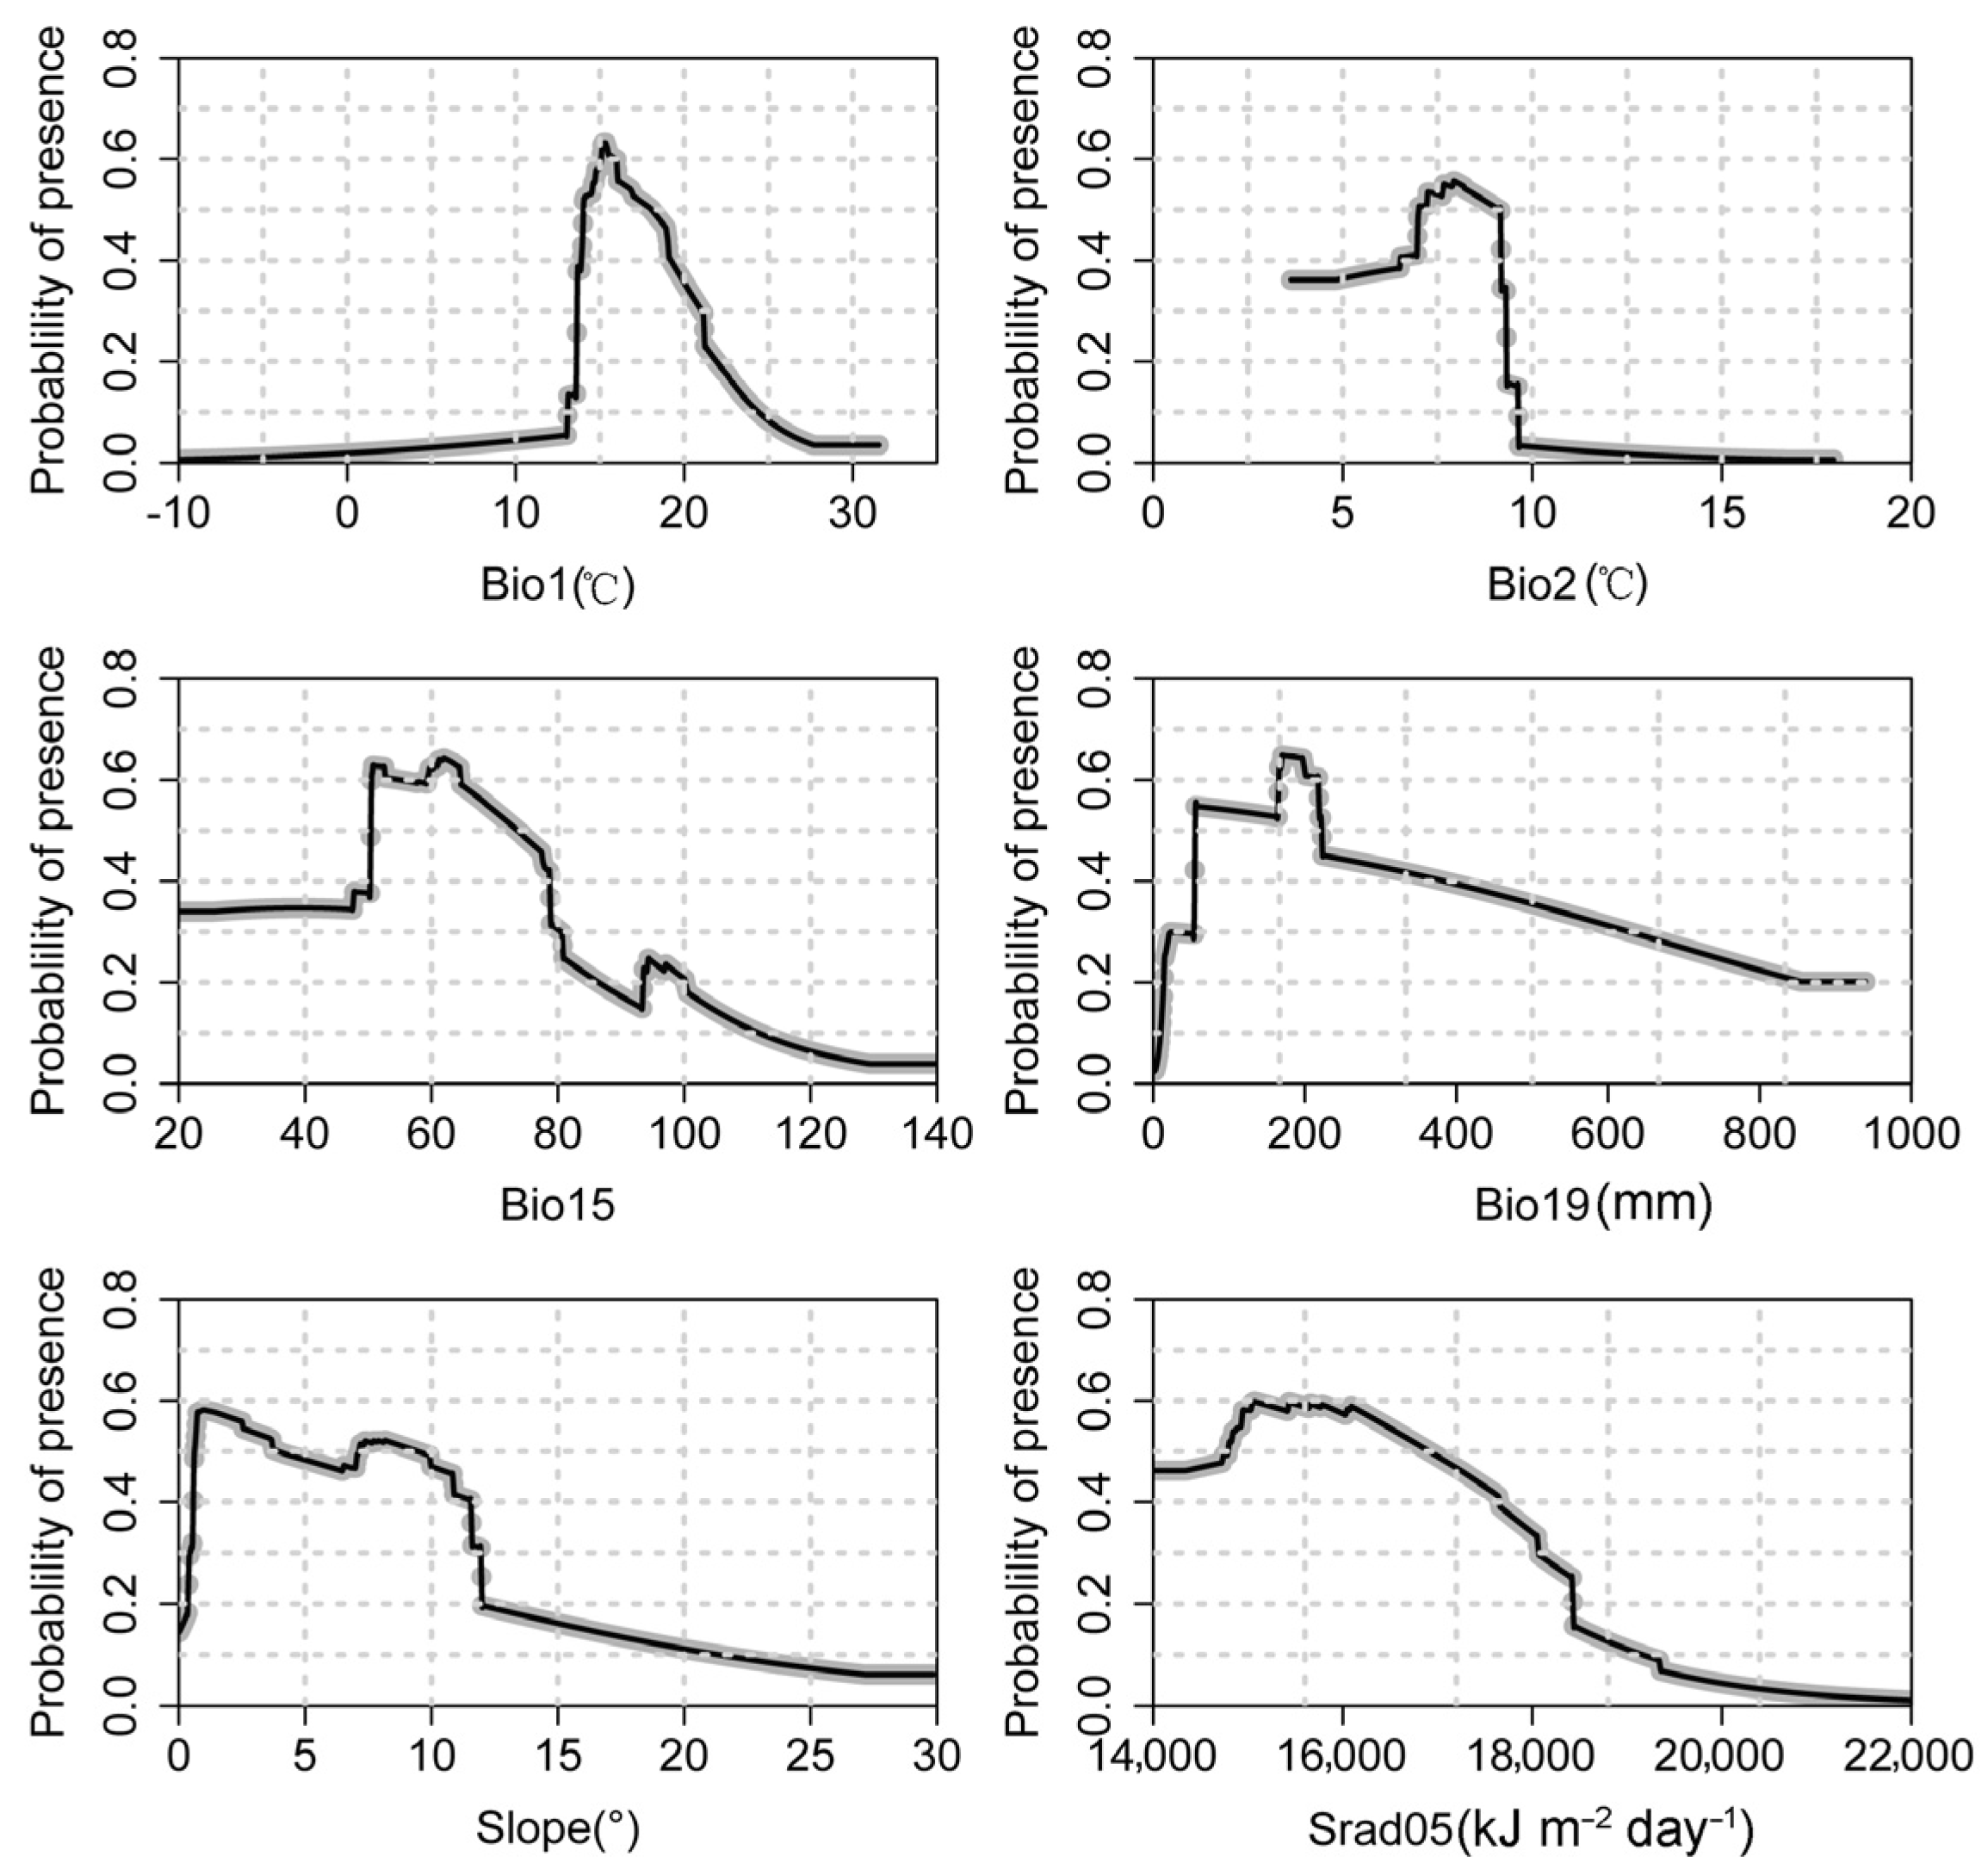
3.2. Dominant Environmental Variables Affecting the Distribution of P. massoniana

In this study, twelve environmental variables were employed to develop the climate suitability model via an ensemble method, comprising four distinct modeling algorithms. The importance of each environmental variable varies according to different modeling algorithms [42,43,44,45]. However, the major environmental variables that were found to affect the distribution of P. massoniana habitats were annual mean air temperature (Bio1), mean diurnal temperature range (Bio2), precipitation seasonality (Bio15), precipitation of the coldest quarter (Bio19), slope, and solar radiation in May (srad_05) based on the results of all models (Supplementary Table S1). To elucidate how the adaptability probability of species fluctuates with changes in individual environmental variables, we generated response curves for each variable (Figure 4). Additionally, by interpreting the response curves of P. massoniana, we identified the suitable ranges for each environmental variable, defined as those with a probability of presence exceeding 0.3. The results showed that the suitable ranges were 13–22 °C for annual mean air temperature, less than 9 °C for mean diurnal temperature range, less than 80% for precipitation seasonality, 30–800 mm for precipitation of the coldest quarter, less than 13° for slope, and greater than 18,000 kJ m−2 day−1 for solar radiation in May. The suitable temperature and precipitation ranges, slope, and solar radiation values provide insights into the niche characteristics of the species. Prior research indicates that P. massoniana is an intolerant, thermophilic tree species favoring high light conditions [35,46,47]. Its habitat typically experiences minimal interannual temperature and precipitation fluctuations, with the most critical environmental variables for its growth being the annual average temperature and precipitation during the coldest season [35,46,47].

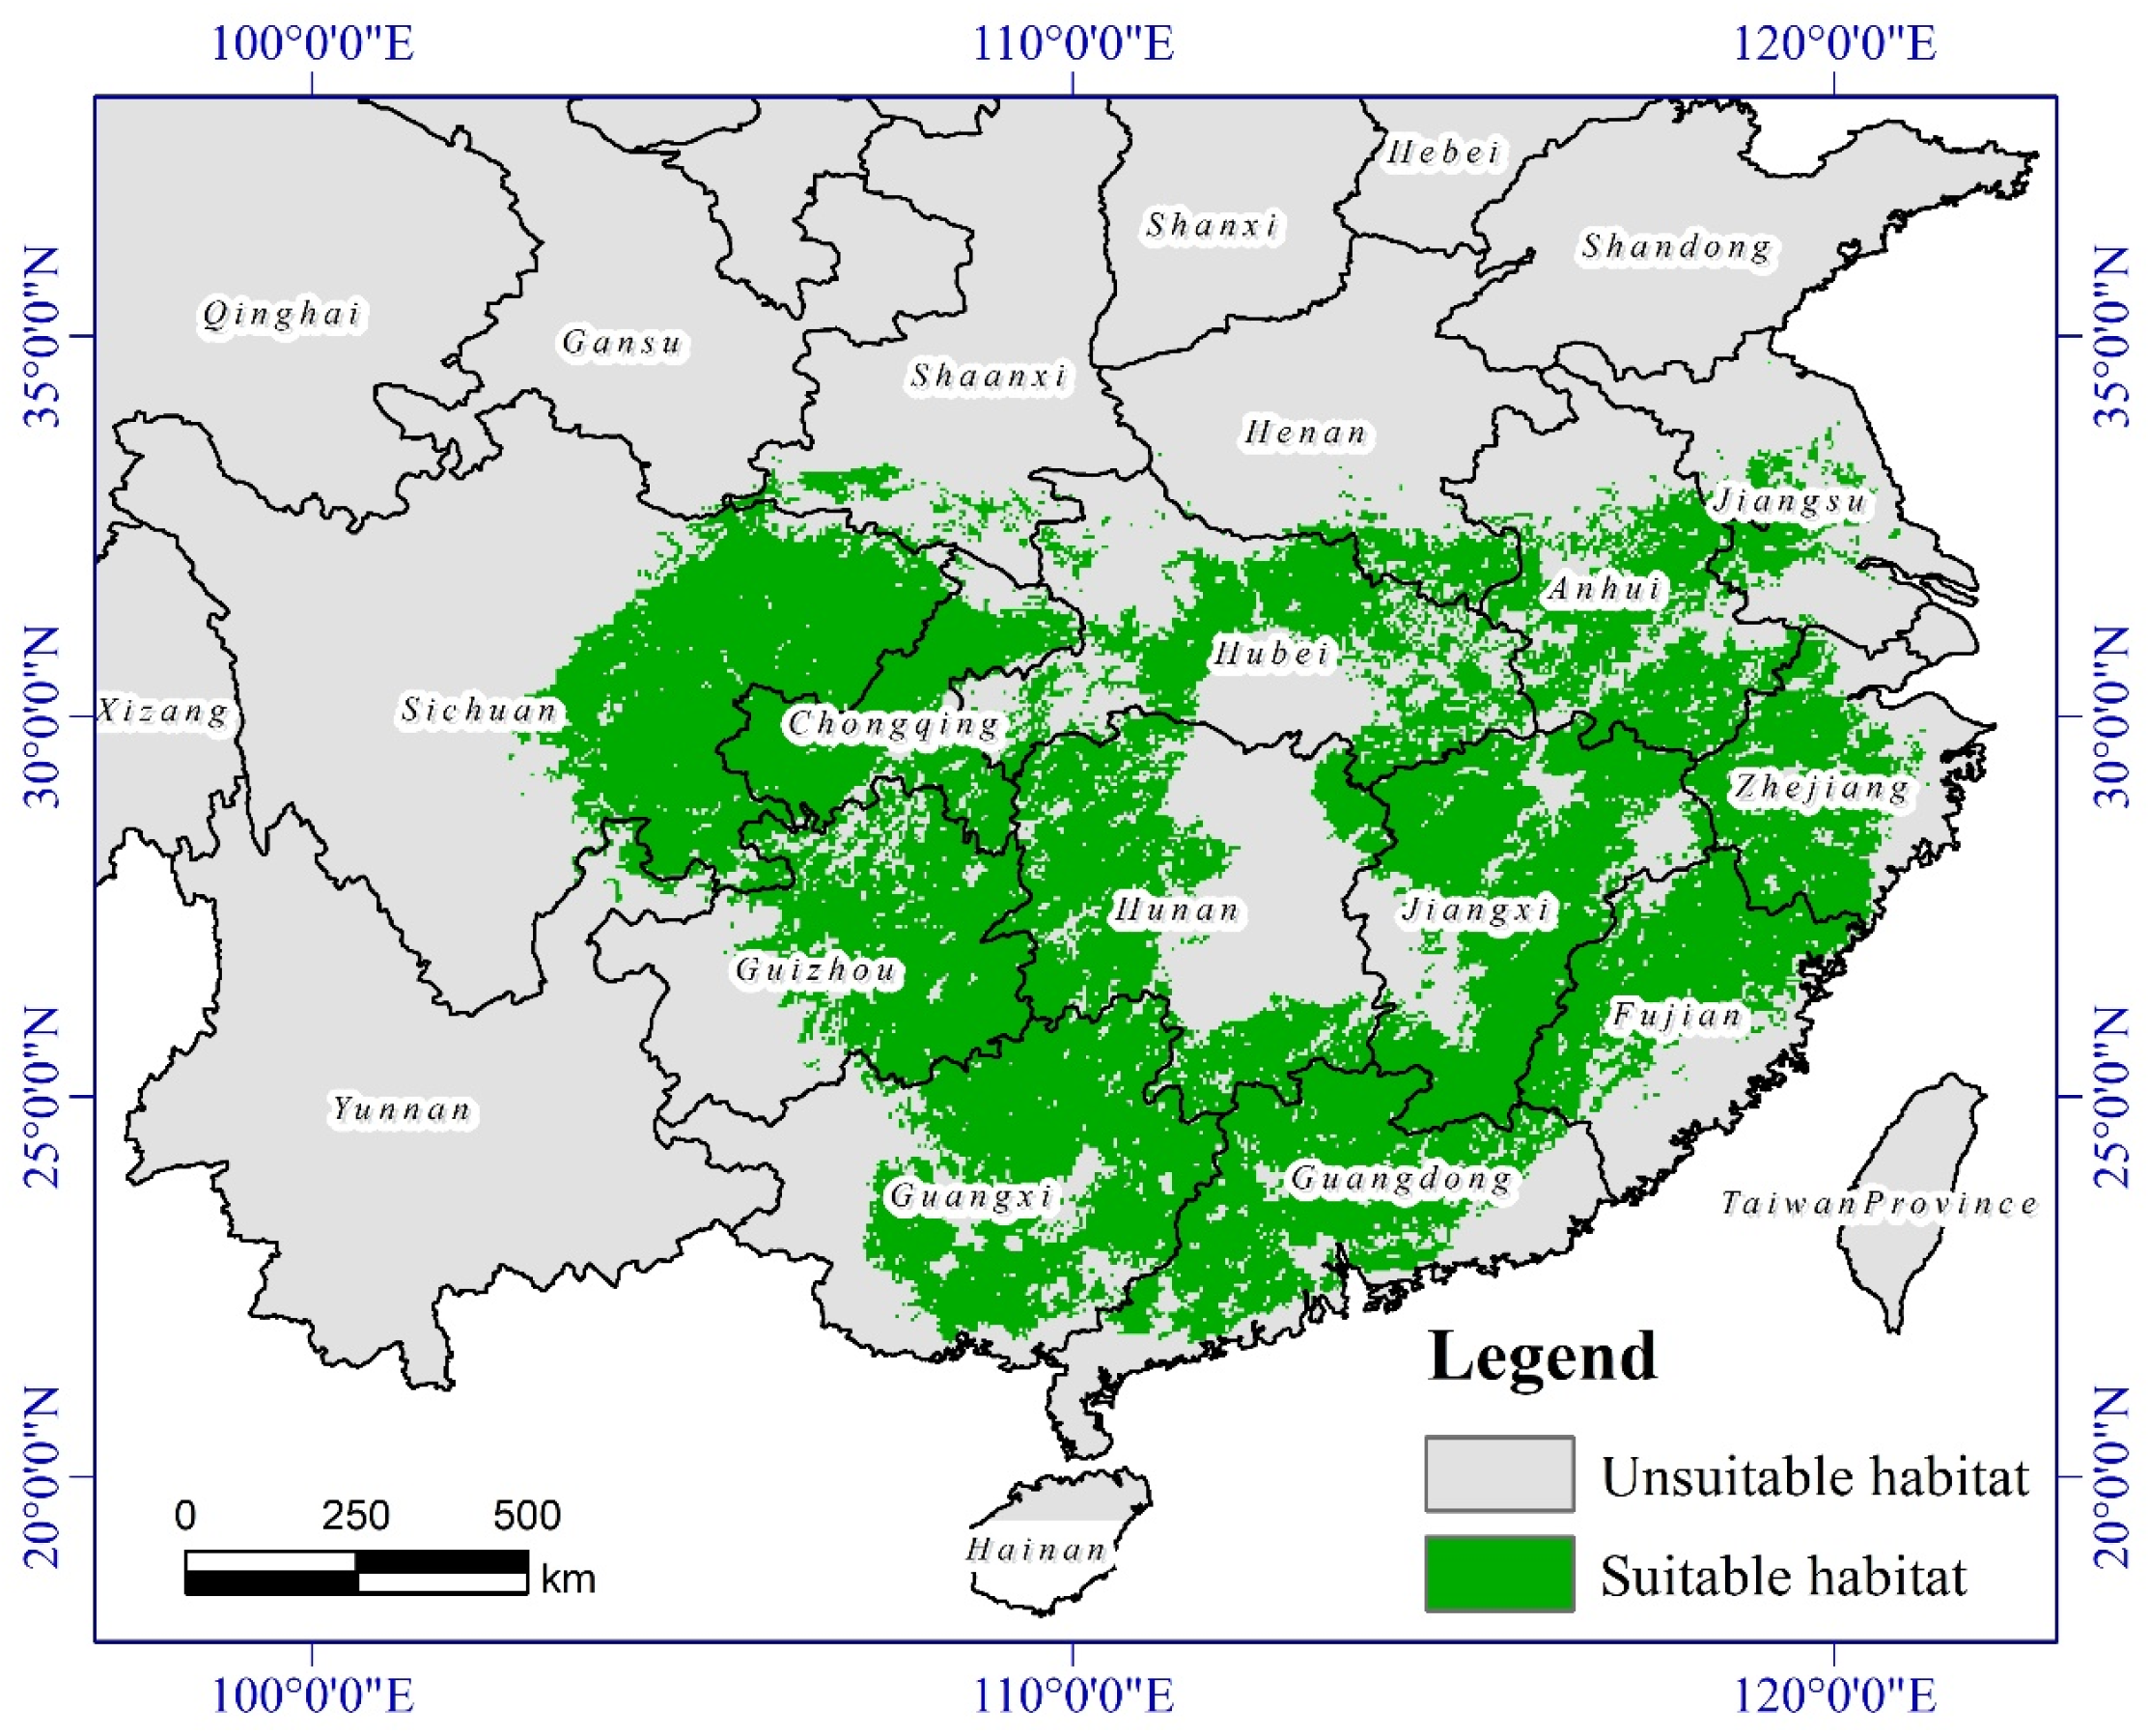
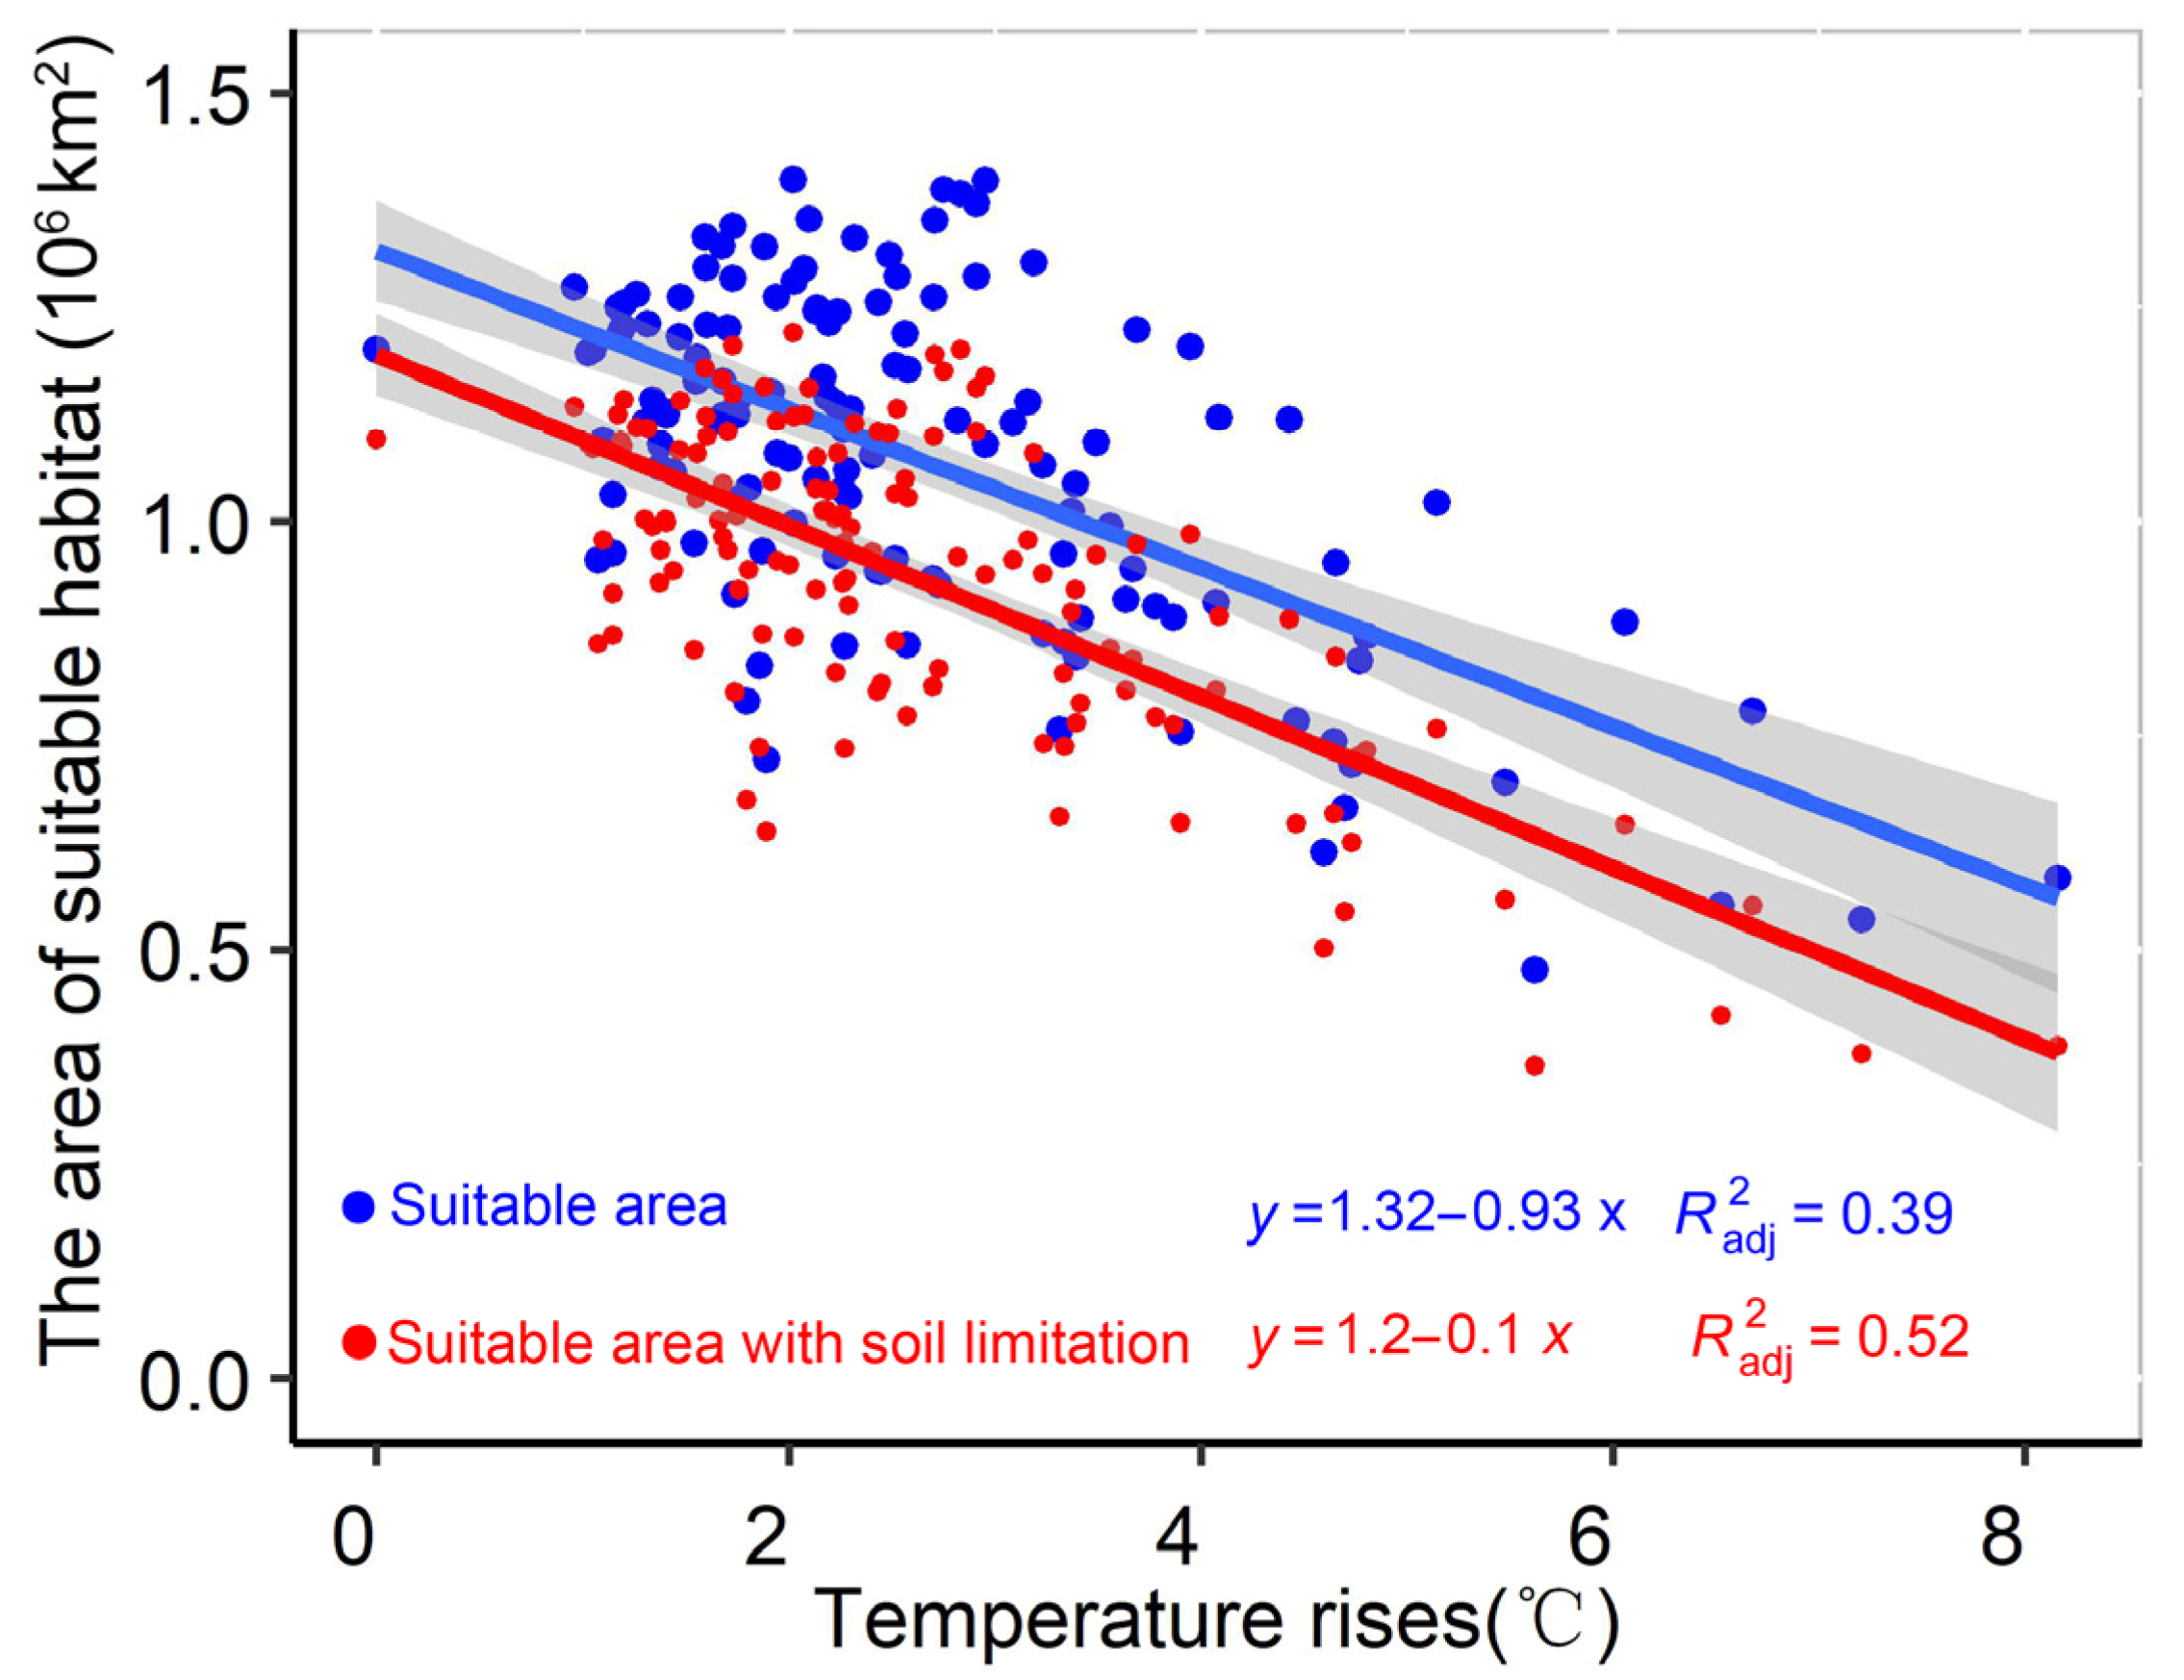
3.3. The Suitable Habitat Distribution of P. massoniana under Climate Change

Under baseline climatic conditions, the CHS findings revealed that the suitable habitat for Pinus massoniana spans approximately 1.10 × 10⁶ km2, is primarily located in the southeastern region of China, and is mainly distributed in eastern Sichuan Province; Chongqing, the eastern part of Guizhou Province and Guangxi Province; central and eastern Hubei Province; western Hunan Province and Fujian Province; and southern Anhui Province, Jiangxi Province, Guangdong Province, and Zhejiang Province (Figure 5). In addition, the habitats of P. massoniana were spatially concentrated and contiguous. In summary, P. massoniana demonstrates strong environmental adaptability, making it suitable for extensive artificial cultivation.
In future projections, the certainty index for the suitable habitat of P. massoniana indicates that the distribution of suitable habitats may undergo substantial alterations under various climate change scenarios (Figure 6). Under the most moderate warming green climate scenario (SSP 1–2.6), the area suitable for P. massoniana may slightly decrease as the whole distribution area tends to move northward. Under the severe warming climate scenario (SSP 5–8.5), the areas suitable for P. massoniana may sharply shrink, resulting in the fragmentation of suitable habitats. Moreover, from the baseline to 2081–2100, the area of suitable habitats with a certainty index of 1 was only 0.12 × 10⁶ km2, and only one area covered 1% of the area of the suitable habitat in the baseline climate; these areas were mainly distributed in western Guizhou Province, northern Guangzhou Province, Fujian Province, and southern Zhejiang Province. In the Qinglin Mountains of central China, a large area of new suitable habitats may appear, and the southern boundary of the existing suitable habitat may move northward. Under SSP 2–4.5 and SSP 3–7.0, the change in suitable habitats for the above two scenarios were between that of the other two scenarios. However, it is worth noting that the suitable habitat for P. massoniana has decreased significantly from the present to 2061–2080 and 2080–2100 under SSP 3–7.0, and suitable habitats with large area uncertainties have appeared in the southern part of the study area.
To further quantify the impact of climate warming on the suitable habitat area of P. massoniana, the annual mean temperature increase across nine global climate models (GCMs) under various climate scenarios and periods was calculated. Subsequently, areas exhibiting a certainty index (Ci) greater than 0.5 were designated as the definitive suitable habitat area (Table 2). The results showed that the suitable habitat area for P. massoniana decreased slightly when the average temperature increased by less than 3 °C, and the overall suitable habitat area remained above 0.95 km2. However, the suitable habitat for P. massoniana significantly decreased when the temperature increased above 3 °C. The suitable habitat area for P. massoniana was reduced to 44% of the base climate conditions when the temperature increase reached 5.79 °C.
Overall, the suitable habitats for P. massoniana in eastern Guizhou Province, central Fujian Province, and southern Zhejiang Province appear to be resilient to climate change, making them prime candidates for prioritization in future planting strategies. The suitable habitats in central and southern Guangdong Province, central Guangxi Province, central Jiangxi Province, western Chongqing Province, and central Sichuan Province exhibit greater uncertainty and potential risks. These areas warrant cautious consideration in future planting plans. In addition, the suitable habitat for this species in the Qinling Mountains of China is likely to increase, which should be seriously considered.

4. Discussion

4.1. Uncertainty of Model Results

Significant variability characterizes global warming projections, attributable to a range of GCMs, diverse climate change scenarios (SSPs), and various future simulation durations. At present, a standardized approach for the optimal climate model selection remains elusive [47,48,49], introducing substantial uncertainty into the simulations conducted in this study. To reduce this uncertainty, we used the certainty index (Ci) of the suitable habitat of P. massoniana in the future. Additionally, we integrated the simulation results of different GCMs to reduce the uncertainty caused by a single GCM. We investigated the relationship between temperature increase and changes in suitable habitats for P. massoniana under various climate change scenarios, assessing the potential effects of global warming on habitat suitability and its uncertainties (Figure 7).
Our results showed that the suitable habitat for P. massoniana decreases with increasing temperature. The reduction in suitable habitat areas becomes more significant with a larger warming range. The trend is more evident in the results of the comprehensive suitable habitat model, considering soil restriction. However, not all climate warming scenarios may reduce the suitable habitat for P. massoniana. In 30.6% of the warming scenarios, the climate-suitable habitat for the species expanded, predominantly occurring in instances where the temperature increase was less than 3 °C. Similarly, in 22.4% of the warming scenarios, the comprehensive suitable habitat of P. massoniana slightly increased and was concentrated when the temperature increase was less than 3 °C. A statistical analysis of the climate scenario data for which the warming amplitude was less than 3 °C showed that the climate-suitable habitat area of P. massoniana estimated by the model was 1.14 ± 0.15 × 10⁶ km2, and the average comprehensive suitable habitat area was 1.01 ± 0.13 × 10⁶ km2. A reduction of less than 10% in temperature indicates that climate warming has a limited effect on the planting and production of P. massoniana in China when the temperature increase is less than or equal to 3 °C.
However, when the temperature increases to greater than or equal to 4 °C, the average climate-suitable habitat area of P. massoniana decreases to 0.78 ± 0.19 × 10⁶ km2, and the average comprehensive suitable habitat area is 0.63 ± 0.02 × 10⁶ km2. This means that more than 40% of the suitable habitats for P. massoniana have degraded. Therefore, attention should be given to a temperature increase of ≥4 °C, which will have a significant impact on timber production in southern China and the ecological environment in the P. massoniana planting area.

4.2. Management Recommendations

Addressing the vulnerability of P. massoniana habitats to climate-induced temperature increases necessitates a dynamic and adaptive management strategy, integrating conservation, genetic resilience, and stakeholder engagement. Central to this strategy is the protection and sustainable management of existing habitats, particularly in South China where the species holds significant economic and ecological value. Adaptations in genetic diversity and resilience within P. massoniana populations are critical to withstand the predicted intensification of warming scenarios. These adaptations should be supported by a robust monitoring system, leveraging ensemble modeling techniques for accurate predictions and guiding forestry practices toward sustainability and resilience.
Future strategies must be flexible to accommodate varying climate scenarios. For moderate increases (less than 3 °C), conservation efforts might focus on monitoring and managing potential climate refugia. In contrast, scenarios predicting rises beyond 4 °C demand more aggressive measures to counteract significant habitat reduction and fragmentation. This might include assisted migration, species diversification, and enhanced forest connectivity.
Local community involvement and policy integration form the backbone of effective management. Engaging stakeholders in conservation efforts ensures not only the protection of P. massoniana but also the overall health of regional ecosystems. Concurrently, advocating for and implementing policies that mitigate climate change impacts are crucial. These combined efforts aim to maintain forest health and productivity, preserve biodiversity, and sustain local economies in the face of climate challenges.

5. Conclusions

Timber tree species are integral to regional environmental integrity and socioeconomic welfare, necessitating strategic habitat planning for sustained yield. This study developed a niche model to project the geographic distribution of P. massoniana in response to future climate scenarios and quantitatively assessed how varying degrees of warming affect the species’ potential habitat. Our findings indicate that moderate warming conditions have a limited influence on the suitable habitat for P. massoniana, but under intense warming conditions with an average temperature increase greater than 3 °C, the suitable habitat for P. massoniana sharply decreases. Moreover, using a map certainty index of suitable habitats, we identified high-risk areas for habitat loss in this species under different climate change scenarios, which can inform future planting planning. The modeling approach adopted in this study elucidates the distribution of suitable habitats for P. massoniana and offers a robust methodology for discerning the potential impacts of climate change on other timber tree species. This knowledge is instrumental in guiding artificial cultivation and conservation initiatives.

Supplementary Materials

The following supporting information can be downloaded at: https://www.mdpi.com/article/10.3390/f15020323/s1, Table S1: The contribution of variables to the climate suitability model; Table S2: The contribution of variables to the distribution limitation model.

Author Contributions

Conceptualization, Z.Z. (Zefang Zhao), S.C. and Z.Z. (Zebin Zhao); methodology, Z.Z. (Zefang Zhao) and S.C.; software, Z.Z. (Zefang Zhao) and S.C.; validation, M.J.; formal analysis, Z.Z. (Zebin Zhao) and M.J.; investigation, Z.Z. (Zefang Zhao) and S.C.; resources, Z.Z. (Zebin Zhao); data curation, Z.Z. (Zebin Zhao); writing—original draft preparation, Z.Z. (Zefang Zhao) and S.C.; writing—review and editing, Z.Z. (Zefang Zhao), S.C., Z.Z. (Zebin Zhao) and M.J.; visualization, Z.Z. (Zefang Zhao), Z.Z. (Zebin Zhao) and S.C.; supervision, Z.Z. (Zebin Zhao); project administration, Z.Z. (Zebin Zhao); funding acquisition, Z.Z. (Zebin Zhao) and S.C. All authors have read and agreed to the published version of the manuscript.

Funding

This research was funded by the National Natural Science Foundation of China (grant no. 42201441), the Chinese Academy of Sciences “Special Research Assistant Program”, the China Postdoctoral Science Foundation (grant no. 2022M723359), the Postdoctoral Project of Gansu Province (grant No. E339880149) and the Natural Science Foundation of Qinghai Province of China (grant No. 2020-ZJ-925).

Data Availability Statement

Data are contained within the article.

Acknowledgments

The authors would like to thank the anonymous reviewers for supporting this work.

Conflicts of Interest

The authors declare no conflicts of interest.

References

  1. Urban, M.C. Accelerating extinction risk from climate change. Science 2015, 348, 571–573. [Google Scholar] [CrossRef]
  2. Woodward, F.I.; Williams, B. Climate and plant distribution at global and local scales. Vegetatio 1987, 69, 189–197. [Google Scholar] [CrossRef]
  3. Bertrand, R.; Lenoir, J.; Piedallu, C.; Riofrío-Dillon, G.; De Ruffray, P.; Vidal, C.; Pierrat, J.-C.; Gégout, J.-C. Changes in plant community composition lag behind climate warming in lowland forests. Nature 2011, 479, 517–520. [Google Scholar] [CrossRef] [PubMed]
  4. Root, T.L.; Price, J.T.; Hall, K.R.; Schneider, S.H.; Rosenzweig, C.; Pounds, J.A. Fingerprints of global warming on wild animals and plants. Nature 2003, 421, 57–60. [Google Scholar] [CrossRef] [PubMed]
  5. Hoegh-Guldberg, O.; Jacob, D.; Bindi, M.; Brown, S.; Camilloni, I.; Diedhiou, A.; Djalante, R.; Ebi, K.; Engelbrecht, F.; Guiot, J. Impacts of 1.5 C global warming on natural and human systems. In Global Warming of 1.5 °C; World Meteorological Organization: Geneva, Switzerland, 2018. [Google Scholar]
  6. Lenoir, J.; Gégout, J.-C.; Marquet, P.A.; de Ruffray, P.; Brisse, H. A significant upward shift in plant species optimum elevation during the 20th century. Science 2008, 320, 1768–1771. [Google Scholar] [CrossRef] [PubMed]
  7. Ma, Z.; Liu, H.; Mi, Z.; Zhang, Z.; Wang, Y.; Xu, W.; Jiang, L.; He, J.-S. Climate warming reduces the temporal stability of plant community biomass production. Nat. Commun. 2017, 8, 15378. [Google Scholar] [CrossRef]
  8. Paquette, A.; Vayreda, J.; Coll, L.; Messier, C.; Retana, J. Climate change could negate positive tree diversity effects on forest productivity: A study across five climate types in Spain and Canada. Ecosystems 2018, 21, 960–970. [Google Scholar] [CrossRef]
  9. Randin, C.F.; Engler, R.; Normand, S.; Zappa, M.; Zimmermann, N.E.; Pearman, P.B.; Vittoz, P.; Thuiller, W.; Guisan, A. Climate change and plant distribution: Local models predict high-elevation persistence. Glob. Chang. Biol. 2009, 15, 1557–1569. [Google Scholar] [CrossRef]
  10. Leng, W.; He, H.S.; Bu, R.; Dai, L.; Hu, Y.; Wang, X. Predicting the distributions of suitable habitat for three larch species under climate warming in Northeastern China. For. Ecol. Manag. 2008, 254, 420–428. [Google Scholar] [CrossRef]
  11. Austin, M.P.; Van Niel, K.P. Improving species distribution models for climate change studies: Variable selection and scale. J. Biogeogr. 2011, 38, 1–8. [Google Scholar] [CrossRef]
  12. Elith, J.; Leathwick, J.R. Species distribution models: Ecological explanation and prediction across space and time. Annu. Rev. Ecol. Evol. Syst. 2009, 40, 677–697. [Google Scholar] [CrossRef]
  13. Dyderski, M.K.; Paź, S.; Frelich, L.E.; Jagodziński, A.M. How much does climate change threaten European forest tree species distributions? Glob. Change Biol. 2018, 24, 1150–1163. [Google Scholar] [CrossRef]
  14. Felton, A.M.; Felton, A.; Foley, W.; Lindenmayer, D.B. The role of timber tree species in the nutritional ecology of spider monkeys in a certified logging concession, Bolivia. For. Ecol. Manag. 2010, 259, 1642–1649. [Google Scholar] [CrossRef]
  15. Wilson, L.F. China’s Masson pine forests: Cure or curse? J. For. 1993, 91, 30–33. [Google Scholar]
  16. Anderson, R.P. A framework for using niche models to estimate impacts of climate change on species distributions. Ann. N. Y. Acad. Sci. 2013, 1297, 8–28. [Google Scholar] [CrossRef]
  17. Brun, P.; Thuiller, W.; Chauvier, Y.; Pellissier, L.; Wüest, R.O.; Wang, Z.; Zimmermann, N.E. Model complexity affects species distribution projections under climate change. J. Biogeogr. 2020, 47, 130–142. [Google Scholar] [CrossRef]
  18. Phillips, S.J.; Anderson, R.P.; Schapire, R.E. Maximum entropy modeling of species geographic distributions. Ecol. Model. 2006, 190, 231–259. [Google Scholar] [CrossRef]
  19. Phillips, S.J.; Anderson, R.P.; Dudík, M.; Schapire, R.E.; Blair, M.E. Opening the black box: An open-source release of Maxent. Ecography 2017, 40, 887–893. [Google Scholar] [CrossRef]
  20. Mi, C.; Huettmann, F.; Guo, Y.; Han, X.; Wen, L. Why choose Random Forest to predict rare species distribution with few samples in large undersampled areas? Three Asian crane species models provide supporting evidence. PeerJ 2017, 5, e2849. [Google Scholar] [CrossRef]
  21. Li, X.; Wang, Y. Applying various algorithms for species distribution modelling. Integr. Zool. 2013, 8, 124–135. [Google Scholar] [CrossRef]
  22. Guisan, A.; Edwards, T.C., Jr.; Hastie, T. Generalized linear and generalized additive models in studies of species distributions: Setting the scene. Ecol. Model. 2002, 157, 89–100. [Google Scholar] [CrossRef]
  23. Guisan, A.; Thuiller, W.; Zimmermann, N.E. Habitat Suitability and Distribution Models: With Applications in R; Cambridge University Press: Cambridge, UK, 2017. [Google Scholar]
  24. Grenouillet, G.; Buisson, L.; Casajus, N.; Lek, S. Ensemble modelling of species distribution: The effects of geographical and environmental ranges. Ecography 2011, 34, 9–17. [Google Scholar] [CrossRef]
  25. Thibaud, E.; Petitpierre, B.; Broennimann, O.; Davison, A.C.; Guisan, A. Measuring the relative effect of factors affecting species distribution model predictions. Methods Ecol. Evol. 2014, 5, 947–955. [Google Scholar] [CrossRef]
  26. Du, M.; Ding, G.; Cai, Q. The transcriptomic responses of Pinus massoniana to drought stress. Forests 2018, 9, 326. [Google Scholar] [CrossRef]
  27. Zhao, G.-W.; Zhong, T.-L. Improving the assessment method of seed vigor in Cunninghamia lanceolata and Pinus massoniana based on oxygen sensing technology. J. For. Res. 2012, 23, 95–101. [Google Scholar] [CrossRef]
  28. Zhou, X.; Zhao, M.; Zhou, L.; Yang, G.; Huang, L.; Yan, C.; Huang, Q.; Ye, L.; Zhang, X.; Guo, L. Regionalization of Habitat Suitability of Masson’s Pine based on geographic information system and Fuzzy Matter-Element Model. Sci. Rep. 2016, 6, 34716. [Google Scholar] [CrossRef]
  29. Forster, P.M.; Richardson, T.; Maycock, A.C.; Smith, C.J.; Samset, B.H.; Myhre, G.; Andrews, T.; Pincus, R.; Schulz, M. Recommendations for diagnosing effective radiative forcing from climate models for CMIP6. J. Geophys. Res. Atmos. 2016, 121, 460–475. [Google Scholar] [CrossRef]
  30. Hausfather, Z. CMIP6: The Next Generation of Climate Models Explained. Available online: https://www.carbonbrief.org/cmip6-the-next-generation-of-climate-models-explained/ (accessed on 1 October 2023).
  31. Zhang, Z.; Jin, G.; Feng, Z.; Sun, L.; Zhou, Z.; Zheng, Y.; Yuan, C. Joint influence of genetic origin and climate on the growth of Masson pine (Pinus massoniana Lamb.) in China. Sci. Rep. 2020, 10, 4653. [Google Scholar] [CrossRef]
  32. Li, S.; Shi, M.; Liu, X. Precise spatial distribution of suitability of masson pine in Hubei Province. Acta Ecol. Sin. 2019, 39, 1960–1968. [Google Scholar]
  33. Austin, M. Species distribution models and ecological theory: A critical assessment and some possible new approaches. Ecol. Model. 2007, 200, 1–19. [Google Scholar] [CrossRef]
  34. Guo, Y.; Zhao, Z.; Yuan, S.; Li, X. A greener Loess Plateau in the future: Moderate warming will expand the potential distribution areas of woody species. Environ. Res. Lett. 2023, 18, 034027. [Google Scholar] [CrossRef]
  35. Zhang, L.; Deng, X.; Lei, X.; Zhao, Z.; Xiang, W.; Yan, W. Pinus massoniana productivity at different age stages in relation to climatic factors. Chin. J. Ecol. 2013, 32, 1104. [Google Scholar]
  36. Molloy, S.W.; Davis, R.A.; Van Etten, E.J. Species distribution modelling using bioclimatic variables to determine the impacts of a changing climate on the western ringtail possum (Pseudocheirus occidentals; Pseudocheiridae). Environ. Conserv. 2014, 41, 176–186. [Google Scholar] [CrossRef]
  37. Feng, X.; Park, D.S.; Liang, Y.; Pandey, R.; Papeş, M. Collinearity in ecological niche modeling: Confusions and challenges. Ecol. Evol. 2019, 9, 10365–10376. [Google Scholar] [CrossRef] [PubMed]
  38. Guo, Y.; Li, X.; Zhao, Z.; Nawaz, Z. Predicting the impacts of climate change, soils and vegetation types on the geographic distribution of Polyporus umbellatus in China. Sci. Total Environ. 2019, 648, 1–11. [Google Scholar] [CrossRef]
  39. Robertson, M.; Caithness, N.; Villet, M. A PCA-based modelling technique for predicting environmental suitability for organisms from presence records. Divers. Distrib. 2001, 7, 15–27. [Google Scholar] [CrossRef]
  40. Zhao, Z.; Guo, Y.; Wei, H.; Ran, Q.; Liu, J.; Zhang, Q.; Gu, W. Potential distribution of Notopterygium incisum Ting ex HT Chang and its predicted responses to climate change based on a comprehensive habitat suitability model. Ecol. Evol. 2020, 10, 3004–3016. [Google Scholar] [CrossRef]
  41. Breiman, L. Random forests. Mach. Learn. 2001, 45, 5–32. [Google Scholar] [CrossRef]
  42. Marmion, M.; Luoto, M.; Heikkinen, R.K.; Thuiller, W. The performance of state-of-the-art modelling techniques depends on geographical distribution of species. Ecol. Model. 2009, 220, 3512–3520. [Google Scholar] [CrossRef]
  43. Mainali, K.P.; Warren, D.L.; Dhileepan, K.; McConnachie, A.; Strathie, L.; Hassan, G.; Karki, D.; Shrestha, B.B.; Parmesan, C. Projecting future expansion of invasive species: Comparing and improving methodologies for species distribution modeling. Glob. Change Biol. 2015, 21, 4464–4480. [Google Scholar] [CrossRef]
  44. Dormann, C.F.; Purschke, O.; Marquez, J.R.G.; Lautenbach, S.; Schroeder, B. Components of uncertainty in species distribution analysis: A case study of the great grey shrike. Ecology 2008, 89, 3371–3386. [Google Scholar] [CrossRef]
  45. Elith, J.; Graham, C.H. Do they? How do they? WHY do they differ? On finding reasons for differing performances of species distribution models. Ecography 2009, 32, 66–77. [Google Scholar] [CrossRef]
  46. Jiang, Y.; Li, M.; Liu, Y.; Liu, F. Impact of climate change on suitable habitats of Pinus massoniana in Hunan Province. J. Nanjing For. Univ. 2019, 62, 94–100. [Google Scholar]
  47. Zhang, L.; Liu, S.; Sun, P.; Wang, T. Comparative evaluation of multiple models of the effects of climate change on the potential distribution of Pinus massoniana. Chin. J. Plant Ecol. 2011, 35, 1091–1105. [Google Scholar] [CrossRef]
  48. Tuanmu, M.-N.; Viña, A.; Winkler, J.A.; Li, Y.; Xu, W.; Ouyang, Z.; Liu, J. Climate-change impacts on understorey bamboo species and giant pandas in China’s Qinling Mountains. Nat. Clim. Chang. 2013, 3, 249–253. [Google Scholar] [CrossRef]
  49. Yan, Y.; Li, Y.; Wang, W.-J.; He, J.-S.; Yang, R.-H.; Wu, H.-J.; Wang, X.-L.; Jiao, L.; Tang, Z.; Yao, Y.-J. Range shifts in response to climate change of Ophiocordyceps sinensis, a fungus endemic to the Tibetan Plateau. Biol. Conserv. 2017, 206, 143–150. [Google Scholar] [CrossRef]
Figure 1. Sample sites of Pinus massoniana in the south of China.
Forests 15 00323 g001
Figure 2. Distribution of the points of Pinus massoniana in the environmental space defined by the first two PCA axes (a) and the correlation circle of the selected climate variables as a function of the same first two PCA axes (b).
Forests 15 00323 g002
Figure 3. The true skill statistic (TSS) values of the four model algorithms included in the ensemble model. MaxEnt: maximum entropy method; RF: random forest; GAM: generalized additive model; GBM: generalized boosting model.
Forests 15 00323 g003
Figure 4. Probability relationships between dominant variables and geographic distribution of Pinus massoniana.
Forests 15 00323 g004
Figure 5. Predicted potential distribution of suitable habitat of Pinus massoniana in the south of China in baseline climates.
Forests 15 00323 g005
Figure 6. Specificity index for the suitable habitat distribution of Pinus massoniana in southern China under various climate change scenarios (Rows represent different climate scenarios, and columns represent different time periods (ap)).
Forests 15 00323 g006
Figure 7. The suitable habitat area corresponding to a different warming range.
Forests 15 00323 g007
Table 1. Environmental variables used to predict the potential geographic distribution of Pinus massoniana in China.
Classification and Data SourceVariables
Climatic variables
Data source: WorldClim database (http://www.worldclim.org/, accessed on 30 October 2023)
BIO variables: bio1: annual mean air temperature; bio2: mean diurnal temperature range; bio7: annual temperature range; bio12: annual precipitation; bio15: precipitation seasonality; bio19: precipitation of the coldest quarter
Solar radiation variables: srad_01: solar radiation in January, srad_05: solar radiation in May, srad_08: solar radiation in August, srad_09: solar radiation in September
Topographical variables: ASPECT, SLOPE
Soil variables
Data source: Harmonized World Soil Database (HWSD) (http://www.fao.org/soils-portal/, accessed on 30 October 2023)
T_GRAVEL: Topsoil Gravel Content; T_SAND: Topsoil Sand Fraction; T_SILT: Topsoil Silt Fraction; T_CLAY: Topsoil Clay Fraction; T_OC: Topsoil Organic Carbon; T_PH_H2O: Topsoil pH (H2O); T_CACO3: Topsoil Calcium Carbonate; T_CASO4: Topsoil Gypsum; T_ESP: Topsoil Sodicity; T_USDA: Topsoil USDA Texture Classification
Table 2. Area of suitable habitats for Pinus massoniana under different climate change scenarios.
TimesClimate Change ScenarioAverage Temperature Rise
(°C)
Suitable Habitat Area
(106 km2)
Baseline-----------1.10
2021–2040SSP 1–2.61.471.07
SSP 2–4.51.441.06
SSP 3–7.01.301.08
SSP 5–8.51.601.02
2041–2060SSP 1–2.61.961.06
SSP 2–4.52.191.02
SSP 3–7.02.190.99
SSP 5–8.52.770.90
2061–2080SSP 1–2.62.110.99
SSP 2–4.52.790.95
SSP 3–7.03.250.86
SSP 5–8.54.160.68
2081–2100SSP 1–2.62.011.05
SSP 2–4.53.230.82
SSP 3–7.04.350.67
SSP 5–8.55.790.44
Disclaimer/Publisher’s Note: The statements, opinions and data contained in all publications are solely those of the individual author(s) and contributor(s) and not of MDPI and/or the editor(s). MDPI and/or the editor(s) disclaim responsibility for any injury to people or property resulting from any ideas, methods, instructions or products referred to in the content.

