Abstract
Continuous-cover forestry (CCF), which maintains a relatively intact forest cover through selective harvesting, has emerged over the last few decades as a popular alternative to rotational forest management (RFM). Coast redwood, which is native to the western United States, grows rapidly in New Zealand and is well suited to CCF as it has high shade tolerance, an ability to coppice from the cut stem, and resistance to pests, diseases, wind and fire. A forest estate model was used to compare the carbon sequestration, timber production and profitability of redwood CCF, RFM and permanent carbon forestry (PCF) regimes at a regional level within New Zealand. Through linear programming, this model optimised carbon accumulation and harvesting decisions across a large forest to meet a series of constraints associated with each regime. All three regimes represented good investment decisions, but CCF had the highest soil expectation value (SEV) within most North Island regions while PCF had a slightly higher SEV within the South Island regions. Under the transitional CCF (CCFt), revenue from carbon initially increased before levelling out at 40 years, after which time a sustainable harvest of high-value timber commenced in perpetuity without additional revenue from carbon. The CCFt regime transitioned to a steady-state condition, with a uniform age class distribution from year 150 onwards (CCFs), after which time a very high SEV was attained that exceeded that of CCFt by four-fold in the North Island (NZD 136,126/ha vs. NZD 34,430/ha) and seven-fold (NZD 44,714 vs. NZD 6267/ha) in the South Island. This study highlights the profitability of managing redwood under CCF and how initial carbon revenue can be used to finance the transition of the forest to a steady-state condition that produces a stream of valuable timber with a very high rate of return.
1. Introduction
Continuous-cover forestry (CCF) embodies a number of sustainable management systems that maintain a continuous forest cover through the selective harvesting of individuals or small groups of trees. CCF emerged as an alternative to rotational forest management (RFM) or clear-cut even-aged forests at the end of the 19th century in Central Europe [1]. The concept of ‘continuous forest’ (Dauerwald) was introduced and popularised within the early 20th century and although widely implemented in Switzerland during the first half of the century [2], the clear-cut system continued to be used within many other parts of Europe, including Germany and France [3]. However, during the 1990s, there was a resurgence of interest in CCF, driven by a co-ordinated international push for sustainable forest management as formalised through the Rio Forest principles [4]. A recent survey of 33 European countries estimated that between 22% and 30% of European forests are currently managed through CCF [5].
Although CCF systems include many variations, the retention of canopy cover is a common element in all systems [1]. Shelterwood systems involve the removal of the old stand during a series of regeneration fellings, while in selection systems, single trees are removed throughout the forest [6]. Stands managed under CCF are often characterised as having an uneven age distribution and a recent survey showed that a coupe size of ≤0.5 ha is a typical threshold harvest area within Europe [5]. CCF has many environmental advantages over clear-cut forests, which include greater resilience to pathogens, pests, climate change [7] and disturbance [8], and a lower incidence of soil erosion and windthrow resulting from storms [9]. Compared to RFM, the use of CCF has been found to be more profitable [10,11,12], but results are often contradictory [13] and this is an ongoing area of research, which has more recently also incorporated carbon revenues [14]. Although most comparisons use the transition to CCF, the start point for the comparisons with RFM is likely to have a significant impact on the outcome as revenue streams under steady-state conditions markedly vary from those under transitioning CCF [15].
Redwood (Sequoia sempervirens (Lamb. ex D. Don) Endl.) is a rapidly growing species, native to a coastal strip in the western United States. The species has attributes that make it well suited to CCF which include shade tolerance and the ability to coppice from the cut stem. Within the native range, redwood can develop a mixed-aged distribution, with some stands reaching heights of 115 m and ages surpassing 2200 years [16,17,18]. Redwood forests have a significant capacity for biomass and carbon storage within decay-resistant heartwood, particularly in primary (old-growth) stands. However, research shows that the rate of carbon sequestration is greatest in secondary or plantation forests [18]. Redwood stands are relatively unaffected by pests and diseases [19,20] and exhibit substantial resilience to damage resulting from storms, wind [21,22] and fire [23,24,25]. As a consequence, the exceptionally high quantities of carbon that accumulate are relatively well protected against biotic and abiotic risks. Redwood also produces high-quality stable timber with a naturally durable heartwood and attractive grain [26] that is mostly used for appearance-grade purposes [22].
The growth rates of redwood are highest in temperate climates characterised by mild temperatures and moderate-to-high precipitation, and plantations have been successfully established in many countries with these climates [27,28,29]. Redwood grows well in New Zealand, and although the existing resource is relatively small [22], the species has recently increased in popularity and is currently the second most afforested species in New Zealand, after radiata pine [30]. The majority of these plantings have been in North Island locations with a climate that suits the species [22]. The growth rates of some of these well-sited stands reach very high values that exceed those of plantations within the native range [31]. Using measurements from a relatively comprehensive, nationally distributed array of permanent sample plots (PSPs), previous research has developed growth and yield models as well as spatial layers describing redwood volume and carbon. These models and layers demonstrate the high growth rates that are achievable within New Zealand [31,32].
Despite the clear potential of redwood within New Zealand, ~90% of the plantation estate comprises radiata pine, which is almost entirely managed under clear-fell regimes designed to maximise productivity [33]. However, public perceptions of radiata pine clear-fell regimes have recently deteriorated due to damage from severe storm events that has resulted in the flow of large quantities of forestry harvest debris into hydrological systems, resulting in a cascade of negative social and ecological issues [34]. The diversification of forestry through the implementation of systems such as CCF may provide a means of retaining wood flow and carbon sequestration while mitigating these types of risks and improving social and environmental benefits from forests [35].
Carbon is also now a significant revenue stream to forest growers [36,37,38] and the New Zealand Emissions Trading Scheme (ETS) is relatively unique from a global perspective in that it includes the forestry sector [39]. Forest growers registered in the ETS receive a unit of carbon for each tonne of CO2 sequestered, which are known as New Zealand Units (NZUs). For RFM, carbon is allocated up to approximately the mid-point of the first rotation, which represents the long-term average carbon sequestered under successive rotations. A key advantage of this averaging method is that carbon does not need to be repaid following harvesting, as long as the stand is re-established.
Stands that are permanently established or managed under a CCF system are able to claim changes in carbon over the life of the stand, under the carbon stock-change method [36]. Under this payment system, forest owners can choose not to extract timber or alternatively harvest trees down to a prescribed minimum level of canopy cover, with these systems hereafter termed permanent carbon forest (PCF) and CCF regimes, respectively. Under the stock-change methodology, ETS participants receive NZUs as long as carbon is increasing but they have to surrender NZUs when carbon stocks decrease. Clearly, CCF management regimes should be designed so that carbon does not decline at the forest estate level in order to mitigate any potential carbon liabilities to the grower.
Although redwood is well suited to CCF, the financial viability of this management system for redwood has not yet been investigated at a regional level. Research is also required to compare the profitability of CCF to RFM and PCF regimes. This study uses an optimisation forest harvest scheduling model to maximise profitability under a variety of constraints to simulate these three management methods for a 1000 ha area, within all nine New Zealand regions. Using this methodology, the objectives of this research were to (i) regionally characterise changes in volume, carbon and profitability for all three redwood regimes, (ii) compare the profitability of CCF and RFM across all regions under transition and steady-state scenarios and (iii) compare the profitability of CCF and RFM with the PCF regime. Sensitivity analyses were undertaken to investigate the impacts of carbon and timber yield, carbon price, timber price and discount rate on profitability.
2. Materials and Methods
2.1. Overview
This study explores the management of a forest estate comprising 1000 ha planted with redwood at the beginning of the planning horizon starting from bare land. The financial returns were evaluated from five different regimes that included the following:
- (1)
- Transition to continuous-cover forestry (CCFt) starting with planting at year 0 with regulated harvesting, non-declining carbon stock and revenue from carbon up to age 40–45 (when carbon reaches an upper threshold) under the carbon stock-change method. The simulation was run over a 300-year planning horizon.
- (2)
- Steady-state CCF with a start point at 150 years along the planning horizon once the forest estate consists of a mixed-age class distribution, which represents the long-term steady-state (CCFs). This scenario is equivalent to the second half of scenario 1 (years 150–300) assuming that year 150 becomes year 0.
- (3)
- Traditional rotational forest management, with revenue from carbon up to years 20–25 (long-term carbon mid-point) under the carbon averaging method and unregulated harvesting of timber (RFMt).
- (4)
- Steady state of the above traditional RFM, with a start point at 150 years (RFMs) when trees are at mid-rotation. Starting the RFMs at mid-rotation represents a point at which a fair comparison can be made with CCFs as this reduces the time period to receive revenue, which increases profitability. This scenario is equivalent to the second half of scenario 3 (years 150–300) assuming that year 150 along the planning horizon becomes year 0.
- (5)
- Permanent carbon forest (PCF) with only income from carbon under the carbon stock-change method over the entire 300-year simulation.
The five regimes included a mix of the following constraints: (i) restricting harvest to stand ages of 35–100 years, (ii) maintaining at least 50% of the forest estate with an age exceeding 20 years, (iii) maintaining a non-declining carbon stock so that income from carbon will always be positive or zero to ensure there is no carbon liability. For scenarios 1–4, there were no limitations in the number of times the same hectare could be harvested within the planning horizon except for those constraints previously outlined.
For all regimes, the forest was planted at 625 stems/ha with no further silviculture for regime 5 (PCF), but the following silviculture for scenarios 1–4: prune 450 stems/ha at ages 6, 8 and 10 to a height of 6.5 m, and thin at age 11 to 450 stems/ha. After harvesting the first rotation, trees were grown from coppice for all subsequent rotations for regimes 1–4.
The decision consisted of finding the best forest harvest schedule that maximised, for all five scenarios, the net present value (NPV, see Equation (6)). Once the optimal forest harvest schedule was determined (based on NPV), two ancillary estimators of forest value, soil expectation value (SEV) and internal rate of return (IRR), were also determined and defined as follows:
IRR = the rate of return that makes the SEV equal to zero
2.2. Forest Harvest Scheduling Model
To model the management of the forest estate, we used a simplified formulation of Model III [40]. This model and its implementation as FOLPI (forestry-orientated linear programming interpreter) was developed to optimise the spatial and temporal distribution of harvests across large forest areas. FOLPI has been applied primarily for the intensive management of even-aged forest plantations and optimising decisions around when, where and how much to cut to ensure all management objectives are within acceptable ranges.
In this model, the forest estate is made up of a number of stands which, with the exception of regime 5 (PCF), will be subject to harvesting at some time along a planning horizon. Stands are grouped into crop types according to pre-defined similarities. Stands within a crop type are subject to the same silvicultural treatment and the same potential stream of inputs and outputs. However, they may differ in their ages and harvest times. The state of the forest at the start of each period is described by the area in each crop type and age class. During a period, some of the area in each age class may be cut, and the remaining area moves into the next age class at the beginning of the next period.
The following notation was used to specify the model:
- -
- Indices
- t = Index of time periods;
- j = Index of age classes.
- -
- Parameters
- T = Total number of periods;
- J = Total number of age classes;
- Pj = Net price per cubic meter (NZD/m3) of timber harvested from age class j;
- ϕ = Net price per tonne of CO2 stored (NZD/tonne CO2);
- Vj = Merchantable yield per hectare (m3/ha) in age class j;
- Sj = Carbon stock (tonnes CO2/ha) in age class j;
- r = Discount rate (as decimal number);
- aj = area (ha) of age class j at the beginning of the planning horizon;
- E = variable cost of establishing and tending 1 ha that was harvested.
- -
- Decision variables
- ytj = area (ha) harvested in period t from age class j
- -
- Auxiliary variables
Auxiliary variables do not affect the optimisation solution but assist in interpreting the results and include the following:
where xtj is the area remaining in age class j at period t, Ht is the total merchantable volume (m3) harvested in period t and Kt is the total carbon stock (tonnes CO2) in period t.
- -
- Objective Function
The objective function consists of maximising the net present value over the planning horizon (Equation (6)). The base discount rate was set to 6% p.a. The revenues were derived from two sources: harvesting (first component of Equation (6)) and carbon sequestration (second component of Equation (6)).
For the purposes of the optimisation exercise, fixed costs do not alter the values found for the decision variables. Thus, fixed costs were subtracted from the objective function (Equation (6)) after solving the optimisation problem. The NPV that was obtained was scaled to infinity using Equation (1) to yield the SEV.
- -
- Area constraints
Three groups of constraints were implemented in order to ensure the conservation of area [40]:
- (i)
- The area harvested must be immediately replanted (Rt).
- (ii)
- The area planted in any period (Rt) must be subsequently harvested.
- (iii)
- The area at the beginning of the planning horizon in each age class must subsequently be cut.
But, (i) and (ii) can be equal as Rt is the same for both constraints; thus,
Equations (7)–(10) incorporate the principle that hectares harvested from an age class in the current period become a part of the first age class in the subsequent period. Specifically, Equation (7) ensures that the area harvested must be immediately replanted. Equation (3) accounts for the area remaining in each age class in each period and is calculated based on the decision variable ytj. Hence, the model is consistent in ensuring the conservation of area and that the area harvested in the current period becomes a part of the first age class in the subsequent period. The structure of the model allows that any hectare could be harvested many times along the planning horizon.
- -
- Management constraints
The optimisation included various combinations of the following four constraints for the five scenarios:
- Minimum and maximum age of harvest. Trees are allowed to be harvested between ages 35 and 100 years, i.e.,
- 2
- Minimum canopy cover. This ensures that 50% of the forest estate should be age 20 years or older, which is an age at which canopy closure can be assumed in redwood at the final crop stand density. That is,
- 3
- Non-declining carbon stock. This constraint ensures that carbon stock does not decline so that revenue from carbon is received but does not have to be returned.
- 4
- Timber flow constraints. These can be stated as relationships between one given period and the next, allowing a maximum increase (α) and decrease (β) in the flow. Notice that α and β are proportions of the unit, meaning that from one period to the next, the volume harvested must not vary by more than that proportion.
Timber flow constraints were applied starting at period 8 (35–40 years), as the minimum age of harvesting was assumed to be 35 years. Values of α and β were established at 0.1 (i.e., timber flow from one period to the next must not exceed ±10%).
All four constraints, outlined in Equations (11)–(15), were applied to the two CCF regimes (regimes 1 (CCFt) and 2 (CCFs)). Only the first constraint around the minimum and maximum age of harvest (Equation (11)) was applied to the two RFM regimes (regimes 3 (RFMt) and 4 (RFMs)). As there was no harvesting in the PCF scenario, only the constraint around non-declining carbon stock (Equation (13)) was relevant and this was met as carbon continually accrued over the simulation time frame.
For scenarios 1, 3 and 5, the planning horizon was run over 300 years with 5-year periods (60 periods). Age classes were also grouped over 5-year intervals up to 150 years, which is an open age class, i.e., [0–5), [5–10), ……, [90–95) and [145+). There were 30 age classes in total. Yield after age 150 years was assumed to be constant as revenue beyond this point has virtually no effect on the financial metrics examined at the discount rates used [37]. As the problem was set for 1000 ha, it could be easily downscaled to 100 ha by dividing by 10 or upscaled to 10,000, 100,000 or 1 million ha (or any other number) by multiplying by 10, 100 or 1000, respectively.
In summary, scenarios 1 (CCFt) and 3 (RFMt) were optimised over 300 years. Scenarios 2 (CCFs) and 4 (RFMs) were derived from scenarios 1 and 3, in which the second part of the optimisation problem (years 150–300) was used in the calculations assuming that year 150 was now the beginning of the planning horizon. Hence, scenarios 2 and 4 had a planning horizon of 150 years. Scenario 5 (PCF) was run over 300 years. Despite having two different planning horizons, all five scenarios were comparable as discounted costs and revenues beyond 150 years are negligible [37] and Equation (1) was used to scale financial metrics for all scenarios to infinity.
2.3. Solving the Optimisation Problem
The problem was set up using a Microsoft Excel spreadsheet (version 16.54, 2021) and solved using the OpenSolver extension [42]. Briefly, OpenSolver is an open-source Excel add-in allowing the use of linear and integer programming models. These models can be solved using the COIN-OR CBC optimiser set within the OpenSolver add-in.
2.4. Estimates of Carbon and Total Stem Volume
Regional estimates of volume and carbon were based on the 300 Index methodology, which has been described in detail previously for redwood [43]. Site index and 300 Index were used as inputs to the redwood growth model. This model then estimated annual changes in volume and carbon and log out-turn from a combination of growth models, allometric equations and functions describing carbon partitioning and basic density [38,43].
The estimation of the two productivity metrics, site index and 300 Index, underpins the methods used to estimate volume and carbon. Site index for redwood is defined as the mean height of the 100 largest-diameter trees (mean top height, MTH) at a reference age of 30 years. The 300 Index, which is a normalised volume metric designed to overcome the shortcomings of site index, is defined as the mean annual stem volume increment for a stand grown at 300 stems/ha at age 30. The redwood 300 Index model includes a system of equations [43] that has been used to estimate both site index and 300 Index from standard inventory measurements taken from the 130 redwood permanent sample plots (PSPs) distributed throughout New Zealand [32].
Estimates of site index and 300 Index from the redwood PSP data were used to create spatial surfaces of these two productivity indices. Estimated values of these indices were associated with a comprehensive set of climatic, edaphic and topographic features, extracted from fine-resolution geospatial surfaces, and models were created that accurately predicted both site index (R2 = 0.72 and RMSE = 3.44 m) and 300 Index (R2 of 0.66 and RMSE of 6.80 m3 ha−1 yr−1) [32]. Predictions were made at a 25 m resolution using the environmental predictors included in each model. Areas with a mean annual air temperature < 8 °C were excluded as redwood is not typically planted in these areas. These masked predictions are shown in Figure 1, with both surfaces freely available from https://koordinates.com/ (accessed on 28 December 2023). The values of 300 Index and site index shown in Figure 1 were averaged across the nine New Zealand regions and subsequently used within the redwood growth model to predict volume, carbon and log grade out-turn.
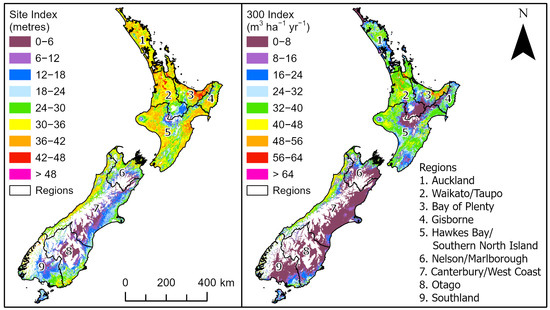
Figure 1.
Spatial variation in (left) site index and (right) 300 Index for redwood. The boundaries and names of the nine regions used in this study are shown.
Using the two productivity metrics, the redwood growth model predicted annual changes in MTH and basal area, which were then used to predict stem volume. Basic density was derived within the model from previously measured New Zealand stands [31] and, together with stem volume, was used to predict stem wood biomass. Allometric relationships were then leveraged to predict bark, branch and foliage biomass [31], and the default IPPC root/shoot ratio of 0.23 for conifers was used to predict redwood root biomass [44]. An exponential decay function, with a half-life of 15 years, was used to predict carbon losses from the decay of dead wood resulting from mortality and thinned and felled trees. The biomass estimates for all components were converted into carbon using documented carbon fractions ranging from 0.495 to 0.53 [31]. All of these functions were incorporated in an Excel implementation of the redwood growth model that can be freely supplied to all interested parties.
Using the regional estimates of 300 Index and site index, the redwood growth model was used to predict volume and carbon to 100 years for the CCF and RFM silvicultural scenarios described in Section 2.1. The simulation for the PCF scenario was run without any thinning with predictions extended to 150 years, which was a sufficiently long period to ensure that any carbon discounted beyond this time had a negligible influence on financial metrics [37]. As timber and carbon predictions use estimates of 300 Index derived from fully stocked PSP data, these were reduced by 15% to account for forest gaps and ensure that predictions were conservative. The predictions of total stem volume and carbon that were used for the CCF and RFM scenarios are shown in Figure 2.
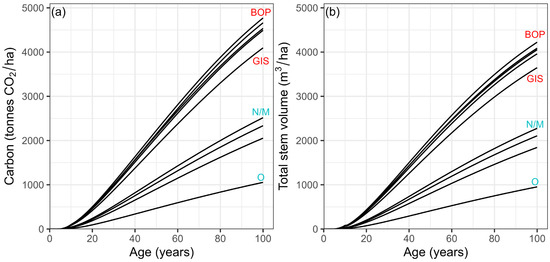
Figure 2.
Relationship between age and (a) carbon and (b) total stem volume (TSV) by region. The regions with the highest and lowest carbon and TSV at the end of the rotation for the North Island (red font) and South Island (teal font) are displayed and abbreviated as follows: BOP, Bay of Plenty; GIS, Gisborne; N/M, Nelson/Marlborough; O, Otago.
2.5. Timber Value and Harvesting Costs
As fully documented in [38], the redwood at mill gate (AMG) log values shown in Table 1 were estimated using two complementary approaches that included a comparative price analysis and lumber recovery, or ‘millback’, analysis. These values were combined with timber grade out-turn, predicted within the Excel implementation of the redwood growth model, which estimates the under-bark volume of each individual stem by log height (pruned butt log; and unpruned upper logs) and log small-end diameter (SED) class. For each region, predictions of log grade out-turn were made at 5-year intervals from 35 to 100 years and the total under-bark volume of pruned and unpruned logs in 10 cm SED classes was determined by region and harvest age using R version 4.2.3. [45]. By linking these data with the log values in Table 1, the mean AMG value per cubic metre across all log types by region and harvest age was determined, which is shown for a subset of these harvest ages in Table 2.

Table 1.
Variation in at mill gate (AMG) redwood log values by log type (pruned, unpruned) and small-end diameter (SED) class. Source: [38].
Table 2.
Variation in mean at mill gate (AMG) redwood log values by region and selected harvest ages ranging from 35 to 100 years.
The AMG log values increased markedly with harvest age by on average 41% from 35 to 100 years (Table 2). This increase was relatively similar within all regions (34%–42%) apart from Otago, where increases of 58% were noted. Regional differences in AMG value were also quite marked. At a harvest age of 50 years, the mean AMG value was 318 NZD/m3, which ranged from 242 NZD/m3 in Otago to 349 NZD/m3 in Waikato/Taranaki. By age 70, the mean AMG across regions increased to 354 NZD/m3 (range of 289–390 NZD/m3) and further increased to 394 NZD/m3 (range of 307–434 NZD/m3) at a harvest age of 100 (Table 2).
Harvesting, roading and transport costs to a mill were estimated through consultation with industry experts and the literature. Following [46], a mean cart distance over all nine regions of 100 km and a cartage cost of NZD 19/m3 were assumed. Following [47], harvest costs under CCF were assumed to be 25% higher than those under RFM (Table 3) as small coupes were harvested. The total costs for harvest, transport and roading were NZD 76 and NZD 91/m3, respectively, for RFM and CCF regimes (Table 3). The costs associated with harvest were deducted from the AMG estimates in Table 2, to determine net harvest returns, by region and age class for RFM and CCF regimes. These net values were then multiplied by the corresponding total recoverable volumes to determine the value of harvested timber, by region and age class.
Table 3.
Summary of costs and the year in which they occurred from the start of the simulation, for the three regimes. All costs are given in New Zealand dollars. Costs followed by an asterisk * only occur in the year shown. Costs or timings that differ between continuous-cover forestry (CCF) and rotational forest management (RFM) are highlighted in green, while those that differ between permanent carbon forests (PCF) and the other two regimes are highlighted in orange.
2.6. Establishment, Silviculture and Management Costs
All establishment, silviculture and management costs were quantified through a literature review and consultation with industry (Table 3). Establishment costs at the start (year 0) for all three regimes totalled NZD 3159/ha and included land preparation, planting, release spraying and mapping. As redwood re-coppices following harvest, these costs were not incurred from the second rotation onwards for either CCF or RFM regimes. During the first rotation, redwood was pruned to 6.5 m during years 6, 8 and 10, at a cost of NZD 2329/ha per lift, and then thinned at age 11 to 450 stems/ha at a cost of NZD 900/ha for all regimes apart the PCF regime, in which stands were not pruned or thinned. A higher tending cost was used from the second rotation onwards for CCF and RFM as these operations incorporated the three pruning lifts and a cost of NZD 2000/ha for thinning the coppicing redwood sprouts.
Periodic costs included carbon administration; maintenance of roads, tracks and fences; and animal control. We assumed a conservative cost of NZD 71/ha for participation in the ETS [37] and that assessments would be undertaken every five years, which is the minimum claim frequency under current legislation. These costs were incurred over the entire simulation for PCF up to 40–45 years for CCF and to 20–25 years for RFM, which was the long-term averaging age for this regime. The annual costs included forest management and rates, insurance and administration. Forest management costs were 50% higher for CCF than RFM and PCF (NZD 60 vs. NZD 40/ha) to allow for the increased complexity of managing a continuous-cover forest (Table 3).
2.7. Carbon Value
In recent years, the carbon price has escalated from NZD 25/tonne CO2 in 2019 to nearly NZD 90/tonne CO2 in November 2022. Within this study, a base real value of NZD 80/tonne CO2 was assumed, representing the mean carbon price throughout the latter half of 2022. Within the sensitivity analyses, the selected values were chosen to represent timber-only regimes (NZD 0/tonne CO2), the minimum value for auctioned carbon (NZD 35/tonne CO2) within the ETS [48], with the upper value (NZD 160/tonne CO2) corresponding to the assumed value of carbon in 2035 by the Climate Change Commission [49].
2.8. Sensitivity Analyses
Sensitivity analyses were carried out by region for all regimes by changing carbon prices (NZD 0, 35, 80, 160/tonne CO2), interest rates (4, 6, 8% p.a.), yields (±50%, ±20% base scenario) and timber prices (±20% base scenario). One variable was changed at a time and everything else was kept constant (ceteris paribus) at baseline values, described above. The impact of these changes on timber production, carbon stock and SEV were documented.
3. Results
3.1. Regime Comparison of Forest Structure, Timber Flow and Carbon Accumulation
3.1.1. Variation under Baseline Conditions
Within the CCFt regime, the earliest harvesting took place from 35 to 40 years across all regions. Most stands were harvested between 35 and 95 years and the oldest stand was harvested at 100 years (the maximum allowable rotation length). The steady-state condition was reached by year 150 for all nine regions, which was verified by a relatively stable area distribution by age class, regulated timber flow and carbon stock, which peaked far earlier and remained constant (Figure 3). The area distribution by age class stabilised by age 150, and henceforth, there were about 70 ha remaining for the first 14 age classes (up to year 70) and about 20 ha for the 15th age class (70–75 years). Under the CCF scenario, the steady-state rotation length was predicted to be about 70 to 75 years across regions. Under the two RFM regimes, all stands were harvested between 35 and 40 years of age.
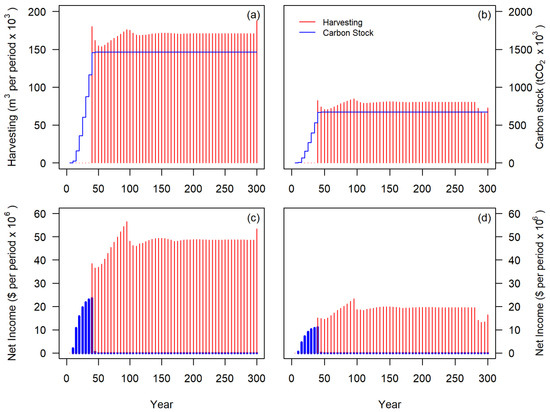
Figure 3.
Variation in (a,b) harvested wood flows and total carbon stock and (c,d) net income from harvesting and carbon for continuous-cover regimes in two regions with contrasting productivity that include (a,c) Bay of Plenty and (b,d) Southland.
There was a marked gradient in forest cover (defined as stands ≥20 years) for the scenarios studied. At one extreme, RFM fluctuated from 0 to 100%, while at the other extreme, cover within the PCF was continuously 100% as there was no harvesting (Table 4). Values of cover for the CCF were intermediate between these extremes, averaging 72% for both the transitioning (CCFt) and steady-state regimes (CCFs). However, the range narrowed from 52% to 87% for CCFt to mainly 72% to 73% for CCFs, but in two regions, it was a little wider for this regime, ranging from 55% to 74% (Table 4).
Table 4.
Summary of financial metrics (SEV, IRR), forest cover (≥20 years), carbon stock and timber flow for the five regimes across regions in New Zealand. The three highest SEVs by region are shown in colour with green indicating the highest, orange the second-highest and red the third-highest SEV for each region.
The carbon stock that produced revenue within each regime varied widely between regimes. Carbon stock was highest for PCF, and at age 150 years, it ranged from 5521 to 6242 tonnes CO2/ha in the North Island and 1588 to 3648 tonnes CO2/ha in the South Island (Table 4). Carbon stock was markedly lower for the CCFt regime, reaching a maximum at 45 years (Figure 3), which ranged from 1232 to 1465 tonnes CO2/ha in the North Island and 324 to 754 tonnes CO2/ha in the South Island (Table 4). These carbon values for CCFt ranged from 20% to 23% of the values for PCF. As accumulated carbon reached a maximum during the first 45 years, there was no revenue derived from carbon for CCFs (Figure 3). The mid-point carbon for RFMt that can be counted as revenue ranged from 461 to 551 tonnes CO2/ha in the North Island and 108 to 270 tonnes CO2/ha in the South Island (Table 4), and these values ranged from 7% to 9% of values for PCF and 33% to 38% of values for CCFt. No revenue was derived from carbon stock for RFMs as carbon was only accumulated until the long-term mid-point for this scenario, which was reached in the first rotation.
Wood flows for the four regimes that produced timber ranged widely across regions with markedly higher values within the North Island than the South Island regions (Table 4). Values that are shown in Table 4 for CCFt were averaged from 40 years onwards, when harvesting commenced. The mean wood flows for CCFs exceeded those of CCFt by 5% in the North Island but were similar in the South Island (Table A1). When these were re-expressed as an annual timber production, harvested wood flows for the CCF regimes exceeded those of the RFM scenarios, within the North and South Islands, by 18% and 19% for CCFt and by 24% and 20% for CCFs.
3.1.2. Sensitivity Analyses
Carbon stock within the CCFt regime was found to be most influenced by variations in carbon price, discount rate and timber price (Table A2). Within this regime, carbon stock was insensitive to carbon prices below 80 NZD/tonne CO2, but carbon stock increased by 17% and 49%, respectively, for the North and South Islands as carbon prices increased further to 160 NZD/tonne CO2. Reductions in the discount rate had little effect on carbon stock for the CCFt regime. However, increases in the discount rate to 8% had a larger impact on carbon stocks for CCFt with values increasing by, respectively, 24% and 44% over baseline conditions within the North and South Islands. As timber prices declined, there were small increases in carbon stock for the CCFt scenario that were ≤1% in the North Island and 8% in the South Island across the timber price range (Table A2). Carbon stocks for the remaining four regimes were insensitive to discount rate, carbon or timber prices as changes in carbon stocks were negligible within CCFs and the carbon stock was predetermined, without optimising values against timber yield, within the RFM and PCF scenarios. Carbon stocks within the two transitioning regimes and PCF were proportionately affected by the percentage changes in yield (Table A2).
Wood flows within the two CCF scenarios were most affected within the sensitivity analysis (Table A1). Discount rate had the largest impact on timber production within the two CCF scenarios. Little change was noted between discount rates of 4% and 6%. However, increases from 6% to 8% resulted in reductions in timber production of 13 and 17%, respectively, within the North and South Islands under CCFt and 19% within both Islands under CCFs (Table A1). Variation in carbon price mostly impacted wood flows in the CCFt regime with a 5%–9% reduction in timber production occurring as carbon price increased from NZD 0 to 160/tonne CO2 (Table A1).
Wood flows within the two RCM scenarios were proportionate to changes in yield. These changes were close to proportionate for the two CCF scenarios and the most marked deviations from this proportionality occurred within the South Island under CCFs, where increases in yield of 20 and 50% resulted in respective increases in timber production of 26 and 59%. Changes in timber price had very little effect on wood flows for any of the four timber-producing regimes (Table A1).
3.2. Financial Comparison of Regimes
When values were area-weighted across Islands, the ranking of regimes in descending order of SEV was CCFs, followed by RFMs for both Islands. Within the North Island, the remaining ranking was CCFt, RFMt, then PCF, while in the South Island, this ranking was PCF, followed by CCFt, then RFMt (Table 5). These high-level rankings were consistent with regional variations, which showed SEV for CCFs followed by RFMs to be the ranking order across all regions. With the exception of one region, CCFt had the third-highest SEV within the North Island, while PCF had the third-highest SEV within all South Island regions (Table 4).
Table 5.
Sensitivity analysis showing variation in SEV by Island for the five regimes as a function of changes in key variables. A ranking in SEV for each Island, across the five regimes, for each variable is shown in colour, with green indicating the highest, orange the second highest and red the third highest.
There was wide regional variation in SEV for CCFt. Values of SEV under this regime ranged from NZD 29,187 to 37,045/ha in the North Island and from NZD −2789 to 11,732/ha in the South Island (Table 4), with area-weighted means of NZD 34,430/ha and NZD 6267/ha, respectively, in the North and South Islands (Table 5). The SEV of the CCFs regime exceeded that of CCFt by four-fold in the North Island (NZD 136,126/ha vs. NZD 34,430/ha) and seven-fold (NZD 44,714 vs. NZD 6267/ha) in the South Island (Table 5).
Similar regional variation in SEV was noted for the RFMt and RFMs scenarios. Values of SEV for RFMt were slightly lower than those of CCFt within all but one of the New Zealand regions (Table 4). However, overall there was little difference in the weighted mean for SEV between these scenarios within the North Island (RFMt =NZD 34,161/ha vs. CCFt = NZD 34,430/ha) or South Island (RFMt = NZD 4773/ha vs. CCFt = NZD 6267/ha). Similarly, under the baseline scenario, the weighted IRR values varied little between RFMt and CCFt and were, respectively, 12.5% and 12.7% in the North Island and 7.2% and 7.6% in the South Island.
Values of SEV and IRR were markedly higher than both of these regimes for RFMs, which started at the rotation mid-point. Values of SEV for this regime were NZD 80,353/ha and NZD 23,182/ha, respectively, within the North and South Islands (Table 5). Although this regime was the second-most profitable, the SEV values for RFMs were still markedly lower than those of CCFs. The PCF scenario was ranked last of the five regimes in the North Island. However, the SEVs for PCF did not differ greatly from that of CCFt or RCMt within all five regions, with area-weighted North Island values ranging less than 5% between the three scenarios (Table 5). Within the South Island, PCF was more profitable than either CCFt or RCMt within all four regions (Table 4).
The CCFs regime had the highest SEV for a number of reasons. This regime had the highest timber revenue among all examined regimes, as harvested stands were older than other regimes (65–75 years) and produced the highest annualised wood flow and timber value per cubic metre. Importantly, compared to other regimes, this high timber revenue occurred immediately during the first 5 years and regularly thereafter for CCFs, which had a large positive impact on SEV. These revenue flows were discounted far further for other timber regimes, where the earliest revenue from timber occurred, respectively, at 20–25, 35–40 and 35–40 years along the planning horizon for RFMs, RFMt and CCFt. Similarly, the RFMs regime had the second-highest SEV, as revenue from the first harvest was discounted over less time than that of RFMt or CCFt. Focusing on the representative regions shown in Figure 3 (Bay of Plenty in the North Island, Southland in the South Island) the total discounted revenues for the two steady-state regimes were very high within both Bay of Plenty (CCFs = NZD 141.4 M; RFMs = NZD 83.6 M) and Southland (CCFs = NZD 55.3 M; RFMs = NZD 30.8 M) for the reasons outlined above.
Although the CCFt regime was far more constrained than that of either the RFMt or PCF regimes, SEV values for the CCFt regime were generally the highest in the North Island and were only slightly lower than PCF within the South Island. The total discounted revenue between these three regimes was very similar for both the Bay of Plenty (CCFt = NZD 47.9 M; RFMt = NZD 47.0 M; PCF = NZD 46.3 M) and Southland (CCFt = NZD 20.7 M; RFMt = NZD 19.1 M; PCF = NZD 21.0 M). Although discounted revenue from timber was lower for CCFt than RFMt, this was offset by the higher discounted carbon revenue for CCFt, which, as a percentage of total discounted revenue, was much higher than RFMt within both the Bay of Plenty (68 vs. 43%) and Southland (70 vs. 46%) as carbon was accumulated over a longer period (40 vs. 22.5 years).
3.3. Sensitivity Analyses
3.3.1. Carbon
Among the three regimes that derived revenue from carbon (CCFt, RFMt and PCF), the PCF regime was most sensitive to carbon price, followed by CCFt, then RFMt. Reductions in the carbon price to NZD 0/tonne CO2 resulted in the lowest recorded SEV of NZD −10,503 within both Islands for PCF, equivalent to the discounted value of variable and fixed costs for this regime (Table 5). However, under a carbon price of NZD 160/tonne CO2, the SEV for this regime exceeded that of both CCFt and RFMt within both Islands by quite a margin (Table 5). Carbon price break-even points under which the SEV for the PCF regime was equal to that of CCFt were, respectively, NZD 83 and NZD 75/tonne CO2 for the North Island and South Island. The carbon break-even prices for the PCF regime against the most profitable CCFs regime were, respectively, NZD 271 and NZD 248/tonne CO2 for the North Island and South Island.
The SEV of CCFt was more sensitive to carbon price than RFMt as a larger proportion of the revenue was derived from carbon for CCFt. Within the North Island, the SEV for CCFt varied over the carbon price range from NZD 4056 to 65,201/ha, but only from NZD 15,255 to 53,067/ha for RFMt (Table 5). Similarly, this range was far more pronounced within the South Island for CCFt (NZD −5944–18,751/ha) than RFMt (NZD −2571–12,118/ha). The RFMt had a higher SEV than either CCFt or PCF at the two lowest carbon prices as RFMt had the lowest proportion of carbon revenue among these three regimes (Table 5).
3.3.2. Timber Price and Yield
Within both the transition scenarios (RFMt, CCFt), changes in timber price and yield resulted in approximately proportionate changes in SEV (Table 5). The RFMt was more sensitive to timber price than CCFt, with SEV values ranging more widely across the range within both the North Island (RFMt range of NZD 28,892–39,430/ha; CCFt range NZD 31,404–37,455/ha) and South Island (RFMt range of NZD 3070–6477/ha; CCFt range NZD 5292–7283/ha). Changes in yield had a similar impact on the SEV of both of the transitioning scenarios and PCF as yield included both carbon and wood flows (Table 5). However, even under the highest yield reduction of 50%, the mean North Island SEV ranged from NZD 11,121 to 11,680/ha for PCF, RFMt and CCFt, which exceeds the current mean land value within New Zealand of NZD 10,000/ha [37].
3.3.3. Discount Rate
Among the transitioning scenarios and PCF, the SEV for CCFt was most sensitive to changes in the discount rate (Table 5). Values of SEV for this regime declined as discount rates increased from 4% to 8% by NZD 65,464/ha (NZD 81,258/ha at 4% to NZD 15,794/ha at 8%) and NZD 23,808/ha (NZD 23,159 at 4% to NZD −649 at 8%), respectively, for the North and South Islands. SEV values were very similar between RFMt and CCFt at 6% and 8% but were markedly lower for RFMt within both Islands at 4%, and these differences were most pronounced for the South Island (Table 5). The PCF scenario had a similar SEV to the other two scenarios at 6 and 8%, but at 4%, a lower SEV value was recorded in the North Island (NZD 65,356/ha), with moderate values within the South Island (Table 5). Both of the steady-state regimes were very sensitive to the discount rate. Under a discount rate of 4%, the SEV within the CCFs regime reached respective values of NZD 213,192/ha and NZD 73,200/ha within the North and South Islands.
4. Discussion
The analyses presented here highlight the economic viability of CCF using redwood within New Zealand. Under the transitioning scenario (CCFt), SEVs were positive and relatively high for all of the North Island (NZD 29,187–NZD 37,045/ha) but lower within the South Island, where they approximated the current land price of NZD 10,000/ha [37] in two regions, with lower values in Canterbury and Otago. However, once CCF had reached a steady state, SEV values were markedly higher, ranging from NZD 117,526 to NZD 144,765/ha within the North Island and ranged from NZD 16,746 to NZD 59,359/ha within the South Island. An important finding from this study was that revenue from carbon can be used to finance the transition to a steady-state CCF, which, when reached, is a very profitable land use that yields a continuous stream of high-value timber. These results extend previous research that has mainly focused on the financial viability of transitioning to CCF and highlight the importance of the start point on the financial outcome [15].
Although CCFt was optimised under many management constraints (non-declining carbon stock, even timber flow and canopy cover greater than 50% for trees 20 years and older), this regime had a slightly higher SEV than the relatively unconstrained RFMt regime. Generally, a constrained optimisation problem run under the same conditions yields a lower value than an unconstrained one. However, carbon can accumulate for longer to the mid-point within CCFt than RFMt (40 vs. 22.5 years) and as a result, a far higher carbon revenue was derived for CCFt than RFMt, which offset the lower timber revenue for CCFt, resulting from the constrained optimisation. As has been found previously [50,51], the relative profitability of CCFt compared to RFMt increased with reductions in site quality. The greatest differences in IRR and SEV between these two regimes were noted within the South Island and, in particular, the cold–dry Otago region, which is the New Zealand region that is least suited to redwood [32].
Under steady-state conditions, starting at 150 years, during which time there was no carbon revenue, CCFs had an SEV that was substantially higher than all other scenarios across all regions. This occurred as there was an immediate and constant flow of timber revenue that had higher value as older stands were harvested under the CCFs scenario (Figure 3). This finding highlights that the control of erosion and mitigation of windthrow through CCF [9] can be obtained without an economic trade-off, and once in a steady state, CCF has a far higher SEV than RFM.
Sensitivity analyses showed that CCFt was more sensitive to carbon price than RFMt as carbon revenue forms a higher proportion of total revenue for CCFt. Consequently, any legislation developed around CCF definitions and eligibility for carbon payments should accommodate the ecological requirements of redwood. In turn, the provision of legislative support that enables redwood to be grown under CCF regimes will greatly benefit New Zealand. The use of redwood in CCF regimes will assist New Zealand in meeting carbon targets and provide a means of transitioning the forestry sector to a supplier of high-value wood products from resilient forests that are resistant to damaging storms [21,22], fire [23,24,25], pests and diseases [19,20].
Permanent carbon forestry is an emerging option within New Zealand, which, given recent carbon prices, is very profitable and particularly well suited to fast-growing long-lived species such as redwood [37]. Under the PCF regime, growers are paid according to the stock-change method, which for species such as redwood allows continual carbon accrual at high rates over hundreds of years. At the baseline scenario of NZD 80/tonne CO2, the SEV from PCF was slightly lower than transitioning RFM and CCF in the North Island but slightly higher than these two regimes in the South Island. However, returns from CCFs markedly exceeded those from PCF. The results show that carbon price needs to reach between NZD 248 and 271/tonne CO2 for SEV values of PCF to equal those of CCFs.
Although it was assumed that growth projections developed from even-aged stands were applicable to CCF, it is unlikely that significant reductions in redwood growth would occur using a coupe size of 0.5 ha under CCF. Redwood has been classed as tolerant or very tolerant of shade [25] and, in a comparison with 12 other tree species, was found to grow at least twice as rapidly as any other species under weaker light [52,53]. For example, Douglas fir (Pseudotsuga menziesii) and Engelmann spruce (Picea engelmannii) require twice as much light as redwood, while pine requires three–four times as much light [52,53]. An experiment that compared redwood growth under light regimes simulating three different types of growing conditions (full shade; intermittent high light; large openings with equal low and high light) showed that redwood grew most rapidly under large openings [54]. Interestingly, biomass growth within the large opening simulation was very similar between 66% and 100% full light, showing that redwood does not require completely open conditions to reach maximum growth rates [54].
Within second-rotation stands, growth rates of redwood are likely to exceed model predictions based on planted stands, as coppicing sprouts grow far more rapidly than planted seedlings. Compared to planted seedlings, regenerating sprouts have been reported to have a height and diameter that exceed those of seedlings by 2–3 fold and 4–7-fold, respectively, at age 9 [55]. Sprout growth rate over the first five years has been found to increase with percentage above canopy light (PACL) up to a rapid rate of 1 m/year at a PACL of 50%, above which little change is noted [56]. Row felling in mature stands does create a PACL well below this 50% threshold [56,57,58]. However, coupe felling of a 0.5 ha area will have a far higher mean PACL than row felling, with one study showing a median PACL of ca. 50% within a gap as small as 0.077 ha [58]. Further research should investigate the influence of a range of felling configurations on redwood growth rates and the practicalities of harvesting these stands. However, given the shade tolerance of redwood, it is likely that when coupe felling is used for CCF, growth rates will be similar to RFM. Second-generation stands for both regimes are likely to develop faster than the first rotation, given the high comparative growth rates of sprouts compared to seedlings [55].
Redwood log prices used in this study were sensitive to key log attributes and the coupling of these prices with log grade out-turn provided a means of scaling log value with stand age. Redwood stands felled at older ages, with a large small-end diameter, have a greater value per cubic metre, as these contain a higher proportion of sawn timber and high-value heartwood [41]. Including the variation in log value by age refines the approach taken by most studies, which use a fixed log value per cubic metre across all harvest ages [15]. In contrast to previous research [59], the impacts of log price on revenue were found to be relatively high, particularly under steady-state CCF, where revenue was only derived from timber and impacts on revenue were directly proportional to the change in log price.
The sensitivity of SEV to carbon price was very dependent on regime. The two steady-state regimes were unaffected by carbon price as these had already reached a carbon equilibrium and did not derive any revenue from carbon. The PCF regime was most sensitive to carbon price as carbon was the sole form of income, while RFMt was least sensitive as carbon was only accumulated for 22 years. The sensitivity of CCFt lay between these two extremes as revenue from carbon was derived over 40–45 years. In contrast to our approach, which evaluated the impact of fixed carbon prices on profitability, studies have also evaluated the impact of carbon prices that increase over time on regime profitability [60]. Although this approach is very valid, the use of changing rather than static carbon prices would not affect our main conclusions. All regimes that derived income from carbon had a similar SEV at NZD 80/tonne CO2 and an order in SEV at NZD 160/tonne CO2 that reflected the percentage of total revenue derived from carbon (PCF > CCFt > RFMt). As a consequence, the use of increasing values in carbon price between NZD 80 and 160/tonne CO2 would change the actual SEV values but not the relative order in SEV between the three carbon regimes. The break-even point where the PCF regime exceeded CCFs was calculated as NZD 248–271/tonne CO2, which would not be reached using carbon prices that increase between NZD 80 and 160/tonne CO2.
Analyses were very sensitive to the discount rate. The base discount rate that was used here was consistent with previous species comparisons of profitability within New Zealand [37,60]. The discount rate range used in the sensitivity analysis also generally aligned with a recent survey of New Zealand forestry companies for comparable-sized forest areas [61]. Internationally, the discount rates tested by the sensitivity analysis were within the range used for private enterprises, which generally varied from 2% to 8% [62,63,64,65,66]. Social discount rates that recognise the public good of projects typically range from 3% to 5% [67,68,69], and in this context, discount rates that decline over time are often used [70,71]. Although we have assumed that the products and revenue produced are a private good, the lower bound of 4% used within the sensitivity analysis does provide some indication of SEV under public good projects.
This overall methodology described here could be transferred to other countries and species. The key findings highlighting the profitability of CCF are very relevant for species with sustained rapid growth, valuable timber and income derived from carbon, which are ecologically suited to management under CCF. The management of these species under a CCF regime is likely to be particularly profitable in countries where there are developed management policies and carbon has value. Our analyses show that an income stream from carbon can be used to transition these forests to a steady-state condition, which can be regularly harvested to yield high-value timber.
Although the overall optimisation framework was robust, further research should be undertaken to refine and more fully validate spatial predictions of volume, carbon and wood density. The regional predictions of growth and carbon used here were developed from models characterising spatial variation in productivity that were underpinned by national permanent sample plot (PSP) data. Although these models were accurate [31,32,43], further work should extend the underpinning PSP dataset so that it more comprehensively encompasses the environmental conditions under which redwood is grown, which would improve confidence in model predictions. Further research should also sample wood density across a broader environmental range as carbon is very sensitive to this wood property.
This study highlights the considerable afforestation potential of redwood within New Zealand. Development of policy that supports the payment of carbon for redwood stands under CCF regimes could be used to transition the New Zealand plantation estate over time into a very valuable resource producing a stream of high-value timber. The establishment of redwood CCF regimes on steep slopes with vulnerable soils will substantially reduce erosion risk as high cover is maintained under CCF and the coppicing ability of redwood reduces the post-harvest window of erosion vulnerability [72]. Research has widely advocated redwood for erosion control [72,73,74,75], and prevention of erosion will substantially mitigate the flow of harvest debris into hydrological systems, which, under existing radiata pine RFM regimes, has caused major social and ecological issues within New Zealand [34]. As redwood is very resistant to fire [23,24,25] and wind damage [21,22] and does not suffer from any significant pest or disease issues [19,20], this species is a leading contender for future plantings under a climate where these risks are likely to intensify for widely planted species such as radiata pine.
5. Conclusions
Although all five redwood regimes compared in this study had their strengths, this study did highlight the potential of continuous-cover forestry. Under the baseline scenario, the transitional CCF regime (CCFt) had a higher SEV than rotational forest management (RFM) or permanent carbon forestry (PCF) within almost all North Island regions. Although PCF had a higher SEV than CCFt within the South Island, differences in SEV were relatively small between these two regimes. A major advantage of the CCFt regime is that the carbon revenue received over the first 40 years, under the carbon stock-change method, provides a means of financing the transition of the forest into a steady state (CCFs). The SEV for the CCFs regime far exceeded that of any of the other examined regimes, with values in the North Island and South Island exceeding that of CCFt by four-fold in the North Island (NZD 136,126/ha vs. NZD 34,430/ha) and seven-fold (NZD 44,714 vs. NZD 6267/ha) in the South Island. The transition of redwood forests to this state through CCF regimes would provide a steady flow of quality timber with a high market value and substantially improve the value of the New Zealand plantation estate.
Author Contributions
Conceptualisation, M.S.W. and H.E.B.; methodology, H.E.B. and M.S.W.; software, H.E.B. and M.S.W.; validation, H.E.B. and M.S.W.; formal analysis, H.E.B. and M.S.W.; investigation, H.E.B. and M.S.W.; resources, M.S.W. and H.E.B.; data curation, M.S.W. and H.E.B.; writing—original draft preparation, M.S.W. and H.E.B.; writing—review and editing, M.S.W. and H.E.B.; visualisation, M.S.W. and H.E.B.; project administration, M.S.W. and H.E.B.; funding acquisition, M.S.W. and H.E.B. All authors have read and agreed to the published version of the manuscript.
Funding
This research was supported by the Scion Strategic Science Investment Fund (SSIF).
Data Availability Statement
Growth measurements used to derive the model are privately owned by forestry companies and cannot be published publicly. However, the growth model and model output can be supplied to all interested parties.
Acknowledgments
We are grateful to the forestry companies with redwood permanent sample plots for permission to use these datasets as these underpin the models developed in this paper. We thank Simon Rapley, Rob Webster and Paul Silcock for providing useful information about redwood-related costs and regimes and Mark Kimberley, who developed the 300 Index model, which underpins the modelling approach used. We are also grateful to Bill Liley and David Nicoll, whose original analyses were the foundation for the presented redwood log values, and Ben Steer, who produced Figure 1. We thank the anonymous referees for comments that greatly improved the manuscript.
Conflicts of Interest
The authors declare no conflicts of interest.
Appendix A
Table A1.
Sensitivity analysis showing variation in wood flows by Island for the five regimes as a function of changes in key variables.
Table A1.
Sensitivity analysis showing variation in wood flows by Island for the five regimes as a function of changes in key variables.
| Regime 1 (CCFt) | Regime 2 (CCFs) | Regime 3 (RFMt) | Regime 4 (RFMs) | Regime 5 (PCF) | |||||||
|---|---|---|---|---|---|---|---|---|---|---|---|
| NI | SI | NI | SI | NI | SI | NI | SI | NI | SI | ||
| m3/ha per year | m3/ha at harvest, age 37.5 years | ||||||||||
| Carbon Price (NZD/t CO2) | 0 | 32,798 | 13,064 | 34,419 | 13,494 | 1,039,652 | 400,526 | 1,039,652 | 400,526 | - | - |
| 35 | 32,798 | 13,050 | 34,419 | 13,648 | 1,039,652 | 400,526 | 1,039,652 | 400,526 | - | - | |
| 80 | 32,798 | 12,763 | 34,419 | 12,790 | 1,039,652 | 400,526 | 1,039,652 | 400,526 | - | - | |
| 160 | 31,256 | 11,837 | 33,141 | 13,834 | 1,039,652 | 400,526 | 1,039,652 | 400,526 | - | - | |
| Timber Price | −20% | 32,792 | 12,382 | 33,788 | 12,702 | 1,039,652 | 400,526 | 1,039,652 | 400,526 | - | - |
| base | 32,798 | 12,763 | 34,419 | 12,790 | 1,039,652 | 400,526 | 1,039,652 | 400,526 | - | - | |
| 20% | 32,798 | 12,960 | 34,419 | 12,965 | 1,039,652 | 400,526 | 1,039,652 | 400,526 | - | - | |
| Yield | −50% | 16,151 | 6227 | 16,092 | 6246 | 519,826 | 200,263 | 519,826 | 200,263 | - | - |
| −20% | 26,236 | 10,032 | 27,529 | 9934 | 831,722 | 320,421 | 831,722 | 320,421 | - | - | |
| base | 32,798 | 12,763 | 34,419 | 12,790 | 1,039,652 | 400,526 | 1,039,652 | 400,526 | - | - | |
| 20% | 39,358 | 15,631 | 41,303 | 16,059 | 1,247,583 | 480,632 | 1,247,583 | 480,632 | - | - | |
| 50% | 49,198 | 19,700 | 51,629 | 20,299 | 1,559,478 | 600,790 | 1,559,478 | 600,790 | - | - | |
| Discount rate | 4% | 32,798 | 12,574 | 34,419 | 14,185 | 1,039,652 | 400,526 | 1,039,652 | 400,526 | - | - |
| 6% | 32,798 | 12,763 | 34,419 | 12,790 | 1,039,652 | 400,526 | 1,039,652 | 400,526 | - | - | |
| 8% | 28,643 | 10,574 | 28,020 | 10,416 | 1,039,652 | 400,526 | 1,039,652 | 400,526 | - | - | |
Table A2.
Sensitivity analysis showing variation in financially recognized carbon stock by Island for the five regimes as a function of changes in key variables.
Table A2.
Sensitivity analysis showing variation in financially recognized carbon stock by Island for the five regimes as a function of changes in key variables.
| Regime 1 (CCFt) | Regime 2 (CCFs) | Regime 3 (RFMt) | Regime 4 (RFMs) | Regime 5 (PCF) | |||||||
|---|---|---|---|---|---|---|---|---|---|---|---|
| NI | SI | NI | SI | NI | SI | NI | SI | NI | SI | ||
| Carbon stock (tonnes CO2/ha) by region | |||||||||||
| Carbon Price (NZD/t CO2) | 0 | 1374 | 567 | 1374 | 567 | 515 | 207 | 543 | 219 | 5968 | 2905 |
| 35 | 1374 | 569 | 1374 | 569 | 515 | 207 | 543 | 219 | 5968 | 2905 | |
| 80 | 1374 | 583 | 1374 | 583 | 515 | 207 | 543 | 219 | 5968 | 2905 | |
| 160 | 1604 | 870 | 1604 | 870 | 515 | 207 | 543 | 219 | 5968 | 2905 | |
| Timber Price | −20% | 1383 | 619 | 1383 | 619 | 515 | 207 | 543 | 219 | 5968 | 2905 |
| base | 1374 | 583 | 1374 | 583 | 515 | 207 | 543 | 219 | 5968 | 2905 | |
| 20% | 1374 | 575 | 1374 | 575 | 515 | 207 | 543 | 219 | 5968 | 2905 | |
| Yield | −50% | 691 | 301 | 691 | 301 | 258 | 104 | 272 | 109 | 2984 | 1452 |
| −20% | 1099 | 471 | 1099 | 471 | 412 | 166 | 435 | 175 | 4775 | 2324 | |
| base | 1374 | 583 | 1374 | 583 | 515 | 207 | 543 | 219 | 5968 | 2905 | |
| 20% | 1648 | 704 | 1648 | 704 | 618 | 249 | 652 | 263 | 7162 | 3486 | |
| 50% | 2060 | 878 | 2060 | 878 | 773 | 311 | 815 | 328 | 8952 | 4357 | |
| Discount rate | 4% | 1374 | 611 | 1374 | 611 | 515 | 207 | 543 | 219 | 5968 | 2905 |
| 6% | 1374 | 583 | 1374 | 583 | 515 | 207 | 543 | 219 | 5968 | 2905 | |
| 8% | 1700 | 839 | 1700 | 839 | 515 | 207 | 543 | 219 | 5968 | 2905 | |
References
- Pommerening, A.; Murphy, S. A review of the history, definitions and methods of continuous cover forestry with special attention to afforestation and restocking. Forestry 2004, 77, 27–44. [Google Scholar] [CrossRef]
- Schütz, J.-P. Close-to-nature silviculture: Is this concept compatible with species diversity? Forestry 1999, 72, 359–366. [Google Scholar] [CrossRef]
- O’Hara, K.L.; Hasenauer, H.; Kindermann, G. Sustainability in multi-aged stands: An analysis of long-term plenter systems. Forestry 2007, 80, 163–181. [Google Scholar] [CrossRef]
- United Nations. Convention on Biological Diversity; United Nations: Montreal, QC, Canada, 2011; Available online: https://www.cbd.int/doc/legal/cbd-en.pdf (accessed on 15 December 2023).
- Mason, W.L.; Diaci, J.; Carvalho, J.; Valkonen, S. Continuous cover forestry in Europe: Usage and the knowledge gaps and challenges to wider adoption. For. Int. J. For. Res. 2022, 95, 1–12. [Google Scholar] [CrossRef]
- Matthews, J.D. Silvicultural Systems; Oxford University Press: Oxford, UK, 1991. [Google Scholar]
- Thompson, I.; Mackey, B.; McNulty, S.; Mosseler, A. Forest Resilience, Biodiversity, and Climate Change. In A Synthesis of the Biodiversity/Resilience/Stability Relationship in Forest Ecosystems; Technical Series No. 43; Secretariat of the Convention on Biological Diversity: Montreal, QC, Canada, 2009; 67p. [Google Scholar]
- Knoke, T.; Paul, C.; Gosling, E.; Jarisch, I.; Mohr, J.; Seidl, R. Assessing the economic resilience of different management systems to severe forest disturbance. Environ. Resour. Econ. 2023, 84, 343–381. [Google Scholar] [CrossRef] [PubMed]
- Pukkala, T.; Laiho, O.; Lähde, E. Continuous cover management reduces wind damage. For. Ecol. Manag. 2016, 372, 120–127. [Google Scholar] [CrossRef]
- Pukkala, T. Which type of forest management provides most ecosystem services? For. Ecosyst. 2016, 3, 9. [Google Scholar] [CrossRef]
- Tahvonen, O. Economics of rotation and thinning revisited: The optimality of clearcuts versus continuous cover forestry. For. Policy Econ. 2016, 62, 88–94. [Google Scholar] [CrossRef]
- Tahvonen, O.; Pukkala, T.; Laiho, O.; Lähde, E.; Niinimäki, S. Optimal management of uneven-aged Norway spruce stands. For. Ecol. Manag. 2010, 260, 106–115. [Google Scholar] [CrossRef]
- Andreassen, K.; Øyen, B.H. Economic consequences of three silvicultural methods in uneven-aged mature coastal spruce forests of central Norway. Forestry 2002, 75, 483–488. [Google Scholar] [CrossRef]
- Assmuth, A.; Rämö, J.; Tahvonen, O. Economics of size-structured forestry with carbon storage. Can. J. For. Res. 2018, 48, 11–22. [Google Scholar] [CrossRef]
- Purser, P.; Ó’Tuama, P.; Vítková, L.; Dhubháin, Á.N. Factors affecting the economic assessment of continuous cover forestry compared with rotation based management. Ir. For. 2015, 72, 150–165. [Google Scholar]
- Brown, J.E. Monarchs of the Mist: The Story of Redwood National Park and the Coast Redwoods; Coastal Parks Association: Pyrmont, Australia, 1982. [Google Scholar]
- Earle, C.J. Sequoia sempervirens. The Gymnosperm Database. 2018. Available online: https://www.conifers.org/cu/Sequoia.php (accessed on 22 June 2023).
- Sillett, S.C.; Van Pelt, R.; Carroll, A.L.; Campbell-Spickler, J.; Antoine, M.E. Aboveground biomass dynamics and growth efficiency of Sequoia sempervirens forests. For. Ecol. Manag. 2020, 458, 117740. [Google Scholar] [CrossRef]
- Bain, J.; Nicholas, I. Health. In Best Practice with Farm Forestry Timber Species; Nicholas, I., Ed.; No. 3: Redwoods—NZFFA Electronic Handbook Series No. 3. New Zealand Farm Forestry Associtaion: Wellington, New Zealand, 2008; Available online: https://www.nzffa.org.nz/system/assets/2080/Redwoods_Handbook.pdf (accessed on 22 June 2023).
- Peters, T.; Hardaker, A.; Dauksta, D.; Newman, G.; Lellig, C.; Healey, J. Top Five Alternative Conifer Tree Species in Great Britain: Main Report and Executive Summary. Welsh Government. 2021. Available online: https://woodknowledge.wales/wkw-resource/forestry/top-five-alternative-conifer (accessed on 22 June 2023).
- Brown, I.; Low, C.; McConnochie, R.; Nicholas, I.; Webster, R. Site Selection. In Best Practice with Farm Forestry Timber Species; Nicholas, I., Ed.; No. 3: Redwoods, NZFFA Electronic Handbook Series No. 3. New Zealand Farm Forestry Associtaion: Wellington, New Zealand, 2008; pp. 19–21. Available online: https://www.nzffa.org.nz/system/assets/2080/Redwoods_Handbook.pdf (accessed on 22 June 2023).
- Rapley, S. Redwood in New Zealand. New Zealand J. For. 2018, 63, 29–33. [Google Scholar]
- Jacobs, D.F.; Cole, D.W.; McBride, J.R. Fire history and perpetuation of natural coast redwood ecosystems. J. For. 1985, 83, 494–497. [Google Scholar]
- Stuart, J.D. Fire history of an old-growth forest of Sequoia sempervirens (Taxodiaceae) forest in Humboldt Redwoods State Park, California. Madrono 1987, 34, 128–141. [Google Scholar]
- Olson, D.F.; Roy, D.F.; Walters, G.A. Sequoia sempervirens (D. Don) Endl. Redwood. Silv. North Am. 1990, 1, 541–551. [Google Scholar]
- Knowles, F.B.; Miller, J.T. Introduced Forest Trees in New Zealand: Recognition, Role, and Seed Source; No. 13 The Redwoods. FRI Bulletin No. 124; New Zealand Forest Research Institute: Rotorua, New Zealand, 1993. [Google Scholar]
- Toral, I.; Caru, M.; Herrera, M.A.; Gonzalez, L.; Martin, L.M.; Miranda, J.; Navarro-Cerrillo, R.M. Clones identification of Sequoia sempervirens (D. Don) Endl. in Chile by using PCR-RAPDs technique. J. Zhejiang Univ. 2009, 10, 112–119. [Google Scholar] [CrossRef]
- Arnaud, Y.; Franclet, A.; Tranvan, H.; Jacques, M. Micropropagation and rejuvenation of Sequoia sempervirens (Lamb) Endl: A review. Ann. Des Sci. For. 1993, 50, 273–295. [Google Scholar] [CrossRef]
- Breidenbach, N.; Gailing, O.; Krutovsky, K.V. Genetic structure of coast redwood (Sequoia sempervirens [D. Don] Endl.) populations in and outside of the natural distribution range based on nuclear and chloroplast microsatellite markers. PLoS ONE 2020, 15, e0243556. [Google Scholar] [CrossRef]
- SWP Research Partnership. The Specialty Woods Products Research Partnership. Final Report. 2015–2023. 2023. Available online: https://fgr.nz/documents/download/10702 (accessed on 7 October 2023).
- Watt, M.S.; Kimberley, M.O. Spatial comparisons of carbon sequestration for redwood and radiata pine within New Zealand. For. Ecol. Manag. 2022, 513, 120190. [Google Scholar] [CrossRef]
- Watt, M.S.; Kimberley, M.O.; Rapley, S.; Webster, R. Comparing volume productivity of redwood and radiata pine plantations in New Zealand. For. Ecol. Manag. 2021, 500, 119628. [Google Scholar] [CrossRef]
- NZFOA. New Zealand Forestry Industry, Facts and Figures 2021/2022. New Zealand Plantation Forest Industry. New Zealand Forest Owners Association, Wellington. 2022. Available online: https://www.nzfoa.org.nz/resources/publications/facts-and-figures (accessed on 4 July 2023).
- Bayne, K.; Edwards, P.; Payn, T. Media coverage of recent New Zealand storm events. NZ J. For. 2019, 64, 17. [Google Scholar]
- Jones, A.G.; Cridge, A.; Fraser, S.; Holt, L.; Klinger, S.; McGregor, K.F.; Paul, T.; Payn, T.; Scott, M.B.; Yao, R.T. Transitional forestry in New Zealand: Re-evaluating the design and management of forest systems through the lens of forest purpose. Biol. Rev. 2023. [Google Scholar] [CrossRef]
- Manley, B. Impact of carbon price on the relative profitability of production forestry and permanent forestry for New Zealand plantations. For. Policy Econ. 2023, 156, 103057. [Google Scholar] [CrossRef]
- Watt, M.S.; Kimberley, M.O.; Steer, B.S.C.; Neumann, A. Financial comparison of afforestation using redwood and radiata pine under carbon regimes within New Zealand. Trees For. People 2023, 13, 100422. [Google Scholar] [CrossRef]
- Watt, M.S.; Kimberley, M.O. Financial Comparison of Afforestation Using Redwood and Radiata Pine within New Zealand for Regimes That Derive Value from Timber and Carbon. Forests 2023, 14, 2262. [Google Scholar] [CrossRef]
- ICAP. Emissions Trading Worldwide: Status Report 2023; International Carbon Action Partnership: Berlin, Germany, 2023; Available online: https://icapcarbonaction.com/en/publications/emissions-trading-worldwide-2023-icap-status-report (accessed on 30 November 2023).
- García, O. FOLPI, a forestry-oriented linear programming interpreter. In Proceedings IUFRO Symposium on Forest Management Planning and Managerial Economics, Tokyo, Japan, 15–19 October 1984; Nagumo, H., Ed.; University of Tokyo: Tokyo, Japan, 1984; pp. 293–305. [Google Scholar]
- Cown, D.; Marshall, H.; Silcock, P.; Meason, D. Sawn timber grade recovery from a planted coast redwood stand growing in New Zealand. New Zealand J. For. Sci. 2013, 43, 8. [Google Scholar] [CrossRef]
- Mason, A.J. OpenSolver—An Open Source Add-in to Solve Linear and Integer Progammes in Excel. In Operations Research Proceedings 2011; Klatte, D., Lüthi, H.-J., Schmedders, K., Eds.; Springer: Berlin/Heidelberg, Germany, 2012; pp. 401–406. [Google Scholar]
- Kimberley, M.O.; Watt, M.S. A Novel Approach to Modelling Stand-Level Growth of an Even-Aged Forest Using a Volume Productivity Index with Application to New Zealand-Grown Coast Redwood. Forests 2021, 12, 1155. [Google Scholar] [CrossRef]
- IPCC. Good Practice Guidance for Land Use, Land Use Change and Forestry; Penman, J., Gytarsky, M., Hiraishi, T., Krug, T., Kruger, D., Pipatti, R., Buendia, L., Miwa, K., Ngara, T., Tanabe, K., et al., Eds.; Institute for Global Environmental Strategies (IGES): Kanagawa, Japan, 2003. [Google Scholar]
- R Core Team. R: A Language and Environment for Statistical Computing; R Foundation for Statistical Computing: Vienna, Austria, 2023; Available online: https://www.R-project.org/ (accessed on 2 November 2023).
- Manley, B. Afforestation Economic Modelling. Report Prepared for MPI; University of Canterbury: Canterbury, New Zealand, 2021. Available online: https://www.mpi.govt.nz/dmsdocument/50302-Afforestation-Economic-Modelling-Report (accessed on 22 June 2023).
- Perry, C.; Bloomberg, M.; Evison, D. Economic analysis of a target diameter harvesting system in radiata pine. New Zealand J. For. 2013, 60, 31–37. Available online: https://ir.canterbury.ac.nz/server/api/core/bitstreams/adea2612-91f4-4f72-873b-def815a9e79a/content (accessed on 30 October 2023).
- Ministry for Primary Industries. Managing Exotic Afforestation Incentives: Regulatory Impact Statement. 2022. Available online: https://www.mpi.govt.nz/dmsdocument/53992-Managing-Permanent-Exotic-Afforestation-Incentives-Regulatory-Impact-Statement (accessed on 22 June 2023).
- Climate Change Commission. Ināia Tonu Nei: A Low Emissions Future for Aotearoa. 2021. Available online: https://www.climatecommission.govt.nz/our-work/advice-to-government-topic/inaia-tonu-nei-a-low-emissions-future-for-aotearoa/ (accessed on 22 June 2023).
- Pukkala, T.; Lahde, E.; Laiho, O. Optimizing the structure and management of uneven-sized stands of Finland. Forestry 2010, 83, 129–142. [Google Scholar] [CrossRef]
- Orois, S.a.S.; Chang, S.J.; von Gadow, K. Optimal residual growing stock and cutting cycle in mixed uneven-aged maritime pine stands in Northwestern Spain. For. Policy Econ. 2004, 6, 145–152. [Google Scholar] [CrossRef]
- Bates, C.G.; Roeser, J. Light intensities required for growth of coniferous seedlings. Am. J. Bot. 1928, 15, 185–194. [Google Scholar] [CrossRef]
- Roy, D.F. Silvical Characteristics of Redwood (Sequoia sempervirens D. Don Endl.); Res. Paper PSW-RP-28; Pacific Southwest Forest & Range Experiment Station Forest Service, U.S. Department of Agriculture: Berkeley, CA, USA, 1966; 20p. [Google Scholar]
- Boldenow, R.W.; McBride, J.R. Redwood Seedling Responses to Light Patterns and Intensities; General Technical Report PSW-GTR-258; U.S. Department of Agriculture, Forest Service, Pacific Southwest Research Station: Albany, CA, USA, 2016. [Google Scholar]
- Jameson, M.J.; Robards, T.A. Coast redwood regeneration survival and growth in Mendocino County, California. West. J. Appl. For. 2007, 22, 171–175. [Google Scholar] [CrossRef]
- O’Hara, K.L.; Stancioiu, P.T.; Spencer, M.A. Understory stump sprout development under variable canopy density and leaf area in coast redwood. For. Ecol. Manag. 2007, 244, 76–85. [Google Scholar] [CrossRef]
- O’Hara, K.L.; Berrill, J.-P. Dynamics of coast redwood sprout clump development in variable light environments. J. For. Res. 2010, 15, 131–139. [Google Scholar] [CrossRef]
- Beaudet, M.; Harvey, B.D.; Messier, C.; Coates, K.D.; Poulin, J.; Kneeshaw, D.D.; Brais, S.; Bergeron, Y. Managing understory light conditions in boreal mixedwoods through variation in the intensity and spatial pattern of harvest: A modelling approach. For. Ecol. Manag. 2011, 261, 84–94. [Google Scholar] [CrossRef]
- Knoke, T.; Plusczyk, N. On economic consequences of transformation of a spruce (Picea abies (L.) Karst.) dominated stand from regular into irregular age structure. For. Ecol. Manag. 2001, 151, 163–179. [Google Scholar] [CrossRef]
- Weaver, S. Carbon economics of natural regeneration at scale. New Zealand J. For. 2023, 67, 35–47. [Google Scholar]
- Manley, B. Trends in discount rates used for forest valuation in New Zealand. New Zealand J. For. Sci. 2019, 49. [Google Scholar]
- Ramírez-Martínez, A.; Gonzalez-Guillen, M.d.J.; De Los Santos-Posadas, H.M.; Ángeles-Pérez, G.; Santiago-García, W. Forest management with carbon scenarios in the central region of Mexico. iforest-Biogeosciences For. 2021, 14, 413. [Google Scholar] [CrossRef]
- Kula, E.; Gunalay, Y. Carbon sequestration, optimum forest rotation and their environmental impact. Environ. Impact Assess. Rev. 2012, 37, 18–22. [Google Scholar] [CrossRef]
- Ekholm, T. Optimal forest rotation under carbon pricing and forest damage risk. For. Policy Econ. 2020, 115, 102131. [Google Scholar] [CrossRef]
- Hou, G.; Delang, C.O.; Lu, X.; Olschewski, R. Optimizing rotation periods of forest plantations: The effects of carbon accounting regimes. For. Policy Econ. 2020, 118, 102263. [Google Scholar] [CrossRef]
- Diaz-Balteiro, L.; Rodriguez, L.C.E. Optimal rotations on Eucalyptus plantations including carbon sequestration—A comparison of results in Brazil and Spain. For. Ecol. Manag. 2006, 229, 247–258. [Google Scholar] [CrossRef]
- Bateman, I.J.; Lovett, A.A. Estimating and valuing the carbon sequestered in softwood and hardwood trees, timber products and forest soils in Wales. J. Environ. Manag. 2000, 60, 301–323. [Google Scholar] [CrossRef]
- Stavins, R.; Richards, K. The cost of U.S. forest-based carbon sequestration. Pew Center on Global Climate Change, Arlington, VA, US. 2005, 52p. Available online: https://www.c2es.org/wp-content/uploads/2005/01/cost-us-forest-based-carbon-sequestration.pdf (accessed on 3 December 2023).
- Foltyn-Zarychta, M.; Buła, R.; Pera, K. Discounting for energy transition policies—Estimation of the social discount rate for Poland. Energies 2021, 14, 741. [Google Scholar] [CrossRef]
- Freeman, M.C.; Groom, B. How certain are we about the certainty-equivalent long term social discount rate? J. Environ. Econ. Manag. 2016, 79, 152–168. [Google Scholar] [CrossRef]
- Davies, O.; Kerr, G. Comparing the costs and revenues of transformation to continuous cover forestry for sitka spruce in Great Britain. Forests 2015, 6, 2424–2449. [Google Scholar] [CrossRef]
- Burdon, R.D. Is coast redwood an answer to the Mangatu problem? New Zealand J. For. 1975, 20, 148–152. [Google Scholar]
- Phillips, C.J.; Marden, M.; Lambie, S.; Watson, A.; Ross, C.; Fraser, S. Observations of below-ground characteristics of young redwood trees (Sequoia sempervirens) from two sites in New Zealand–implications for erosion control. Plant Soil 2013, 363, 33–48. [Google Scholar] [CrossRef]
- Marden, M. The tolerance of Sequoia sempervirens to sedimentation, East Coast region, New Zealand. New Zealand For. 1993, 38, 22–24. [Google Scholar]
- Garrett, L.G.; Clinton, P.W. Erosion mitigation and carbon. In Coast Redwood (Sequoia sempervirens) Development Plan; Scion (New Zealand Forest Research Institute Limited): Rotorua, New Zealand, 2013; Available online: https://www.researchgate.net/publication/327634451_New_Zealand%27s_Coast_Redwood_Forestry_Development_Plan (accessed on 4 August 2023).


Disclaimer/Publisher’s Note: The statements, opinions and data contained in all publications are solely those of the individual author(s) and contributor(s) and not of MDPI and/or the editor(s). MDPI and/or the editor(s) disclaim responsibility for any injury to people or property resulting from any ideas, methods, instructions or products referred to in the content. |
© 2024 by the authors. Licensee MDPI, Basel, Switzerland. This article is an open access article distributed under the terms and conditions of the Creative Commons Attribution (CC BY) license (https://creativecommons.org/licenses/by/4.0/).