Article

Waterlogging Hardening Effect on Transplant Stress Tolerance in Pinus densiflora

1
Department of Forest Bioresources, National Institute of Forest Science, Suwon 16631, Republic of Korea
2
Department of Agriculture, Forestry and Bioresources, College of Agriculture and Life Sciences, Seoul National University, Seoul 08826, Republic of Korea
3
Interdisciplinary Program in Agricultural and Forest Meteorology, College of Agriculture and Life Sciences, Seoul National University, Seoul 08826, Republic of Korea
4
Department of Botany and Plant Sciences, University of California, Riverside, CA 92521-0124, USA
5
Division of Basic Research, National Institute of Ecology, Maseo-Myeon 33657, Republic of Korea
6
Research Institute of Agriculture and Life Sciences, College of Agriculture and Life Sciences, Seoul National University, Seoul 08826, Republic of Korea
7
National Center for Agro Meteorology, Seoul 08826, Republic of Korea
*
Authors to whom correspondence should be addressed.
Forests 2024, 15(3), 445; https://doi.org/10.3390/f15030445
Submission received: 10 January 2024 / Revised: 16 February 2024 / Accepted: 21 February 2024 / Published: 26 February 2024

Abstract

:
Waterlogging induces oxidative damage by accumulation of reactive oxygen species due to stomatal closure. Plants alter their physiological and molecular mechanisms to reduce and adapt to oxidative stress. This mechanism of adaptation to stress, known as hardening, can support future stress tolerance. Pinus densiflora seedlings were grown under waterlogging treatment for three years and then transplanted to another site to identify the waterlogging hardening effect on transplanting. Transcriptome analysis was conducted before and after transplanting, and physiological factors were measured after transplanting. After transplanting, wounding stress is the main cause of transplant stress, and 13 genes related to phenylpropanoid were upregulated for the recovery of wounded roots in waterlogged hardened seedlings. The leaf starch and soluble sugar content of the waterlogged hardened seedlings were 50.3% and 40.5% lower due to the formation of cell walls. However, auxin-related genes were downregulated in waterlogging hardened seedlings, resulting in a lower tendency for height growth in hardened waterlogged seedlings. Waterlogging hardening mitigated transplant stress by wounding more than non-hardening, whereas waterlogging hardening may negatively affect seedling height. Our study provides evidence for the hardening effect of long-term waterlogging on transplanted P. densiflora seedlings.

1. Introduction

Flooding and waterlogging are environmental stressors that trigger reductions in crop production and biomass accumulation in trees worldwide [1,2,3,4]. Globally, a total of 93,319 ha and 1.6 million tons of crops were damaged by flooding between 2003 and 2013 [5]. In the case of cotton (Gossypium hirsutum L.), waterlogging stress reduced the yield from 10% to 40% [6,7]. In Texas, sudden vegetation dieback, including five succulent and graminoid species, occurs because of extreme precipitation events, during which many areas receive more than 1000 mm of precipitation over a four-day period [8].
The cause of reduced plant productivity and plant death is triggered by the reduction in stomatal conductance [9]. Low O2 (oxygen) levels in submerged roots decrease ATP synthesis and leaf stomatal conductance [10,11]. Decreased stomatal conductance results in reduced transpiration, photosynthesis, and respiration [2,12], leading to internal water and nutrient deficits [13]. Decreased stomatal conductance also leads to the accumulation of reactive oxygen species (ROS), resulting in membrane damage and lipid peroxidation under anoxic conditions [14,15].
Phytohormones play a crucial role in physiological mechanisms [16,17]. Phytohormones play important roles in waterlogging stress [18] such as jasmonic acid (JA) which regulates waterlogging stress by inducing antioxidants to scavenge ROS [19,20]. In the case of abscisic acid (ABA), the effect of ABA on waterlogging tolerance has been contradictory. Under waterlogging stress, increased ABA in overexpressing plants led to an increase in the antioxidant system and reduced oxidative damage under waterlogging stress in cotton [21,22] and wheat [23]. In contrast, a waterlogging-resistant line showed reduced ABA content in soybeans [24]. Ethylene and auxins induced adventitious root formation, aerenchyma formation, and shoot growth to adapt to flooding stress [25,26]. In addition to adventitious root formation, high stomatal conductance is a key indicator of tolerance to flooding stress by reducing the accumulation of ROS [27,28]. The flood-tolerant species Zea mays and Vicia faba (bean) maintain photosynthesis rate and high stomatal conductance under flooding stress, whereas Phaseolus vulgaris and Pisum sativum have reduced stomatal conductance and photosynthesis rate [27]. These adaptation processes may constitute stress memories and affect subsequent stress tolerance by modulating metabolism, morphological characteristics, and gene expression [29].
Stress tolerance is improved by an adaptation process to prior stress exposure called “hardening” [30,31]. Hardening enhances tolerance to various abiotic stresses, such as drought [32,33,34], chilling [35,36], and salinity [37]. Previous studies have reported that waterlogging hardening can alleviate the loss of production in wheat [38]. Waterlogged wheat has higher chlorophyll content and photosynthetic rate than non-hardened wheat [38]. Waterlogging reduces oxidative damage and yield loss in soybeans (Glycine max) under continuous waterlogging stress [39]. Abiotic stress hardening can induce cross-stress tolerance to subsequent stresses [40,41,42].
Cross-stress tolerance is induced by prior moderate stress, which stimulates common defenses against different stresses [41]. In trees, it is important to pretreat hardening under nursery conditions to improve cross-stress tolerance [43,44]. Transplant stress negatively affects plant growth and survival when seedlings are transferred to other environments [45]. Transplant stress is manifested by various symptoms, such as a reduced growth rate in newly planted seedlings compared to naturally regenerating seedlings of the same age. Under severe conditions, it can also result in leaf abscission and mortality [46]. Transplant stress is linked to the acclimatization process of seedlings to the new environmental conditions. For low-temperature conditions, tree seedlings are susceptible to cold stress because the seedlings are not be acclimated to the low temperatures [45]. Transplant stress mainly arises from root system loss during the transplantation process, which limits water and nutrient uptake due to root pruning, and shares common responses with drought and waterlogging stress [45,47]. Nursery management is necessary to improve stress tolerance. However, few studies have been conducted on the hardening effect of transplanting stress in trees [48].
Here, to understand the transcriptional response to waterlogging and transplant stress and to identify stress tolerance after waterlogging hardening, we analyzed transcriptional responses of the conifer species P. densiflora. P. densiflora Siebold and Zucc., a gymnosperm species commonly known as Korean red pine, is widely distributed in East Asia [49]. This species occupies more than 22% of Korean forests [50]. Mass dieback of P. densiflora due to drought stress has been documented in South Korea from 2008 to 2017 [51,52].
Trees were grown for three years under two different water availabilities: control (100% natural precipitation; C) and waterlogging (30% additional irrigation; W). After three years of waterlogging, trees were transplanted to another site to study the waterlogging hardening effect. To investigate the effects of waterlogging hardening on transplant stress tolerance, transcriptome analysis was performed after transplanting. This study aimed to (i) determine whether waterlogging stress improves stress tolerance after transplanting, (ii) identify transplant stress-tolerance genes and pathways after waterlogging hardening, and (iii) identify physiological changes after waterlogging stress and transplanting.

2. Materials and Methods

2.1. Experiment Sites and Plant Materials

Waterlogging hardening was conducted for 3 years at Mt. Jiri (127°27′09.8″ N 35°17′09.3″, elevation 282 m a.s.l) in Gurye, South Jeolla Province, Republic of Korea (April 2018 to October 2020). The waterlogged experimental site consisted of two treatments: control (C) and waterlogged treatment (W). In the C treatment, plants were grown under natural precipitation, whereas in the W treatment, irrigation was supplemented with sprinklers. A total of 48 sprinklers were installed at 3 m height and a 70 cm interval. Additional irrigation was performed as follows: If the weekly precipitation was lower than the 20-year average precipitation from 1997 to 2017, additional irrigation was applied [53]. Irrigation was not added in the case of precipitation higher than the 20-year average precipitation of the weekly precipitation.
Soil temperature was measured using soil temperature sensors (HOBO S-TMB-M002; Onset Computer Corporation, Bourne, MA USA), and 30 sensors (15 per treatment) were placed at a depth of 20 cm. The soil water content of the top 30 cm was recorded using a soil moisture sensor (%, CS-616, Campbell Scientific Inc., Logan, UT, USA; 12 in each treatment) at a 15 s interval and averaged for 30 min. Soil moisture data were collected from the HOBO stations (HOBO RX3000; Onset Computer Corporation) in each plot.
A total of 24 three-year-old P. densiflora seedlings were transplanted to each treatment in April 2018. Each treatment consisted of three cells (each cell 1.5 m × 1.5 m) and four seedlings were transplanted in each cell at an 80 cm distance between seedlings. The soil texture was sandy clay loam with a pH of 6.5. Additional details and environmental variables of the site were provided by Bhusal et al. [53].
The seedlings grown at C and W were transplanted after root pruning at Mt. Taehwa in central Korea (E 127°18′38.1″ N 37°18′46.6″, 137 m a.s.l) in October 2020. The transplant experimental site consisted of four cells (1.0 m × 3.0 m, 2 cells per treatment). Each cell consisted of three seedlings at a 1.0 m distance between seedlings. Seedlings were categorized based on their growth conditions until 2020 (C: TC and W: TW). The trees grown under the same treatment conditions were then transplanted into the same cells. During transplanting, shoot pruning was conducted to prevent transpiration and water loss on the same day. The soil moisture data were recorded by HOBO stations (HOBO RX3000; Onset Computer Corporation) at 15 s interval and averaged over 30 min. Two soil moisture sensors were installed in the top 10 cm of horizon A after the organic layer was removed in December 2020. Soil biochemical analyses were performed using an Elemental Analyzer (Flash EA 1112; Thermo Electron, Waltham, MA, USA) at the National Instrumentation Center for Environmental Management (NICEM), Seoul National University.
Leaf samples were harvested between 8:00 and 10:00 a.m. from three replicate trees for transcriptomic analyses in August 2020 and 2021. All the collected samples were immediately placed in liquid nitrogen.

2.2. Growth

After transplanting, the root collar diameter and height were measured in March and October 2021. The height and root collar diameter were measured using a height rod and digital calipers (Mitutoyo Vernier calipers, 100 mm, Mitutoyo, Japan), respectively.

2.3. Leaf Gas Exchange Measurement Growth

Leaf gas exchange measurements were conducted on six seedlings from each treatment between 08:00 a.m. and 13:00 p.m. in August 2021. The net photosynthetic rate (Pmax), stomatal conductance (gs), and transpiration rate were measured from 10 needles of each seedling using a portable infrared (IR) gas analyzer (LI-6400; LI-COR, Lincoln, NE, USA). The fixed factors of photosynthetic measurement were as follows: CO2 concentration (ambient CO2 concentration: 400 µmol mol−1), temperature (25 °C), photosynthetic photon flux density (PPFD) (1400 µmol m−2 s−1), relative humidity (RH; 50%–60%), and airflow rate (500 µmol s−1). Instantaneous water use efficiency (WUE) was calculated as Pmax divided by the transpiration rate [54]. The projected leaf area of the measurement chamber was measured to recalculate the gas exchange variables considering leaf area. Afterwards, the needles were fully collected in a 15 mL tube and immediately placed in a liquid nitrogen tank for analysis of nonstructural carbohydrates (NSCs), proline, and chlorophyll content.

2.4. Leaf Nonstructural Carbohydrates Content

Leaf NSCs were analyzed by measuring soluble sugars and starch, following the method of Newell et al. [55]. Fifteen milligrams of P. densiflora needles was dried for 72 h at 70 °C. The dried samples were ground with two 5 mm beads using a homogenizer (FastPrep-24; MP Biomedicals, Solon, OH, USA). The ground samples were added to 1.5 mL of 80% (v/v) ethanol, and the mixture was incubated in a water bath at 80 °C for 30 min. The mixture was centrifuged at 14,000× g at 15 °C for 10 min. Soluble sugar content was measured at 490 nm using a spectrometer (Optizen 2120UV; KLAB, Daejeon, Republic of Korea) following the phenol–sulfuric acid colorimetric method [56]. After soluble sugar extraction, the remaining pellets were dried to measure the starch content. Each pellet was added to 2.5 mL sodium acetate buffer (0.2 M), and the mixture was incubated at 100 °C for 1 h in a water bath. Afterwards, 2 mL sodium acetate buffer and 1 mL amyloglucosidase (0.5% (w/w); Sigma A9229-1G; Sigma-Aldrich Corp., St. Louis, MO, USA) were added to the mixture and incubated at 55 °C overnight. After centrifugation for 10 min at 15 °C at 14,000× g, the supernatant was moved into another tube to quantify starch content. Starch content was determined colorimetrically at 490 nm using the phenol–sulfuric acid colorimetric method.

2.5. Proline Content

Fresh 0.1 g needles at −80 °C were used for proline extraction according to the method of Ábrahám et al. [57]. The samples were ground with a single 5 mm bead using a homogenizer (FastPrep-24; MP Biomedicals). The ground samples were added in 3 mL of 3% (w/v) sulfosalicylic acid at 4 °C. The mixture was centrifuged at 14,000× g at 4 °C for 5 min and incubated at 90 °C for 5 min. Next, 2 mL supernatant was mixed with 2 mL of acidic ninhydrin (ninhydrin 1% (w/v) in acetic acid 60% (v/v), ethanol 20% (v/v)), 1 mL of glacial acetic acid, and 2 mL of 6 M orthophosphoric acid. The mixture was maintained at 100 °C for 1 h. The mixture was transferred to an ice bath to stop the reaction. Toluene was added to the mixture and incubated at 15 °C for 5 min. The proline content was determined colorimetrically at 520 nm using a spectrometer (Optizen 2120UV; KLAB, Republic of Korea).

2.6. Total Chlorophyll Content

Total chlorophyll content was measured using the dimethyl sulfoxide (DMSO) method [58]. Fresh 0.2 g needles in 5 mL DMSO were incubated at 65 °C for 6 h. The chlorophyll content was measured at 649 nm and 665 nm using a spectrophotometer (Optizen 2120UV; KLAB, Republic of Korea). Total chlorophyll content was calculated using the following equation (Wellburn [59]):
Total chlorophyll content (μg·mL−1) = 21.44 A649 + 5.97 A665

2.7. Statistical Analysis

Two-way repeated-measures ANOVA was performed for height and root collar diameter with the fixed factor “treatment” and the random factor “year.” An independent t-test was used to identify the effects of waterlogging hardening on plant height, root collar diameter growth, Pmax, gs, WUE, NSC, proline, and chlorophyll. All statistical analyses were conducted using R v. 4.0.3 (R Core Team, Vienna, Austria).

2.8. RNA Extraction and Sequencing

Total RNA was extracted from about 40 mg needles from 6 replicate trees using the Ribospin™ Plant kit (GeneAll, Seoul, Republic of Korea). The extracted RNA was analyzed using Macrogen (Seoul, Republic of Korea) for library construction and sequencing. The RNA integrity number (RIN) was evaluated using a Bioanalyzer RNA Pico 6000 chip, and the samples with an RIN higher than seven were used for the cDNA library construction. The cDNA library (paired-end nondirectional, 2 × 101 bp) was constructed using a TruSeq Standard mRNA Library Prep Kit and sequenced using an Illumina NovaSeq 6000 system (Macrogen, Seoul, Republic of Korea).

2.9. Transcriptome Analysis: De Novo Assembly and Differential Expression Analysis

Raw read data were filtered using Prinseq-lite version 0.20.4 [60]. Clean reads were assembled de novo (Trinity v.2.13.2) [61]. To find the candidate coding regions of the assembled transcripts, Transdecoder v.5.5.0 was used with default parameters [62]. CD-HIT-EST v.4.8.1 was used to cluster transcripts (similarity 95%) [63]. To assess the quality of the assembled transcriptome, Benchmarking Universal Single Copy-Orthologs (BUSCO, v.3) was used with the Embryophyta_odb10 database [64].
Salmon v.1.8.0 was used to map clean reads to the assembled transcriptome in an alignment-based mode [65]. After mapping, DESeq2 v.1.34.0 was applied to normalize the read counts and compare differentially expressed genes (DEGs) between treatments [66] with lower than 0.05 of a false-discovery rate (FDR)-adjusted p-value and |log2 fold change (log2 FC)| > 1 parameters.

2.10. Functional Analysis and MapMan Analysis

The Basic Local Alignment Search Tool for proteins (BLASTX) was used to compare the sequences against those of Arabidopsis thaliana (A. thaliana) using an e-value threshold of 1 × 10⁻⁷ to reveal gene functional annotations [67]. The PANTHER gene ontology (GO) classification system was used to identify cellular components, molecular functions, and biological processes using Fisher’s exact test with FDR < 0.05; http://www.geneontology.org [68]. Transcription factors (TFs) of A. thaliana in the Plant Transcription Factor Database v4.0 (http://planttfdb.cbi.pku.edu.cn/) were used as references to identify TFs families of P. densiflora [69,70]. Pathway analysis of DEGs was conducted using MapMan v. 3.5.1R2.

2.11. Quantitative Real-Time (qRT)-PCR Validation

RNA extraction was performed using the Ribospin™ Plant kit (GeneAll, Seoul, Republic of Korea). The extracted RNA was used to synthesize cDNA using an iScriptTM cDNA synthesis kit (Bio-Rad, Hercules, CA, USA). Primers for the 10 genes were designed using Primer3 (https://www.bioinformatics.nl/cgi-bin/primer3plus/primer3plus.cgi, accessed on 10 October 2022) (Table S1). The reference gene F-box was used for gene expression normalization [71]. Each mixture for qRT-PCR contained 10 μL of mastermix (IQ Sybr Green SuperMix; Biorad, Hercules, CA, USA), 10 μM forward and reverse primer, 1 μL cDNA (50 ng μL−1), and 7 μL DNase/RNase free water. Then, qRT-PCR was performed using CFX96 Touch Real-Time PCR Detection System (Bio-Rad, Hercules, CA, USA) using the following conditions: 95 °C for 2 min, followed by 40 cycles at 95 °C for 10 s, 61 °C for 30 s, and 72 °C for 30 s. qRT-PCR reactions were carried out with three biological replicates. Gene expression was calculated using the 2−ΔΔCt method [72]. Correlation analysis of RNA-seq and qRT-PCR results was performed using R v.4.0.3.

2.12. Data Deposition

All the read data were deposited in the SRA databases as part of project PRJNA944986.

3. Results

3.1. Data Deposition

Waterlogging treatment conditions before transplanting were reported by Bhusal et al. [53]. The annual precipitation in C was 1392, 1495, and 1565 mm, and that in W was 1811, 1891, and 2128 mm in 2018, 2019, and 2020, respectively. The average soil water content in C was 21.54 ± 0.92%, 24.24 ± 0.69%, and 26.69 ± 0.98%, and that in W was 27.48 ± 0.93%, 30.12 ± 0.78%, and 32.95 ± 0.99% in 2018, 2019, and 2020, respectively. After transplanting, the mean temperature and total precipitation were 10.11 ± 0.9 °C and 841 mm from October 2020 to December 2021, respectively (Figure 1A,B). The average of soil moisture was 22.9 ± 0.07% between December 2020 and 2021 (Figure 1C). The soil texture was sandy loam with a pH of 5.2 ± 0.1. Soil organic matter and soil N were 2.74 ± 0.19% and 0.16 ± 0.0%, respectively.

3.2. Assembled Transcriptome Data

A total of 406,823,434 and 368,384,228 raw paired reads were generated in the waterlogging experiment and after transplanting, respectively. We obtained a total of 269,984 transcripts and 134,369 genes after filtering and de novo assembly using the Trinity software v. 2.13.2 (Table 1). GC content was 41.3%, and the contig N50 length was 1501. The total number of assembled bases was 236,105,474. To assess assembly quality, we conducted BUSCO analysis, and 1483 (91.9%) complete BUSCO genes were predicted, with 49 (3.0%) fragmented and 82 (5.1%) missing genes.

3.3. Comparison of Differentially Expressed Genes between Waterlogging and Control Seedlings

With a threshold of FDR < 0.05, and |log2 FC| > 1, 3, 12 DEGs were up- and downregulated in W compared to C, respectively (Figure 2). After transplanting, 232 and 155 DEGs were upregulated and downregulated in TW, respectively, compared to TC. When comparing TC vs. C and TW vs. W, 988 and 1871 DEGs were upregulated, and 611 and 808 DEGs were downregulated, respectively. Among them, two DEGs were commonly regulated between TW vs. TC and W vs. C (Figure 3A). When comparing TW vs. W and TC vs. C to identify transplant stress, 1119 DEGs were commonly expressed (Figure 3B).

3.4. Gene Ontology (GO) Term Classification of Genes Induced by Transplant Stress

Transplant stress, which was expressed as common DEGs between TW and W and TC and C, caused the upregulation of 794 genes that were categorized into 198 biological processes, 49 molecular functions, and 71 cellular components (Table S2). The upregulated biological processes included responses to wounding, mechanical stimuli, bacteria, fungi, osmotic stress, and reactive oxygen species. In particular, cell wall organization, loosening, and modification were the biological processes most significantly upregulated by transplant stress and subsequently resulted in the upregulation of the biosynthesis genes of lignin, glucuronoxylan, cellulose, hemicellulose, galacturonan, and xyloglucan. Similarly, molecular function and cellular components were upregulated in the cell wall-related genes and activities. In addition, defense mechanisms, JA-mediated signaling pathway, phenylpropanoid biosynthesis, and flavonoid metabolism were upregulated after transplanting. In contrast, 303 downregulated genes were identified during transplant stress and were categorized into 72 biological processes, 53 molecular functions, and 46 cellular components (Table S2). Photosynthesis was the most significantly downregulated in biological processes and cellular components; furthermore, photosystem I, light harvesting, carbon fixation, and dark reactions were also downregulated (Table S2). Excluding commonly expressed genes, upregulated genes were associated with 23 GO categories, including various responses to stress, and 17 biological processes were found in downregulated genes when comparing TC and C (Table S3). In the case of TW and W, excluding genes commonly expressed with TC and C, various cell wall organization processes and phenylpropanoid biosynthetic processes were classified under upregulated genes (Table S3). In the same comparisons, 29 biological processes were identified in downregulated genes.

3.5. Gene Ontology (GO) Term Classification of Differentially Expressed Genes between Waterlogging and Control after Transplanting

The effects of waterlogging hardening before and after transplanting were represented as the DEGs of W vs. C and TW vs. TC, respectively. Before transplanting, waterlogging hardening resulted in 3 upregulated and 12 downregulated genes, which were not categorized into GO terms. After transplanting, 233 upregulated genes in TW were categorized into 66 biological processes, 21 molecular functions, and 10 cellular components (Figure 4A). In contrast, 156 genes were downregulated in the TW treatment, and these were categorized into five molecular functions, such as oxidoreductase activity, anion binding, and catalytic activity (Figure 4B).
Upregulated biological processes included stress-tolerance-related processes, such as the biosynthesis of oxylipin, lignin, flavonoids, and phenylpropanoids. In addition, carbohydrate metabolic processes; immune systems; defense responses to fungi and bacteria; and responses to wounding, water deprivation, jasmonic acid, and salicylic acid (SA) were upregulated (Figure 4A). In the phenylpropanoid biosynthesis process, phenylalanine ammonia-lyase 4 (PAL4), UDP-glycosyltransferase 72B1 (UGT72B1), and putative cinnamyl alcohol dehydrogenase 9 (CAD9) were upregulated in TW compared with TC. The upregulated flavonoid biosynthesis processes included dihydroflavonol 4-reductase (DFRA), leucoanthocyanidin dioxygenase (LODX), chalcone-flavanone isomerase 1 (CHI1), and anthocyanidin reductase (BAN) (Table S4). The upregulated molecular functions included ABC-type transporter activity, oxidoreductase activity, quercetin 7-O-glucosyltransferase, quercetin 3-O-glucosyltransferase, UDP-glucosyltransferase, hydrolase activity, and O-glycosyl compound hydrolysis (Figure 4A). The ABC transporter ABCG29 was upregulated in TW compared with TC (Table S4). Among cellular components, the cell wall, chloroplast, and membrane-related genes were upregulated (Figure 4A).

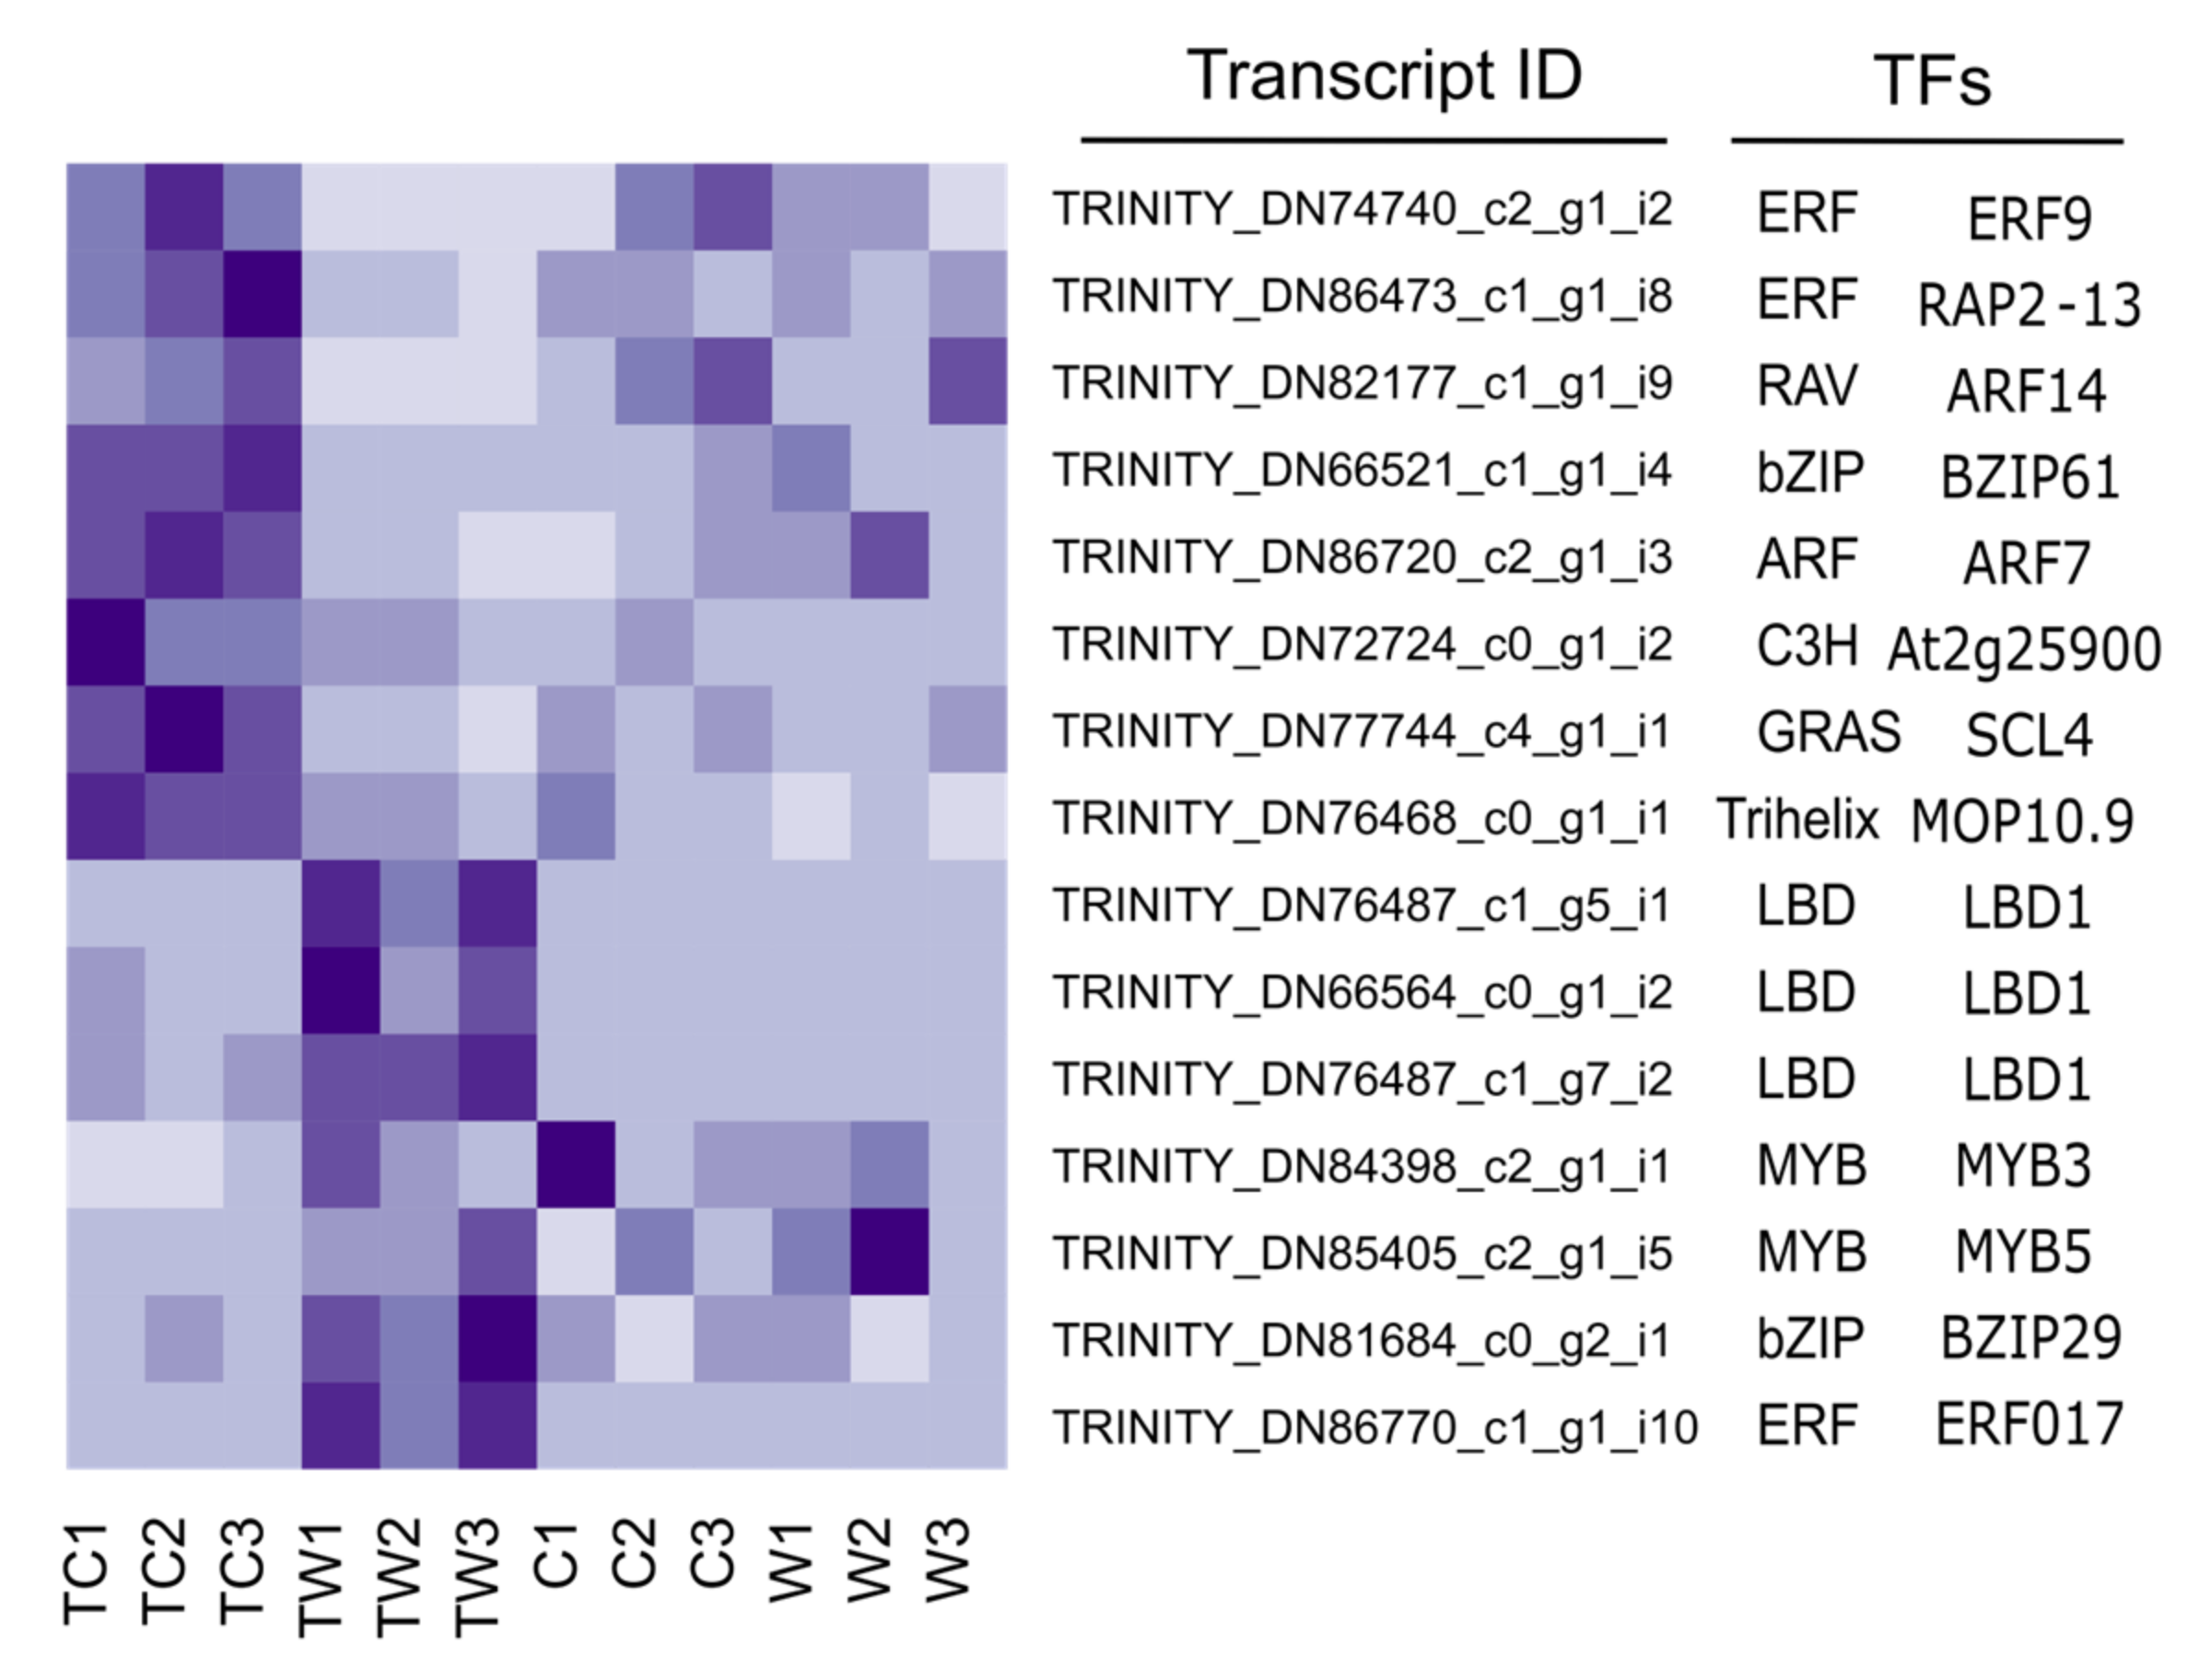
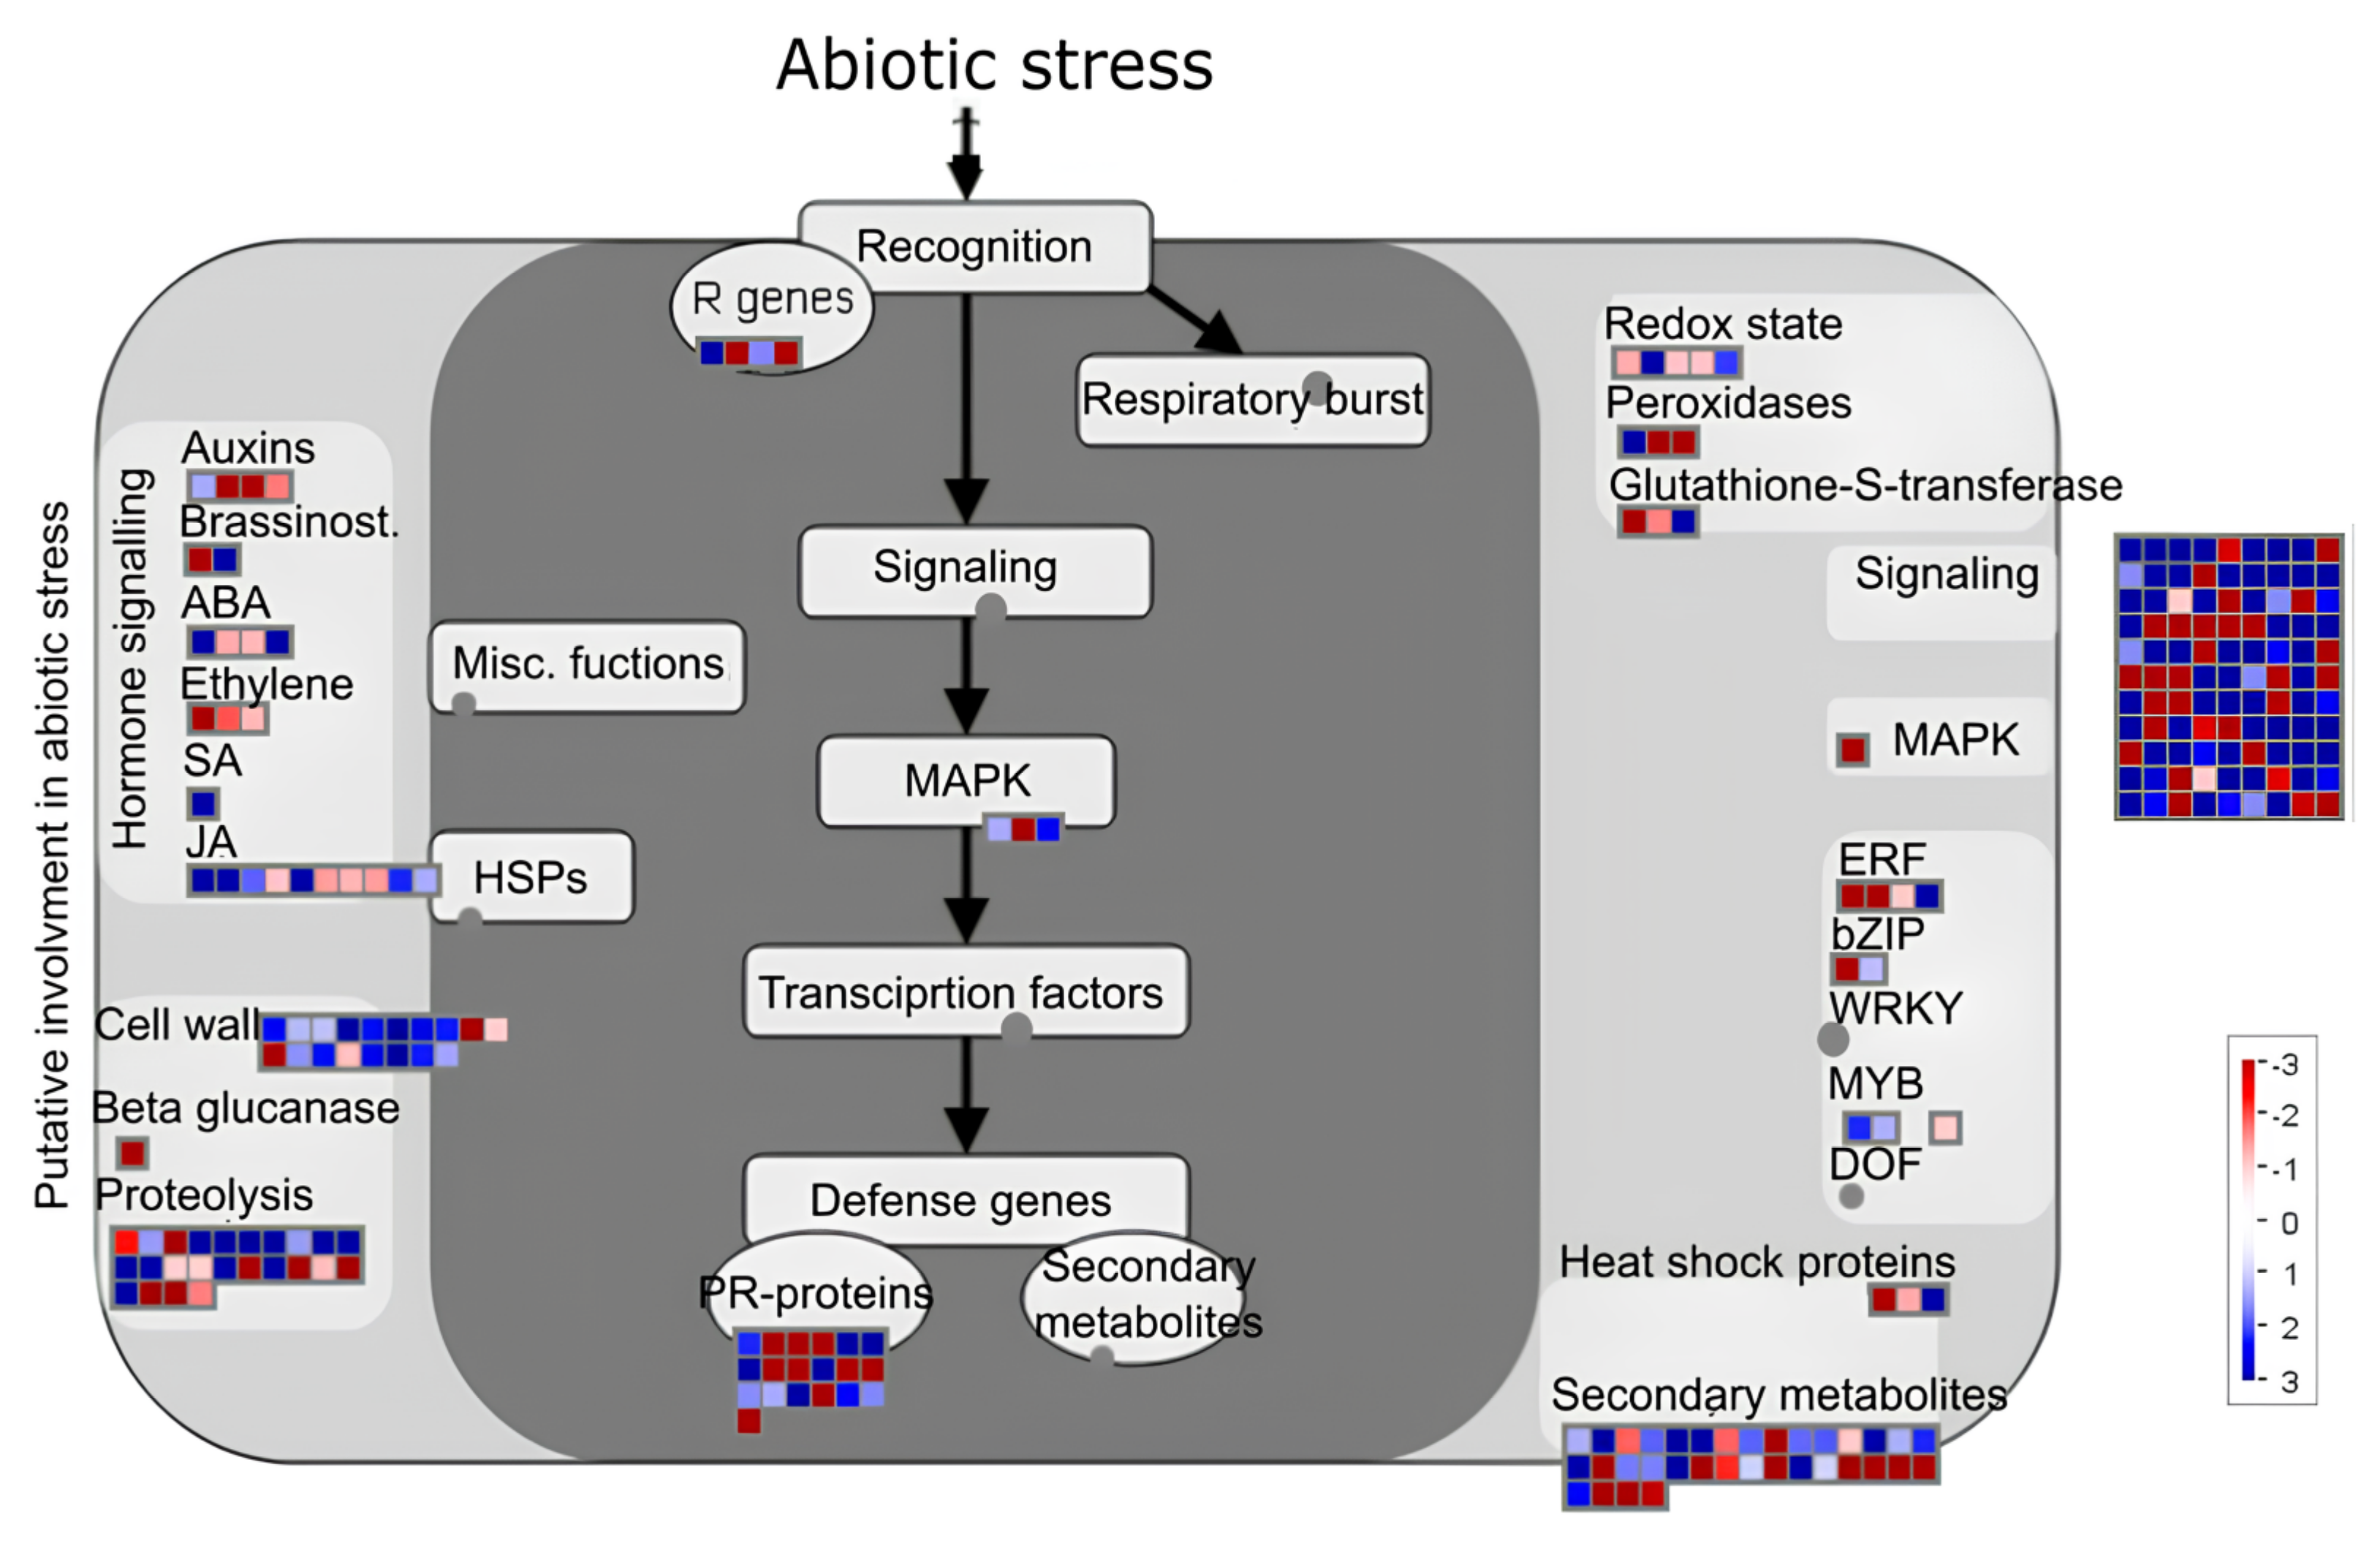
3.6. Transcription Factors and Pathway Analysis after Transplanting

Similar to the GO terms, there were no differentially expressed genes before transplanting (C vs. W). However, eight downregulated and seven upregulated TFs were identified after transplanting (TW vs. TC) (Figure 5). Downregulated TFs in TW included two members of the ethylene-responsive factor (ERF) family (ERF9 and RAP2-13), RAV, basic leucine zipper domain (bZIP), auxin response factor (ARF), C3H, GRAS, and Trihelix. Highly expressed TFs in TW included three members of the lateral organ boundaries domain (LBD) family (LBD1), 2 MYB family (MYB3 and MYB5), bZIP29, and ERF017.
In the MapMan analysis, genes related to the cell wall, JA, mitogen-activated protein kinase (MAPK) signaling, and secondary metabolites were upregulated in TW compared to TC. Jasmonate synthesis–degradation, lipoxygenase, salicylic acid (SA) synthesis–degradation, cell wall proteins, phenylpropanoids, lignin biosynthesis, flavonoids, redox thioredoxin, peroxidase, and glutathione-S-transferase presented a log2 FC value higher than 7. Whereas the Log2 FC value of genes related to auxin, ethylene signal transduction, PR protein, and MAPK was lower than −7 in TW than in TC (Figure 6).

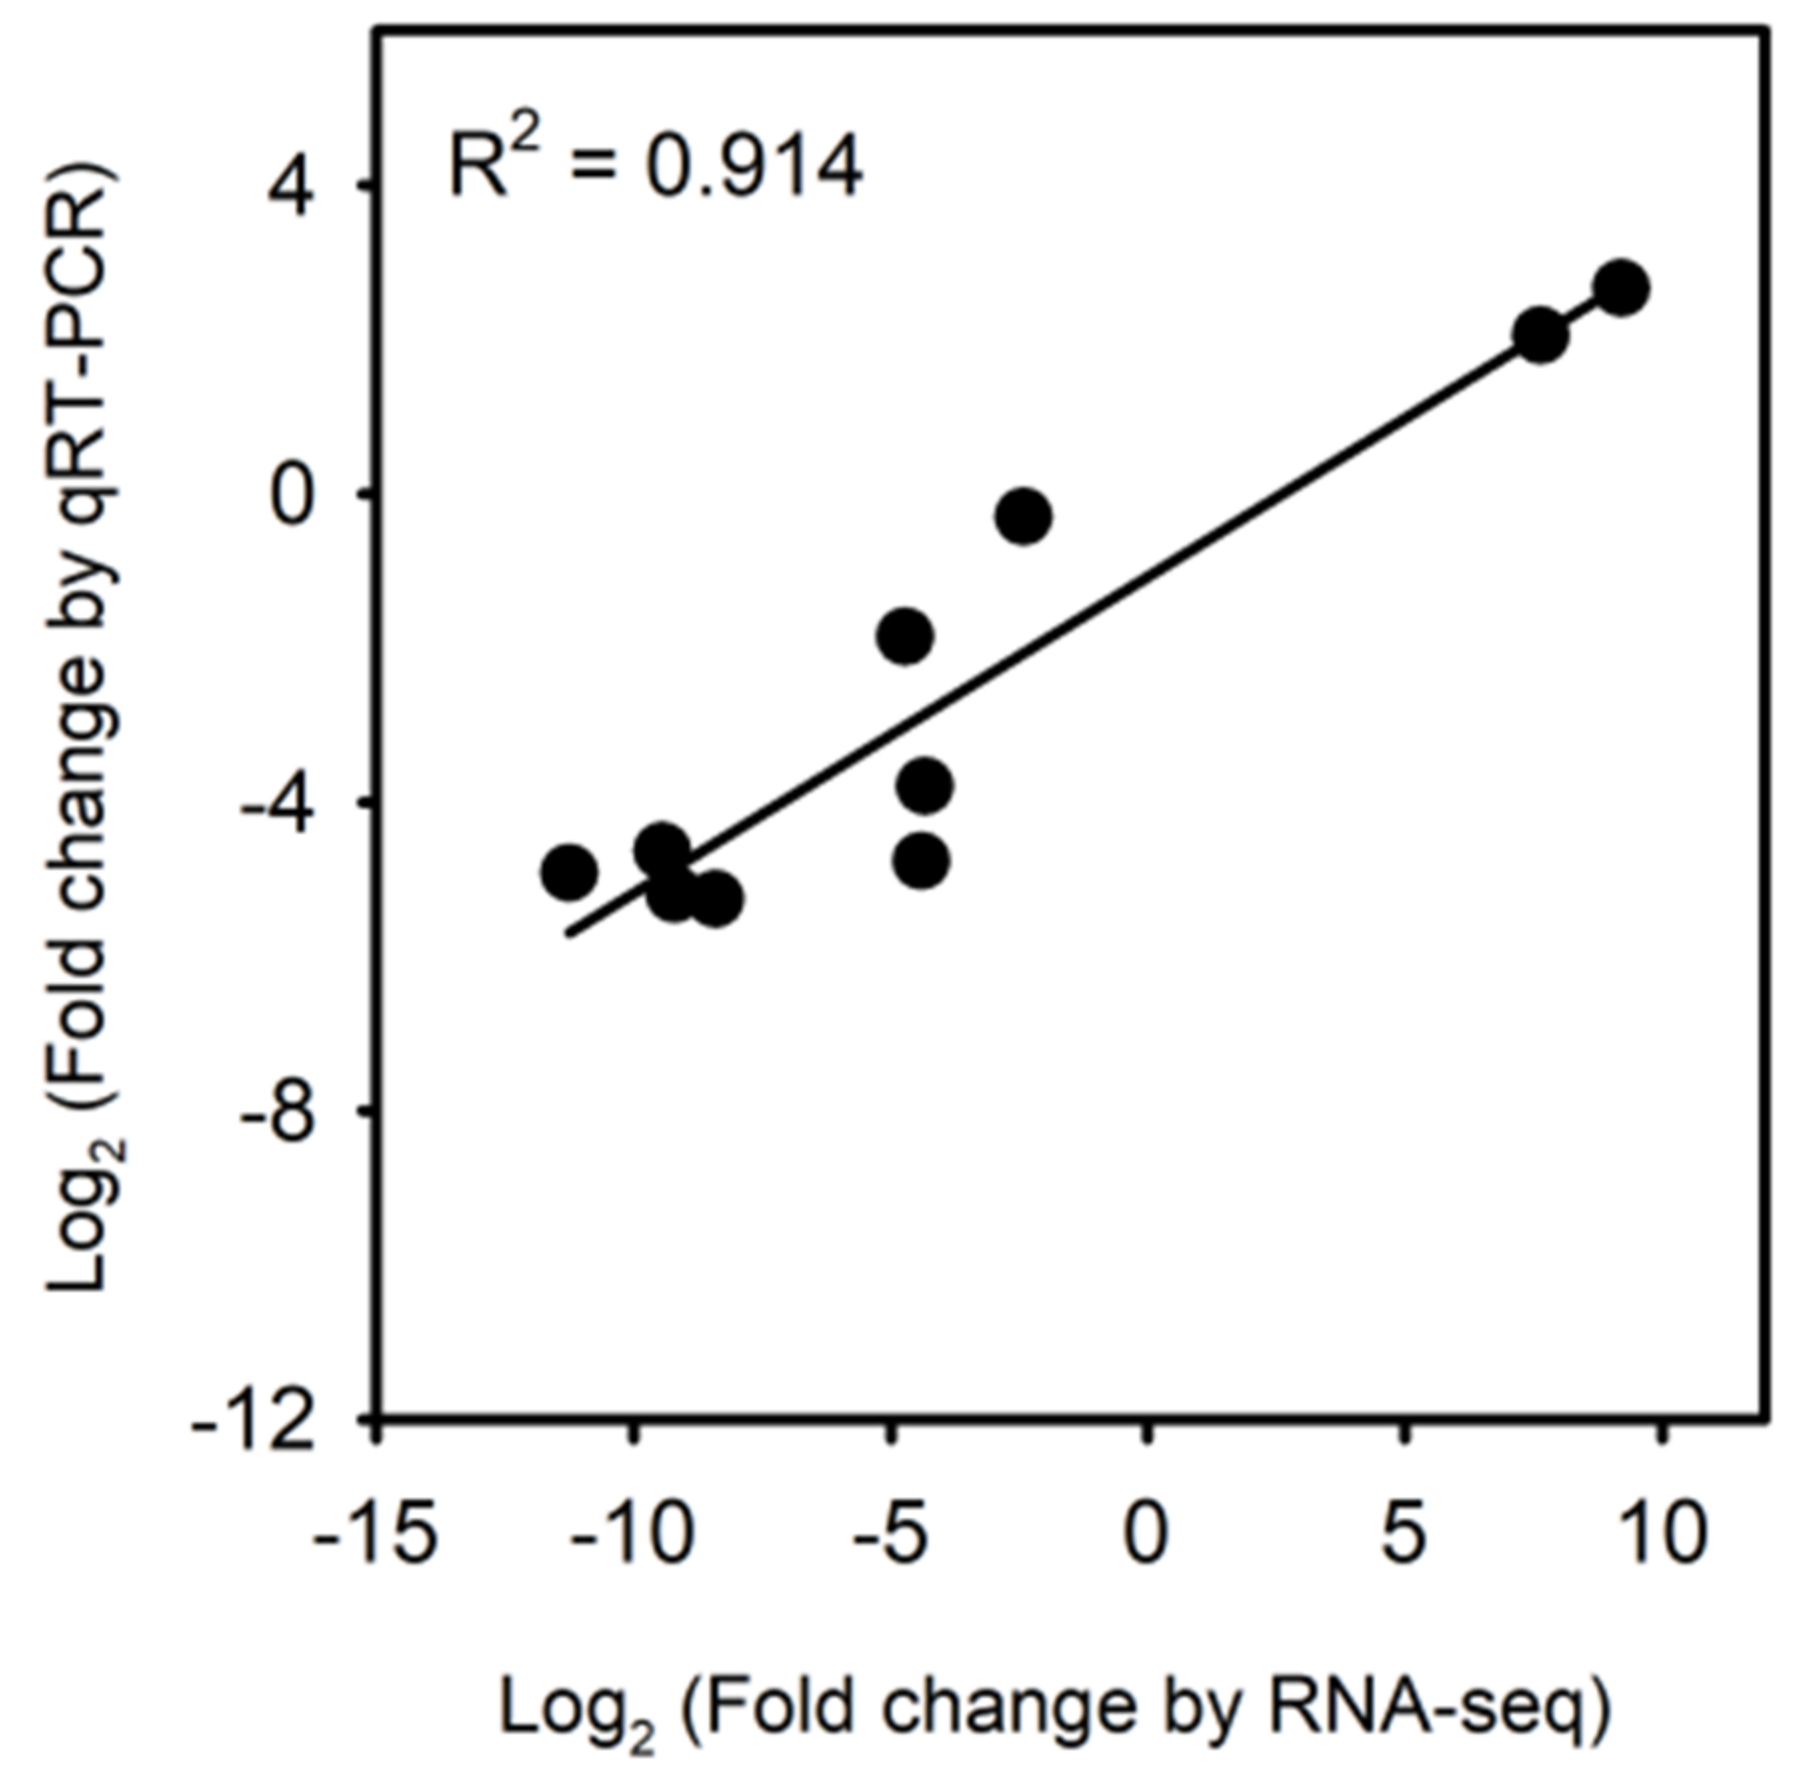
3.7. Validation of RNA-Seq Expression of Waterlogging Hardened Trees in Transplant Stress

To confirm the accuracy of the RNA-seq expression, we compared the qRT-PCR expression of nine genes between TW and TC. Log2 FC values of RNA-seq expression showed a significant correlation with the log2 FC values and qRT-PCR (R2 = 0.914, Figure 7).

3.8. Physiological Response of Waterlogging Hardening after Transplanting

Before transplanting, the photosynthetic rate, leaf water potential, height, and root collar diameter were lower in W than in C for two years [53]; however, the trees transplanted to Taehwa showed no differences in height and root collar diameter in 2020 (Table 2). After transplanting, the height and root collar diameter showed no differences between TW and TC throughout the year. Height growth tended to be lower in TW than in TC; however, the difference was not statistically significant (Table 3). Similar to the morphological characteristics, physiological characteristics showed no differences between TW and TC, except for starch concentration (Table 3). Starch concentration in TW was 50.3% lower than in TC (p = 0.007, Table 3). Similarly, soluble sugars were 40.5% lower in TW compared with TC; however, the difference was not statistically significant. In contrast, Pmax, stomatal conductance, and chlorophyll tended to be higher in TW than in TC, but neither of them was statistically significant.

4. Discussion

4.1. Genes Regulated by Transplant Stress

Transplant stress is defined as a negative effect on growth and mortality after transplanting into different environmental conditions and during the process of recovery [46,73]. Root loss by pruning during transplanting causes a reduction in water and nutrient uptake, which leads to water stress, stomatal closure, and photosynthesis inhibition [45,74]. Our study revealed the upregulation of genes related to the response to wounding and biotic stimuli as a recovery process after root loss by pruning. In addition, photosynthetic genes, including those involved in carbon fixation and light harvesting, were downregulated under transplant stress. Similar to our results, net photosynthesis, stomatal conductance, and transpiration were significantly lower in root-pruned seedlings than in non-pruned seedlings grown on green ash (Fraxinus pennsylvanica Marsh.) and linden trees [75]. Owing to water stress caused by root pruning, trees reduce stomatal conductance and photosynthesis, which leads to the inhibition of shoot elongation. However, transplanted maple trees can recover photosynthesis quickly because of their accelerated root regeneration, which reduces water-deficit stress [76,77]. Therefore, the root regeneration capacity is important for the alleviation of transplant stress.
Our study showed that cell wall-related genes were upregulated. Similar to our results, wounding stress induces callus formation and expression of cell wall biosynthesis and cell cycle genes within 24 h in Arabidopsis thaliana [78]. Additionally, wounding triggers lignin biosynthesis in maize [79]. In contrast, cell wall modification and loosening are important for the defense against pathogens and abiotic stresses to prevent cell wall cleavage by ROS [80,81,82,83,84]. The phenylpropanoid biosynthetic pathway is activated under stressful conditions to scavenge ROS and recover wounded tissues [85,86]. In the present study, the main cause of transplant stress was wound stress caused by root pruning. Transplanted trees showed general wounding and defense responses, such as cell wall modification and biosynthesis of secondary metabolites, to defend themselves against ROS.

4.2. Waterlogging Hardening Effect after Transplanting

In the third waterlogging experimental year, there were no categorized biological processes of either upregulated or downregulated genes in W compared to those in C. Similar to the transcriptome data, at the same site, there were no differences between W and C groups in the third year. In contrast, stomatal conductance and photosynthetic rate decreased, and midday leaf water potential increased in the first and second years [53]. In the same study, P. densiflora exhibited a notable increase of 23.3% in above-ground biomass under waterlogging stress compared to control, indicating its strong resilience to this particular stress condition [53]. Gymnosperms, in general, exhibit greater tolerance to water stress compared to angiosperms. This can be attributed to their lower stomatal sensitivity and the presence of cavitation-resistant xylem [87]. Conifers have xylem composed entirely of tracheids, while angiosperms have both tracheids and wide vessels. Although the presence of wide vessels allows for higher water transport capacity in angiosperms, it also results in a smaller safety margin when it comes to xylem pressures [88]. The probable reason for the lack of response to waterlogging stress is that the total precipitation in the third year in C was 1565 mm, which was higher than that in the first and second years; therefore, C was under mild waterlogging conditions [53].
After transplanting, stress-tolerance-related genes, such as JA, signaling, and secondary metabolites, were more upregulated in TW than in TC. Phenylpropanoid compounds, including lignins, flavonoids, and phenolics, are secondary metabolites induced by JA and play important roles in biotic and abiotic stress tolerance and cell wall organization [85,86]. LBD (lateral organ boundaries domain) proteins are involved in various plant developmental processes [89]. In Arabidopsis roots, overexpression of LBD genes (LBD1, LBD3, LBD4, and LBD11) leads to rapid radial root growth [90]. In Populus, overexpression of PtaLBD1 significantly enhances wood growth by regulating phloem development [91]. In Populus tremula × Populus alba, there was a significant increase in phloem production in transgenic lines as LBD1-overexpressing, when auxin levels were lower in the tissues [91]. Furthermore, MYB TFs induce phenylpropanoid biosynthesis pathway genes, such as PAL, and activate the biosynthesis of lignin and cellulose in Arabidopsis and Populus [92,93,94,95]. Lignins are transported to the cell wall and plasma membrane only by ABCG29 in the ABC transporter [96]. Similar to a previous study, MYB and LBD TFs, UGT72B1, PAL4, and ABCG29, were upregulated in TW compared to TC, whereas auxin-related genes were downregulated in TW. In previous studies, UGT72B1 was found to be crucial for normal cell wall lignification and was expressed in young xylem tissues, and the overexpression of PAL enhanced lignin and stress tolerance [97,98,99,100]. In addition, the degradation of leaf starch in TW showed that the leaf starch was converted to the cell wall and exported to the roots [101]. Decreased NSCs do not always reflect tree death, and NSC mobilization reflects various physiological functions of trees [102,103]. For example, NSC alleviates water stress by increasing below-ground allocation [104,105] and repairing damaged vessels [106,107].
In TW, the biosynthesis of flavonoids, including quercetin 7-O-glucosyltransferase, quercetin 3-O-glucosyltransferase, and UDP-glucosyltransferase, which are other phenylpropanoid compounds involved in increasing antioxidants in wound healing, is upregulated [85,86]. In the stress pathway, antioxidant genes, such as redox thioredoxin, peroxidase, and glutathione-S-transferase, were highly expressed; however, some genes related to antioxidants were downregulated. These results indicate that the phenylpropanoid pathway is reprogrammed to recover damaged tissue by upregulating lignin more than flavonoids [108].
After transplanting, waterlogging hardening enhanced wound recovery and increased cell wall formation and some antioxidants. Previous studies have shown that overexpression of genes-induced phenylpropanoid compounds leads to increased resistance to stresses [109,110,111]. By overexpressing genes involved in the phenylpropanoid pathway or using these genes as markers, it is suggested that the selection of crops or trees with high resistance to both biotic and abiotic stresses can be facilitated. Increased recovery ability by waterlogging hardening effect showed a higher tendency in photosynthesis and stomatal conductance similar to previous studies [27,28,77]. However, waterlogging hardening could have a negative effect on plant height growth due to the degradation of auxins involved in plant height growth [112,113]. Under waterlogged conditions, auxin and ethylene produce adventitious roots that adapt to the waterlogging conditions [25,114]. However, auxins are inactivated due to a decline in adventitious root formation [115].

5. Conclusions

Long-term waterlogging hardening has both positive and negative effects on transplant stress tolerance. After transplanting, the upregulated phenylpropanoid pathway in TW increased lignin biosynthesis for cell wall formation for the recovery of wounded roots. Decreased leaf NSC also showed root recovery ability by converting it into structural carbon and exporting it to the roots. The higher recovery ability due to waterlogging hardening led to a higher tendency for photosynthesis and stomatal conductance in TW. However, the degradation of auxins in TW reduced seedling height during the growing season compared with TC. Our research builds on the first long-term waterlogging hardening effect on transplanting stress. These findings will provide a comprehensive insight into waterlogging hardening effect after transplanting and inform nursery management to mitigate transplant stress. Further long-term molecular and physiological investigation is required to validate the identified candidate gene and waterlogging hardening effect.

Supplementary Materials

The following supporting information can be downloaded at https://www.mdpi.com/article/10.3390/f15030445/s1, Table S1: Primer sequences used to validate RNA-sequencing results of trees grown under waterlogging treatment versus control after transplanting; Table S2: Gene ontology (GO) analysis of transplant stress; Table S3: Description of upregulated secondary metabolites genes under waterlogging hardening after transplanting; Table S4: Description of upregulated secondary metabolites genes under waterlogging hardening after transplanting.

Author Contributions

Writing—original draft preparation, formal analysis, validation, and visualization, S.B.; investigation and data curation, S.K. (Seohyun Kim), J.H., T.K.K., W.H., K.K., H.L., S.K. (Sukyung Kim), C.P., M.L. and N.B.; conceptualization and project administration, A.R.H.; supervision and writing—review and editing, U.C.; writing—review and editing, supervision, and funding acquisition, H.S.K. All authors have read and agreed to the published version of the manuscript.

Funding

This work was supported by the National Research Foundation of Korea (grant number: 2021R1I1A2044159) and the National Institute of Ecology (NIE), funded by the Ministry of Environment (MOE) of the Republic of Korea (NIE-B-2022-02).

Data Availability Statement

The data presented in this study are available upon request from the corresponding author. This manuscript is part of a PhD thesis by the first author, available online at https://www.riss.kr/link?id=T16749632, accessed on 28 February 2023.

Conflicts of Interest

The authors declare no conflicts of interest.

References

  1. Parent, C.; Capelli, N.; Berger, A.; Crèvecoeur, M.; Dat, J.F. An overview of plant responses to soil waterlogging. Plant Stress 2008, 2, 20–27. [Google Scholar]
  2. Muhammad, A.A. Waterlogging stress in plants: A review. Afr. J. Agric. Res. 2012, 7, 1976–1981. [Google Scholar]
  3. Urquhart, G.R. Flood-tolerance and flood-escape mechanisms for seeds and seedlings of common swamp trees of Central America. Trop. Ecol. 2004, 45, 197–208. [Google Scholar]
  4. Onda, Y.; Gomi, T.; Mizugaki, S.; Nonoda, T.; Sidle, R.C. An overview of the field and modelling studies on the effects of forest devastation on flooding and environmental issues. Hydrol. Process. Int. J. 2010, 24, 527–534. [Google Scholar] [CrossRef]
  5. Food and Agriculture Organization. The Impact of Disasters on Agriculture and Food Security; Food and Agriculture Organization: Rome, Italy, 2019. [Google Scholar]
  6. Bange, M.; Milroy, S.; Thongbai, P. Growth and yield of cotton in response to waterlogging. Field Crops Res. 2004, 88, 129–142. [Google Scholar] [CrossRef]
  7. Hodgson, A. The effects of duration, timing and chemical amelioration of short-term waterlogging during furrow irrigation of cotton in a cracking grey clay. Aust. J. Agric. Res. 1982, 33, 1019–1028. [Google Scholar] [CrossRef]
  8. Stagg, C.L.; Osland, M.J.; Moon, J.A.; Feher, L.C.; Laurenzano, C.; Lane, T.C.; Jones, W.R.; Hartley, S.B. Extreme precipitation and flooding contribute to sudden vegetation dieback in a coastal salt marsh. Plants 2021, 10, 1841. [Google Scholar] [CrossRef] [PubMed]
  9. Voesenek, L.A.; Bailey-Serres, J. Flood adaptive traits and processes: An overview. New Phytol. 2015, 206, 57–73. [Google Scholar] [CrossRef]
  10. Rodriguez-Gamir, J.; Ancillo, G.; González-Mas, M.C.; Primo-Millo, E.; Iglesias, D.J.; Forner-Giner, M.A. Root signalling and modulation of stomatal closure in flooded citrus seedlings. Plant Physiol. Biochem. 2011, 49, 636–645. [Google Scholar] [CrossRef]
  11. Drew, M.C. Oxygen deficiency and root metabolism: Injury and acclimation under hypoxia and anoxia. Annu. Rev. Plant Physiol. Plant Mol. Biol. 1997, 48, 223–250. [Google Scholar] [CrossRef]
  12. Bansal, R.; Srivastava, J. Effect of waterlogging on photosynthetic and biochemical parameters in pigeonpea. Russ. J. Plant Physiol. 2015, 62, 322–327. [Google Scholar] [CrossRef]
  13. Folzer, H.; Dat, J.F.; Capelli, N.; Rieffel, D.; Badot, P.-M. Response of sessile oak seedlings (Quercus petraea) to flooding: An integrated study. Tree Physiol. 2006, 26, 759–766. [Google Scholar] [CrossRef] [PubMed]
  14. Yan, B.; Dai, Q.; Liu, X.; Huang, S.; Wang, Z. Flooding-induced membrane damage, lipid oxidation and activated oxygen generation in corn leaves. Plant Soil 1996, 179, 261–268. [Google Scholar] [CrossRef]
  15. Chen, Y.; Chen, X.; Wang, H.; Bao, Y.; Zhang, W. Examination of the leaf proteome during flooding stress and the induction of programmed cell death in maize. Proteome Sci. 2014, 12, 33. [Google Scholar] [CrossRef]
  16. Ahmad, P.; Umar, S.; Sharma, S. Mechanism of free radical scavenging and role of phytohormones in plants under abiotic stresses. In Plant Adaptation Phytoremediation; Springer: Dordrecht, The Netherlands, 2010; pp. 99–118. [Google Scholar]
  17. Alhaithloul, H.A.S.; Abu-Elsaoud, A.M.; Soliman, M.H. Abiotic stress tolerance in crop plants: Role of phytohormones. In Abiotic Stress Plants; IntechOpen: London, UK, 2020; p. 233. [Google Scholar]
  18. Bashar, K.K.; Tareq, M.Z.; Amin, M.R.; Honi, U.; Tahjib-Ul-Arif, M.; Sadat, M.A.; Hossen, Q.M.M. Phytohormone-mediated stomatal response, escape and quiescence strategies in plants under flooding stress. Agronomy 2019, 9, 43. [Google Scholar] [CrossRef]
  19. Kamal, A.H.M.; Komatsu, S. Jasmonic acid induced protein response to biophoton emissions and flooding stress in soybean. J. Proteom. 2016, 133, 33–47. [Google Scholar] [CrossRef]
  20. Raza, A.; Charagh, S.; Zahid, Z.; Mubarik, M.S.; Javed, R.; Siddiqui, M.H.; Hasanuzzaman, M. Jasmonic acid: A key frontier in conferring abiotic stress tolerance in plants. Plant Cell Rep. 2021, 40, 1513–1541. [Google Scholar] [CrossRef]
  21. Zhang, Y.; Chen, Y.; Lu, H.; Kong, X.; Dai, J.; Li, Z.; Dong, H. Growth, lint yield and changes in physiological attributes of cotton under temporal waterlogging. Field Crops Res. 2016, 194, 83–93. [Google Scholar] [CrossRef]
  22. Liu, P.; Sun, F.; Gao, R.; Dong, H. RAP2. 6L overexpression delays waterlogging induced premature senescence by increasing stomatal closure more than antioxidant enzyme activity. Plant Mol. Biol. 2012, 79, 609–622. [Google Scholar] [CrossRef]
  23. Nan, R.; Carman, J.G.; Salisbury, F.B. Water stress, CO2 and photoperiod influence hormone levels in wheat. J. Plant Physiol. 2002, 159, 307–312. [Google Scholar] [CrossRef]
  24. Kim, Y.-H.; Hwang, S.-J.; Waqas, M.; Khan, A.L.; Lee, J.-H.; Lee, J.-D.; Nguyen, H.T.; Lee, I.-J. Comparative analysis of endogenous hormones level in two soybean (Glycine max L.) lines differing in waterlogging tolerance. Front. Plant Sci. 2015, 6, 714. [Google Scholar] [CrossRef]
  25. Qi, X.; Li, Q.; Ma, X.; Qian, C.; Wang, H.; Ren, N.; Shen, C.; Huang, S.; Xu, X.; Xu, Q. Waterlogging-induced adventitious root formation in cucumber is regulated by ethylene and auxin through reactive oxygen species signalling. Plant Cell Environ. 2019, 42, 1458–1470. [Google Scholar] [CrossRef]
  26. Ye, H.; Song, L.; Chen, H.; Valliyodan, B.; Cheng, P.; Ali, L.; Vuong, T.; Wu, C.; Orlowski, J.; Buckley, B. A major natural genetic variation associated with root system architecture and plasticity improves waterlogging tolerance and yield in soybean. Plant Cell Environ. 2018, 41, 2169–2182. [Google Scholar] [CrossRef]
  27. Caudle, K.L.; Maricle, B.R. Effects of flooding on photosynthesis, chlorophyll fluorescence, and oxygen stress in plants of varying flooding tolerance. Trans. Kans. Acad. Sci. 2012, 115, 5–18. [Google Scholar]
  28. Arbona, V.; López-Climent, M.F.; Pérez-Clemente, R.M.; Gómez-Cadenas, A. Maintenance of a high photosynthetic performance is linked to flooding tolerance in citrus. Environ. Exp. Bot. 2009, 66, 135–142. [Google Scholar] [CrossRef]
  29. Janiak, A.; Kwasniewski, M.; Sowa, M.; Gajek, K.; Żmuda, K.; Kościelniak, J.; Szarejko, I. No time to waste: Transcriptome study reveals that drought tolerance in barley may be attributed to stressed-like expression patterns that exist before the occurrence of stress. Front. Plant Sci. 2018, 8, 2212. [Google Scholar] [CrossRef] [PubMed]
  30. Hilker, M.; Schmülling, T. Stress priming, memory, and signalling in plants. Plant Cell Environ. 2019, 42, 753–761. [Google Scholar] [CrossRef]
  31. Borges, A.A.; Jiménez-Arias, D.; Expósito-Rodríguez, M.; Sandalio, L.M.; Pérez, J.A. Priming crops against biotic and abiotic stresses: MSB as a tool for studying mechanisms. Front. Plant Sci. 2014, 5, 642. [Google Scholar] [CrossRef] [PubMed]
  32. Khan, R.; Ma, X.; Shah, S.; Wu, X.; Shaheen, A.; Xiao, L.; Wu, Y.; Wang, S. Drought-hardening improves drought tolerance in Nicotiana tabacum at physiological, biochemical, and molecular levels. BMC Plant Biol. 2020, 20, 486. [Google Scholar] [CrossRef]
  33. Zhang, S.-H.; Xu, X.-F.; Sun, Y.-M.; Zhang, J.-L.; Li, C.-Z. Influence of drought hardening on the resistance physiology of potato seedlings under drought stress. J. Integr. Agric. 2018, 17, 336–347. [Google Scholar] [CrossRef]
  34. Saiki, S.-T.; Ando, Y.; Yazaki, K.; Tobita, H. Drought hardening contributes to the maintenance of proportions of non-embolized xylem and cambium status during consecutive dry treatment in container-grown seedling of Japanese cedar (Cryptomeria japonica). Forests 2020, 11, 441. [Google Scholar] [CrossRef]
  35. Dong, X.; Bi, H.; Wu, G.; Ai, X. Drought-induced chilling tolerance in cucumber involves membrane stabilisation improved by antioxidant system. Int. J. Plant Prod. 2013, 7, 67–80. [Google Scholar]
  36. Ghanbari, F.; Sayyari, M. Controlled drought stress affects the chilling-hardening capacity of tomato seedlings as indicated by changes in phenol metabolisms, antioxidant enzymes activity, osmolytes concentration and abscisic acid accumulation. Sci. Hortic. 2018, 229, 167–174. [Google Scholar] [CrossRef]
  37. Cayuela, E.; Muñoz-Mayor, A.; Vicente-Agulló, F.; Moyano, E.; Garcia-Abellan, J.O.; Estañ, M.T.; Bolarín, M.C. Drought pretreatment increases the salinity resistance of tomato plants. J. Plant Nutr. Soil Sci. 2007, 170, 479–484. [Google Scholar] [CrossRef]
  38. Li, C.; Jiang, D.; Wollenweber, B.; Li, Y.; Dai, T.; Cao, W. Waterlogging pretreatment during vegetative growth improves tolerance to waterlogging after anthesis in wheat. Plant Sci. 2011, 180, 672–678. [Google Scholar] [CrossRef]
  39. Agualongo, D.A.P.; Da-Silva, C.J.; Garcia, N.; de Oliveira, F.K.; Shimoia, E.P.; Posso, D.A.; de Oliveira, A.C.B.; de Oliveira, D.d.S.C.; do Amarante, L. Waterlogging priming alleviates the oxidative damage, carbohydrate consumption, and yield loss in soybean (Glycine max) plants exposed to waterlogging. Funct. Plant Biol. 2022, 49, 1029–1042. [Google Scholar] [CrossRef]
  40. Hossain, M.A.; Li, Z.-G.; Hoque, T.S.; Burritt, D.J.; Fujita, M.; Munné-Bosch, S. Heat or cold priming-induced cross-tolerance to abiotic stresses in plants: Key regulators and possible mechanisms. Protoplasma 2018, 255, 399–412. [Google Scholar] [CrossRef] [PubMed]
  41. Llorens, E.; González-Hernández, A.I.; Scalschi, L.; Fernández-Crespo, E.; Camañes, G.; Vicedo, B.; García-Agustín, P. Priming mediated stress and cross-stress tolerance in plants: Concepts and opportunities. In Priming-Mediated Stress and Cross-Stress Tolerance in Crop Plants; Elsevier: Amsterdam, The Netherlands, 2020; pp. 1–20. [Google Scholar]
  42. Thomas, T.D.; Dinakar, C.; Puthur, J.T. Effect of UV-B priming on the abiotic stress tolerance of stress-sensitive rice seedlings: Priming imprints and cross-tolerance. Plant Physiol. Biochem. 2020, 147, 21–30. [Google Scholar] [CrossRef]
  43. Landis, T.D.; Tinus, R.; Barnett, J. Chapter 4—Seedling development: The establishment, rapid growth, and hardening phases. In The Container Tree Nursery Manual; Agricultural Handbook 674; Forestry Service, U.S. Department of Agriculture: Washington, DC, USA, 1999; Volume 6—Seedling Propogation, pp. 125–163. [Google Scholar]
  44. Luo, N.; Grossnickle, S.C.; Li, G. The effect of nursery drought preconditioning on summer plantation performance of Pinus tabuliformis: High winter mortality mediated by trade off between seedling carbohydrate and field growth. New For. 2022, 53, 301–317. [Google Scholar] [CrossRef]
  45. Close, D.C.; Beadle, C.L.; Brown, P.H. The physiological basis of containerised tree seedling ‘transplant shock’: A review. Aust. For. 2005, 68, 112–120. [Google Scholar] [CrossRef]
  46. Rietveld, W. Transplanting stress in bareroot conifer seedlings: Its development and progression to establishment. North. J. Appl. For. 1989, 6, 99–107. [Google Scholar] [CrossRef]
  47. Lee, K.-C.; Kweon, H.; Sung, J.-W.; Kim, Y.S.; Song, Y.G.; Cha, S.; Koo, N. Physiological response analysis for the diagnosis of drought and waterlogging damage in Prunus yedoensis. For. Sci. Technol. 2022, 18, 14–25. [Google Scholar] [CrossRef]
  48. Villar-Salvador, P.; Planelles, R.; Oliet, J.; Peñuelas-Rubira, J.L.; Jacobs, D.F.; González, M. Drought tolerance and transplanting performance of holm oak (Quercus ilex) seedlings after drought hardening in the nursery. Tree Physiol. 2004, 24, 1147–1155. [Google Scholar] [CrossRef]
  49. Szmidt, A.; Wang, X.-R. Molecular systematics and genetic differentiation of Pinus sylvestris (L.) and P. densiflora (Sieb. et Zucc.). Theor. Appl. Genet. 1993, 86, 159–165. [Google Scholar] [CrossRef] [PubMed]
  50. Korea Forest Service. Statistical Year Book of Forestry; Korea Forest Service: Daejeon, Republic of Korea, 2006. (In Korean)
  51. Lee, S.J.; Shin, D.B.; Lee, A.R.; Oh, S.H. Characteristics of Dieback of Pinus densiflora and Risk Assessment in the Wangpicheon Ecosystem and Landscape Conservation Area in Uljin, South Korea. Forests 2023, 14, 903. [Google Scholar] [CrossRef]
  52. Kim, J.; Kim, E.S.; Lim, J.H. Topographic and meteorological characteristics of Pinus densiflora dieback areas in Sogwang-Ri, Uljin. Korean J. Agric. For. Meteorol. 2017, 19, 10–18. [Google Scholar] [CrossRef]
  53. Bhusal, N.; Adhikari, A.; Lee, M.; Han, A.; Han, A.R.; Kim, H.S. Evaluation of growth responses of six gymnosperm species under long-term excessive irrigation and traits determining species resistance to waterlogging. Agric. For. Meteorol. 2022, 323, 109071. [Google Scholar] [CrossRef]
  54. Press, M.C.; Scholes, J.D.; Barker, M.G. Physiological Plant Ecology; Blackwell Science Oxford: Oxford, UK, 1999. [Google Scholar]
  55. Newell, E.A.; Mulkey, S.S.; Wright, J.S. Seasonal patterns of carbohydrate storage in four tropical tree species. Oecologia 2002, 131, 333–342. [Google Scholar] [CrossRef] [PubMed]
  56. Ashwell, G. New colorimetric methods of sugar analysis. In Methods in Enzymology; Elsevier: Amsterdam, The Netherlands, 1966; Volume 8, pp. 85–95. [Google Scholar]
  57. Ábrahám, E.; Hourton-Cabassa, C.; Erdei, L.; Szabados, L. Methods for determination of proline in plants. In Plant Stress Tolerance; Springer: Berlin/Heidelberg, Germany, 2010; pp. 317–331. [Google Scholar]
  58. Shinano, T.; Lei, T.; Kawamukai, T.; Inoue, M.; Koike, T.; Tadano, T. Dimethylsulfoxide method for the extraction of chlorophylls a and b from the leaves of wheat, field bean, dwarf bamboo, and oak. Photosynthetica 1996, 32, 409–415. [Google Scholar]
  59. Wellburn, A.R. The spectral determination of chlorophylls a and b, as well as total carotenoids, using various solvents with spectrophotometers of different resolution. J. Plant Physiol. 1994, 144, 307–313. [Google Scholar] [CrossRef]
  60. Schmieder, R.; Edwards, R. Quality control and preprocessing of metagenomic datasets. Bioinformatics 2011, 27, 863–864. [Google Scholar] [CrossRef]
  61. Hao, Z.-Z.; Liu, Y.-Y.; Nazaire, M.; Wei, X.-X.; Wang, X.-Q. Molecular phylogenetics and evolutionary history of sect. Quinquefoliae (Pinus): Implications for Northern Hemisphere biogeography. Mol. Phylogenet. Evol. 2015, 87, 65–79. [Google Scholar] [CrossRef]
  62. Tang, S.; Lomsadze, A.; Borodovsky, M. Identification of protein coding regions in RNA transcripts. Nucleic Acids Res. 2015, 43, e78. [Google Scholar] [CrossRef] [PubMed]
  63. Fu, L.; Niu, B.; Zhu, Z.; Wu, S.; Li, W. CD-HIT: Accelerated for clustering the next-generation sequencing data. Bioinformatics 2012, 28, 3150–3152. [Google Scholar] [CrossRef]
  64. Simão, F.A.; Waterhouse, R.M.; Ioannidis, P.; Kriventseva, E.V.; Zdobnov, E.M. BUSCO: Assessing genome assembly and annotation completeness with single-copy orthologs. Bioinformatics 2015, 31, 3210–3212. [Google Scholar] [CrossRef] [PubMed]
  65. Patro, R.; Duggal, G.; Love, M.I.; Irizarry, R.A.; Kingsford, C. Salmon provides fast and bias-aware quantification of transcript expression. Nat. Methods 2017, 14, 417–419. [Google Scholar] [CrossRef]
  66. Love, M.I.; Huber, W.; Anders, S. Moderated estimation of fold change and dispersion for RNA-seq data with DESeq2. Genome Biol. 2014, 15, 550. [Google Scholar] [CrossRef]
  67. Altschul, S.F.; Madden, T.L.; Schäffer, A.A.; Zhang, J.; Zhang, Z.; Miller, W.; Lipman, D.J. Gapped BLAST and PSI-BLAST: A new generation of protein database search programs. Nucleic Acids Res. 1997, 25, 3389–3402. [Google Scholar] [CrossRef] [PubMed]
  68. Mi, H.; Huang, X.; Muruganujan, A.; Tang, H.; Mills, C.; Kang, D.; Thomas, P.D. PANTHER version 11: Expanded annotation data from Gene Ontology and Reactome pathways, and data analysis tool enhancements. Nucleic Acids Res. 2017, 45, D183–D189. [Google Scholar] [CrossRef]
  69. Jin, J.; Tian, F.; Yang, D.-C.; Meng, Y.-Q.; Kong, L.; Luo, J.; Gao, G. PlantTFDB 4.0: Toward a central hub for transcription factors and regulatory interactions in plants. Nucleic Acids Res. 2016, 45, gkw982. [Google Scholar] [CrossRef]
  70. Lee, I.H.; Han, H.; Koh, Y.H.; Kim, I.S.; Lee, S.-W.; Shim, D. Comparative transcriptome analysis of Pinus densiflora following inoculation with pathogenic (Bursaphelenchus xylophilus) or non-pathogenic nematodes (B. thailandae). Sci. Rep. 2019, 9, 12180. [Google Scholar] [CrossRef]
  71. Zhu, P.; Ma, Y.; Zhu, L.; Chen, Y.; Li, R.; Ji, K. Selection of suitable reference genes in Pinus massoniana Lamb. under different abiotic stresses for qPCR normalization. Forests 2019, 10, 632. [Google Scholar] [CrossRef]
  72. Livak, K.J.; Schmittgen, T.D. Analysis of relative gene expression data using real-time quantitative PCR and the 2−ΔΔCT method. Methods 2001, 25, 402–408. [Google Scholar] [CrossRef] [PubMed]
  73. Struve, D.K. Tree establishment: A review of some of the factors affecting transplant survival and establishment. Arboric. Urban For. 2009, 35, 10–13. [Google Scholar] [CrossRef]
  74. Watson, G.W.; Sydnor, T.D. The effect of root pruning on the root system of nursery trees. J. Arboric. 1987, 13, 126–130. [Google Scholar] [CrossRef]
  75. Arnold, M.A.; Struve, D.K. Green ash establishment following transplant. J. Am. Soc. Hortic. Sci. 1989, 114, 591–595. [Google Scholar] [CrossRef]
  76. Watson, G.W.; Himelick, E. Root distribution of nursery trees and its relationship to transplanting success. J. Arboric. 1982, 8, 225–229. [Google Scholar] [CrossRef]
  77. Abod, S.; Webster, A. The influence of root pruning on subsequent root and shoot growth of Malus, Tilia and Betula. J. Hortic. Sci. 1991, 66, 227–233. [Google Scholar] [CrossRef]
  78. Ikeuchi, M.; Iwase, A.; Rymen, B.; Lambolez, A.; Kojima, M.; Takebayashi, Y.; Heyman, J.; Watanabe, S.; Seo, M.; De Veylder, L. Wounding triggers callus formation via dynamic hormonal and transcriptional changes. Plant Physiol. 2017, 175, 1158–1174. [Google Scholar] [CrossRef]
  79. Vélez-Bermúdez, I.-C.; Salazar-Henao, J.E.; Fornalé, S.; López-Vidriero, I.; Franco-Zorrilla, J.-M.; Grotewold, E.; Gray, J.; Solano, R.; Schmidt, W.; Pagés, M. A MYB/ZML complex regulates wound-induced lignin genes in maize. Plant Cell 2015, 27, 3245–3259. [Google Scholar] [CrossRef]
  80. Carpita, N.C.; Gibeaut, D.M. Structural models of primary cell walls in flowering plants: Consistency of molecular structure with the physical properties of the walls during growth. Plant J. 1993, 3, 1–30. [Google Scholar] [CrossRef] [PubMed]
  81. Reiter, W.-D. Biosynthesis and properties of the plant cell wall. Curr. Opin. Plant Biol. 2002, 5, 536–542. [Google Scholar] [CrossRef]
  82. Sasidharan, R.; Voesenek, L.A.; Pierik, R. Cell wall modifying proteins mediate plant acclimatization to biotic and abiotic stresses. Crit. Rev. Plant Sci. 2011, 30, 548–562. [Google Scholar] [CrossRef]
  83. Tenhaken, R. Cell wall remodeling under abiotic stress. Front. Plant Sci. 2015, 5, 771. [Google Scholar] [CrossRef]
  84. Le Gall, H.; Philippe, F.; Domon, J.-M.; Gillet, F.; Pelloux, J.; Rayon, C. Cell wall metabolism in response to abiotic stress. Plants 2015, 4, 112–166. [Google Scholar] [CrossRef] [PubMed]
  85. Barku, V.Y. Wound healing: Contributions from plant secondary metabolite antioxidants. In Wound Healing-Current Perspectives; IntechOpen: Rijeka, Croatia, 2019; p. 13. [Google Scholar]
  86. Dixon, R.A.; Paiva, N.L. Stress-induced phenylpropanoid metabolism. Plant Cell 1995, 7, 1085. [Google Scholar] [CrossRef] [PubMed]
  87. Carnicer, J.; Barbeta, A.; Sperlich, D.; Coll, M.; Peñuelas, J. Contrasting trait syndromes in angiosperms and conifers are associated with different responses of tree growth to temperature on a large scale. Front. Plant Sci. 2013, 4, 409. [Google Scholar] [CrossRef]
  88. Brodribb, T.J.; Pittermann, J.; Coomes, D.A. Elegance versus speed: Examining the competition between conifer and angiosperm trees. Int. J. Plant Sci. 2012, 173, 673–694. [Google Scholar] [CrossRef]
  89. Zhang, Y.; Li, Z.; Ma, B.; Hou, Q.; Wan, X. Phylogeny and functions of LOB domain proteins in plants. Int. J. Mol. Sci. 2020, 21, 2278. [Google Scholar] [CrossRef]
  90. Ye, L.; Wang, X.; Lyu, M.; Siligato, R.; Eswaran, G.; Vainio, L.; Blomster, T.; Zhang, J.; Mähönen, A.P. Cytokinins initiate secondary growth in the Arabidopsis root through a set of LBD genes. Curr. Biol. 2021, 31, 3365–3373.e3367. [Google Scholar] [CrossRef] [PubMed]
  91. Yordanov, Y.S.; Regan, S.; Busov, V. Members of the LATERAL ORGAN BOUNDARIES DOMAIN transcription factor family are involved in the regulation of secondary growth in Populus. Plant Cell 2010, 22, 3662–3677. [Google Scholar] [CrossRef] [PubMed]
  92. Kim, D.; Jeon, S.J.; Yanders, S.; Park, S.C.; Kim, H.S.; Kim, S. MYB3 plays an important role in lignin and anthocyanin biosynthesis under salt stress condition in Arabidopsis. Plant Cell Rep. 2022, 41, 1549–1560. [Google Scholar] [CrossRef] [PubMed]
  93. Chen, K.; Tang, X.; Song, M.; Guo, Y.; Liu, L.; Xue, H.; Dai, H.; Zhang, Z. Functional identification of MdMYB5 involved in secondary cell wall formation in apple. Fruit Res. 2021, 1, 6. [Google Scholar] [CrossRef]
  94. Xiao, R.; Zhang, C.; Guo, X.; Li, H.; Lu, H. MYB transcription factors and its regulation in secondary cell wall formation and lignin biosynthesis during xylem development. Int. J. Mol. Sci. 2021, 22, 3560. [Google Scholar] [CrossRef]
  95. Ajengui, A.; Bertolini, E.; Ligorio, A.; Chebil, S.; Ippolito, A.; Sanzani, S.M. Comparative transcriptome analysis of two citrus germplasms with contrasting susceptibility to Phytophthora nicotianae provides new insights into tolerance mechanisms. Plant Cell Rep. 2018, 37, 483–499. [Google Scholar] [CrossRef]
  96. Alejandro, S.; Lee, Y.; Tohge, T.; Sudre, D.; Osorio, S.; Park, J.; Bovet, L.; Lee, Y.; Geldner, N.; Fernie, A.R. AtABCG29 is a monolignol transporter involved in lignin biosynthesis. Curr. Biol. 2012, 22, 1207–1212. [Google Scholar] [CrossRef]
  97. Pan, L.L.; Miao, H.; Wang, Q.; Walling, L.L.; Liu, S.S. Virus-induced phytohormone dynamics and their effects on plant–insect interactions. New Phytol. 2021, 230, 1305–1320. [Google Scholar] [CrossRef]
  98. Gho, Y.-S.; Kim, S.-j.; Jung, K.-H. Phenylalanine ammonia-lyase family is closely associated with response to phosphate deficiency in rice. Genes Genom. 2020, 42, 67–76. [Google Scholar] [CrossRef] [PubMed]
  99. Huang, J.; Gu, M.; Lai, Z.; Fan, B.; Shi, K.; Zhou, Y.-H.; Yu, J.-Q.; Chen, Z. Functional analysis of the Arabidopsis PAL gene family in plant growth, development, and response to environmental stress. Plant Physiol. 2010, 153, 1526–1538. [Google Scholar] [CrossRef] [PubMed]
  100. Lin, J.S.; Huang, X.X.; Li, Q.; Cao, Y.; Bao, Y.; Meng, X.F.; Li, Y.J.; Fu, C.; Hou, B.K. UDP-glycosyltransferase 72B1 catalyzes the glucose conjugation of monolignols and is essential for the normal cell wall lignification in Arabidopsis thaliana. Plant J. 2016, 88, 26–42. [Google Scholar] [CrossRef]
  101. Thalmann, M.; Pazmino, D.; Seung, D.; Horrer, D.; Nigro, A.; Meier, T.; Kölling, K.; Pfeifhofer, H.W.; Zeeman, S.C.; Santelia, D. Regulation of leaf starch degradation by abscisic acid is important for osmotic stress tolerance in plants. Plant Cell 2016, 28, 1860–1878. [Google Scholar] [CrossRef]
  102. Hartmann, H.; Trumbore, S. Understanding the roles of nonstructural carbohydrates in forest trees–from what we can measure to what we want to know. New Phytol. 2016, 211, 386–403. [Google Scholar] [CrossRef]
  103. Kannenberg, S.A.; Phillips, R.P. Non-structural carbohydrate pools not linked to hydraulic strategies or carbon supply in tree saplings during severe drought and subsequent recovery. Tree Physiol. 2020, 40, 259–271. [Google Scholar] [CrossRef]
  104. Myers, J.A.; Kitajima, K. Carbohydrate storage enhances seedling shade and stress tolerance in a neotropical forest. J. Ecol. 2007, 95, 383–395. [Google Scholar] [CrossRef]
  105. Karst, J.; Gaster, J.; Wiley, E.; Landhäusser, S.M. Stress differentially causes roots of tree seedlings to exude carbon. Tree Physiol. 2017, 37, 154–164. [Google Scholar] [CrossRef]
  106. Trifilò, P.; Kiorapostolou, N.; Petruzzellis, F.; Vitti, S.; Petit, G.; Gullo, M.A.L.; Nardini, A.; Casolo, V. Hydraulic recovery from xylem embolism in excised branches of twelve woody species: Relationships with parenchyma cells and non-structural carbohydrates. Plant Physiol. Biochem. 2019, 139, 513–520. [Google Scholar] [CrossRef]
  107. Brunetti, C.; Savi, T.; Nardini, A.; Loreto, F.; Gori, A.; Centritto, M. Changes in abscisic acid content during and after drought are related to carbohydrate mobilization and hydraulic recovery in poplar stems. Tree Physiol. 2020, 40, 1043–1057. [Google Scholar] [CrossRef] [PubMed]
  108. La Camera, S.; Gouzerh, G.; Dhondt, S.; Hoffmann, L.; Fritig, B.; Legrand, M.; Heitz, T. Metabolic reprogramming in plant innate immunity: The contributions of phenylpropanoid and oxylipin pathways. Immunol. Rev. 2004, 198, 267–284. [Google Scholar] [CrossRef] [PubMed]
  109. Zhao, T.; Wu, T.; Pei, T.; Wang, Z.; Yang, H.; Jiang, J.; Zhang, H.; Chen, X.; Li, J.; Xu, X. Overexpression of SlGATA17 promotes drought tolerance in transgenic tomato plants by enhancing activation of the phenylpropanoid biosynthetic pathway. Front. Plant Sci. 2021, 12, 634888. [Google Scholar] [CrossRef] [PubMed]
  110. Shadle, G.L.; Wesley, S.V.; Korth, K.L.; Chen, F.; Lamb, C.; Dixon, R.A. Phenylpropanoid compounds and disease resistance in transgenic tobacco with altered expression of L-phenylalanine ammonia-lyase. Phytochemistry 2003, 64, 153–161. [Google Scholar] [CrossRef] [PubMed]
  111. Xu, C.; Wei, L.; Huang, S.; Yang, C.; Wang, Y.; Yuan, H.; Xu, Q.; Zhang, W.; Wang, M.; Zeng, X. Drought resistance in Qingke involves a reprogramming of the phenylpropanoid pathway and UDP-glucosyltransferase regulation of abiotic stress tolerance targeting flavonoid biosynthesis. J. Agric. Food Chem. 2021, 69, 3992–4005. [Google Scholar] [CrossRef] [PubMed]
  112. Li, Z.; Zhang, X.; Zhao, Y.; Li, Y.; Zhang, G.; Peng, Z.; Zhang, J. Enhancing auxin accumulation in maize root tips improves root growth and dwarfs plant height. Plant Biotechnol. J. 2018, 16, 86–99. [Google Scholar] [CrossRef] [PubMed]
  113. Teale, W.D.; Paponov, I.A.; Palme, K. Auxin in action: Signalling, transport and the control of plant growth and development. Nat. Rev. Mol. Cell Biol. 2006, 7, 847–859. [Google Scholar] [CrossRef]
  114. Pop, T.I.; Pamfil, D.D.; Bellini, C.C. Auxin control in the formation of adventitious roots. Not. Bot. Horti Agrobot. Cluj-Napoca 2011, 39, 307–316. [Google Scholar] [CrossRef]
  115. Rasmussen, A.; Hosseini, S.A.; Hajirezaei, M.-R.; Druege, U.; Geelen, D. Adventitious rooting declines with the vegetative to reproductive switch and involves a changed auxin homeostasis. J. Exp. Bot. 2015, 66, 1437–1452. [Google Scholar] [CrossRef]
Figure 1. Environmental variables at Mt. Taehwa from October 2020 to December 2021: (A) temperature, (B) precipitation, and (C) soil moisture.
Forests 15 00445 g001
Figure 2. Number of differentially expressed genes (DEG) in each comparison. Letters indicate waterlogging treatment in 2020: control (100% natural precipitation; C) and waterlogging (additional irrigation 20-year average, W) and trees were transplanted in October 2020. Samples collected in 2021. TC and TW indicate trees grown at C and W in 2018–2020, respectively. Differential expression was defined as >1-fold change in expression at FDR < 0.05.
Forests 15 00445 g002
Figure 3. Venn diagram showing the DEGs for each comparison. (A) Commonly regulated genes compared to control before and after transplanting. (B) Transplant stress: control (100% natural precipitation; C) and waterlogging (additional irrigation 20-year average, W) and trees were transplanted in October 2020. Samples collected in 2021. TC and TW indicate trees grown at C and W in 2018–2020, respectively. Differential expression was defined as >1-fold change in expression at FDR < 0.05.
Forests 15 00445 g003
Figure 4. Gene ontology (GO) analysis of differentially expressed genes in comparisons between P. densiflora grown waterlogging stress after transplanting (TW and TC). (A) Upregulated GO term at TW. (B) Downregulated GO term at TW. The x axis indicates p-value −log10 (FDR). TC and TW indicate trees grown at control (100% natural precipitation; C) and waterlogging (additional irrigation 20-year average, W) in 2018–2020, respectively. The GO terms associated with Fisher’s exact test with FDR-corrected p-value < 0.05. The CC, MF, and BP indicate cellular component, molecular function, and biological process, respectively.
Forests 15 00445 g004
Figure 5. Heatmap of expression of transcription factor (TF) genes in comparisons in the waterlogging experiment: control (100% natural precipitation; C) and waterlogging (additional irrigation 20-year average, W), and trees were transplanted in October 2020. Samples collected in 2021. TC and TW indicate trees grown at C and W in 2018–2020, respectively. Heatmap colors indicate the Z-scores of TMM-normalized TPM values. The darker purple color indicates a higher expression of the gene.
Forests 15 00445 g005
Figure 6. MapMan analysis of stress-related DEGs of P. densiflora genes compared to TW and TC. Letters indicate control (100% natural precipitation; C) and waterlogging (additional irrigation 20-year average, W) and trees were transplanted in October 2020. Samples collected in 2021. TC and TW indicate trees grown at C and W in 2018–2020, respectively. The different colors represent the log2 TPM values of the gene expression. Red indicates downregulated and blue indicates upregulated genes. ABA, abscisic acid; brassinost., brassinosteroid; HSP, heat-shock protein; JA, jasmonic acid; PR, pathogenesis-related; SA, salicylic acid.
Forests 15 00445 g006
Figure 7. Validation of RNA-Sequencing results using quantitative real-time PCR (qRT-PCR). Correlation of log2 FC value analyzed by RNA-Seq (x axis) with data obtained using quantitative real-time PCR (y axis) in trees grown under waterlogging hardening versus control conditions in transplant stress.
Forests 15 00445 g007
Table 1. Summary statistics for de novo transcriptome assembly.
Assembled ContigsNumber
Total Trinity genes (n)134,369
Total Trinity transcripts (n)269,984
GC content (%)41.32
Contig N50 length (bp)1501
Average contig length (bp)874.52
Total assembled bases236,105,474
Table 2. Results of a two-way ANOVA with repeated measures across years and averages of the height and root collar diameter of P. densiflora grown at control (100% natural precipitation) and waterlogging treatment after transplanting.
Yearp-Value
FactorTreatment20202021TreatmentYearTreatment × Year
Height (cm)Control63.67 ± 5.8979.00 ± 6.350.8810.4060.762
Waterlogging 63.02 ± 5.7375.15 ± 5.85
Root collar
diameter (mm)
Control11.25 ± 1.0714.28 ± 1.380.9020.4240.723
Waterlogging 12.62 ± 0.9115.68 ± 0.09
Table 3. Results of ANOVA for the height and diameter growth, the maximum photosynthetic rate (Pmax), stomatal conductance (gs), water use efficiency (WUE), leaf soluble sugars and starch, and chlorophyll content measured in P. densiflora after transplanting. Letters indicate control (100% natural precipitation; C) and waterlogging (additional irrigation 20-year average, W), and trees were transplanted in October 2020. Samples collected in 2021. TC and TW indicate trees grown at C and W in 2018–2020, respectively.
Treatmentp-Value
TCTW
Height growth
(cm)
15.33 ± 1.76
(n = 6)
12.15 ± 1.19
(n = 6)
0.166
Root collar diameter growth
(mm)
3.02 ± 0.49
(n = 6)
3.05 ± 0.17
(n = 6)
0.952
Pmax
(µmol s−1 m−2)
15.63 ± 2.67
(n = 6)
21.05 ± 2.98
(n = 4)
0.217
Stomatal conductance
(mol s−1 m−2)
0.19 ± 0.04
(n = 6)
0.32 ± 0.07
(n = 4)
0.126
WUE
(mmol mol−1)
88.11 ± 10.88
(n = 6)
70.71 ± 13.16
(n = 4)
0.334
Soluble sugars
(mg g−1)
77.60 ± 10.97
(n = 6)
46.15 ± 7.22
(n = 4)
0.059
Starch
(mg g−1)
87.89 ± 8.86
(n = 6)
43.48 ± 7.22
(n = 4)
0.007
Chlorophyll
(mg g−1)
0.41 ± 0.03
(n = 6)
0.49 ± 0.05
(n = 4)
0.201
p-values for ANOVA are in bold when significant (p < 0.05).
Disclaimer/Publisher’s Note: The statements, opinions and data contained in all publications are solely those of the individual author(s) and contributor(s) and not of MDPI and/or the editor(s). MDPI and/or the editor(s) disclaim responsibility for any injury to people or property resulting from any ideas, methods, instructions or products referred to in the content.

