Article

Effects of Flooding and Shade on Survival, Growth, and Leaf Gas Exchange of Bottomland Tree Species across the Great Lakes Region (USA)

by
Gwendolen J. Keller
1,*,
Dustin Bronson
2,
Robert A. Slesak
3 and
Marcella A. Windmuller-Campione
1
1
Department of Forest Resources, University of Minnesota, Saint Paul, MN 55105, USA
2
USDA Northern Research Station, US Forest Service, Rhinelander, WI 54501, USA
3
USDA Pacific Northwest Research Station, US Forest Service, Olympia, WA 98512, USA
*
Author to whom correspondence should be addressed.
Forests 2024, 15(3), 530; https://doi.org/10.3390/f15030530
Submission received: 16 January 2024 / Revised: 9 March 2024 / Accepted: 11 March 2024 / Published: 13 March 2024
(This article belongs to the Section Forest Ecology and Management)

Abstract

:
Forested wetlands are common ecosystems within the Great Lakes region (Michigan, Minnesota, and Wisconsin), USA. Projected increases in extreme flooding events and shifting disturbance regimes create challenges for tree regeneration. Forest managers are considering the use of enrichment planting to increase tree species diversity, but limited information is available that quantifies the interactions between the flooding and shade tolerances of candidate tree species. We used a microcosm experiment to manipulate shade and flooding conditions to determine the effects on early survival, growth, and leaf gas exchange of 23 different tree species that vary in shade and flood tolerance. Seedlings were planted in pots and placed in 227 L tanks that were randomly assigned to light reduction (full sun, 40% and 70% reduced sunlight) and flood treatments (water levels of 0, 14, or 27 cm below the soil surface). In general, flooding treatments had a greater influence on seedling growth and leaf gas exchange rates than light reduction treatments. Of the species studied, bald cypress (Taxodium distichum (L.) Rich.) was the most flood-tolerant, but American sycamore (Platanus occidentalis L.) and river birch (Betula nigra L.) were also highly tolerant of flooding conditions throughout the entire growing season. The flood tolerances of the remaining species varied, but none were tolerant of water table depths within 14 cm of the soil surface for the entire growing season. Most species did not respond to the shade treatments in terms of early growth, survival, and leaf gas exchange. When considering species for planting in forested wetlands, matching the flood tolerance of candidate species to local site hydrology is an important step.

1. Introduction

Climate change is increasing the frequency of extreme weather and related events such as flooding [1,2]. Between 1960 and 2000, the number of days globally with precipitation greater than 10 cm, as well as the maximum 5-day precipitation total, increased [3]. Such dramatic changes in precipitation are likely to alter the hydrologic regime of wetland ecosystems, potentially resulting in biogeographic shifts of wetland vegetation as habitat ranges change [4,5,6,7]. Climate-induced hydrologic regime shifts exacerbate impacts that forested wetlands and their associated biota are already experiencing on a global scale [8,9].
Natural resource management decisions addressing both climate change and forested wetland restoration will benefit from a greater understanding of how individual tree species are likely to respond to shifts in flooding intensity [10,11]. Flooding, by creating an anoxic soil environment, can impact trees in a variety of ways. First, it results in the build-up of toxic compounds and impedes the absorption of beneficial nutrients, triggering stomatal closure [12,13]. Decreased stomatal conductance restricts carbon assimilation and subsequently results in stunted root and shoot growth [14]. Flood-tolerant species have evolved a myriad of adaptations to the challenges posed by flooding and anoxic conditions. For example, red maple (Acer rubrum L.), river birch (Betula nigra L.), American sycamore (Platanus occidentalis L.), and bald cypress (Taxodium distichum (L.) Rich.) grow adventitious roots to offset the root dieback that many flood-sensitive species experience under anoxic soil conditions [15]. Additionally, swamp white oak (Quercus bicolor Willd.), bur oak (Quercus macrocarpa Michx.), and white oak (Quercus alba L.) develop hypertrophied lenticels to allow oxygen uptake through the stem while the roots experience anoxia [16]. Finally, many species can maintain high rates of carbohydrate translocation during flooded conditions, while flood-sensitive plants often experience the pooling of sugars at the base of their stem [17]. This wide array of adaptations has created a gradient of flooding tolerances that need to be quantified to inform wetland restoration practices in a changing climate.
In addition to flooding tolerance, the successful establishment and survival of tree seedlings in flooded environments also depends on light availability [18]. There are several key traits that confer an enhanced ability to survive low light levels in tree seedlings. First, shade-tolerant species have lower dark respiration rates than shade-intolerant species, lowering their light compensation point and allowing them to conserve carbon in low-light environments [19]. Shade-tolerant species also tend to have higher leaf chlorophyll concentrations, once again increasing their light harvesting efficiency [20]. Finally, shade-tolerant plants have a greater ability to conserve carbon in storage organs, allowing them to survive for longer periods below their light compensation point [21].
While low-light availability can reduce plant growth, excess light can also stress seedlings, especially in flooded soil [22]. Excess light can result in chronic photoinhibition; this is the result of damage to the D1 polypeptide in the reaction center of photosystem II [23]. Additionally, sun leaves tend to have a lower chlorophyll content than shade leaves, which is exacerbated by flooding, further decreasing the photosynthetic capacity of the leaf and increasing the likelihood of photoinhibition [24,25]. In contrast, moderate shade can reduce the photoinhibition a flood-stressed plant experiences in full-light conditions and facilitate photosynthesis [26]. The flood and shade conditions that planted seedlings experience in forested wetlands under climate change and extreme flooding events are complex and need to be quantified [27,28].
The Great Lakes region of the United States provides a localized example of the intersection of global climate change and wetland degradation. Peak daily streamflow in this region is projected to increase (10%–30%) by 2080 due to increasing precipitation [29]. Greater precipitation in combination with altered disturbance regimes, such as the decimation of black ash (Fraxinus nigra Marshall) in forested wetlands by emerald ash borer (Agrilus planipennis Fairmaire), may require the enrichment planting of flood-tolerant tree species to maintain forest ecosystem functions [30]. These enrichment plantings require the intentional matching of tree species’ flood and shade tolerance to a site’s current and future conditions [31,32].
Given the complex tree seedling physiological response to light, water levels, and their interactions, we conducted a microcosm experiment to investigate the tolerances of 23 tree species from across eastern North America under consideration for wetland restoration efforts in the Great Lakes Region. Specifically, we tested the effect of flood intensity and light reduction gradients on the survival, growth, and leaf gas exchange rates of each of the study species. The purpose of conducting this study was to inform wetland forest managers in eastern North America with detailed information about the suitability and performance of each of these species for climate-adapted wetland restoration activities.

2. Materials and Methods

2.1. Study Design

This study was conducted at the USDA Forest Service Northern Research Station Rhinelander Experimental Forest located in Harshaw, WI, USA. Twenty-three species were selected for evaluation based on the input from silviculturists at the Wisconsin Department of Natural Resources (DNR) and other research studies or management treatments (Table 1). These species are currently found in various forest wetland ecosystems within the region or in more southern locations for some species considered for assisted migration [33]. Seedlings were obtained from the Wisconsin State Nursery in Boscobel, WI, USA, stored in a walk-in refrigerator at 4 °C for 35 days, and then potted in early June 2021. Seedlings were potted into plastic containers (10 cm × 10 cm × 30 cm) with a soil mixture of sphagnum peat moss (60%–70%), bark, and perlite (Berger BM7 Bark Mix, Saint-Modeste, QC, Canada).
The experiment was designed as a split–split plot randomized complete block design that included a light reduction treatment as the whole plot factor (light reductions of 0, 40, and 70%), a flood level treatment as the first split–plot factor (water levels at 0, 14, and 27 cm below the soil surface), and tree species as the second split–plot factor. This design allowed for both flooding and shade treatments to be applied to each set of seedlings simultaneously. A single seedling from each species was randomly placed in each of the 72 stock tanks (dimensions of 132 cm × 79 cm × 36 cm) (Figure S1), which were then randomly assigned to a flood and light treatment combination within each block. Within each tank, seedlings were spaced such that the distance between each seedling was maximized. Each treatment combination was replicated eight times.
Flooding treatments were applied by filling the tanks with groundwater until water levels equilibrated at the assigned water table depth. The tanks were checked weekly to ensure that the water depth was maintained over the course of the growing season. Light reduction treatments were applied using shade cloths purchased from a greenhouse supply store. Each shade cloth measured 6 × 7.3 m and reduced ambient light by either 40% or 70%. A photosynthetic active radiation (PAR) sensor (SQ-521, Apogee Instruments, Logan, UT, USA) connected to a datalogger (model Z6, METER Group, Pullman, WA, USA) was used to verify whether the reduced light under the shade cloths matched the expected value. Two cables were hung 2.5 m above the ground and 2 m apart. The shade cloths were draped over the cables and staked out at the corners to form a trapezoidal tent, with the three tanks (each with one of the three flood levels) aligned in the center. This design ensured that flood treatments inside a shade tent were never exposed to direct full sunlight.
Treatments were initiated on June 4th and maintained for 14 weeks. The measured air temperature at the site (model ATMOS 14, METER Group, Pullman, WA, USA) ranged from 4.3 to 30.6 °C outside of the shade tents during the study period. The maximum photosynthetically active radiation in the full sun, 40%, and 70% light reduction treatments was 1999, 923, and 595 µmol m−2 s−1, respectively. For the purposes of this study, the 0 cm water table depth (fully flooded) was considered the most stressful flooding condition, and 27 cm was considered to be the least, with 14 cm causing intermediate stress.
In the two weeks following treatment initiation, 28% of seedlings were unexpectedly browsed by white-tailed deer (Odocoileus virginianus Zimm.) to varying degrees (Table S1). None of the conifer species were browsed. The initial height and basal diameter measurements of all individuals, both browsed and unbrowsed, were taken after the browse event (using a meter stick and calipers, respectively). To account for any effect of browsing on the response, the leaf gas exchange measurements were balanced between three individuals that were browsed and three that were unbrowsed. In cases where this was not possible, the sample was composed such that the number of browsed and unbrowsed individuals were as balanced as possible.
Leaf gas exchange measurements were taken on a subset of the following 12 species: red maple, silver maple (Acer saccharinum L.), river birch, hackberry (Celtis occidentalis L.), tamarack (Larix laricina (Du Roi) K. Koch), American sycamore, trembling aspen (Populus tremuloides Michx.), swamp white oak, bur oak, bald cypress, northern white cedar (Thuja occidentalis L.), and American elm (Ulmus americana L.). These species were chosen based on the results from previous experiments in a related study [34]. All gas exchange measurements were taken using a portable photosynthesis system (models 6400 and 6800; Licor, Lincoln, NE, USA) on a randomly selected subsample (6 out of 8 total replicates) of each treatment combination. For all measurements, CO2 concentrations were maintained at 400 µmol CO2 mol−1 air, the flow rate of air through the leaf chambers was maintained at 600 µmol s−1, and photosynthetic active radiation was maintained at 1500 µmol m−2 s−1. These measurements were standardized to provide consistent estimates of light-saturated photosynthesis for the valid comparison of effects across treatments. A 2 × 3 cm leaf chamber was used for conifers and a 2 cm2 circular chamber for broadleafs. As photosynthesis was recorded on a per-unit-leaf-area basis, the leaf area of conifer needle sprigs was corrected using methods from Bermudez et al. [35]. For broadleaf species, measurements were taken on a leaf in the upper third of the seedling. For conifers, measurements were taken on the previous year’s growth unless none were available, in which case it was taken on the current year’s growth. Gas exchange measurements were taken on a biweekly basis for 10 weeks, totaling 6 sampling periods.
Height and basal diameter were measured at the start and end of the growing season. Height was measured from the soil surface to the tip of the uppermost living tissue, and basal diameter was measured 1 cm above the root collar. Negative height values resulted from stem dieback, and negative basal diameter values resulted from stem shrinkage in response to water stress [36]. Survival was also assessed at this time; dead seedlings were identified as those exhibiting no visible green tissue.

2.2. Data Analysis

Each species was analyzed independently for all measured responses to facilitate the interpretation of the results. The effect of water table depth and light on seedling survival was assessed using generalized linear mixed models with a binomial distribution. Water table depth, light, and their interaction were included as fixed effects. For broadleaf species, browse was included as a binary random effect to account for the variation introduced by the early season browse event. For conifers, none of which were browsed, block was included as a random effect to account for the variation introduced by ambient conditions in the field. Block was not included as a random effect in the broadleaf models due to issues with model convergence arising from the inclusion of two random variables. Random effects were removed entirely from some models due to convergence problems. Survival models would not converge for the following species due to low mortality: American elm, northern red oak (Quercus rubra L.), trembling aspen, hackberry, bur oak, black spruce (Picea mariana (Mill.) Britton, Stearns & Poggenb.), northern white cedar, and bald cypress. Survival for the rest of the species was analyzed with mixed model regressions using the glmmTMB function in the ‘glmmTMB’ package [37] in R 4.0.3 software (R Core Development Team, Vienna, Austria, 2018) and fitted by the Type II Wald chi-square test. When significant effects were observed, pairwise multiple comparisons were conducted with the ‘emmeans’ package [38] using Tukey’s HSD adjustment.
The effect of water table depth and light on absolute height and basal diameter growth was analyzed using linear mixed-effects models with a normal distribution. Water table depth, light treatment, and their interaction were included as fixed effects. Block was included as a random effect for both broadleafs and conifers. In addition, browse was included as a binary random effect for broadleafs. Models were run for each species individually. Pre-treatment height or basal diameter was included as a covariate. Mixed models were applied using the lme function in the ‘nlme’ package [39] in R 4.0.3 software. Pairwise multiple comparisons were conducted with the ‘emmeans’ package using Tukey’s HSD adjustment. In all models, an alpha level of 0.1 was chosen to account for high variability in the response variables and reduce the likelihood of a Type 2 error.
Treatment effects on photosynthesis, stomatal conductance, and transpiration were analyzed using linear mixed-effects repeated measures analyses with normal distributions. Water table depth, light, measurement week, and their interactions were included as fixed effects. Browse was included as a binary random effect for broadleafs, and block was included as a random effect for conifers. An AR(1) covariance matrix was used to account for serial correlations among the measurements. The ‘predictmeans’ package [40] in R 4.0.3 software was used to conduct Cook’s distance tests to identify outliers that were then removed from the dataset [41]. Mixed models were applied using the lme function in the ‘nlme’ R package. Pairwise multiple comparisons were conducted with the ‘emmeans’ package using Tukey’s HSD adjustment. The “powerTransform” tool from the ‘car’ R package [42] was used to identify the most appropriate data transformations for data not conforming to a normal distribution and/or with heteroscedastic residuals. Due to the number of plants browsed in the first sampling period and the removal of outliers resulting from measurement issues, the first and last sampling periods had to be removed from the models of several species to solve rank deficiency. For all analyses, model assumptions of normality and homogenous variances were visually assessed and confirmed. In all models, an alpha level of 0.1 was used.
When significant effects were observed, relative responses to convey the trends of responses among species and within treatment factors were used. The reported percentage decrease in response variables was calculated by dividing the smaller value by the larger value, multiplying by 100, and then subtracting from 100. All percentages were rounded to the nearest 5% and listed as an average to account for the variability in the value. To ease the interpretation of response to water table depth in Section 3, species were grouped into four patterns for each response variable separately, excluding survival (Table 2).

3. Results

3.1. Survival

After 13 weeks of flooding and light treatment, the survival rate for all species combined was 94% and ranged from 67 to 100% across all treatments, depending on the species (Table S2). Of the 23 study species, black walnut (Juglans nigra L.) was the only species to exhibit a significant main effect of water table depth on survival (Table S3). The observed survival rate for black walnuts at the 0 cm water table depth (42%) was significantly less (p = 0.03) than the survival rate at 14 cm (84%). The survival rate for the 27 cm water table depth (71%) was not significantly different from the 0 cm (p = 0.18) or the 14 cm treatment (p = 0.56). Light reduction and the interaction between light reduction and water table depth had no effect on survival for any species (Table S3).

3.2. Patterns of Response
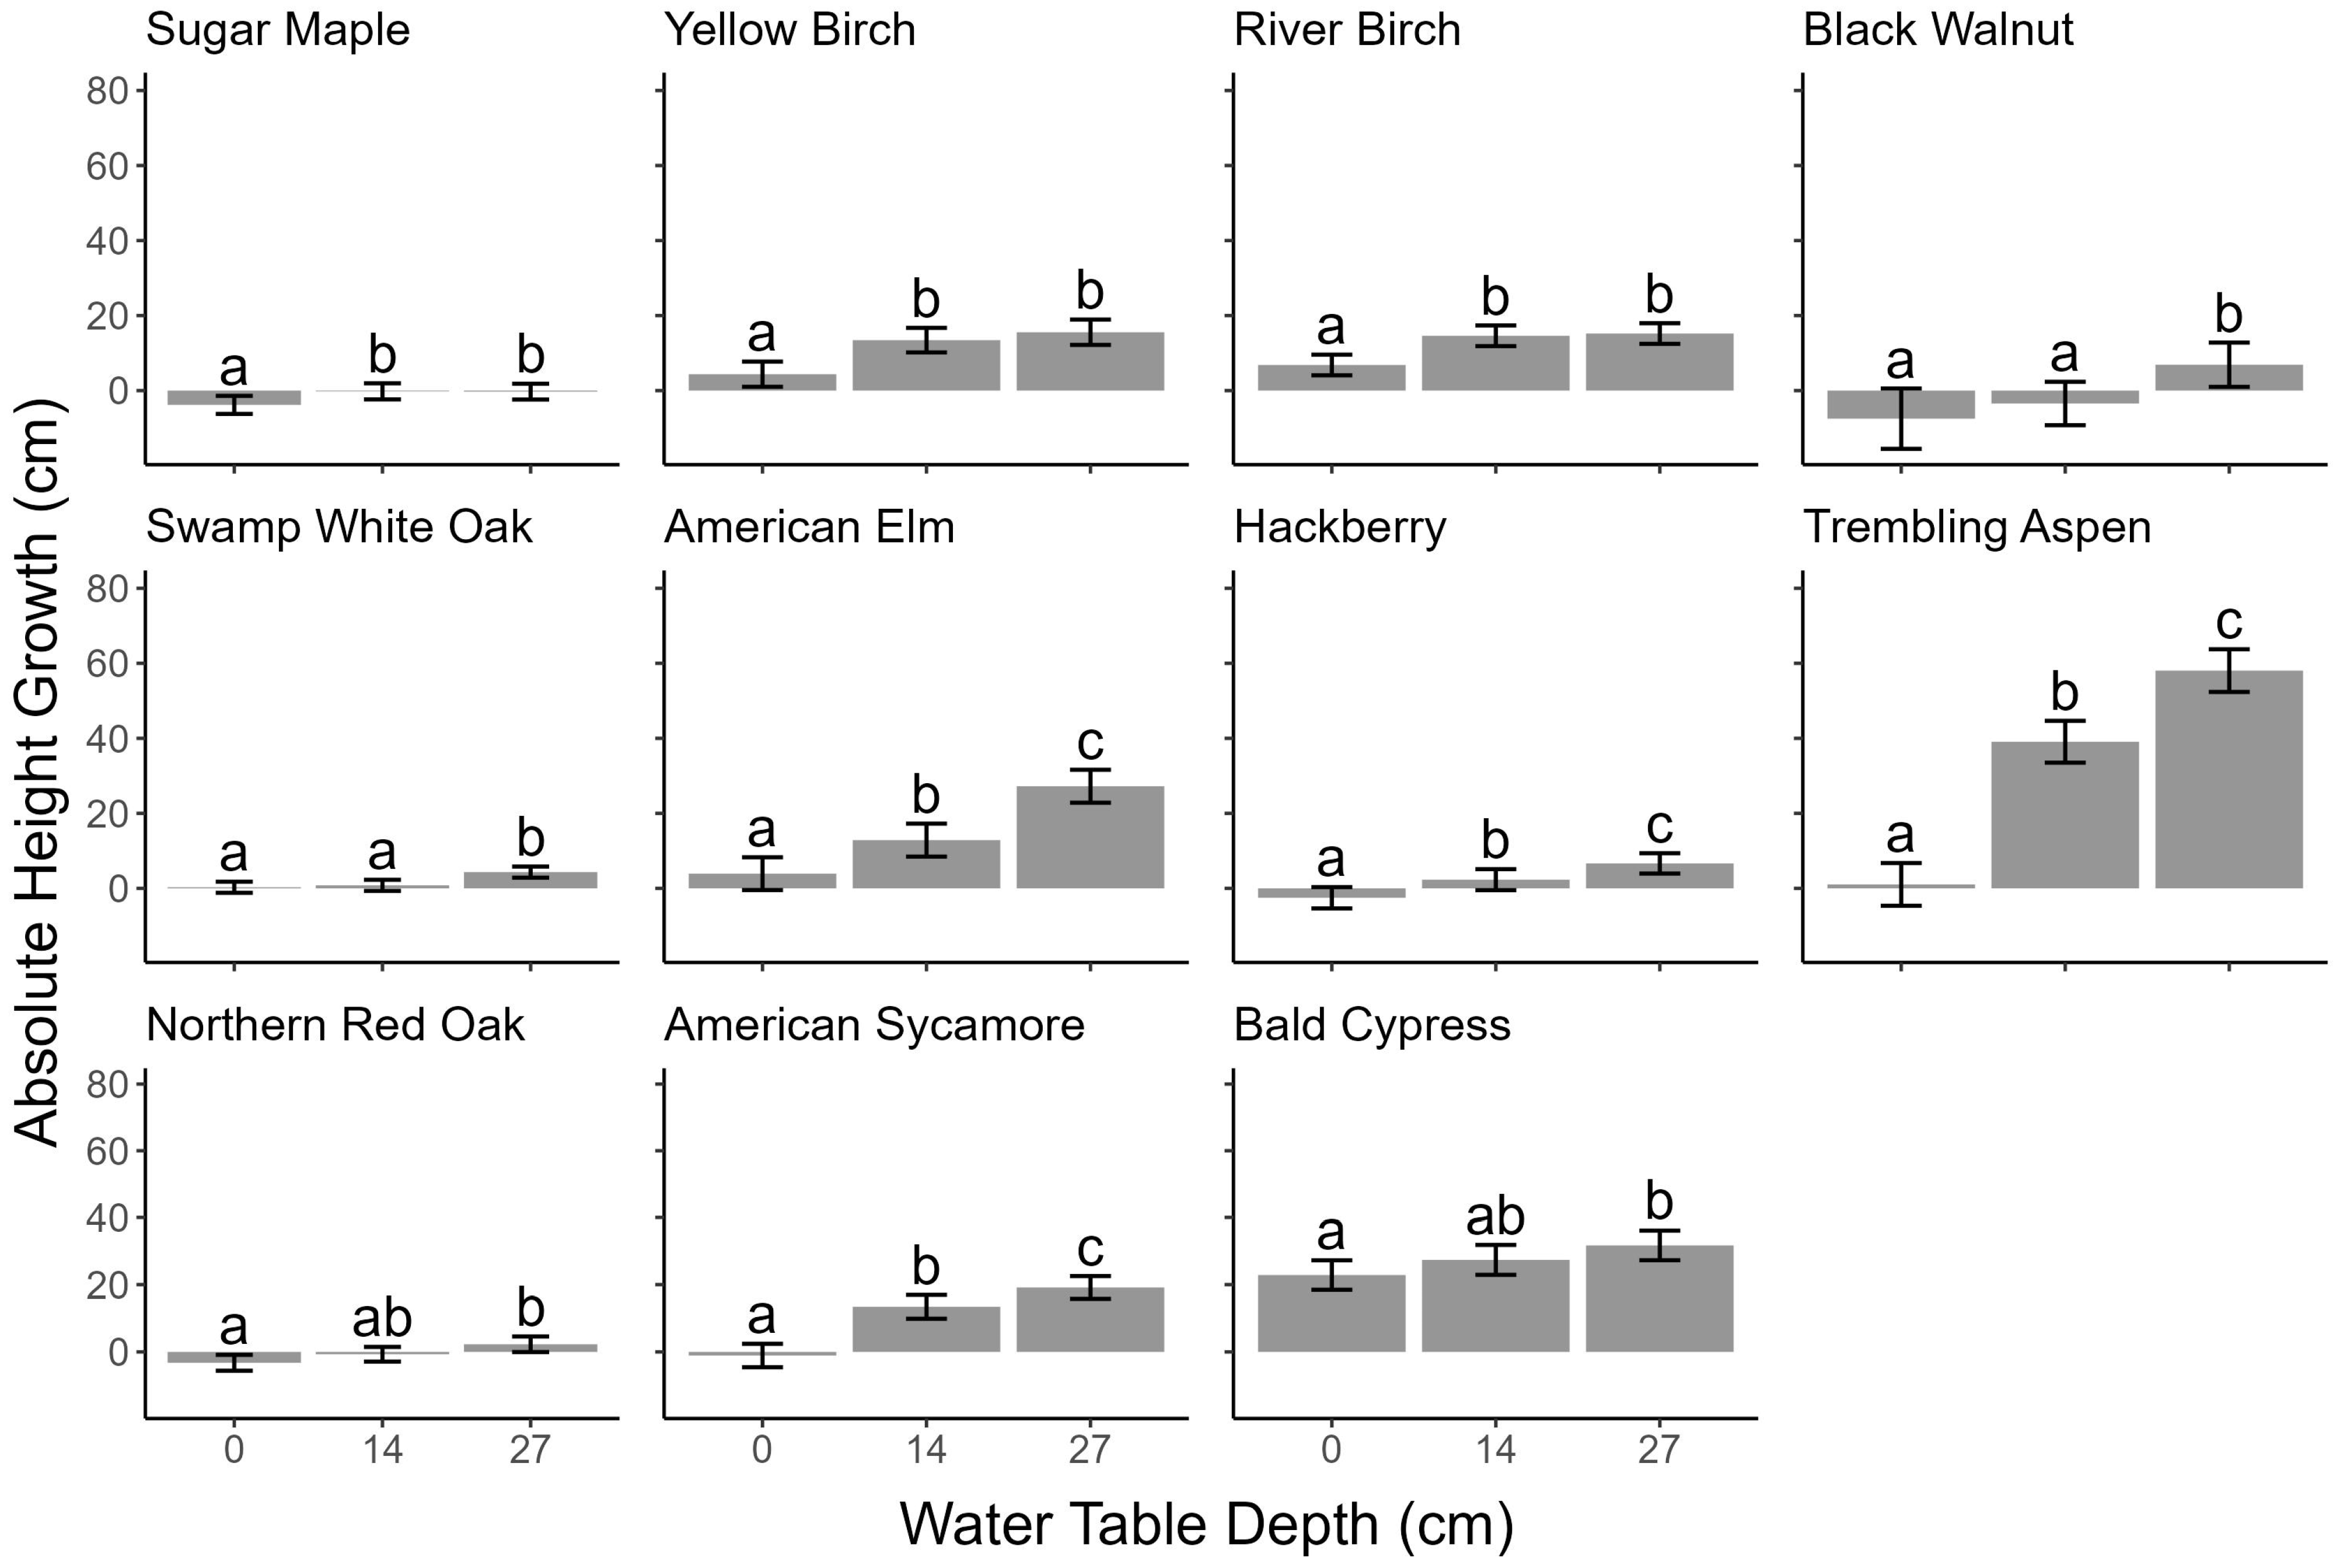
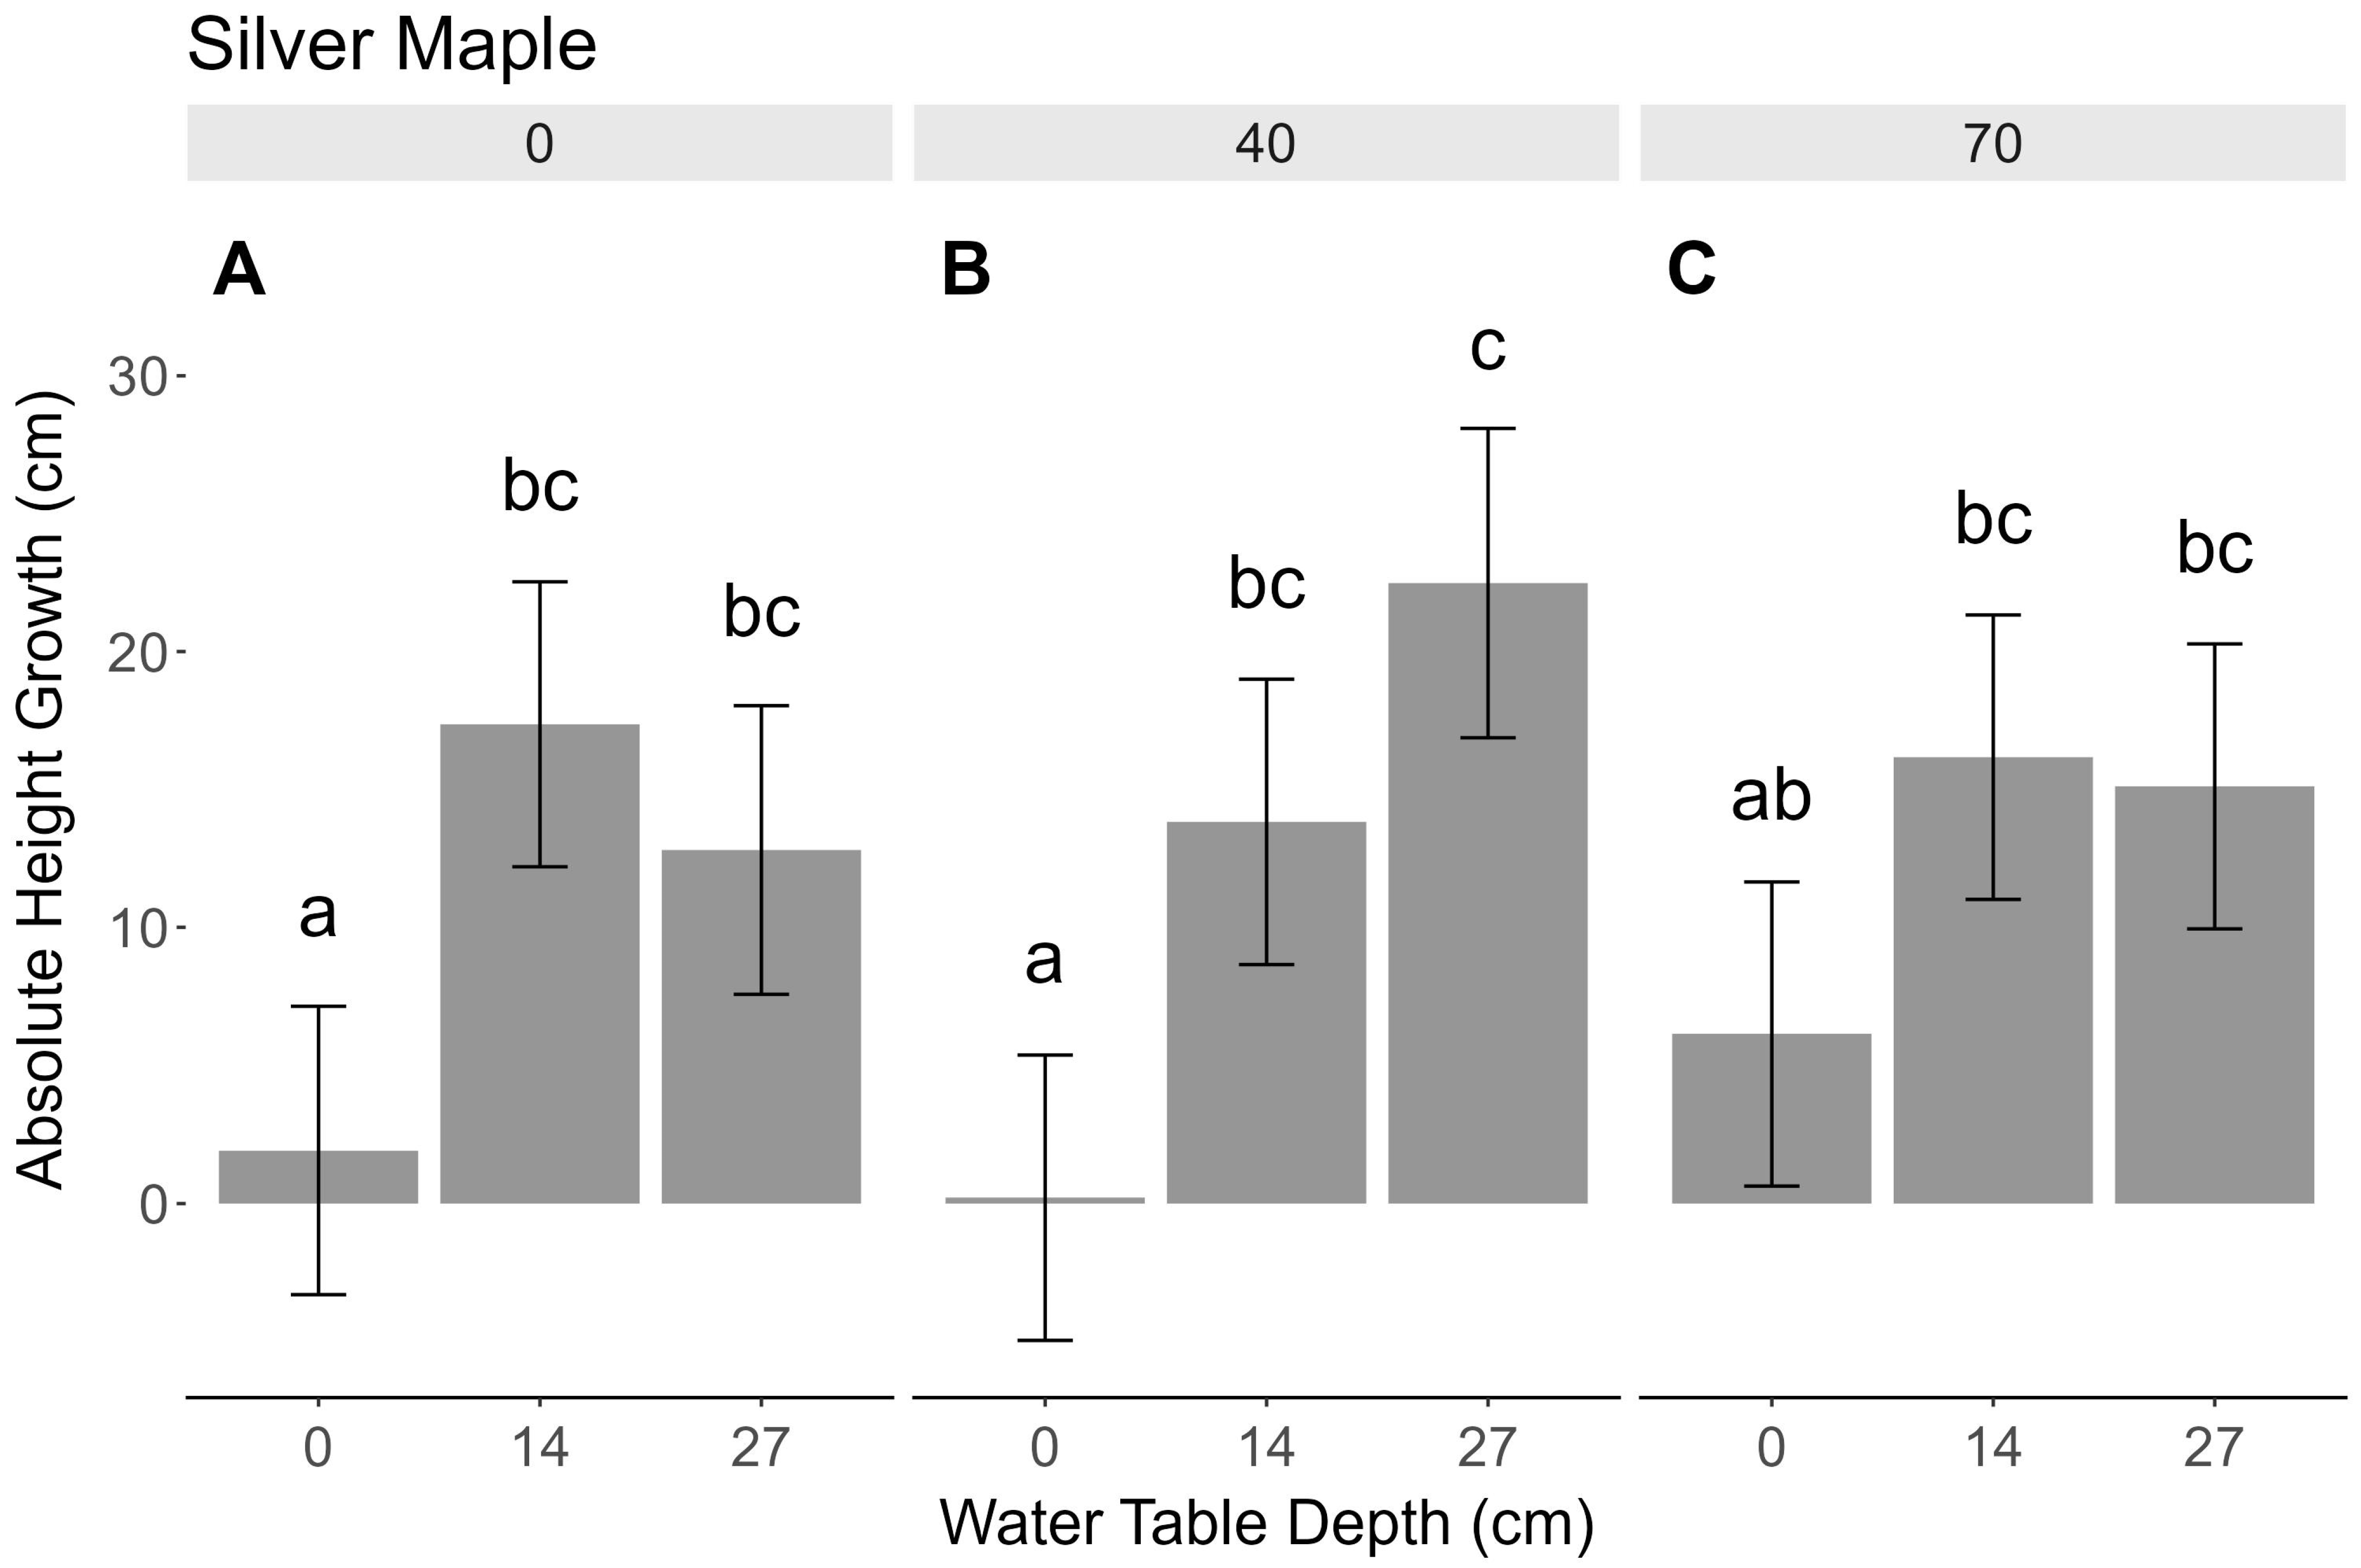
For ease of interpretation, four general patterns were used to group the species according to their growth and leaf gas exchange response to water table depth (Table 2). Species that exhibited interaction effects between water table depth and another independent variable are discussed separately from these groupings. The species with inconclusive results (pattern 1) for the given response variable possessed very low growth values and gas exchange rates that were not significantly different from one another across all treatment levels. Species that exhibited significantly greater growth values and gas exchange rates in the 27 cm water table depth treatment versus the 0 cm treatment were grouped into pattern 2. Species in pattern 3 exhibited significantly higher growth values and gas exchange rates in both the 27 and 14 cm water table depth treatments compared to the 0 cm treatment. Species in pattern 4 exhibited high growth values and gas exchange rates that were not significantly different from one another across all water table depth treatment levels.

3.3. Height Growth

For the response variable of absolute height growth, pattern 1 included eastern white pine (Pinus strobus L.), white oak, bitternut hickory (Carya cordiformis (Wangenh.) K. Koch), bur oak, and red pine (Pinus resinosa Aiton) (Table S4). For this group, the absolute height growth ranged from −4 to 3 cm. Pattern 2 included bald cypress, swamp white oak, northern red oak, and black walnut (Figure 1). For this group, height growth decreased (range: 30%–220%) between the 27 cm treatment and the 0 cm water table depth treatments. Sugar maple (Acer saccharum Marshall), hackberry, American sycamore, trembling aspen, American elm, yellow birch (Betula alleghaniensis Britton), and river birch fell into pattern 3. In this group, height growth decreased between both the 14 and the 0 cm treatment (range: 55%–1895%) and the 27 and the 0 cm treatment (range: 55%–1375%). These extremely high percentages are due to stem dieback in the fully flooded treatment. None of the species fell into pattern 4 for absolute height growth.
There was a significant interaction between water table depth and light reduction for the absolute height growth of silver maple, basswood (Tilia americana L.), white spruce (Picea glauca (Moench) Voss), black spruce, northern white cedar, and tamarack (Table S6) that manifested similar to pattern 3 described above. Regardless of light treatment, growth decreased between both the 14 and 0 cm water table depth treatment (range 60%–100%) and the 27 and 0 cm treatments (range: 60%–100%) for all species with interactions except red maple (Table S7). Using silver maple as an example, the 40% light reduction treatment tended to show the strongest positive relationship between increasing water table depth and increasing absolute height growth (Figure 2). Additionally, silver maple clearly exhibited the trend of seedlings with a water table depth of 0 cm growing significantly less than their counterparts at 14 cm and 27 cm water table depths (Figure 2). No trends were evident for the interaction of water table depth and light reduction for red maple (Table S7).
In comparison to the water table depth, light reduction had minimal impact on absolute height growth. There was a main effect of light reduction on absolute height growth for these three species (Table S6, Figure S2). The growth of northern red oak and American sycamore decreased between the 40 and 0% light reduction treatments (range: 10%–250%) and the 40 and 70% treatments (range: 45%–145%). Black walnut grew significantly less in the 40% light reduction treatment compared to the 70% treatment (190% decrease, Figure S2).

3.4. Basal Diameter Growth
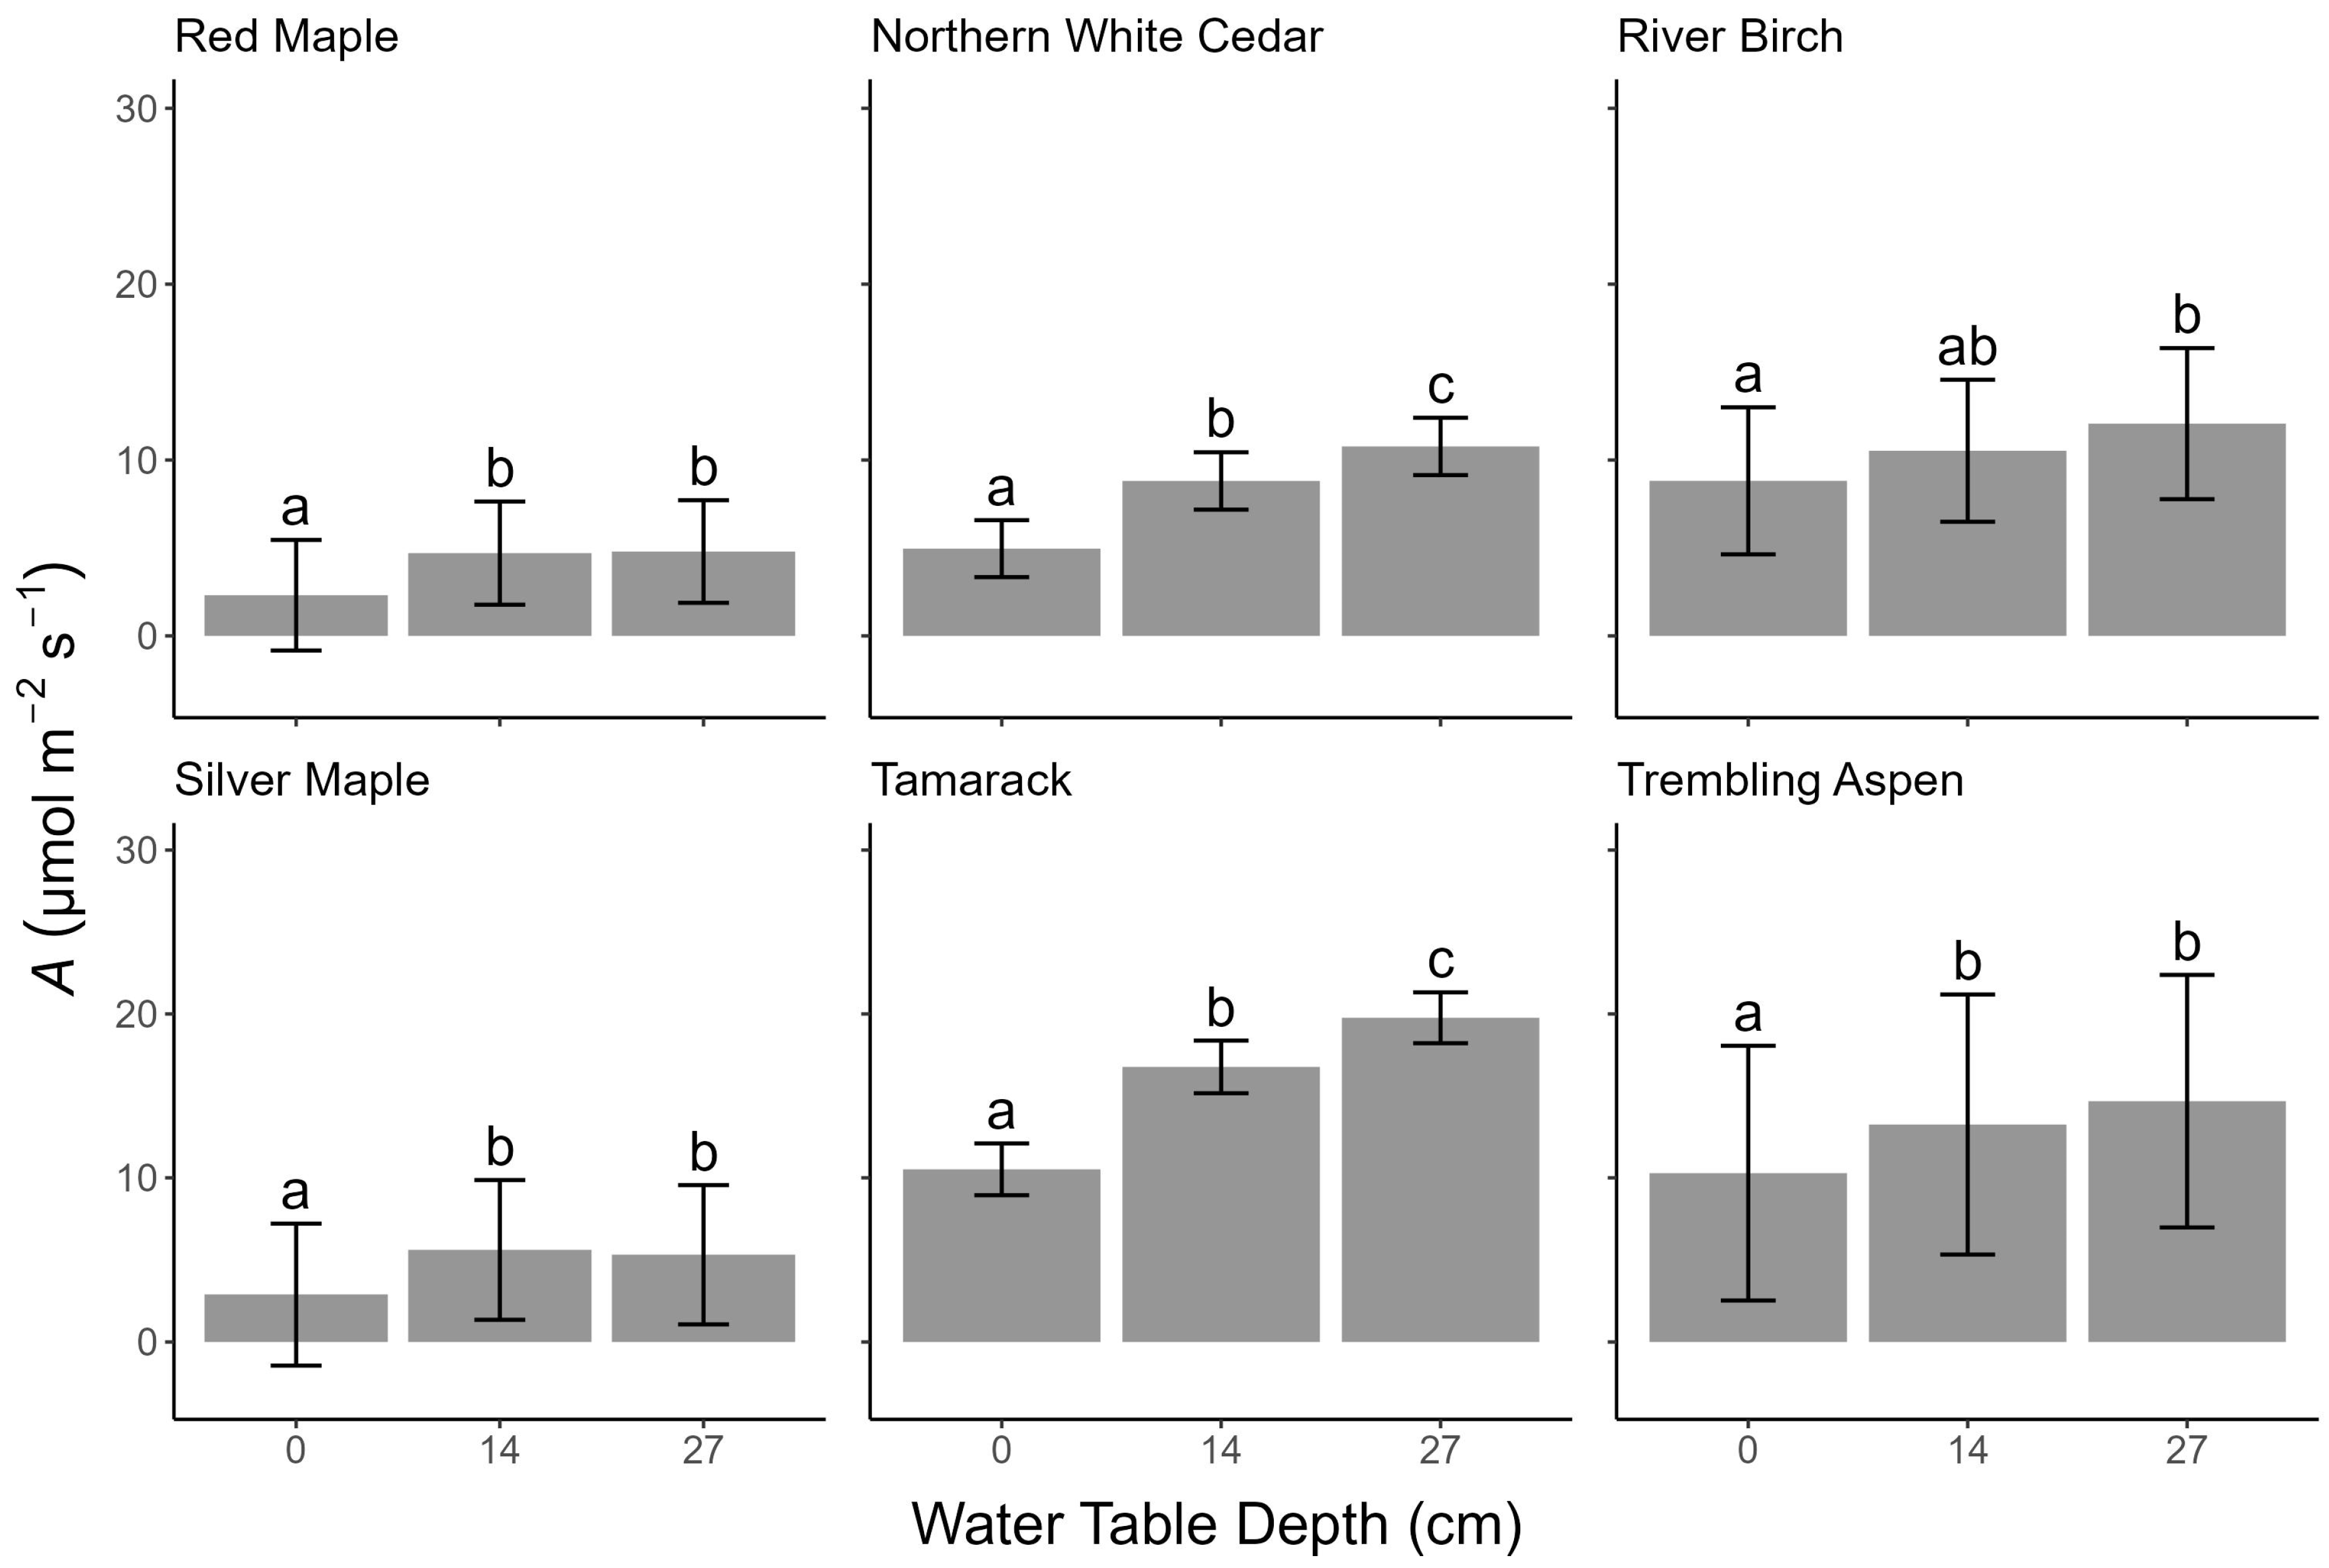
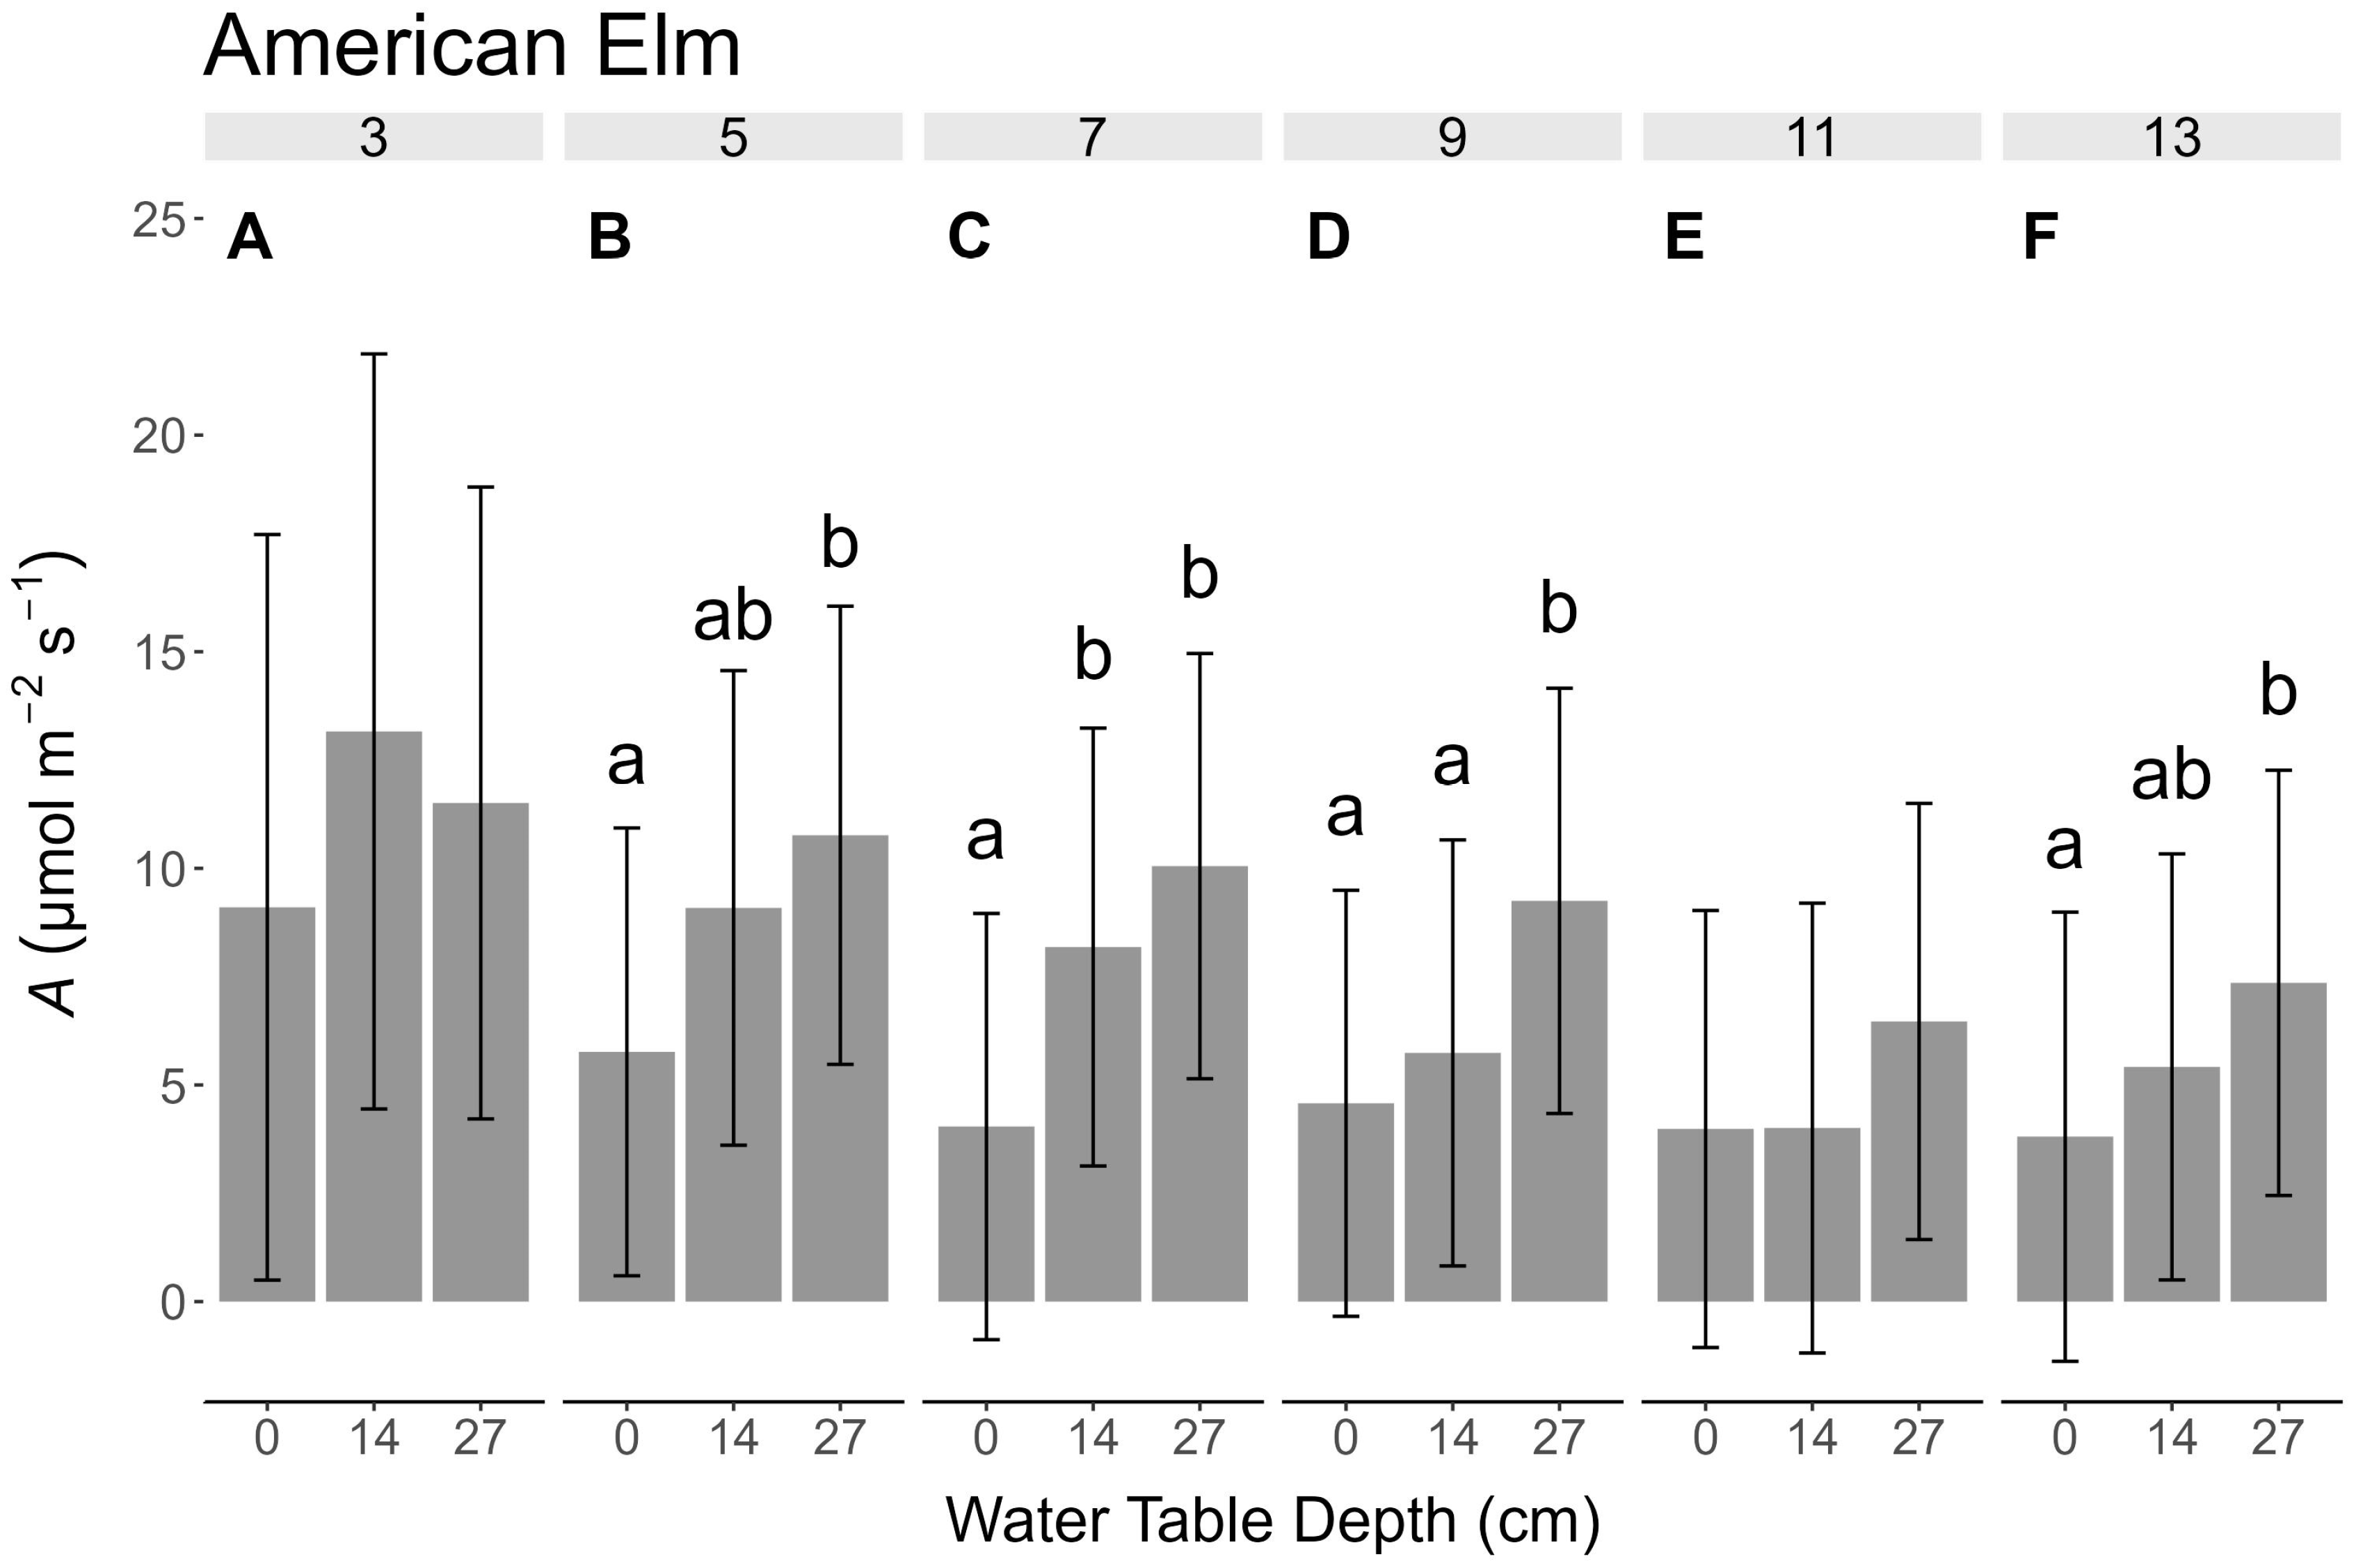
For absolute basal diameter growth, sugar maple, bitternut hickory, black walnut, eastern white pine, and northern red oak exhibited response pattern 1. These species grew only 0.3 mm, on average, regardless of the treatment (Table S4). Pattern 2 included northern white cedar and red pine (Figure S3). The basal diameter growth of these species decreased between the 27 and 0 cm water table depths (range: 45%–85%). Pattern 3 included yellow birch, silver maple, black spruce, tamarack, trembling aspen, hackberry, and American elm. The basal diameter growth for these species decreased between both the 27 and 0 cm water table depth treatments (range: 60%–115%) and the 14 and 0 cm treatments (range: 60%–135%, Figure S3). Finally, river birch and bald cypress exhibited pattern 4, where basal diameter growth was relatively high regardless of the water table depth treatment (range: 1.9–3.8 mm, Figure S3).
Similar to height growth, light reduction had a limited effect on absolute basal diameter growth in comparison to the water table depth; only four species had significant main effects of light reduction on the basal diameter growth (Table S6). The growth of black spruce, hackberry, and bald cypress decreased significantly (range: 30%–85%) in the 70% light reduction treatment compared to the 0% treatment, while the growth of tamarack decreased significantly (range: 35%–40%) in the 70% treatment compared to both the 0 and 40% light reduction treatments (Figure S4). There was also a significant interaction between the water table and light reduction for the absolute basal diameter growth of red maple, swamp white oak, white oak, American sycamore, basswood, bur oak, and white spruce (Table S6). However, multiple comparisons failed to detect any meaningful differences, and the visual examination did not reveal any notable patterns (Table S7).

3.5. Photosynthesis

There was a significant main effect of water table depth on photosynthesis for six species (Table S8). Of these species, river birch fell into pattern 2 (exhibiting a 25% decrease in the photosynthetic rate between the 27 cm and 0 cm water table depth treatments). Pattern 3 included tamarack, silver maple, trembling aspen, northern white cedar, and red maple. The photosynthetic rate for these species decreased between both the 14 and 0 cm water table depth treatments (range: 20%–50%) and the 27 and 0 cm treatments (range: 30%–55%, Figure 3). Trembling aspen and tamarack exhibited the highest photosynthetic rates overall, followed by northern white cedar and river birch, and finally red maple and silver maple (range: 2.5–20 µmol m−2 s−1, Figure 3). There was a significant interaction between the sample date and water table depth for the photosynthetic rate of swamp white oak, American elm, and bur oak (Table S8). Regardless of the sample date, the 0 cm water table depth treatment tended to result in the lowest photosynthetic rates for all three species. American elm seedlings, for example, exposed to the water table at 0 cm photosynthesized roughly 35% less, on average, than those in the 14 cm and 27 cm treatments (Figure 4).
Following a similar trend to height and basal diameter, light reduction had fewer significant main effects on photosynthetic rate than the water table depth (Table S8). River birch was the only species that responded significantly to light reduction, with photosynthesis rates that were 25% lower under the 70% light reduction treatment compared to the 0% treatment (Figure S5). There was a significant interaction between light reduction and sample date for the photosynthetic rate of swamp white oak, American elm, northern white cedar, and tamarack (Table S8). Multiple comparisons failed to detect any meaningful differences, and visual examination did not reveal any notable patterns for either of these interactions (Table S10). There was a significant interaction between the water table depth and light reduction treatment for the photosynthetic rate of American sycamore, hackberry, bur oak, and bald cypress, but again, multiple comparisons failed to detect any meaningful differences, and the visual examination did not reveal any notable patterns for either of these interactions (Table S10).

3.6. Stomatal Conductance

For stomatal conductance, red maple exhibited response pattern 1 with a rate of only 0.15 mol m−2 s−1 regardless of the treatment (Figure S6). Swamp white oak was the only species in pattern 2 (with a 35% decrease between 27 cm and 0 cm water table depths, Figure S6). Pattern 3 included hackberry, bur oak, trembling aspen, and tamarack. Stomatal conductance for these species decreased between both the 27 and 0 cm water table depth treatments (range: 40%–80%) and the 14 and 0 cm treatments (range: 35%–70%, Figure S6). Finally, American sycamore, bald cypress, American elm, and river birch exhibited pattern 4, where stomatal conductance was relatively high regardless of the water table depth treatment (range: 0.137–0.258 mol m−2 s−1, Figure S6). Northern white cedar was the only species that showed a significant response in stomatal conductance to the interaction of the water table depth and sample date (Table S8), which was largely driven by declines in stomatal conductance over time for all water table depth treatments.
There was no main effect of light reduction on stomatal conductance (Table S8, Figure S7), but there was significant interaction between the light reduction treatment and the sample date for river birch, American elm, swamp white oak, American sycamore, and bur oak (Table S8). Generally, the difference in stomatal conductance at each of the light levels was small except at around week 11, when it expanded greatly before decreasing again at week 13 (a decrease in difference from 0.75 to 0.05 mol m−2 s−1 in week 13.
The stomatal conductance rate of silver maple exhibited a significant response to the interaction of the sample date, light reduction, and water table depth (Table S8). The only noticeable trend in this interaction was that across weeks and light reduction treatments, the 0 cm water table depth treatment had the lowest stomatal conductance rates (range: 0.01–0.10 mol m−2 s−1). Of the light reduction treatments within the 0 cm water table depth treatment across weeks, the 40% reduction treatment had the highest stomatal conductance rates (range: 0.02–0.09 mol m−2 s−1, Table S10).

3.7. Transpiration

For transpiration, red maple exhibited response pattern 1, with a rate of only 1 mmol m−2 s−1 regardless of the treatment (Figure 5). Swamp white oak and northern white cedar were the only species in pattern 2. The transpiration rate for these species decreased (range: 45%–60%) between the 27 and 0 cm water table depth treatments (Figure 5). Pattern 3 included hackberry, silver maple, trembling aspen, river birch, American elm, American sycamore, and tamarack. The transpiration rate for these species dropped between both the 27 and 0 cm water table depth treatments (range: 30%–75%) and the 14 and 0 cm treatments (range: 25%–65%, Figure 5). Finally, bald cypress exhibited pattern 4, where transpiration was relatively high regardless of the water table depth treatment (4 mmol m−2 s−1, on average, Figure 5). Bur oak was the only species that showed a significant response in transpiration to the interaction of the water table depth and sample date; no trend was apparent.
The main effect of light reduction on transpiration was not significant for any species (Table S8, Figure S8), but there was a significant interaction between the gas exchange measurement date and light reduction treatment for the transpiration rates of silver maple, American elm, river birch, American sycamore, and bur oak (Table S8). Generally, the difference in transpiration at each of the light levels was small except for around week 11, when it expanded greatly before decreasing again at week 13 (a decrease in difference from 5.5 to 0.5 mmol m−2 s−1 in week 13).

4. Discussion

The predicted increase in extreme flooding events under future climate change scenarios, in combination with widespread forested wetland degradation, has created a challenging situation for natural resource managers [43]. In situations where artificial regeneration via tree enrichment planting has been chosen as a management strategy, practitioners require detailed information about the suitability of each species to local conditions [44]. The purpose of this study was to provide information about shade and flood tolerances, which are traits critical to establishment in wetlands, with tree species being considered for forested wetland restoration in the Great Lakes region. Results from this study indicate that flooding tolerance has a greater influence on the growth and physiology of tree seedlings than shade tolerance. For this reason, the bulk of the discussion examines the flooding tolerance of the species studied; these are split into the following four groups: high tolerance, intermediate tolerance, low tolerance, and inconclusive. Flooding tolerance groups were created by qualitatively synthesizing patterns (Table 2) among flooding responses, including those with interactions, for all dependent variables for each species.

4.1. Water Table Depth

Three species exhibited high flooding tolerance during this study as follows: bald cypress, river birch, and American sycamore. Bald cypress, particularly in its physiological response, was unique among the species in its ability to survive and thrive in flooded conditions. The photosynthesis, transpiration, and stomatal conductance rates of bald cypress remained high regardless of the water table depth treatment. This finding is corroborated by Frye and Grosse [45], who reported that, of the 23 species studied, bald cypress stood out in its ability to maintain robust growth rates despite being flooded in a controlled experiment to 10 cm above the soil surface for 120 days. These results indicate that, in terms of flood tolerance, bald cypress may be an excellent candidate for enrichment planting in forested wetlands that are fully flooded for the entire growing season. However, additional studies are necessary to determine its cold hardiness, as its current range extends only to southern Illinois, USA [46]. Future changes in climate may extend its climatically suitable range northward, possibly making this species a candidate for assisted migration in forested wetlands [47]. Managers need to consider this strategy in concert with diverse stakeholders and knowledge bases [48]. American sycamore and river birch also exhibited a suite of responses indicating that they are well-suited to water table depths between 0 and 14 cm below the soil surface throughout the growing season. These results are consistent with the silvics of these species, which describes them as being commonly found in bottomlands and floodplains [49,50].
The largest cohort of species exhibited intermediate tolerance for flooding, or in the terms of this experiment, tolerance for a water table depth between 14 and 27 cm for the duration of the growing season. The species that fell into this category were bur oak, swamp white oak, hackberry, silver maple, basswood, white spruce, black spruce, northern white cedar, tamarack, trembling aspen, American elm, and yellow birch. These species are potential candidates for enrichment planting in forested wetlands that are only inundated to the soil surface for part of the growing season or have at least 14 cm of well-drained soil for the duration of the growing season. Previous work generally supports this classification for these species. Barnes and Wagner [50] describe bur oak as competitive in “low, seasonally wet bottomlands” and swamp white oak as being found in “deciduous swamps and borders of swamps and along streams” in Michigan. Silver maple, hackberry, and American elm are dominant species in floodplains in the Midwest [51,52]. Boulfroy et al. [53] described northern white cedar as “more frequent in depressions and imperfectly to very poorly drained soils”. Black spruce and tamarack are commonly found in frequently inundated peatlands [54]. While they can be found on a variety of other sites, basswood, yellow birch, trembling aspen, and white spruce have been known to occupy lowlands, especially on well-drained microsites [46,50,55].
One benefit to having such a large number of species that can survive water table depths between 14 and 27 cm for the entire growing season is the wide geographic range these species encompass. Swamp white oak currently reaches its northern limit in central Minnesota, while white and black spruce reach all the way to northern Alaska [46,56]. The remaining intermediate flood-tolerant species fall between these two extremes. Given that the current habitat range of these species includes the Great Lakes region, managers may have reliable access to seedlings of these species at local nurseries. Additionally, these species will likely be able to survive the long, cold winters in this region. One drawback to using species that already occur in this region, however, is that not all of them are predicted to perform well under climate change as they increasingly become maladapted to local conditions. Mid-tolerant species predicted to do poorly under the future climate are black and white spruce, trembling aspen, tamarack, and yellow birch [57].
The responses of northern red oak, sugar maple, black walnut, and red pine indicate that they have low flooding tolerance and are not viable options for enrichment planting in forested wetlands, especially those experiencing climate-induced extreme flooding events. Black walnut was also the only species to exhibit a negative survival response to the decreasing water table depth. This response matches the results of Coggeshall et al. [58], who found that, in a controlled experiment in Missouri, black walnut had a survival rate of 12.5% after being exposed to 5 weeks of 15 cm of deep-flowing or stagnant water. Finally, the determination of these species as generally unsuitable for enrichment planting in wetlands aligns well with the USDA PLANTS database classification of these species, which are classed as facultative/obligate to facultative upland status. When these species occur in lowlands, they are likely to inhabit microsites with lower water tables [46].
The final group of species consists of those that exhibited very low growth rates regardless of the treatment; therefore, an analysis of their flooding tolerance was inconclusive. This group included eastern white pine, white oak, bitternut hickory, and red maple. White oak may have been allocating most of its energy to root growth, as is common for oak seedlings [59]. The inconclusive finding for red maple was not expected, as it performed much better and similar to species in the mid-tolerant group during a preliminary study we conducted in the preceding year. Similarly, Hosner & Leaf [60] determined that red maple has intermediate flood tolerance following a 60-day flooding experiment. Given this, it is possible that the low growth and physiological rates of red maple in this study were due to poor stock or subpar handling conditions. In general, it is difficult to draw conclusions about the suitability of this group for enrichment planting in forested wetlands due to their overall poor response to the conditions of this study.

4.2. Transpiration

Overstory transpiration can play a critical role in wetland forest hydrology and, by extension, vegetation community composition [61]. Therefore, it is important to explicitly comment on the transpiration rates of the species studied. Bald cypress, tamarack, trembling aspen, river birch, and American sycamore stood out in their ability to maintain robust transpiration rates regardless of the water table depth treatment. These results are supported by Parker [62], who found that bald cypress maintained “outstandingly high” rates of transpiration during and after flooding to 5 cm above the soil surface for a month in a greenhouse. Similarly, Calvo-Polanco et al. [63] found that after six months of flooding to 5 cm below the soil surface in a greenhouse, tamarack seedlings in the flooded treatment group exhibited no significant difference in their transpiration rate from the control seedlings. In contrast, Landhäusser et al. [13] found that trembling aspen had low transpiration rates after experiencing flooding for six weeks with a water table either 15 or 30 cm below the soil surface in a greenhouse. Further studies are needed to confirm the transpiration capacity of these species under flooded conditions, especially at later developmental stages in field settings. If high transpiration is maintained, these species can be good candidates for enrichment planting to maintain the hydrologic regime of forested wetland ecosystems subjected to widespread canopy loss [31].

4.3. Light Reduction

In comparison to water table depth, light reduction had very little effect on the response variables studied for all the species. None of the species exhibited trends to light reduction treatments across the response variables measured. One possible reason for this lack of response is that most species are still light-saturated even in the 70% reduction treatment. For example, in a controlled study conducted by Foote & Schaedle [64], trembling aspen reached light saturation between 160 and 280 µmol m−2 s−1, which is still considerably lower than the maximum light available in the 70% light reduction treatment (595 µmol m−2 s−1). In addition, flooding could have lowered the light saturation point of several of the species, allowing them to reach a maximum photosynthetic output even under the 70% light reduction treatment [65].
The light reduction treatments we chose were meant to mimic the relatively greater canopy openness of forested wetlands in this region compared to other forest types (e.g., black ash wetlands) [66]. While the light treatments may have more closely emulated forested wetlands, the growth results are still somewhat unexpected. Looney et al. [39], for example, found that the relative growth rate tended to decrease with the increasing leaf area index (LAI) in black ash wetlands.
The interaction between the light reduction and sample date for stomatal conductance and transpiration produced a trend that represents the only instance in this study where light reduction resulted in a common response. In this case, the species exhibited the strongest response to light reduction treatments during the eleventh week of treatment, when there was an unusually long span of sunny days during the study. Since theshade clothes caused the greatest difference in PAR between treatments on sunny days, this might explain the stronger response to light reduction treatment during this time. This may indicate that light reduction has had a stronger effect on the growth and physiological response of these species in a climate with fewer overcast days.

4.4. Study Limitations

The response variables measured in this study provide insights as to the conditions under which each species performs best over short and longer time periods. Seedling growth, and shoot growth in particular, has been shown to decrease in seedlings who are sensitive to flooding [15]. By observing the height growth of these seedlings, an immediate indicator of adaptation to flooded conditions was assessed. In contrast, the observation of gas exchange rates, particularly photosynthesis, provided an indication of how well these seedlings perform over longer periods of time. For example, the photosynthetic rate is positively related to root growth, which is a good indicator of establishment success in newly planted tree seedlings [67,68,69,70]. Taking all of these response variables and their almost universal response to water table depth into account, it was possible to group species according to the water table conditions in which they would be most successful over short and longer-term periods.
While the results of this study indicate that the light environment is not as critical to the physiological integrity and growth of tree seedlings as the water table depth, several limitations constrain the inference of these findings. First, this study does not explicitly consider seedling age at planting, which has been shown to have a positive relationship with survival in flooded environments [71]. Second, this study was only conducted over the course of one growing season. In a black ash wetland forest restoration study, Looney et al. [39] reported that the growth rate increased with decreasing LAI three years after planting. In a longer-term assessment of the same study, Palik et al. [66] reported that this relationship no longer fit the data eight years after planting. Clearly, longer-term studies are critical to the full understanding of the relationship between light availability and water table depth.
Additionally, this study was conducted in a microcosm setting that had both benefits and limitations. One of the benefits of microcosm studies is that they allow for the isolation of individual independent variables, making it easier to determine the response of explicit dependent variables [72]. However, microcosm experiments can differ in important ways from the natural systems they emulate. For example, the potting soil used in this study differs from the native soil found in any forested wetland in the Great Lakes Region. This difference, among others, creates uncertainty in determining whether these species are able to be successfully established in situ. Finally, microcosm experiments are limited in their ability to capture responses to the full range of variability in the field [73]. For example, water tables in forested wetlands fluctuate throughout the season [74], in contrast to the static depths used in this study.

5. Conclusions

Understanding flooding and shade tolerances in seedlings of specific tree species is critical to the restoration of forested wetlands, especially in the context of extreme flooding events caused by climate change [11]. Our study methods can be replicated to explore these tolerances in other species and in other regions. The results from this study indicate that flooding tolerance has a greater influence than shade tolerance on the growth and gas exchange rates of tree seedlings exposed to both stressors simultaneously. While this study’s duration was short, the measurement of both growth and physiological responses allowed for inferences to be made for seedlings’ responses in the immediate and longer term, respectively. Ultimately, bald cypress, American sycamore, and river birch exhibited the highest flood tolerances, while northern red oak, sugar maple, black walnut, and red pine exhibited the lowest. These results align with the silvics of these species. Most of the species studied showed high survival and moderate growth rates with intermediate flooding intensity (with the water table 14 cm below the soil surface). By examining flooding intensity and shade tolerance together in a microcosm setting, this study can help managers match tree species considered for enrichment planting to the site’s conditions.

Supplementary Materials

The following supporting information can be downloaded at: https://www.mdpi.com/article/10.3390/f15030530/s1, Figure S1. Image depicting the spacing and orientation of seedling pots in the stock tank. Table S1. Number of individuals browsed per species. Table S2. Species survival percentages across all treatments ranked highest (top) to lowest. Table S3. Survival analysis ANOVA results. Table S4. Estimated marginal means for absolute height and basal diameter growth for each water table treatment level based on linear mixed effects analysis with water table depth and light reduction as fixed effects. Table S5. Estimated marginal means for absolute height and basal diameter growth at each light reduction treatment level based on linear mixed effects analysis with water table and light reduction as fixed effects. Table S6. Morphology analysis ANOVA results. Table S7. Estimated marginal means for absolute height and basal diameter growth based on linear mixed effects analysis with water table depth and light reduction as fixed effects. Figure S2. Absolute seedling height growth at the end of the growing season for each light reduction treatment for 8 of the 23 species. Figure S3. Absolute seedling basal diameter growth at the end of the growing season for each water table depth treatment for 12 of the 23 species. Figure S4. Absolute seedling basal diameter growth at the end of the growing season for each light reduction treatment for 16 of the 23 species. Table S8. Gas exchange analysis ANOVA results. Table S9. Estimated marginal means for photosynthesis, stomatal conductance, and transpiration for each water table treatment level based on linear mixed effects repeated measures analysis with water table depth, light reduction, and sample date as fixed effects. Table S10. Estimated marginal means for photosynthesis, stomatal conductance, and transpiration based on linear mixed effects repeated measures analysis with water table depth, light reduction, and sample date as fixed effects. Figure S5. Estimated marginal mean photosynthetic rate at each light reduction treatment level for 4 of the 12 sample species. Figure S6. Estimated marginal mean stomatal conductance rate at each water table depth treatment level for 10 of the 12 sample species. Figure S7. Estimated marginal mean stomatal conductance rate at each light reduction treatment level for 5 of the 12 sample species. Figure S8. Estimated marginal mean transpiration rate at each light reduction treatment level for 6 of the 12 sample species.

Author Contributions

Conceptualization, R.A.S. and D.B.; methodology, G.J.K., R.A.S., D.B. and M.A.W.-C.; formal analysis, G.J.K.; investigation, G.J.K.; resources, D.B.; data curation, G.J.K.; writing—original draft preparation, G.J.K.; writing—review and editing, G.J.K., R.A.S., D.B. and M.A.W.-C.; visualization, G.J.K.; supervision, D.B., R.A.S. and M.A.W.-C.; project administration, D.B. and R.A.S.; funding acquisition, R.A.S. and D.B. All authors have read and agreed to the published version of the manuscript.

Funding

This research was funded by the Wisconsin Department of Natural Resources, the United States Department of Agriculture Forest Service Northern Research Station, the University of Minnesota Department of Forest Resources, and the Minnesota Forest Resources Council.

Data Availability Statement

Data will be made available upon request.

Acknowledgments

The authors greatly acknowledge Adam Wiese, Joel Flory, Alan Toczydlowski, Artur Stefanski, Chris Looney, and John Stanovick for their assistance with field work and data analysis. The authors also extend their gratitude to DNR personnel at the Boscobel Nursery for providing seedlings for this study and the University of Wisconsin Kemp Natural Resources Station for providing housing.

Conflicts of Interest

The authors declare no conflicts of interest.

References

  1. Knapp, A.K.; Beier, C.; Briske, D.D.; Classen, A.T.; Luo, Y.; Reichstein, M.; Smith, M.D.; Smith, S.D.; Bell, J.E.; Fay, P.A.; et al. Consequences of more extreme precipitation regimes for terrestrial ecosystems. Bioscience 2008, 58, 811–821. [Google Scholar] [CrossRef]
  2. Niu, S.; Luo, Y.; Li, D.; Cao, S.; Xia, J.; Li, J.; Smith, M.D. Plant growth and mortality under climatic extremes: An overview. Environ. Exp. Bot. 2014, 98, 13–19. [Google Scholar] [CrossRef]
  3. Tebaldi, C.; Hayhoe, K.; Arblaster, J.M.; Meehl, G.A. Going to the extremes: An intercomparison of model-simulated historical and future changes in extreme events. Clim. Chang. 2006, 79, 185–211. [Google Scholar] [CrossRef]
  4. Easterling, D.R.; Meehl, G.A.; Parmesan, C.; Changnon, S.A.; Karl, T.R.; Mearns, L.O. Climate extremes: Observations, modeling, and impacts. Science 2000, 289, 2068–2074. [Google Scholar] [CrossRef]
  5. Gutschick, V.P.; BassiriRad, H. Extreme events as shaping physiology, ecology, and evolution of plants: Toward a unified definition and evaluation of their consequences. New Phytol. 2003, 160, 21–42. [Google Scholar] [CrossRef]
  6. Stanturf, J.A.; Gardiner, E.S.; Shepard, J.P.; Schweitzer, C.J.; Portwood, C.J.; Dorri, L.C., Jr. Restoration of bottomland hardwood forests across a treatment intensity gradient. For. Ecol. Manag. 2009, 257, 1803–1814. [Google Scholar] [CrossRef]
  7. Campbell, D.; Keddy, P.A.; Broussard, M.; McFalls-Smith, T.B. Small changes in flooding have large consequences: Experimental data from ten wetland plants. Wetlands 2016, 36, 457–466. [Google Scholar] [CrossRef]
  8. Mitsch, W.J.; Hernandez, M.E. Landscape and climate change threats to wetlands of North and Central America. Aquat. Sci. 2013, 75, 133–149. [Google Scholar] [CrossRef]
  9. Kingsford, R.T.; Basset, A.; Jackson, L. Wetlands: Conservation’s poor cousins. Aquat. Conserv. Mar. Freshw. Ecosyst. 2016, 26, 892–916. [Google Scholar] [CrossRef]
  10. Casanova, M.T.; Brock, M.A. How do depth, duration and frequency of flooding influence the establishment of wetland plant communities? Plant Ecol. 2000, 147, 237–250. [Google Scholar] [CrossRef]
  11. Vervuren, P.J.A.; Blom CW, P.M.; De Kroon, H. Extreme flooding events on the Rhine and the survival and distribution of riparian plant species. J. Ecol. 2003, 91, 135–146. [Google Scholar] [CrossRef]
  12. Harms, W.R. Some effects of soil type and water regime on growth of tupelo seedlings. Ecology 1973, 54, 188–193. [Google Scholar] [CrossRef]
  13. Landhäusser, S.M.; Silins, U.; Lieffers, V.J.; Liu, W. Response of Populus tremuloides, Populus balsamifera, Betula papyrifera and Picea glauca seedlings to low soil temperature and water-logged soil conditions. Scand. J. For. Res. 2003, 18, 391–400. [Google Scholar] [CrossRef]
  14. Islam, M.A.; Macdonald, S.E. Ecophysiological adaptations of black spruce (Picea mariana) and tamarack (Larix laricina) seedlings to flooding. Trees 2004, 18, 35–42. [Google Scholar] [CrossRef]
  15. Kozlowski, T.T. Responses of woody plants to flooding and salinity. Tree Physiol. 1997, 17, 490. [Google Scholar] [CrossRef]
  16. Walsh, M.P.; Van Sambeek, J.W.; Coggeshall, M.V. Variation in flood tolerance of container-grown seedlings of swamp white oak, bur oak, and white oak. In Proceedings of the 16th Central Hardwood Forest Conference, West Lafayette, IN, USA, 8–9 April 2008; General Technical Report, NRS-P-24; Jacobs, D.F., Michler, C.H., Eds.; U.S. Department of Agriculture, Forest Service, Northern Research Station: Newtown Square, PA, USA, 2008; pp. 446–456. [Google Scholar]
  17. Kreuzwieser, J.; Rennenberg, H. Molecular and physiological responses of trees to waterlogging stress. Plant Cell Environ. 2014, 37, 2245–2259. [Google Scholar] [CrossRef] [PubMed]
  18. Kimmins, J.P. Forest ecology. In Fishes and Forestry: Worldwide Watershed Interactions and Management; Blackwell Publishing: Oxford, UK, 2004; pp. 17–43. [Google Scholar]
  19. Loach, K. Shade Tolerance in Tree Seedlings: I. Leaf Photosynthesis and Respiration in Plants Raised Under Artificial Shade. New Phytol. 1967, 66, 607–621. [Google Scholar] [CrossRef]
  20. Mielke, M.S.; Schaffer, B. Leaf gas exchange, chlorophyll fluorescence and pigment indexes of Eugenia uniflora L. in response to changes in light intensity and soil flooding. Tree Physiol. 2010, 30, 45–55. [Google Scholar] [CrossRef]
  21. Valladares, F.; Niinemets, Ü. Shade tolerance, a key plant feature of complex nature and consequences. Annu. Rev. Ecol. Evol. Syst. 2008, 39, 237–257. [Google Scholar] [CrossRef]
  22. Lavinsky, A.O.; De Souza Sant’Ana, C.; Mielke, M.S.; De Almeida, A.A.F.; Gomes, F.P.; França, S.; Da Costa Silva, D. Effects of light availability and soil flooding on growth and photosynthetic characteristics of Genipa americana L. seedlings. New For. 2007, 34, 41–50. [Google Scholar] [CrossRef]
  23. Hopkins, W.; Hüner, N. Introduction to Plant Physiology, 4th ed.; Wiley: Hoboken, NJ, USA, 2009. [Google Scholar]
  24. Mielke, M.S.; Schaffer, B. Effects of soil flooding and changes in light intensity on photosynthesis of Eugenia uniflora L. seedlings. Acta Physiol. Plant. 2011, 33, 1661–1668. [Google Scholar] [CrossRef]
  25. Wang, X.; Liu, T.; Li, C.; Chen, H. Effects of soil flooding on photosynthesis and growth of Zea mays L. seedlings under different light intensities. Afr. J. Biotechnol. 2012, 11, 7676–7685. [Google Scholar]
  26. Wagner, P.A.; Dreyer, E. Interactive effects of waterlogging and irradiance on the photosynthetic performance of seedlings from three oak species displaying different sensitivities (Quercus robur, Q. petraea and Q. rubra). Ann. For. Sci. 1997, 54, 409–429. [Google Scholar] [CrossRef]
  27. Porporato, A.; Daly, E.; Rodriguez-Iturbe, I. Soil water balance and ecosystem response to climate change. Am. Nat. 2004, 164, 625–632. [Google Scholar] [CrossRef] [PubMed]
  28. Kreyling, J.; Wenigmann, M.; Beierkuhnlein, C.; Jentsch, A. Effects of extreme weather events on plant productivity and tissue die-back are modified by community composition. Ecosystems 2008, 11, 752–763. [Google Scholar] [CrossRef]
  29. Byun, K.; Chiu, C.M.; Hamlet, A.F. Effects of 21st century climate change on seasonal flow regimes and hydrologic extremes over the Midwest and Great Lakes region of the US. Sci. Total Environ. 2019, 650, 1261–1277. [Google Scholar] [CrossRef] [PubMed]
  30. Granger, J.J.; Zobel, J.M.; Buckley, D.S. Differential Impacts of Emerald Ash Borer (Agrilus planipennis Fairmaire) on Forest Communities Containing Native Ash (Fraxinus spp.) Species in Eastern North America. For. Sci. 2020, 66, 38–48. [Google Scholar] [CrossRef]
  31. Stanturf, J.A.; Schoenholtz, S.H.; Schweitzer, C.J.; Shepard, J.P. Achieving restoration success: Myths in bottomland hardwood forests. Restor. Ecol. 2001, 9, 189–200. [Google Scholar] [CrossRef]
  32. Stanturf, J.A.; Conner, W.H.; Gardiner, E.S.; Schweitzer, C.J.; Ezell, A.W. Recognizing and overcoming difficult site conditions for afforestation of bottomland hardwoods. Ecol. Restor. 2004, 22, 183–193. [Google Scholar] [CrossRef]
  33. Pedlar, J.H.; McKenney, D.W.; Aubin, I.; Beardmore, T.; Beaulieu, J.; Iverson, L.; O’Neill, G.A.; Winder, R.S.; Ste-Marie, C. Placing forestry in the assisted migration debate. BioScience 2012, 62, 835–842. [Google Scholar] [CrossRef]
  34. Keller, G.J.; Slesak, R.A.; Bronson, D.; Windmuller-Campione, M.A.; McGraw, A. Effects of flood duration on seedling survival and growth of potential replacement species in black ash (Fraxinus nigra Marshall) forests threatened by emerald ash borer. Trees For. People 2023, 11, 100367. [Google Scholar] [CrossRef]
  35. Bermudez, R.; Stefanski, A.; Montgomery, R.A.; Reich, P.B. Short-and long-term responses of photosynthetic capacity to temperature in four boreal tree species in a free-air warming and rainfall manipulation experiment. Tree Physiol. 2021, 41, 89–102. [Google Scholar] [CrossRef]
  36. Kramer, P.J.; Kozlowski, T.T. Physiology of Woody Plants; Academic Press: Orlando, FL, USA, 1979. [Google Scholar]
  37. Hupperts, S.F.; Webster, C.R.; Froese, R.E.; Dickinson, Y.L. Seedling and sapling recruitment following novel silvicultural treatments in Great Lakes northern hardwoods. For. Ecol. Manag. 2020, 462, 117983. [Google Scholar] [CrossRef]
  38. Lenth, R.; Singmann, H.; Love, J.; Buerkner, P.; Herve, M. Emmeans: Estimated Marginal Means, aka Least-Squares Means; R Package Version 1; R Foundation for Statistical Computing: Vienna, Austira, 2019. [Google Scholar]
  39. Looney, C.E.; D’Amato, A.W.; Palik, B.J.; Slesak, R.A. Canopy treatment influences growth of replacement tree species in Fraxinus nigra forests threatened by the emerald ash borer in Minnesota, USA. Can. J. For. Res. 2017, 47, 183–192. [Google Scholar] [CrossRef]
  40. Luo, D.; Ganesh, S.; Koolaard, J.; Luo, M.D. Package ‘Predictmeans’. 2018. Available online: https://CRAN.R-project.org/package=predictmeans (accessed on 15 December 2021).
  41. Bronson, D.R.; Gower, S.T.; Tanner Mm Linder, S.; Van Herk, I. Response of soil surface CO2 flux in a boreal forest to ecosystem warming. Glob. Chang. Biol. 2008, 14, 856–867. [Google Scholar] [CrossRef]
  42. Fox, J.; Weisberg, S. An R Companion to Applied Regression; Sage Publications: Thousand Oaks, CA, USA, 2018. [Google Scholar]
  43. Middleton, B.A.; Souter, N.J. Functional integrity of freshwater forested wetlands, hydrologic alteration, and climate change. Ecosyst. Health Sustain. 2016, 2, e01200. [Google Scholar] [CrossRef]
  44. Kabrick, J.M.; Dey, D.C.; Van Sambeek, J.W.; Coggeshall, M.V.; Jacobs, D.F. Quantifying flooding effects on hardwood seedling survival and growth for bottomland restoration. New For. 2012, 43, 695–710. [Google Scholar] [CrossRef]
  45. Frye, J.; Grosse, W. Growth Responses to Flooding and Recovery of Deciduous Trees. Z. Naturforschung C 1992, 47, 683–689. [Google Scholar] [CrossRef]
  46. Burns, R.; Honkala, B. Silvics of North America; United States Forest Service: Washington, DC, USA, 1990. [Google Scholar]
  47. Iverson, L.R.; Prasad, A.M.; Matthews, S.N.; Peters, M. Estimating potential habitat for 134 eastern US tree species under six climate scenarios. For. Ecol. Manag. 2008, 254, 390–406. [Google Scholar] [CrossRef]
  48. Hagerman, S.; Kozak, R. isentangling the social complexities of assisted migration through deliberative methods. J. Ecol. 2021, 109, 2309–2316. [Google Scholar] [CrossRef]
  49. Tang, Z.C.; Kozlowski, T.T. Ethylene production and morphological adaptation of woody plants to flooding. Can. J. Bot. 1984, 62, 1659–1664. [Google Scholar] [CrossRef]
  50. Barnes, B.V.; Wagner, W.H. Michigan Trees, Revised and Updated: A Guide to the Trees of the Great Lakes Region; University of Michigan Press: Ann Arbor, MI, USA, 2004. [Google Scholar]
  51. Peterson, D.; Bazzaz, F. Photosynthetic and growth responses of silver maple (Acer saccharinum L.) seedlings to flooding. Am. Midl. Nat. 1984, 112, 261–272. [Google Scholar] [CrossRef]
  52. Guyon, L.; Battaglia, L. Ecological characteristics of floodplain forest reference sites in the Upper Mississippi River System. For. Ecol. Manag. 2018, 427, 208–216. [Google Scholar] [CrossRef]
  53. Boulfroy, E.; Forget, E.; Hofmeyer, P.V.; Kenefic, L.S.; Larouche, C.; Lessard, G.; Lussier, J.; Pinto, F.; Ruel, J.; Weiskittel, A. Silvicultural Guide for Northern White-Cedar (Eastern White Cedar); Gen. Tech. Rep. NRS-98; U.S. Department of Agriculture, Forest Service, Northern Research Station: Newtown Square, PA, USA, 2012; 74p. [Google Scholar]
  54. Lieffers, V.; Rothwell, R. Effects of depth of water table and substrate temperature on root and top growth of Picea mariana and Larix laricina seedlings. Can. J. For. Res. 1986, 16, 1201–1206. [Google Scholar] [CrossRef]
  55. Gilbert, A.M. Silvical Characteristics of Yellow Birch (Betula alleghaniensis); Station Paper NE-134; U.S. Department of Agriculture, Forest Service, Northeastern Forest Experiment Station: Upper Darby, PA, USA, 1960; 18p. [Google Scholar]
  56. Heinselman, M.L. Silvical Characteristics of Black Spruce (Picea mariana) (No. 45); Lake States Forest Experiment Station, Forest Service, US Department of Agriculture: Washington, DC, USA, 1957. [Google Scholar]
  57. Iverson, L.; Knight, K.S.; Prasad, A.; Herms, D.A.; Matthews, S.; Peters, M.; Smith, A.; Hartzler, D.M.; Long, R.; Almendinger, J. Potential Species Replacements for Black Ash (Fraxinus nigra) at the Confluence of Two Threats: Emerald Ash Borer and a Changing Climate. Ecosystems 2016, 19, 248–270. [Google Scholar] [CrossRef]
  58. Coggeshall, M.V.; Van Sambeek, J.W.; Schlarbaum, S.E. Genotypic variation in flood tolerance of black walnut and three southern bottomland oaks. In Proceedings of the 15th Central Hardwood Forest Conference, Knoxville, TN, USA, 27 February 27–1 March 2006; Buckley, D.S., Clatterbuck, W.K., Eds.; e-Gen. Tech. Rep. SRS-101; U.S. Department of Agriculture, Forest Service, Southern Research Station: Washington, DC, USA, 2007; pp. 629–637. [Google Scholar]
  59. Shifley, P.; Rogers, S.; Dey, R.; Kabrick, D.; Johnson, J.; Rogers, R. The Ecology and Silviculture of Oaks, 3rd ed.; CABI: Wallingford, UK; Boston, MA, USA, 2019. [Google Scholar]
  60. Hosner, J.F.; Leaf, A.L. The effect of soil saturation upon the dry weight, ash content, and nutrient absorption of various bottomland tree seedlings. Soil Sci. Soc. Am. J. 1962, 26, 401–404. [Google Scholar] [CrossRef]
  61. Flower, C.E.; Lynch, D.J.; Knight, K.S.; Gonzalez-Meler, M.A. Biotic and abiotic drivers of sap flux in mature green ash trees (Fraxinus pennsylvanica) experiencing varying levels of emerald ash borer (Agrilus planipennis) infestation. Forests 2018, 9, 301. [Google Scholar] [CrossRef]
  62. Parker, J. The effects of flooding on the transpiration and survival of some southeastern forest tree species. Plant Physiol. 1950, 25, 453. [Google Scholar] [CrossRef] [PubMed]
  63. Calvo-Polanco, M.; Señorans, J.; Zwiazek, J.J. Role of adventitious roots in water relations of tamarack (Larix laricina) seedlings exposed to flooding. BMC Plant Biol. 2012, 12, 1–9. [Google Scholar] [CrossRef]
  64. Foote, K.C.; Schaedle, M. Physiological characteristics of photosynthesis and respiration in stems of Populus tremuloides Michx. Plant Physiol. 1976, 58, 91–94. [Google Scholar] [CrossRef]
  65. Gardiner, E.S.; Krauss, K.W. Photosynthetic light response of flooded cherrybark oak (Quercus pagoda) seedlings grown in two light regimes. Tree Physiol. 2001, 21, 1103–1111. [Google Scholar] [CrossRef] [PubMed]
  66. Palik, B.J.; D’Amato, A.W.; Slesak, R.A.; Kastendick, D.; Looney, C.; Kragthorpe, J. Eighth-year survival and growth of planted replacement tree species in black ash (Fraxinus nigra) wetlands threatened by emerald ash borer in Minnesota, USA. For. Ecol. Manag. 2021, 484, 118958. [Google Scholar] [CrossRef]
  67. Van den Driessche, R. Importance of current photosynthate to new root growth in planted conifer seedlings. Can. J. For. Res. 1987, 17, 776–782. [Google Scholar] [CrossRef]
  68. Burdett, A. Physiological processes in plantation establishment and the development of specifications for forest planting stock. Can. J. For. Res. 1990, 20, 415–427. [Google Scholar] [CrossRef]
  69. Noland, T.; Mohammed, G.; Scott, M. The dependance of root growth potential on light level, photosynthetic rate and root starch content in jack pine seedlings. New For. 1997, 13, 105–119. [Google Scholar] [CrossRef]
  70. Grossnickle, S. Importance of root growth in overcoming planting stress. New For. 2005, 30, 273–294. [Google Scholar] [CrossRef]
  71. Jones, R.H.; Sharitz, R.R. Survival and growth of woody plant seedlings in the understorey of floodplain forests in South Carolina. J. Ecol. 1998, 86, 574–587. [Google Scholar] [CrossRef]
  72. Diamond, J.M. Ecology: Laboratory, field and natural experiments. Nature 1983, 304, 586–587. [Google Scholar] [CrossRef]
  73. Carpenter, S.R. Microcosm experiments have limited relevance for community and ecosystem ecology. Ecology 1996, 77, 677–680. [Google Scholar] [CrossRef]
  74. Miao, G.; Noormets, A.; Domec, J.C.; Trettin, C.C.; McNulty, S.G.; Sun, G.; King, J.S. The effect of water table fluctuation on soil respiration in a lower coastal plain forested wetland in the southeastern US. J. Geophys. Res. Biogeosci. 2013, 118, 1748–1762. [Google Scholar] [CrossRef]
Figure 1. Absolute seedling height growth at the end of the growing season using water table treatment for 11 of the 23 species (species with significant interactions between the treatment factors or less than four cm growth in all treatments and no significant main effect [pattern 1] are not shown). Lowercase letters indicate significant differences (p < 0.1) among water table depth treatments. Error bars represent 90% confidence intervals. Pattern 2: bald cypress, swamp white oak, northern red oak, and black walnut. Pattern 3: sugar maple, hackberry, American sycamore, trembling aspen, American elm, yellow birch, and river birch.
Forests 15 00530 g001
Figure 2. Absolute seedling height growth for silver maple under 0% (A), 40% (B), and 70% (C) light reduction at each water table depth treatment level. Lowercase letters indicate significant differences (p < 0.1) across all treatment combinations. Error bars represent 90% confidence intervals.
Forests 15 00530 g002
Figure 3. Estimated marginal mean photosynthetic rate (A) at each water table depth treatment level for 6 of the 12 sampled species (species with significant interactions between the treatment factors are not shown). Lowercase letters indicate significant differences (p < 0.1) among the water table depth treatments. Error bars represent 90% confidence intervals.
Forests 15 00530 g003
Figure 4. Estimated marginal mean photosynthetic rate (A) for American elm after 3 (A), 5 (B), 7 (C), 9 (D), 11 (E), and 13 (F) weeks at each water table depth treatment level. Lowercase letters indicate significant differences within time periods among water table depth treatments in panels with significant treatment effects (p < 0.1). Error bars represent 90% confidence intervals.
Forests 15 00530 g004
Figure 5. Estimated marginal mean transpiration rate (E) at each water table depth treatment level for 11 of the 12 species that were measured (species with significant interactions between the treatment factors are not shown). Lowercase letters indicate significant differences among water table depth treatments in panels with significant treatment effects (p < 0.1). Error bars represent 90% confidence intervals.
Forests 15 00530 g005
Table 1. List of tree species that were included in the study. Wetland indicator status and shade tolerance taken from USDA PLANTS database. Fac. = Facultative.
SpeciesCommon NameStock TypeWetland Indicator StatusShade Tolerance
Acer rubrum L.red maple2-0Fac.Intermediate
Acer saccharinum L.silver maple2-0Fac./Fac. WetlandIntermediate
Acer saccharum Marshallsugar maple2-0Fac. Upland/Obligate UplandTolerant
Betula nigra L.river birch2-0Fac. WetlandIntolerant
Betula alleghaniensis Brittonyellow birch2-0Fac./Fac. UplandIntermediate
Carya cordiformis (Wangenh.) K. Kochbitternut hickory2-1Fac./Fac. UplandIntolerant
Celtis occidentalis L.hackberry2-0Fac.Tolerant
Juglans nigra L.black walnut2-0Fac. Upland/Obligate UplandIntolerant
Larix laricina (Du Roi) K. Kochtamarack2-0Fac. WetlandIntolerant
Picea glauca (Moench) Vosswhite spruce2-0Fac./Fac. UplandIntermediate
Picea mariana (Mill.) Britton, Sterns & Poggenb.black spruce2-0Fac. WetlandTolerant
Pinus resinosa Aitonred pine3-0Fac. UplandIntolerant
Pinus strobus L.eastern white pine2-0Fac. UplandIntermediate
Platanus occidentalis L.American sycamore1-0Fac./Fac. WetlandIntermediate
Populus tremuloides Michx.trembling aspen2-0Fac.Intolerant
Quercus alba L.white oak2-0Fac. UplandIntermediate
Quercus bicolor Willd.swamp white oak2-0Fac. WetlandIntermediate
Quercus macrocarpa Michx.bur oak2-0Fac.Intermediate
Quercus rubra L.northern red oak2-0Fac.Intermediate
Taxodium distichum (L.) Rich.bald cypress1-0Obligate WetlandIntermediate
Thuja occidentalis L.northern white cedar3-0Fac. WetlandIntermediate
Tilia americana L.basswood2-0Fac.Tolerant
Ulmus americana L.American elm2-0Fac./Fac. WetlandIntermediate
Table 2. Placement summary for species’ growth and leaf gas exchange responses to water table depth. Species that exhibited a significant interaction between water table depth, light reduction, and/or sample date are excluded. See the text for pattern explanation.
PatternHeight Growth
(cm)
Basal Diameter Growth
(mm)
Photosynthesis
(A, μmol m−2 s−1)
Stomatal Conductance
(gs, mol m−2 s−1)
Transpiration
(E, mmol m−2 s−1)
1
Inconclusive results
bitternut hickory
bur oak
eastern white pine
red pine
white oak
bitternut hickory
black walnut
eastern white pine
northern red oak
sugar maple
red maplenorthern red oak
2
Greatest response value at 27 cm depth
bald cypress
black walnut
northern red oak
swamp white oak
northern white cedar
red pine
river birchswamp white oaknorthern white cedar
swamp white oak
3
Greatest response values at 27 and 14 cm depths
American elm
American sycamore
hackberry
river birch
sugar maple
trembling aspen
yellow birch
American elm
black spruce
hackberry
silver maple
tamarack
trembling aspen
yellow birch
northern white cedar
red maple
silver maple
tamarack
trembling aspen
bur oak
hackberry
tamarack
trembling aspen
American elm
American sycamore
hackberry
river birch
silver maple
tamarack
trembling aspen
4
High-response values across all depths
bald cypress
river birch
American elm
American sycamore
bald cypress
river birch
bald cypress
Disclaimer/Publisher’s Note: The statements, opinions and data contained in all publications are solely those of the individual author(s) and contributor(s) and not of MDPI and/or the editor(s). MDPI and/or the editor(s) disclaim responsibility for any injury to people or property resulting from any ideas, methods, instructions or products referred to in the content.

