Abstract
The straight mortise and tenon joints (SMTJs) of Tusi Manor, situated in the Yunnan–Tibet region of China, tend to undergo decay. This study aims to investigate the mechanism performance degradation of SMTJs due to decay. Five full-scale SMTJs were constructed and incubated with wood-rot fungi for 0, 6, 12, 18, and 24 weeks. Cyclic loading tests were conducted to assess the damage mechanisms and extent of mechanical property degradation at these different stages of decay, supported by ABAQUS finite element simulation software. The results revealed a progressive increase in damage with prolonged decay time. Comparison between decayed and undecayed specimens showed a maximum load-bearing performance degradation rate of 5.17%, 11.83%, 17.34%, and 23.54% after 6, 12, 18, and 24 weeks of fungal incubation, respectively. The cumulative energy efficiency degradation rates were 8.38%, 9.51%, 23.13%, and 33.31%, respectively. SMTJs mechanical performance degradation is correlated with wood mechanical property degradation as a function of the S-family. Finite element simulations further indicated a reduction in tenon strength from the outer parts towards the inner parts of the structure.
1. Introduction
Traditional Chinese architecture relies primarily on wooden structures for bearing weight, showcasing unique architectural forms and historical–cultural significance, making it an integral part of the world’s architectural heritage [1]. One distinctive feature of traditional Chinese wooden architecture, compared to other architectural styles worldwide, is the use of semi-rigid connection characteristics (mortise and tenon joints) to connect beams and columns at the nodes [2]. Tusi Manor is a type of historical and cultural architectural heritage in the Yunnan–Tibet region of China. The construction technique employed to complete this architectural masterpiece is known as “external soil and internal wood” [3,4], which includes a load-bearing wooden frame with rammed earth walls as enclosures [5,6,7]. The column-frame layer is supported primarily by mortise and tenon joints and multilayer wooden frame parts. The mortise and tenon system is characterized by straight mortise and tenon joint (SMTJ) connections. Unfortunately, Tusi Manor’s lengthy history post-construction and continual exposure to cyclical wet and dry environments have resulted in numerous signs of decay, cracking, and insect infestation. Fungal decay, in particular, is a prevalent issue in SMTJs, as shown in Figure 1. This type of decay occurs as a result of wood’s inherent susceptibility to microbial intrusion, leading to a reduction in strength and compromising the overall integrity of the structure’s internal framework [8,9].
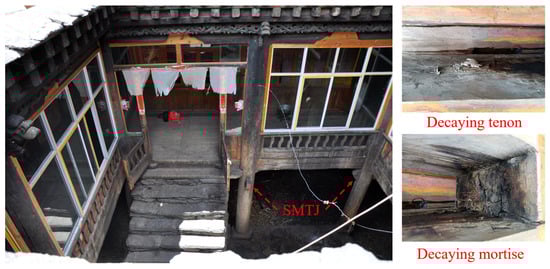
Figure 1.
Decay phenomenon of SMTJ in Tusi Manor.
Scholars have made noteworthy advancements in investigating the effects of decay on the mechanical properties of wood, particularly in terms of testing methods and unified standards. Certain methods involve subjecting small-scale wood specimens to decay tests using various types of fungi, revealing the various effects of decay on the wood’s mechanical properties [10,11,12,13]. Several scholars have processed wooden frames from ancient buildings into small-scale specimens for research; it has been found that the mechanical properties of naturally aged wood in ancient architecture are significantly affected by decay and cracking [14,15,16]. However, the decay mechanism of small-scale wood specimens differs significantly from that of larger specimens [17]. In addition, there are significant differences in the degree of mechanical performance degradation in different parts of large specimens of decaying ancient Tibetan buildings [18]. Furthermore, the degradation of the mechanical properties of small-scale wood specimens itself is not consistent with the mechanical performance degradation of wooden frames such as mortise and tenon joints. In engineering practice, there is a significant difference between the mechanical performance degradation of SMTJs and that of small-scale wood specimens’ mechanical properties [19]. Researchers have rarely considered this impact when conducting decay tests on wooden frames of ancient buildings.
Today’s scholars have shifted their focus towards utilizing physical methods to simulate damage to mortise and tenon joints, such as drilling holes in the tenon [20], modifying the mortise and tenon gap [21,22,23], using different types of wood [24], introducing grooves at the mortise [25], and adjusting tenon height [26] to investigate the influence of various damage factors on the mechanical performance degradation of mortise and tenon joints. However, it is important to acknowledge that these treatment measures may still differ significantly from the actual damage experienced by mortise and tenon joints in practical engineering applications.
Researchers have also simulated natural decay environments to conduct physical experiments on wood specimens. Researchers simulated extreme weather conditions using a dry heat cycling environment, where both reinforced and unreinforced specimens experienced a consistent and substantial decline in mechanical properties after a designated treatment period [27]. Other researchers simulated the degradation of mechanical properties in complex wooden structures affected by decay using an artificial environment designed to replicate the natural deterioration process [28].
In complex structures like SMTJs, individual components exert varying effects on the overall degradation of mechanical performance following decay. Researchers have investigated changes in the mechanical properties of cross-laminated timber connection assemblies in the presence of brown rot fungi, observing that their load-carrying capacity and energy-dissipation properties significantly decreased after 40 weeks of decay [29]. Several researchers have obtained decaying wooden frames from ancient buildings to test their precise mechanical properties and develop failure models, gaining valuable insights into the underlying mechanisms governing mechanical property degradation in decayed wood structures [30,31]. Currently, SMTJ mechanical performance degradation is mainly understood based on data from small-scale specimens; few studies have used full-scale models. Moreover, there is a lack of research on the relationship between the mechanical performance degradation of decayed STMJs and the mechanical properties degradation of small-scale wood specimens, and the influence of decay treatment on mechanical performance has not yet been quantified.
The present study focused on Pinus kesiya var. langbianensis, a type of wood commonly found in Tusi Manor, and to this day, it is still widely used in residential buildings in the Yunnan region. Five SMTJ specimens were constructed using this material as experimental samples, with size parameters derived from the actual components of Tusi Manor. The joints were artificially decayed via fungal incubation in six-week decay cycles over a total experimental duration of 24 weeks. The mechanical properties of these SMTJs before and after decay were examined using cyclic loading tests, and the physical and mechanical properties of the wood itself were observed. A finite element model was developed with decay depth as a target variable and then applied to simulate changes in the internal mechanical properties of SMTJs under real-world conditions. This study aims to elucidate the mechanical performance degradation of SMTs, providing a reference for the reinforcement and maintenance of Tusi Manor and other historical wooden structures.
2. Materials and Methods
2.1. SMTJs Specimen Fabrication
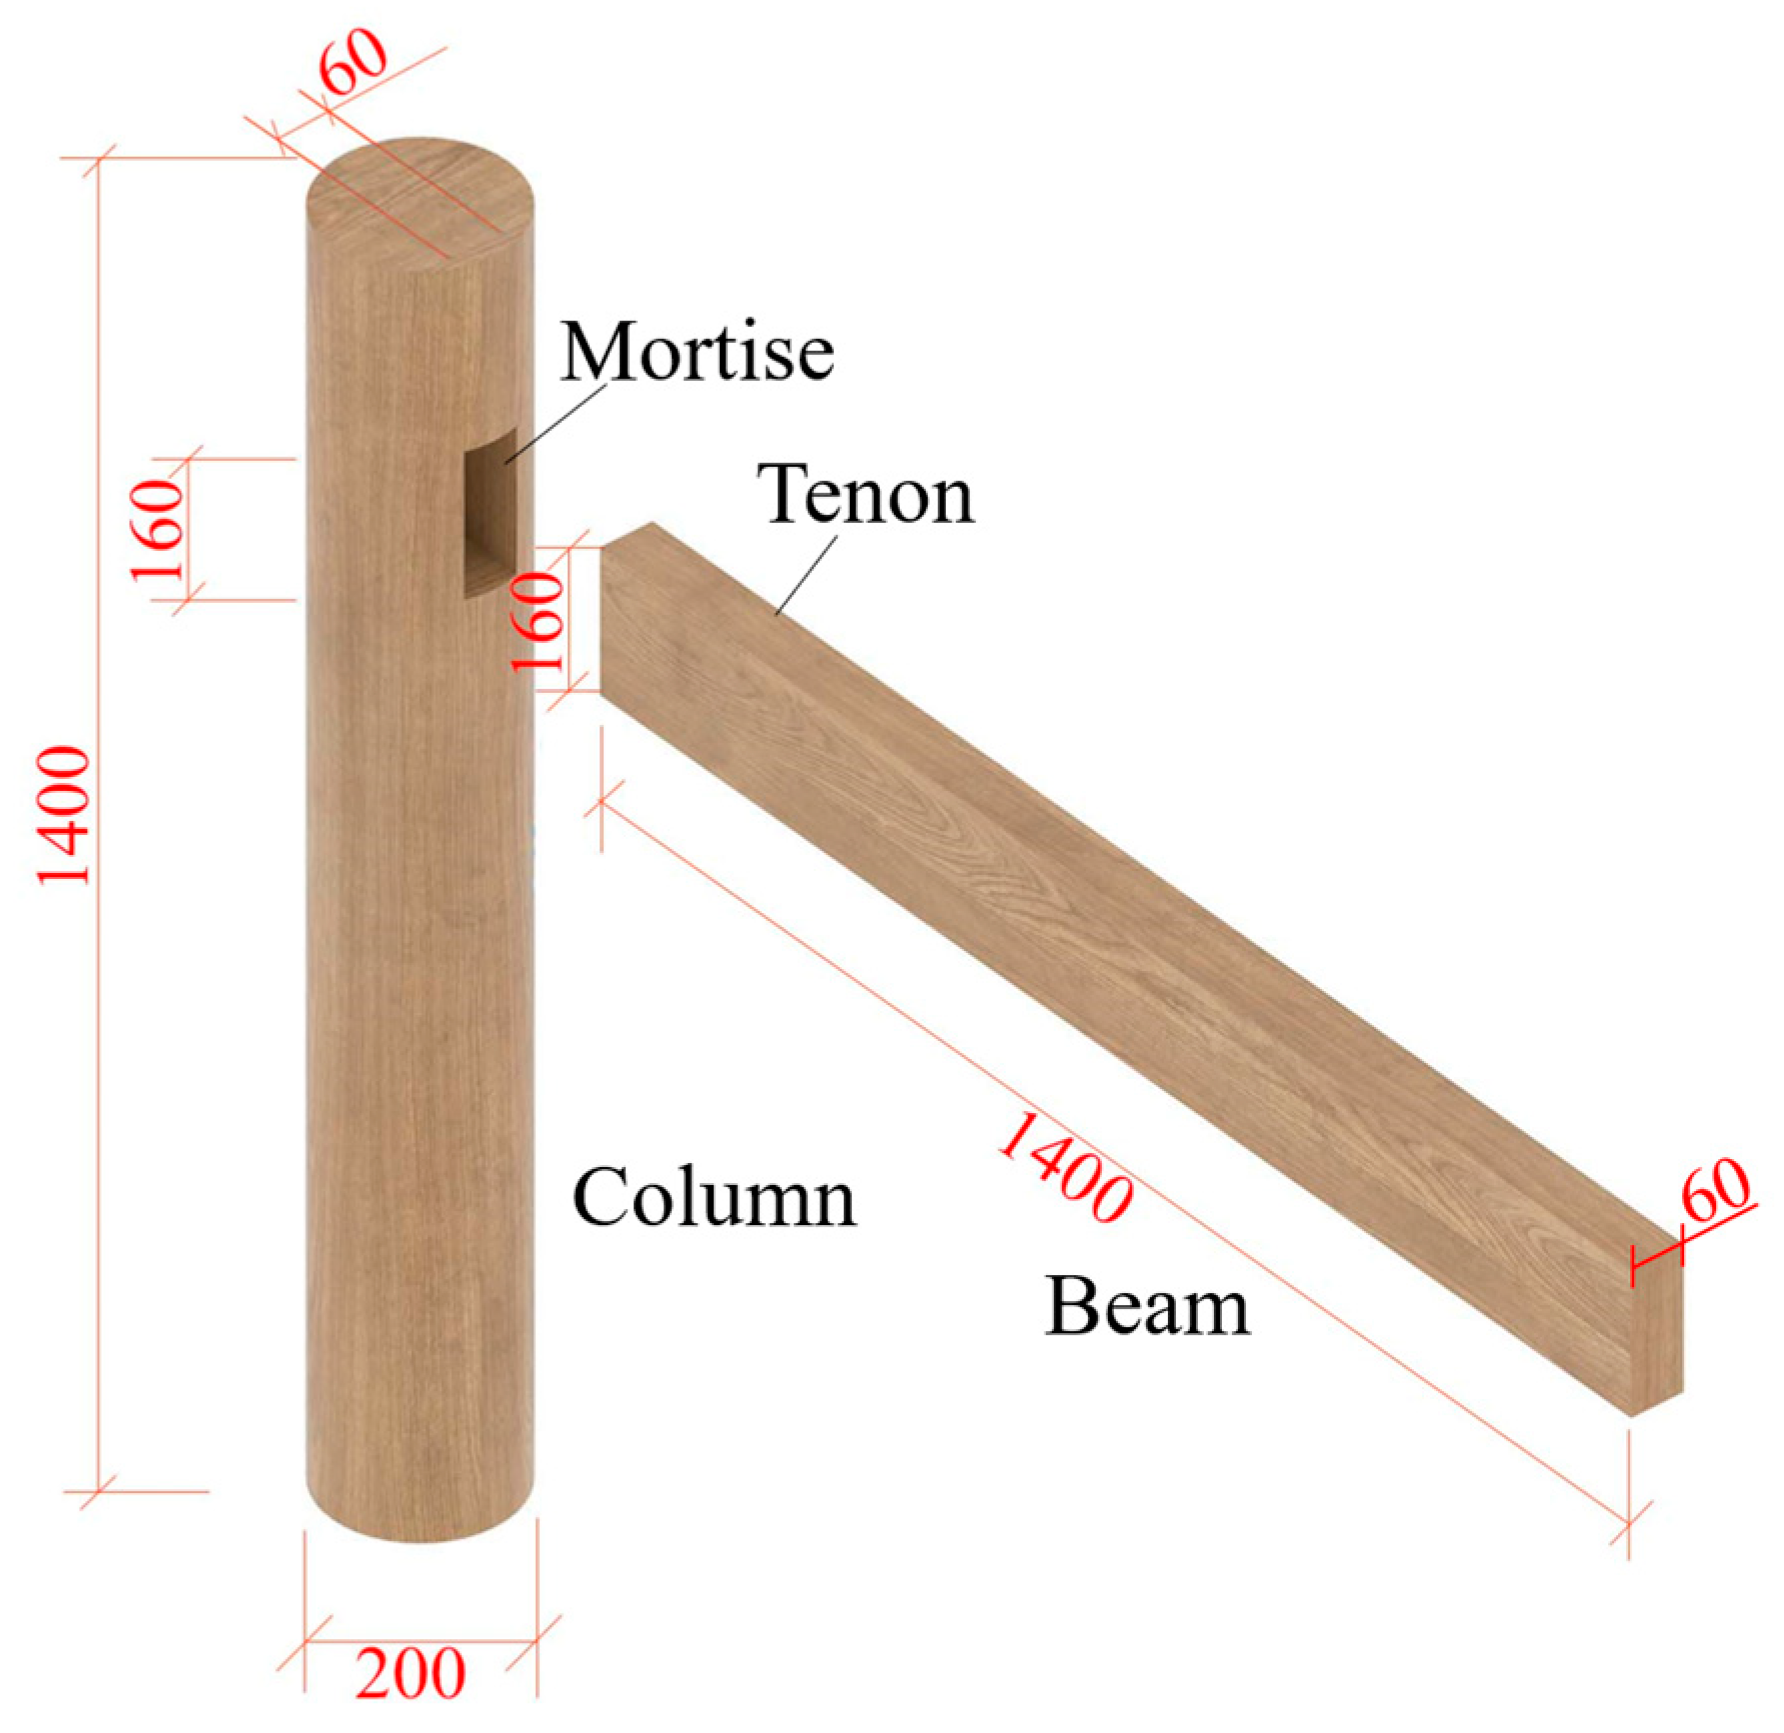
The column section of the SMTJs was circular, with a diameter of 200 mm and a length of 1400 mm. The beam’s dimensions were 1400 mm × 60 mm × 160 mm, as illustrated in Figure 2. All the raw materials for the specimens were from the same growing batch of wood, and the beams and columns were both made of tree trunks at a height of about 1.5 m from the ground. The columns were made of logs, and the beams were made of sapwood from the logs. The total number of SMTJ specimens was 5, control group specimens were designated as SJ-1, while specimens decayed for 6, 12, 18, and 24 weeks were labeled SJ-2, SJ-3, SJ-4, and SJ-5, respectively.
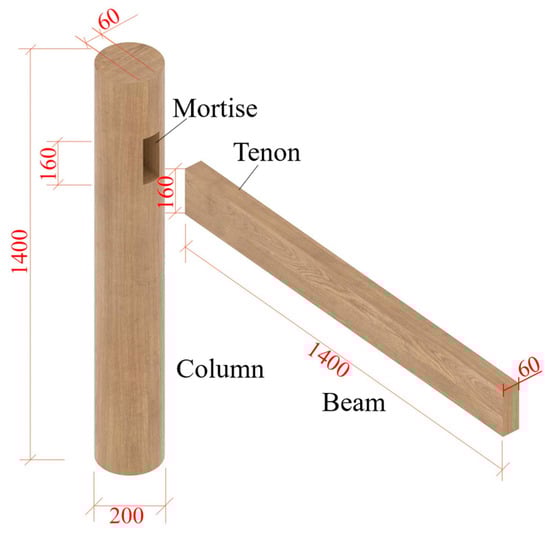
Figure 2.
Straight mortise and tenon joints.
2.2. Material Property Experiments
The oven-drying method was used to test the moisture content of Pinus kesiya var. langbianensis. The specimen size was 20 mm × 20 mm × 20 mm. The oven temperature was set to 103 ± 2 °C. The testing procedure followed the requirements specified in the international standard (ISO 13061-1:2014) [32]. The measured moisture content was 13.3%. The testing method for determining the air-dry density of Pinus kesiya var. langbianensis followed the international standard (ISO 13061-2:2014) [33]. The average air-dry density of Pinus kesiya var. langbianensis was measured to be 0.452 ± 0.09 g/cm3.
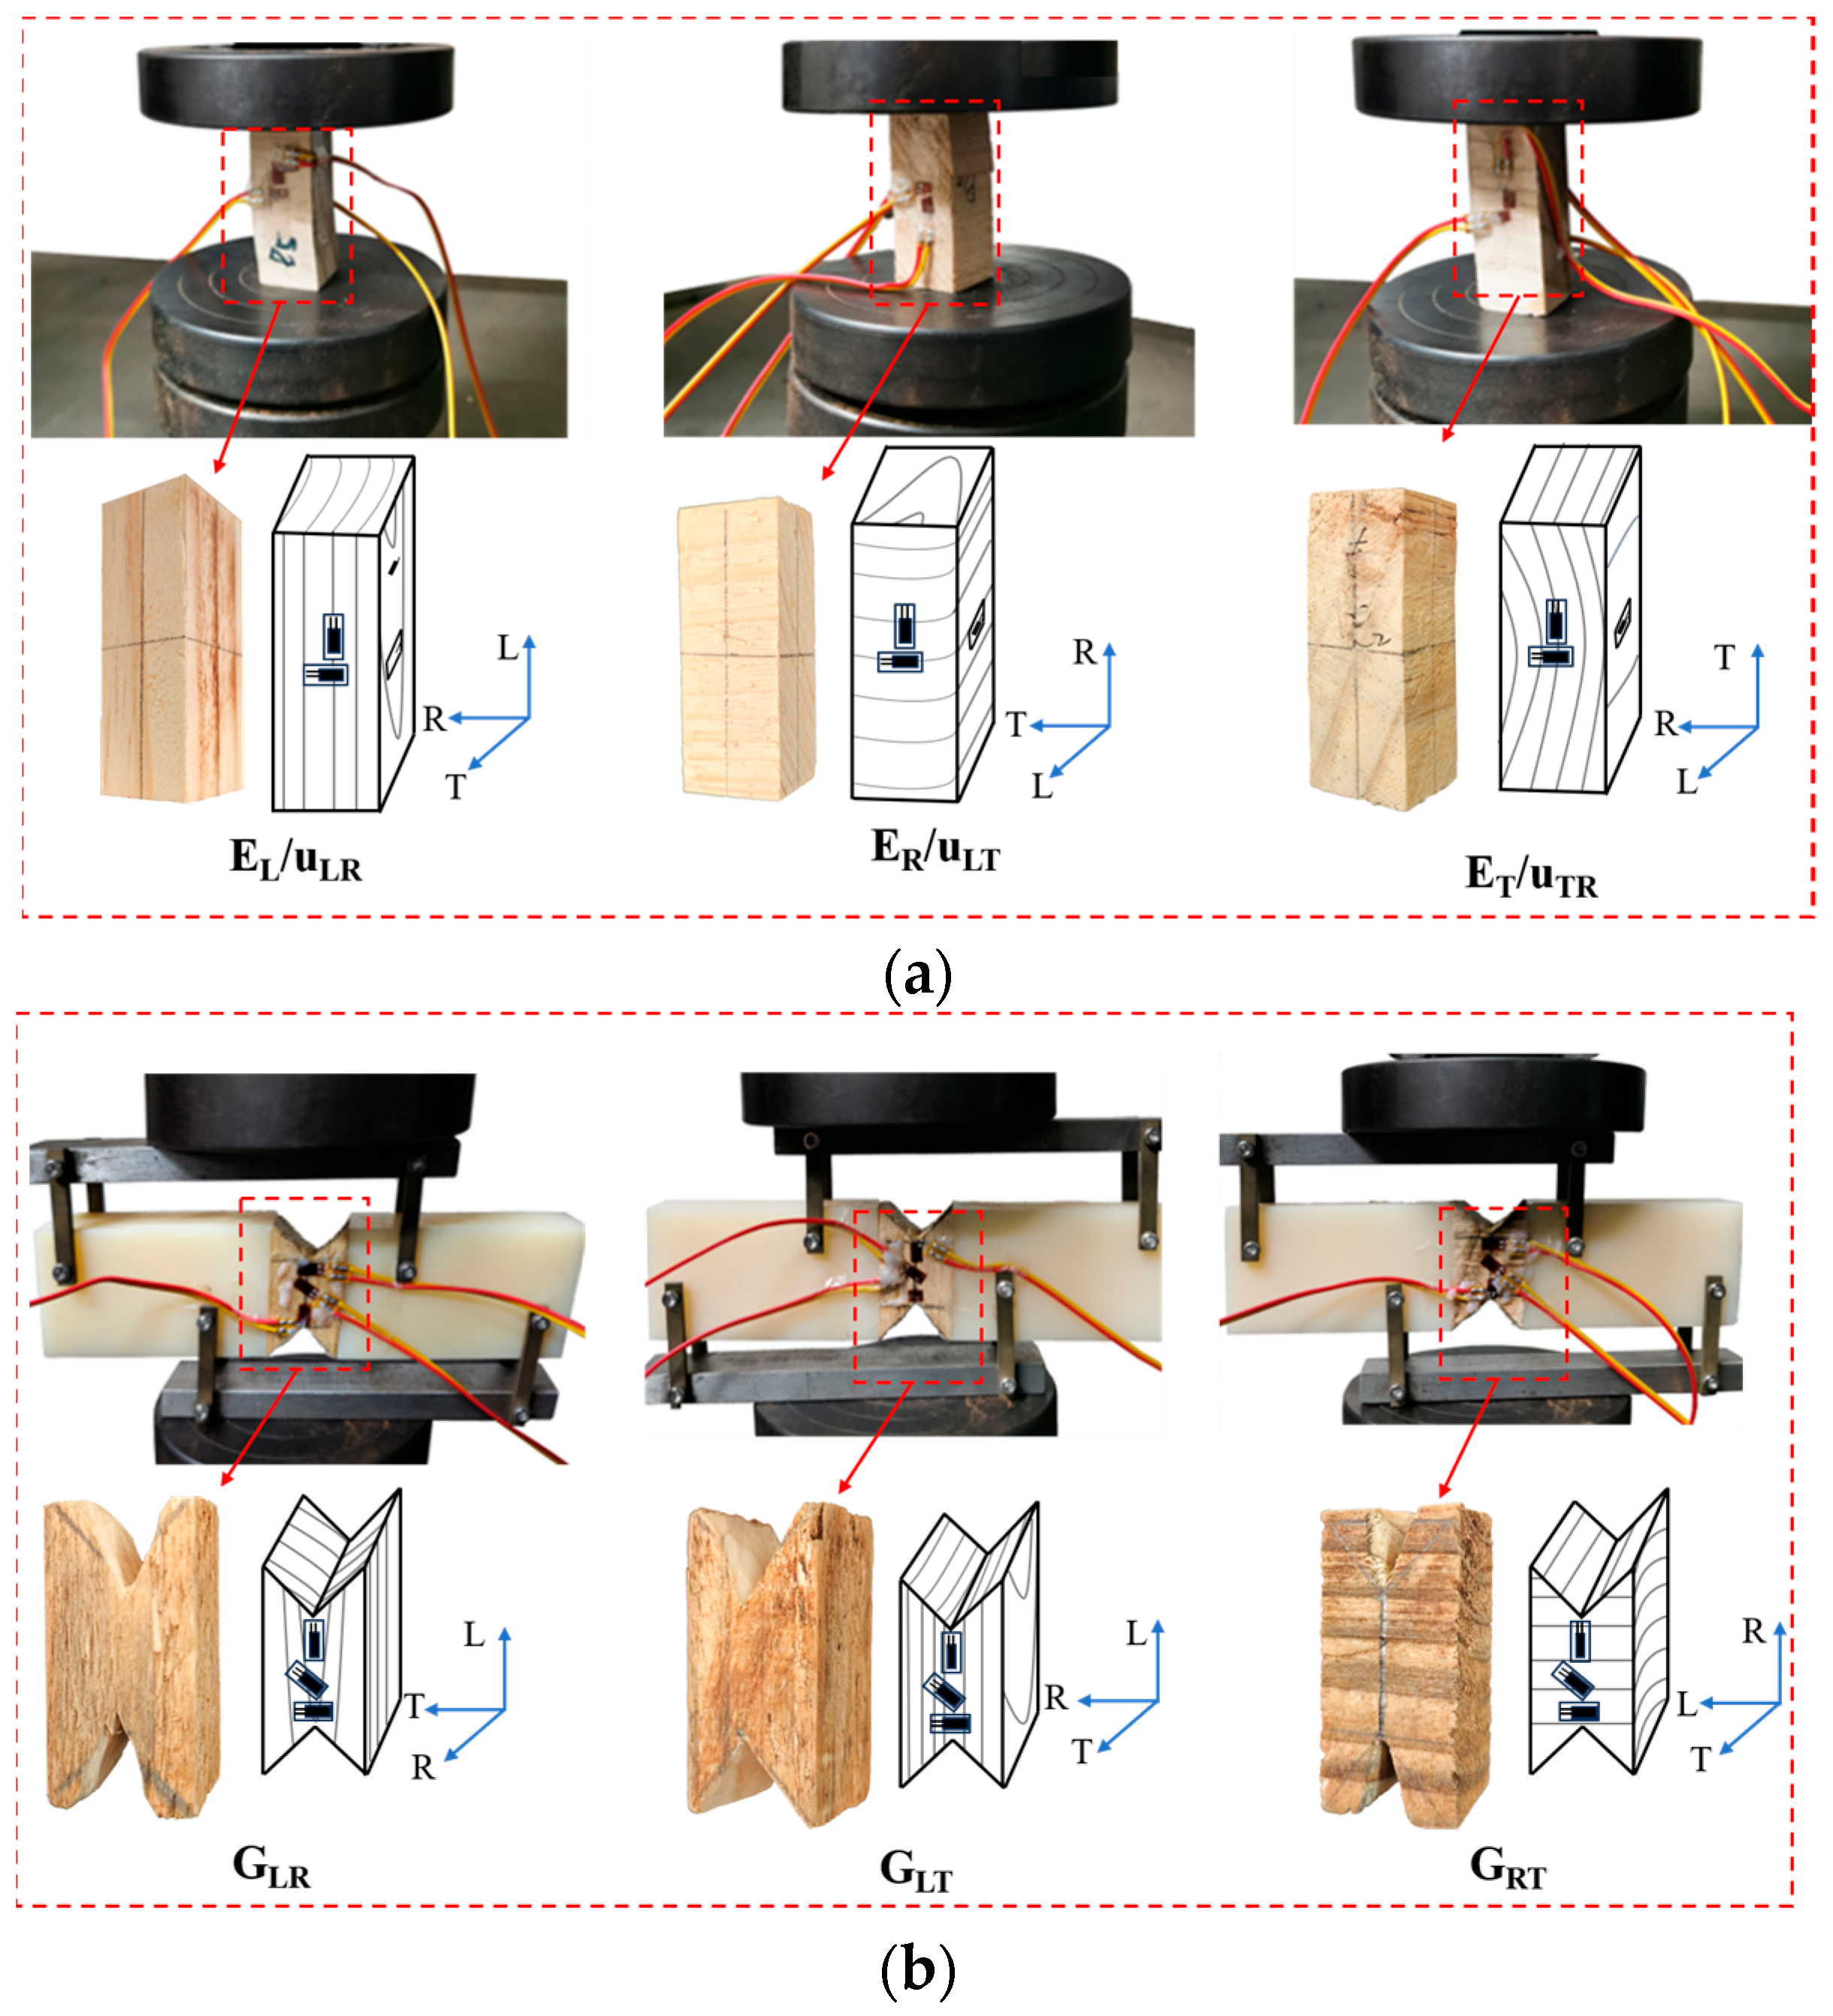
To study the changes in the mechanical properties of Pinus kesiya var. langbianensis wood before and after decay, according to the specifications for sampling radial tensile, radial compressive elastic modulus, and radial shear test specimens in national standard (GB/T 1927.2-2021) [34], 60 wood grain compressive elastic modulus test specimens, 60 cross-grain radial compressive elastic modulus test specimens, 60 cross-grain chord compressive elastic modulus test specimens, 60 longitudinal shear elastic modulus specimens, 60 radial shear elastic modulus specimens, and 60 tangential shear elastic modulus specimens were taken from the logs of Pinus kesiya var. langbianensis. The compression elastic modulus and Poisson’s ratio tests for wood were performed using the full cross-section compression test method. The test methods for longitudinal compressive elastic modulus, as well as compressive elastic modulus and Poisson’s ratio in the cross-grain direction, mainly referred to the provisions in the national standard (GB/T 1927.12-2021) [35]. Poisson’s ratio was tested by bonding strain gauges to the surface of the specimen, with strain gauges bonded in the vertical direction to measure compressive strain, and strain gauges bonded in the horizontal direction to measure expansion strain, as shown in Figure 3a.
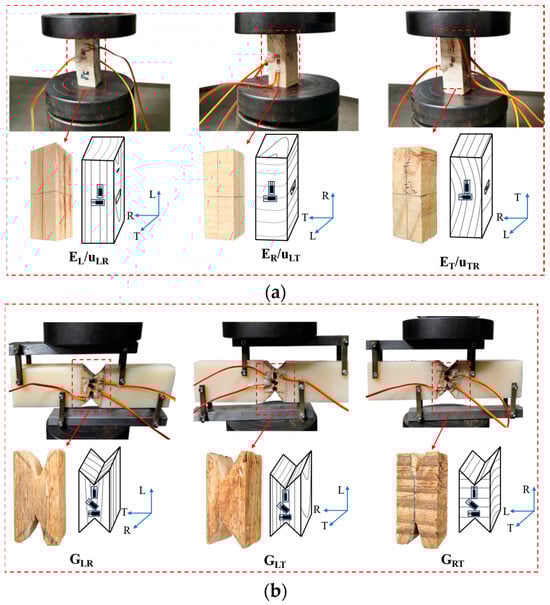
Figure 3.
Wood property test process. (a) Testing process for compressive modulus of elasticity and Poisson’s ratio; (b) shear modulus testing process.
The processing and testing methods of the test specimens for the shear modulus of the elasticity refer to the U.S. specification ASTM D5379/D5379-M12 [36], as well as the improvement in Iosipescu’s shear test method by scholars. The shear modulus of the elasticity test specimen is V-shaped, with dimensions of 20 mm × 20 mm × 40 mm. This improvement method allows the shear specimens to receive shear force in all the main stress directions, which can better test the shear performance of wood [18,37,38]. The strain gauges are pasted at the central shear area in the horizontal direction, vertical direction, and 45° direction from the horizontal direction. The loading method is consistent with the loading method of the transverse compressive modulus of elasticity, as shown in Figure 3b.
Once the samples underwent the specified decay cycles, they were removed from the high-humidity environment and transferred into a constant temperature and humidity chamber. Upon reaching equilibrium, with the moisture content stabilized at approximately 12%, the mechanical properties of the samples were tested using an electronic universal mechanical testing machine controlled by a microcomputer (Electronic universal testing machine, manufacturer: Shenzhen Sansi Testing Equipment Co., Ltd. (Shenzhen, China), model: CMT-5504), as shown in Figure 3.
2.3. Decayed Method
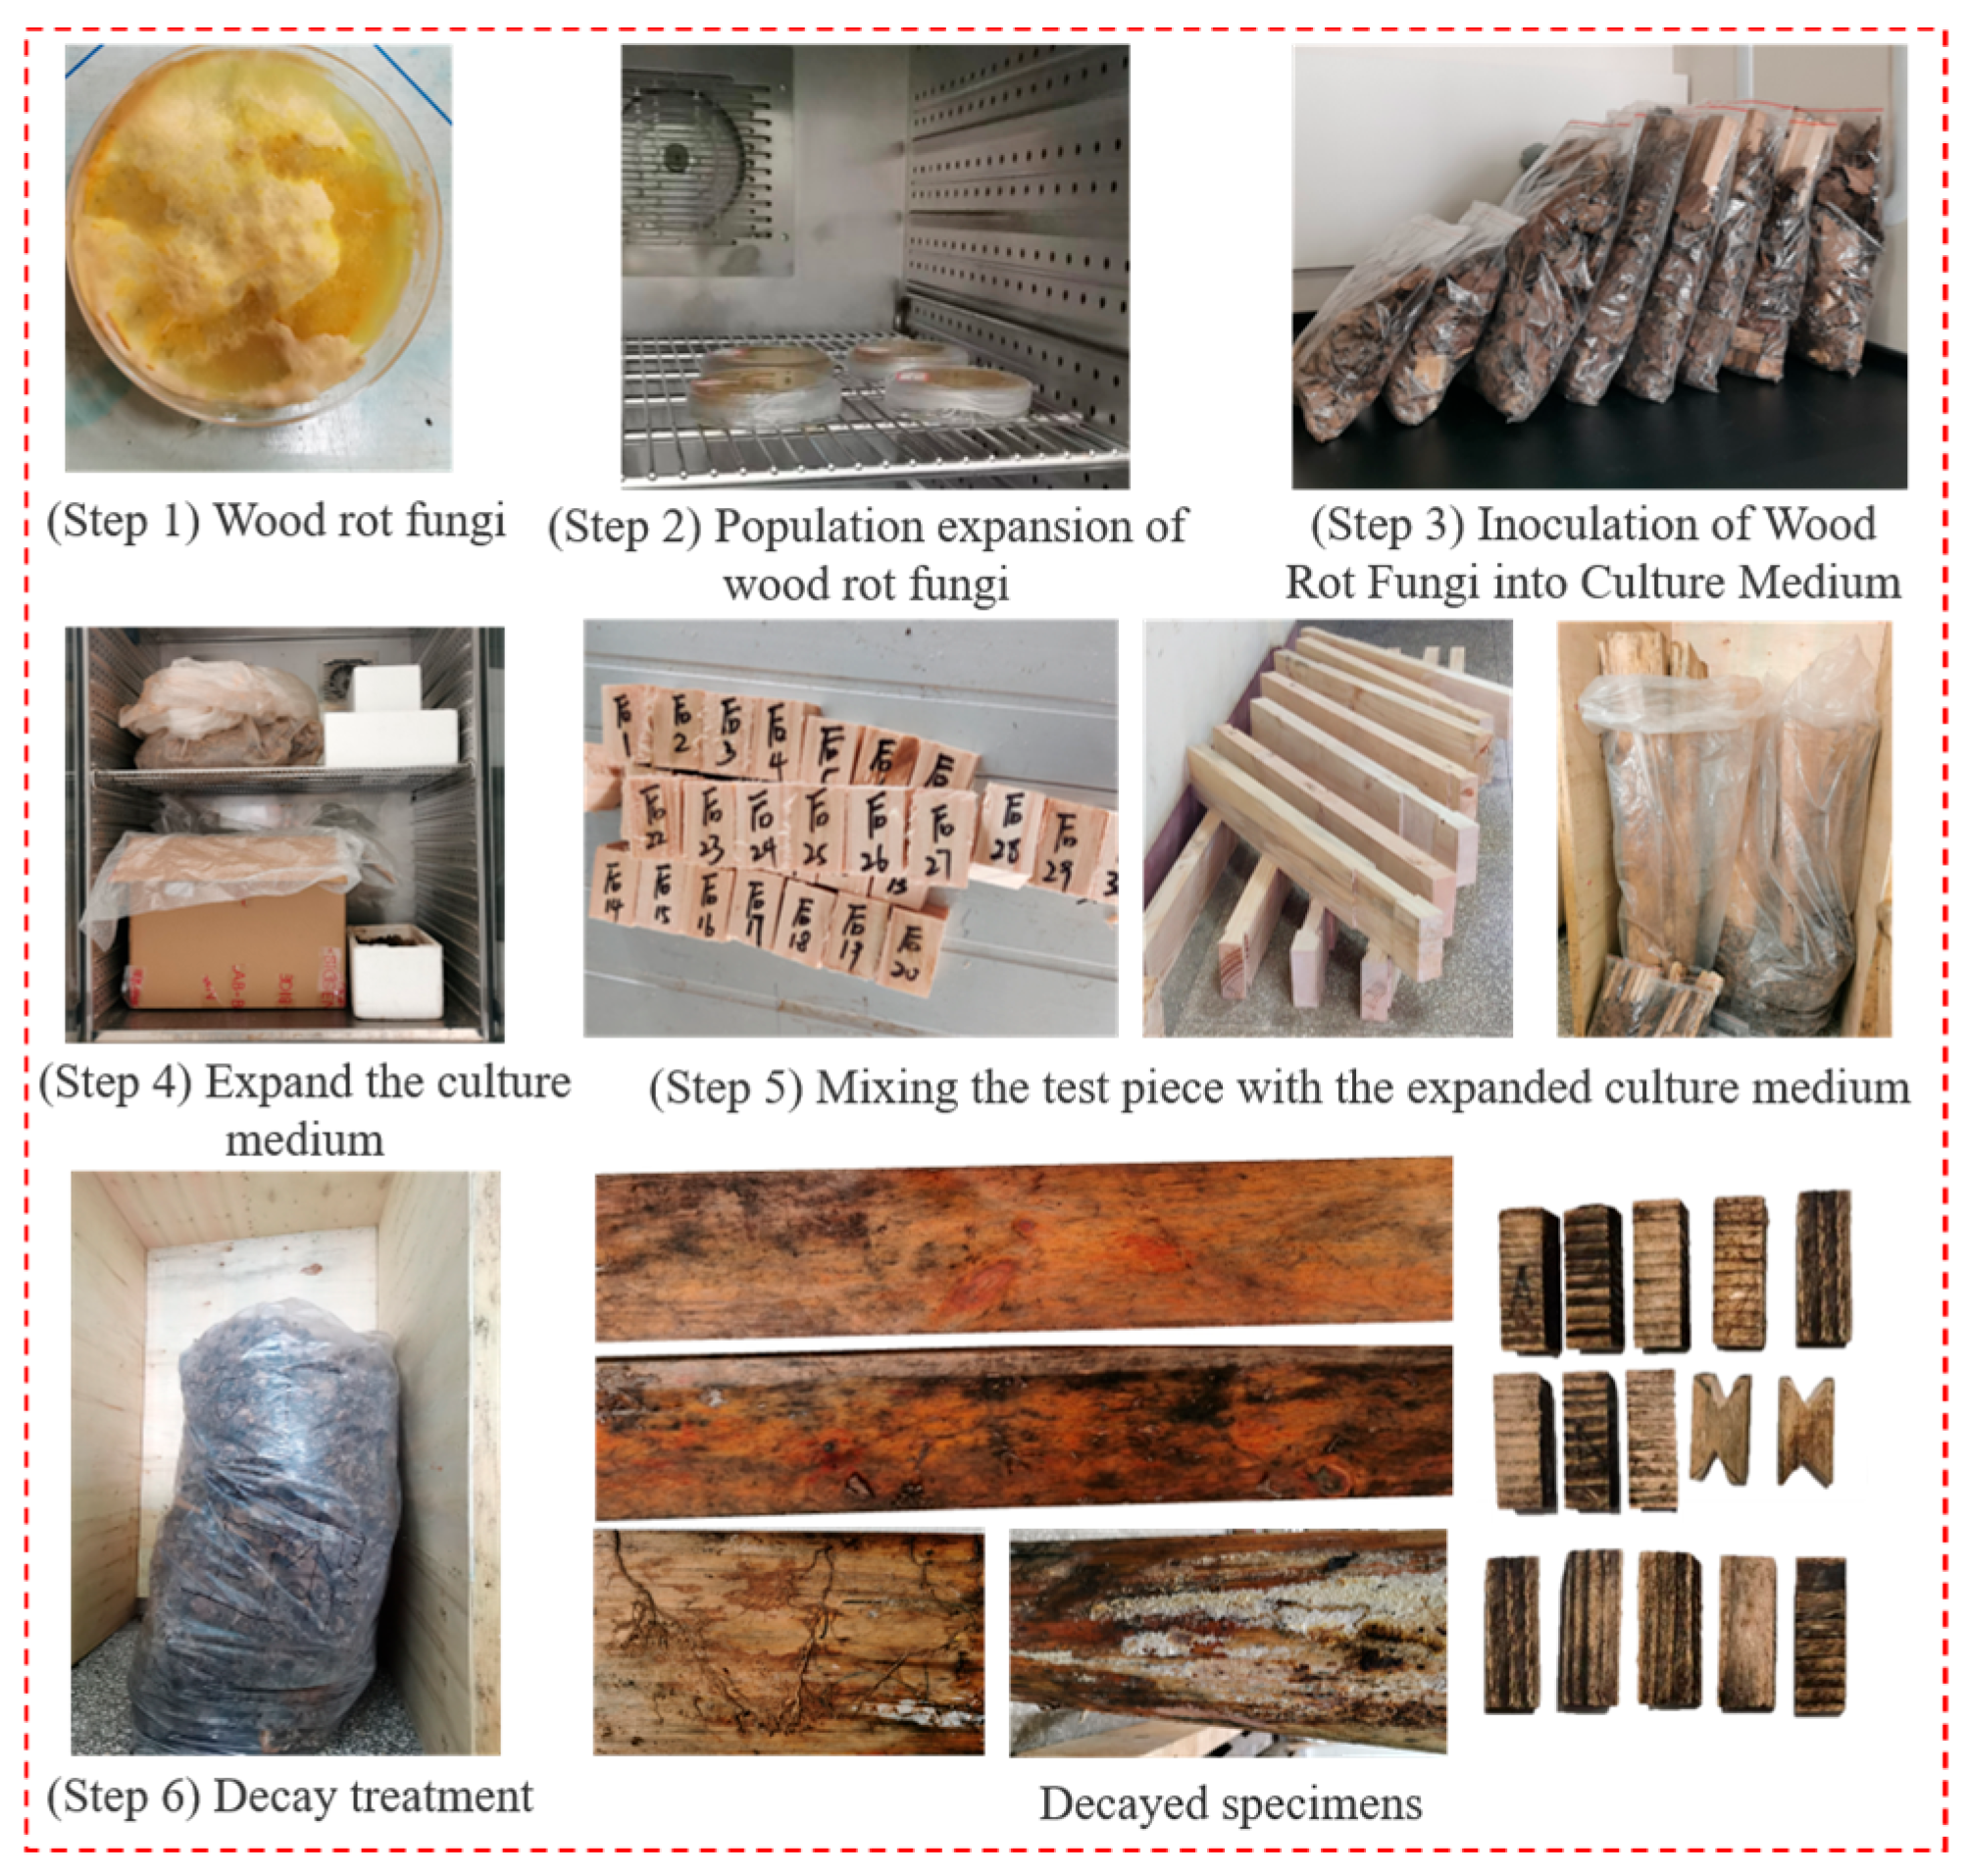
According to the national standard (GB/T 13942.1-2009) “Durability of Wood Part 1: Laboratory Test Methods for Natural Corrosion Resistance” [39], the selection of fungal species in wood rot fungi is required. The experimental strain of brown rot fungus was selected as CFCC86617, sourced from the China Forestry Microbial Collection Center, which is a common decaying fungus in the ancient wooden structures in northwest Yunnan [40]. In the experiment, Pinus kesiya var. langbianensis was used as a substrate for brown rot fungi. The SMTJ specimens were too large to place in glassware as containers for decay testing, as prescribed in the specifications. Consequently, polyethylene plastic bags and closed wooden boxes were employed as cultivation spaces for fungal decay, as outlined in a previous study [41]. To ensure optimal fungal activity, each polyethylene plastic bag was equipped with an outlet vent for adequate oxygen supply. The bags were also regularly humidified using spray bottles, as depicted in Figure 4.

Figure 4.
Wood rot fungus culture specimen.
After the decay treatment was completed, the mechanical properties of small-sized specimens were tested. The test results are presented in Table 1, where the subscripts L, R, and T denote the longitudinal, transverse, and tangential directions of the wood, respectively. fc represents longitudinal compressive strength, fr represents transverse compressive strength, E represents the compressive modulus of elasticity, G represents the shear modulus of elasticity, and μ represents Poisson’s ratio. The coefficient of variation (COV) indicates the level of dispersion in the test data. As the decay period increases, the randomness in the location and extent of decay intensifies, leading to greater dispersion of the test results.

Table 1.
Decayed Pinus kesiya var. langbianensis physical and mechanical properties.
2.4. Loading Device and Method
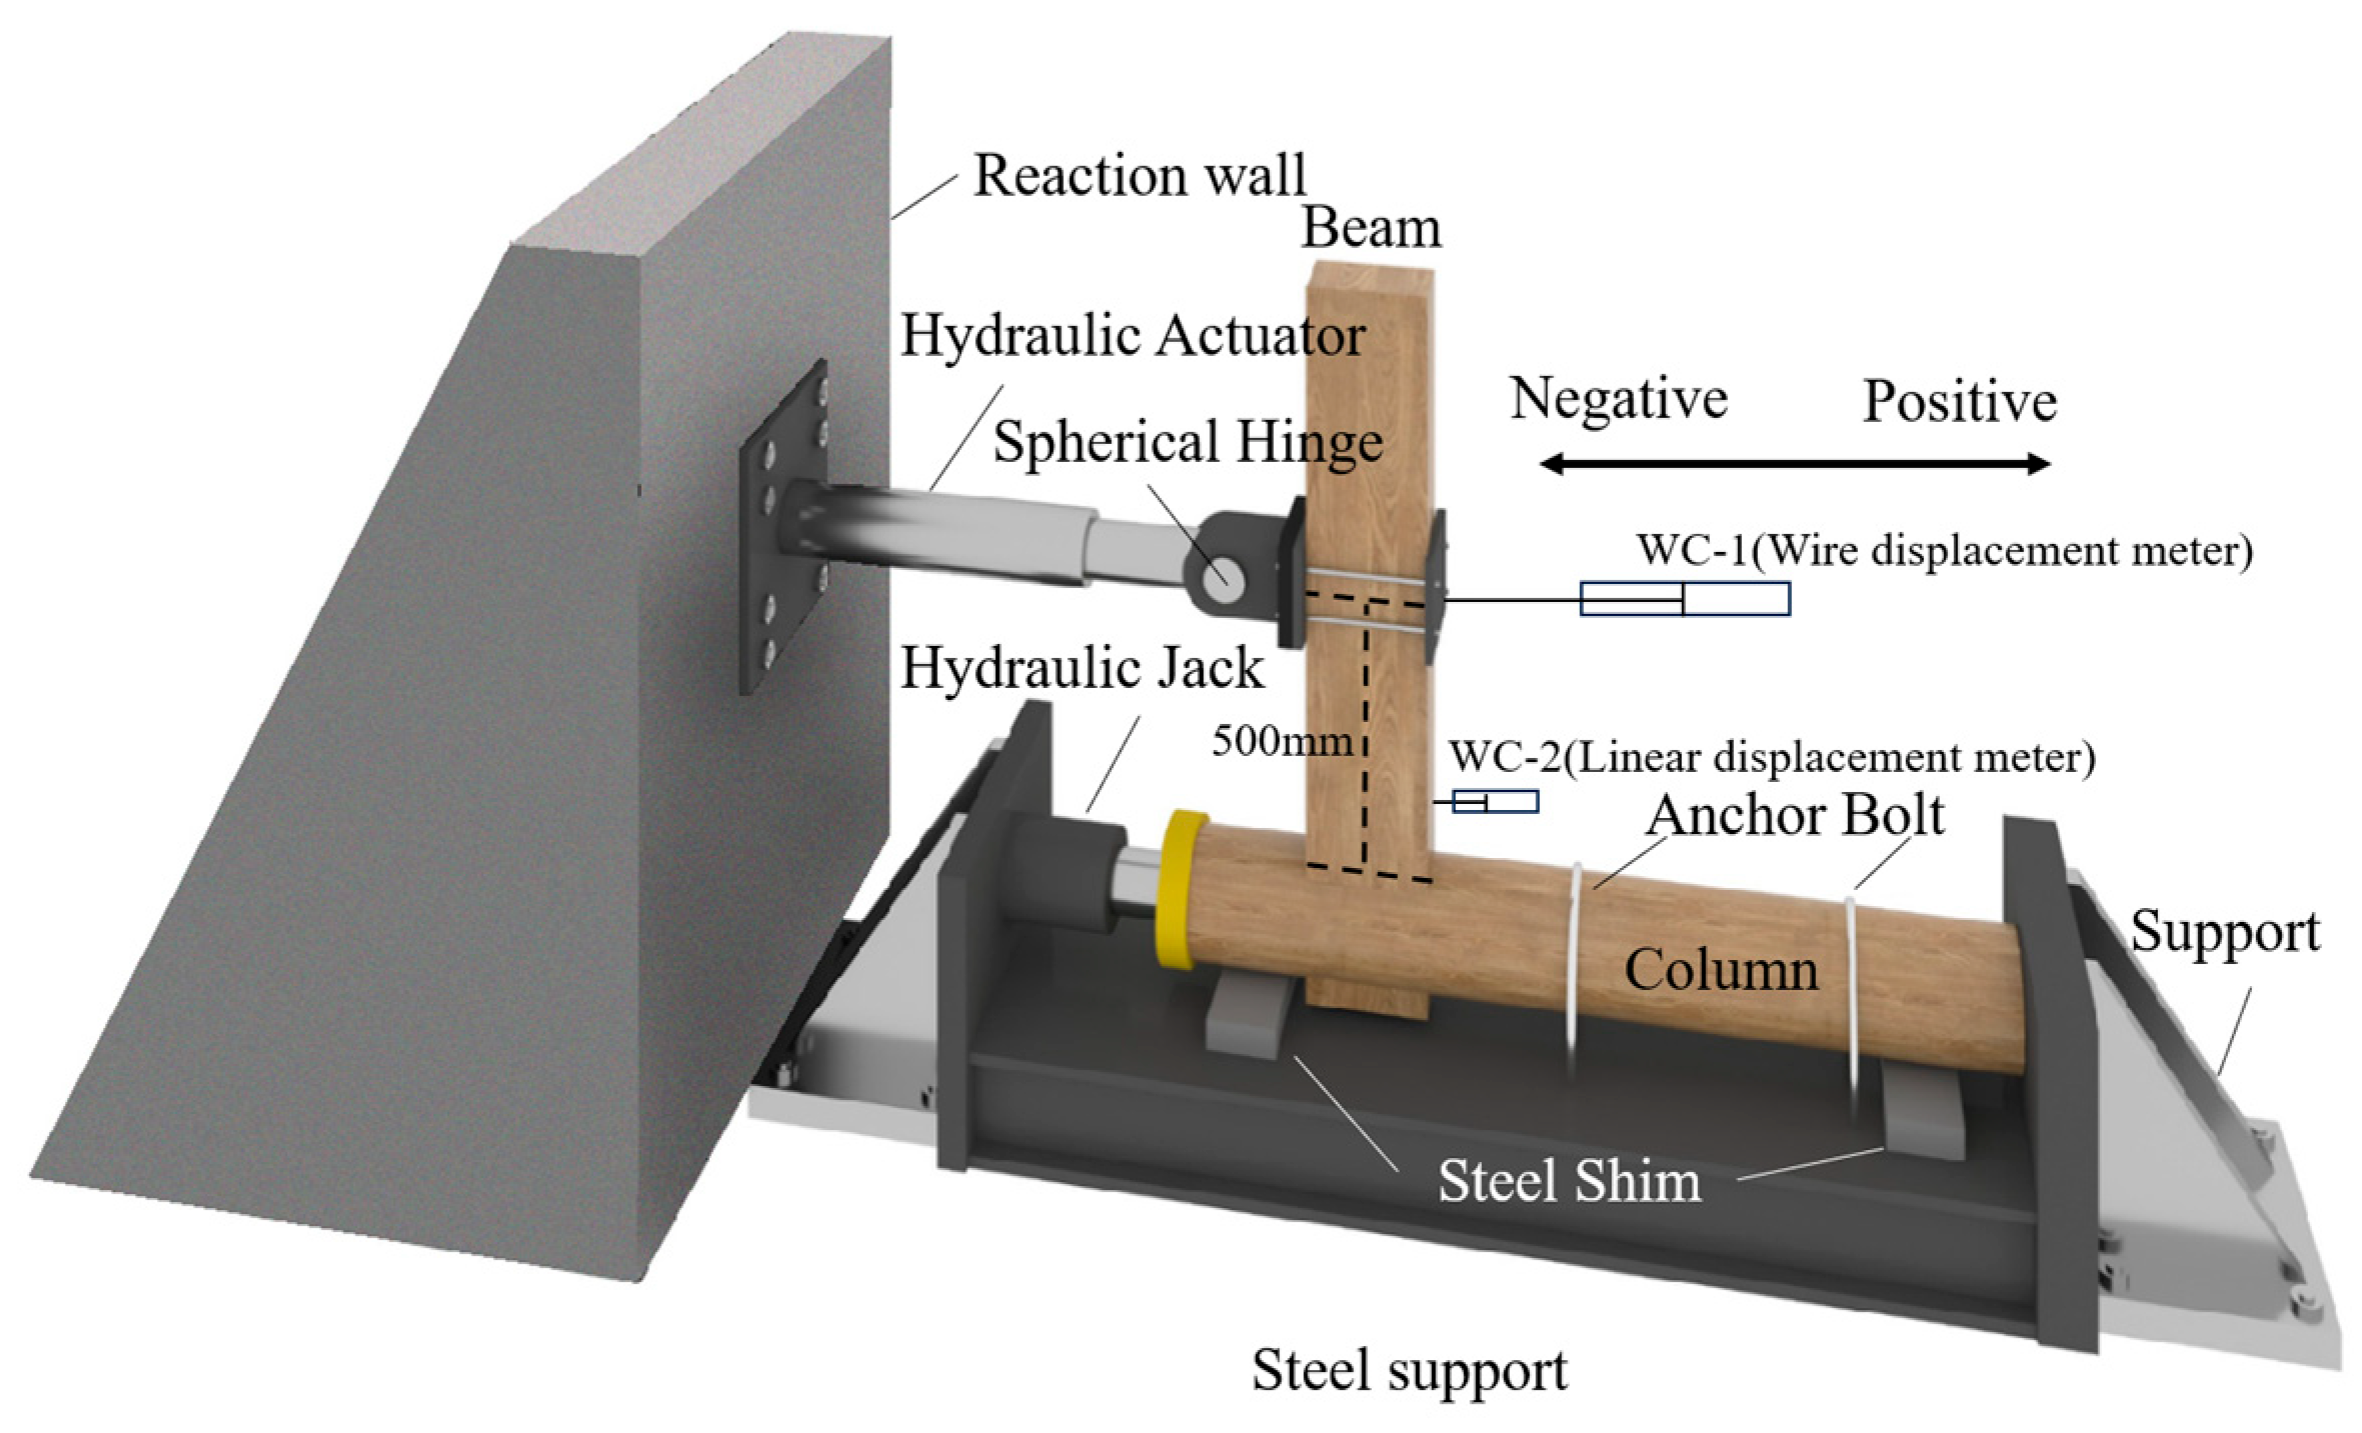
To mitigate the P-Δ effect on the SMTJs during testing, a column was installed in the test device horizontally. An actuator was used to apply horizontal cyclic loads to the cantilevered end of the beam, with a spherical hinge support connecting the loading point of the actuator to the beam, as illustrated in Figure 5. The loading point was positioned 500 mm away from the upper edge of the column. A wire displacement meter with a measuring range of 250 mm was set at the loading point (WC-1). To prevent lateral displacement or instability of the joint specimen during loading, the base of the column was fixed on a cast iron base, and a hydraulic jack was used to apply an axial load of approximately 20 kN to the column head side. Steel rings and lower steel plates were utilized to secure the middle part of the column. The actuator was designated as a positive load when applied toward the right end and as a negative load when applied toward the left end. The load and horizontal displacement at the loading point were determined using sensors connected to the actuator. A displacement gauge (WC-2) with a range of 200 mm was positioned 100 mm below the upper end of the column to verify the accuracy of (WC-1) data.

Figure 5.
Loading device and measurement point.
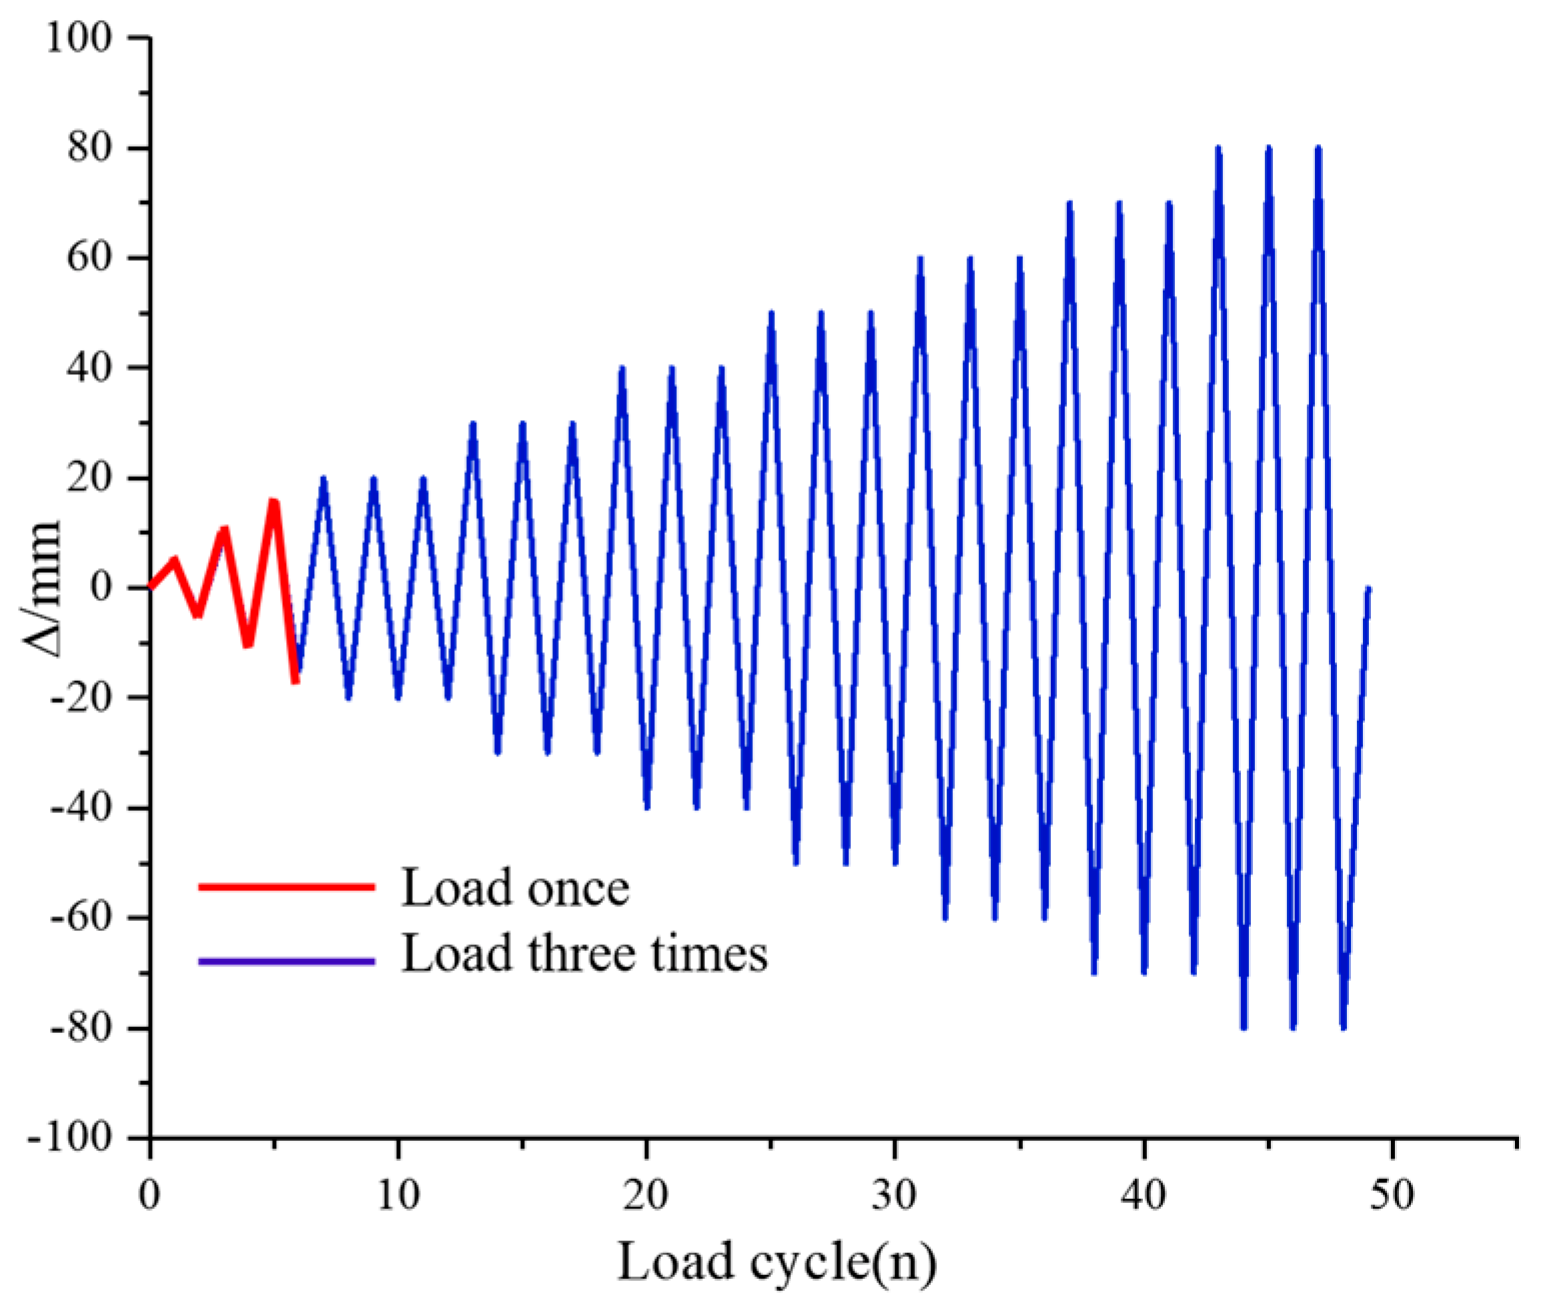
The cyclic load test was conducted according to the pseudo static loading scheme for the “Column end test”, recorded in Part 4 of JGJ/T 101-2015 “Code for Seismic Testing of Buildings” [42]. A displacement-controlled graded loading approach was employed. To ensure controlled loading before the yield section, the loading process was divided into several stages. The first three stages involved one cycle of loading with a 5 mm amplitude. Following the completion of the third stage, the displacement for each subsequent stage was increased by 10 mm; each stage included three cycles of loading. The loading process was terminated when the loading displacement exceeded 105 mm or the joint was severely damaged. A schematic diagram of the loading system is given in Figure 6.
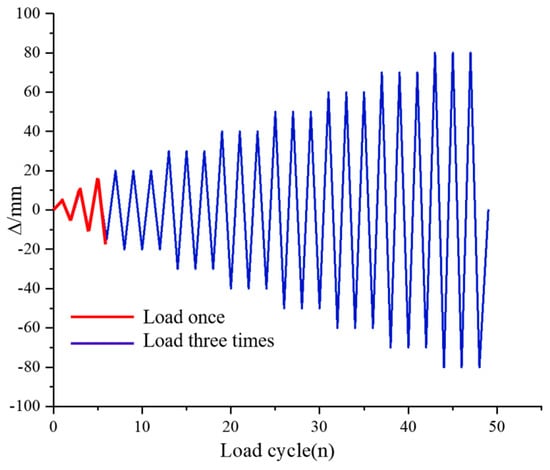
Figure 6.
Loading system.
3. Experimental Results and Discussion
3.1. Failure Mode
During the initial loading stage, the tenons and mortises of all the specimens became tightly clamped together. At the beginning of the second loading stage (10 mm displacement), a subtle sound indicating wood compression was audible, though there were no visual signs of tenon damage observed. As the loading displacement increased, the compression between the tenons and mortises intensified, amplifying the sound. Tenon deformation became increasingly evident throughout the unloading process.
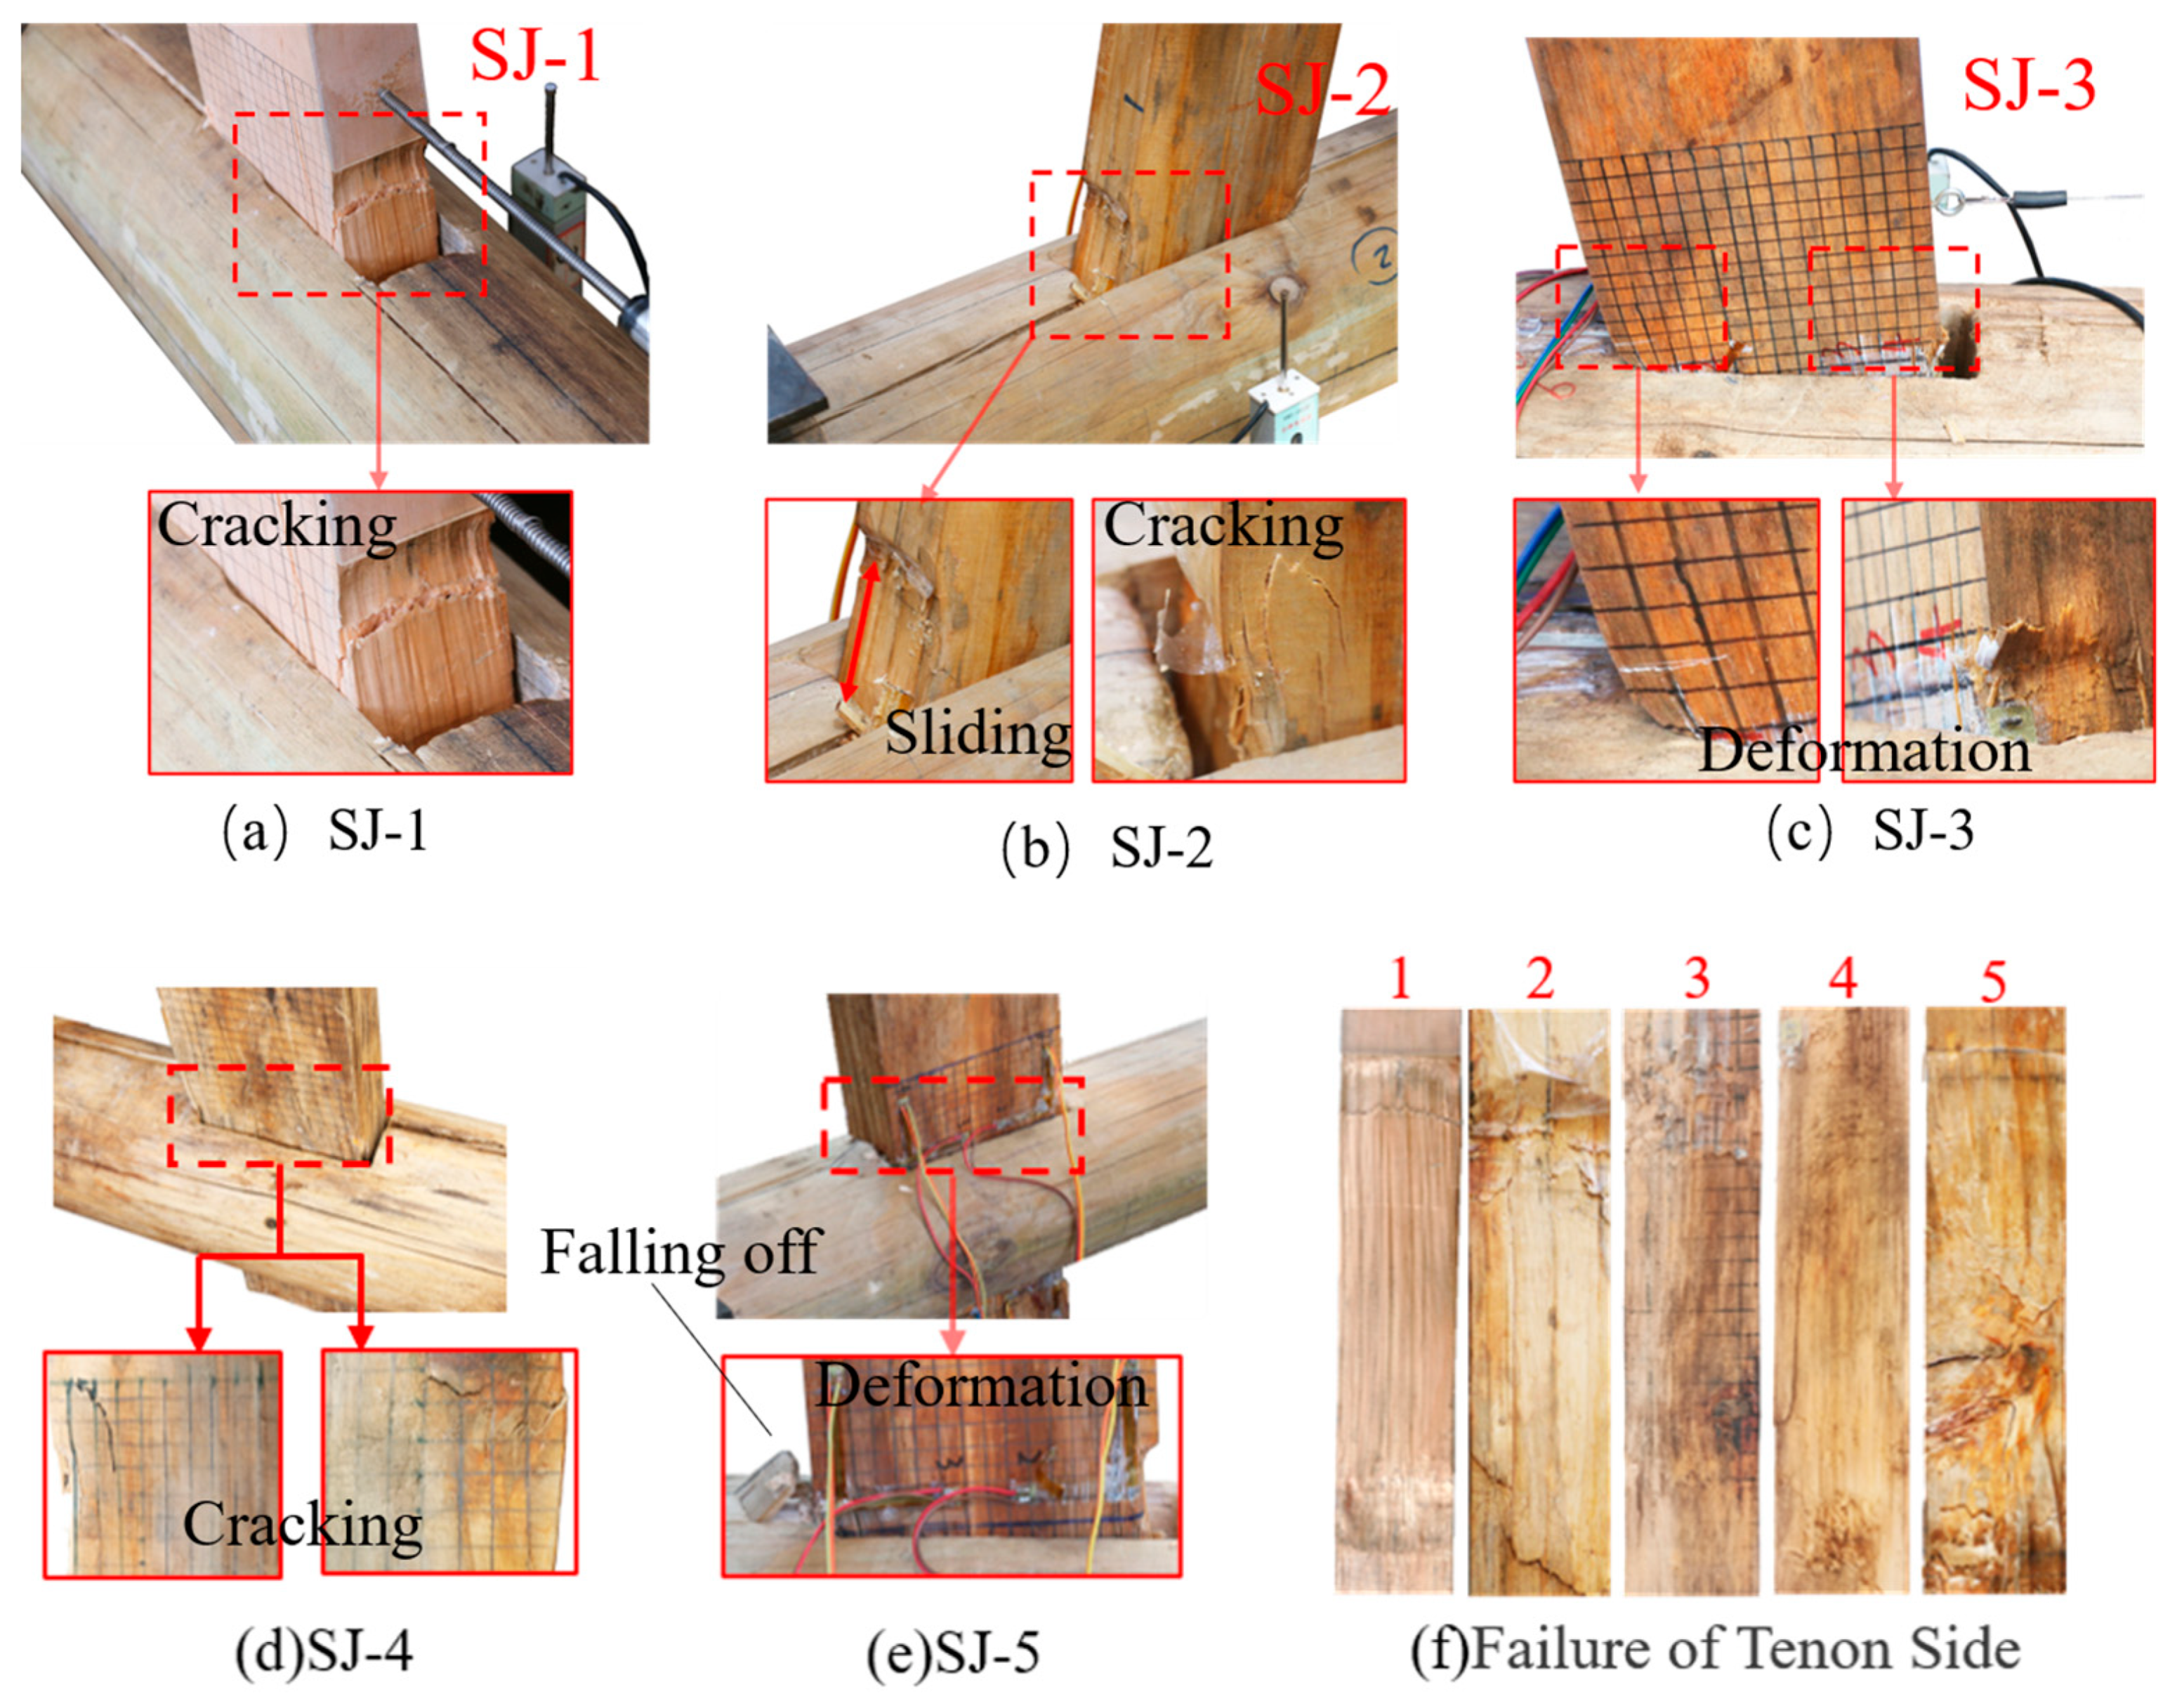
In the control group SJ-1, when the negative loading displacement reached 85 mm, the outer surface of the tensile part of the tenon suddenly fractured (Figure 7a). When the displacement reached 105 mm, a loud cracking sound was audible from the tenon, which exhibited significant deformation and pulling out by approximately 20 mm. Concurrently, the maximum loading displacement of the actuator was reached, and the loading was terminated.

Figure 7.
Failure modes of SMTJs. (a) The failure modes of SJ-1; (b) the failure modes of SJ-2; (c) the failure modes of SJ-3; (d) the failure modes of SJ-4; (e) the failure modes of SJ-5; (f) the failure modes of tenon side.
During the loading sequence for specimen SJ-2, once the displacement exceeded 60 mm, a shear fracture of the wood caused smaller wooden shards to emerge from the outer surface of the compressed part of the tenon. Upon reaching a load of 95 mm, cracks appeared, as shown in Figure 7b. When the loading displacement was 105 mm, significant sliding was observed at the joint, and the tenon at the mortise was pulled out by 25 mm.
Similar to specimen SJ-2, specimen SJ-3 exhibited a slight shear fracture on both the upper and lower surfaces of the tenon when the loading displacement exceeded 60 mm (Figure 7c). Notably, when the loading displacement reached 75 mm, there was a loud fracturing sound, and cracks were observable in the tenon. At the end of the loading stage, the deformation and sliding of the tenon increased, and the tenon was pulled out by 30 mm.
Specimen SJ-4 exhibited early deformation during the initial loading stage. When the loading displacement reached 40 mm, a clear sound of wood fracture from the joint was audible. As the loading continued to a displacement of 55 mm, there was a sudden and louder fracturing sound from the tenon, accompanied by readily visible cracks in the tensile part of the tenon (Figure 7d). At the end of the loading process, the tenon pulled out by approximately 30 mm.
During the loading stage for specimen SJ-5, when the displacement reached 25 mm, the tenon deformed significantly, leading to sudden and extensive sliding, resulting in a significant reduction in the applied load. When further loaded to a displacement of 55 mm, significant cracks occurred at the tension end of the tenon, accompanied by a shear fracture of the sawdust on the outer side of the tenon (Figure 7e). At the end of the loading process, the specimen exhibited excessive deformation, with the tenon experiencing significant sliding and the tenon pulling out by as much as 30 mm.
The amount of tenon removal at the maximum loading displacement increased as the decay period increased. The loading displacement decreased as the node underwent significant deformation and when there was significant fracturing of the tenon. This is because as the decay cycle progressed, the mechanical strength of the wood decreased, leading to an early occurrence of the yield deformation process in the SMTJs.
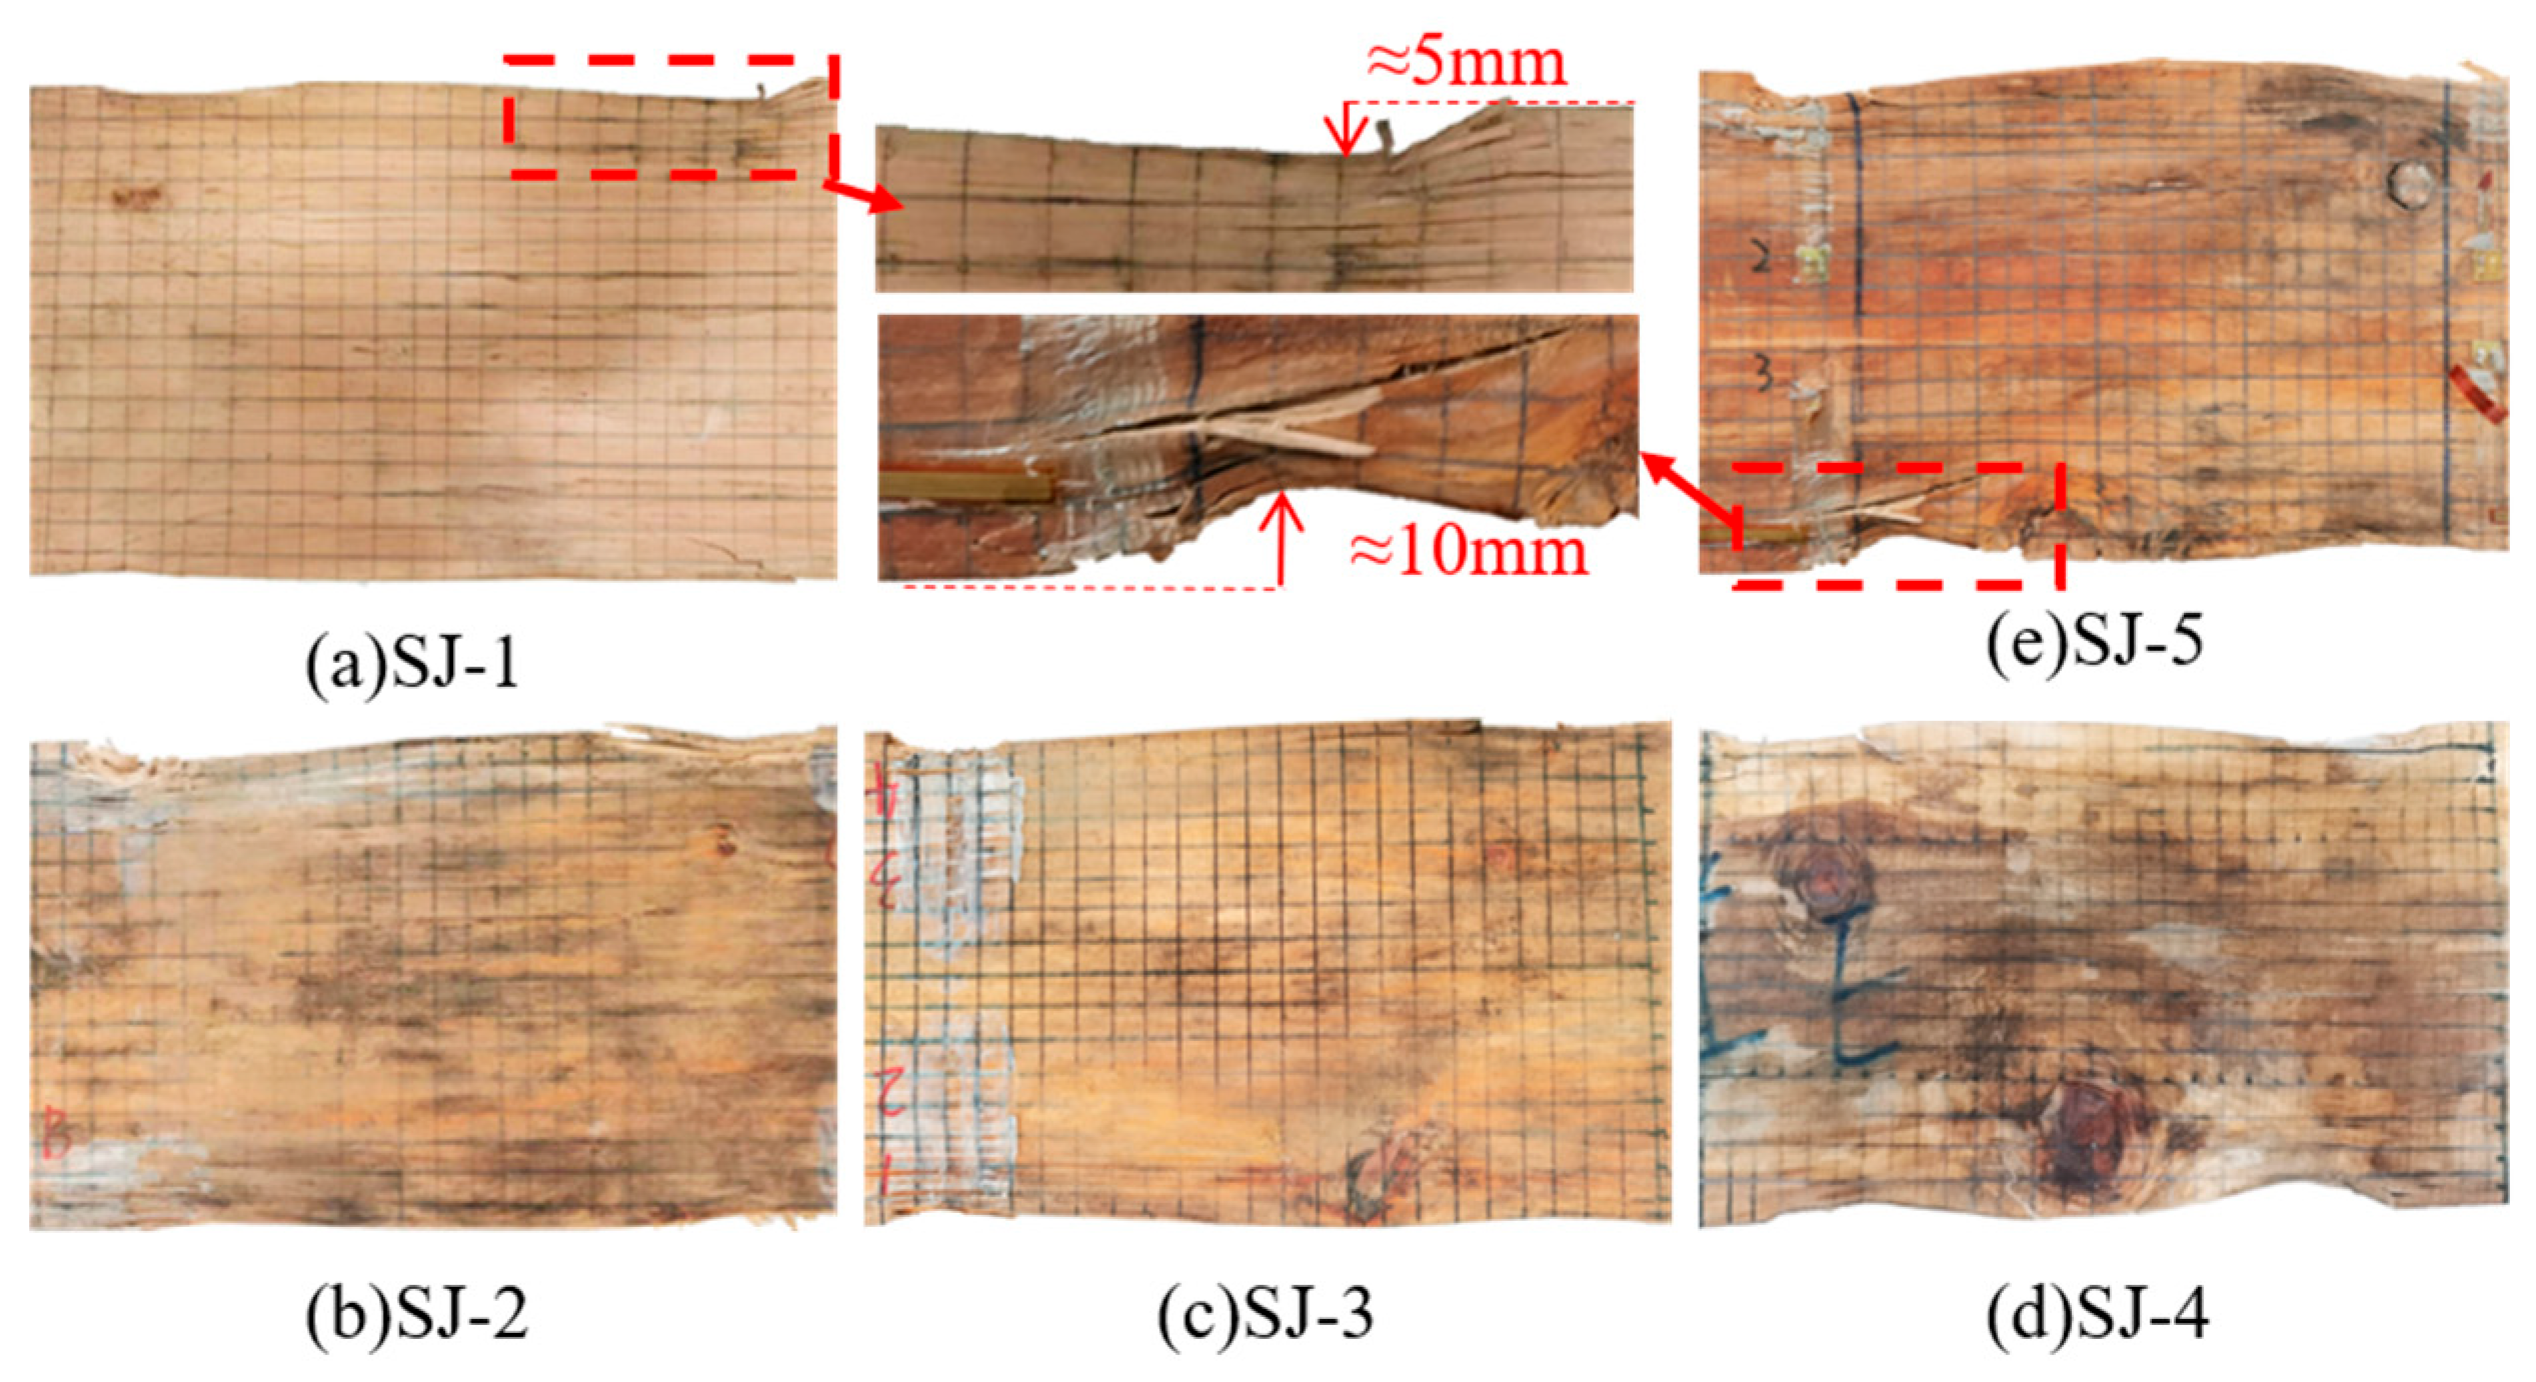
The specimens were extracted for further examination after loading to assess the failure morphologies on both the tenon side and front. Corresponding visuals are provided in Figure 7f and Figure 8. The findings revealed a gradual increase in the transverse compression deformation of the tenon as the decay time progressed, while the plastic deformation increased significantly. These observations remained consistent even under the same loading displacement.

Figure 8.
Tenon deformation. (a) The deformation of SJ-1; (b) the deformation of SJ-2; (c) the deformation of SJ-3; (d) the deformation of SJ-4; (e) the deformation of SJ-5.
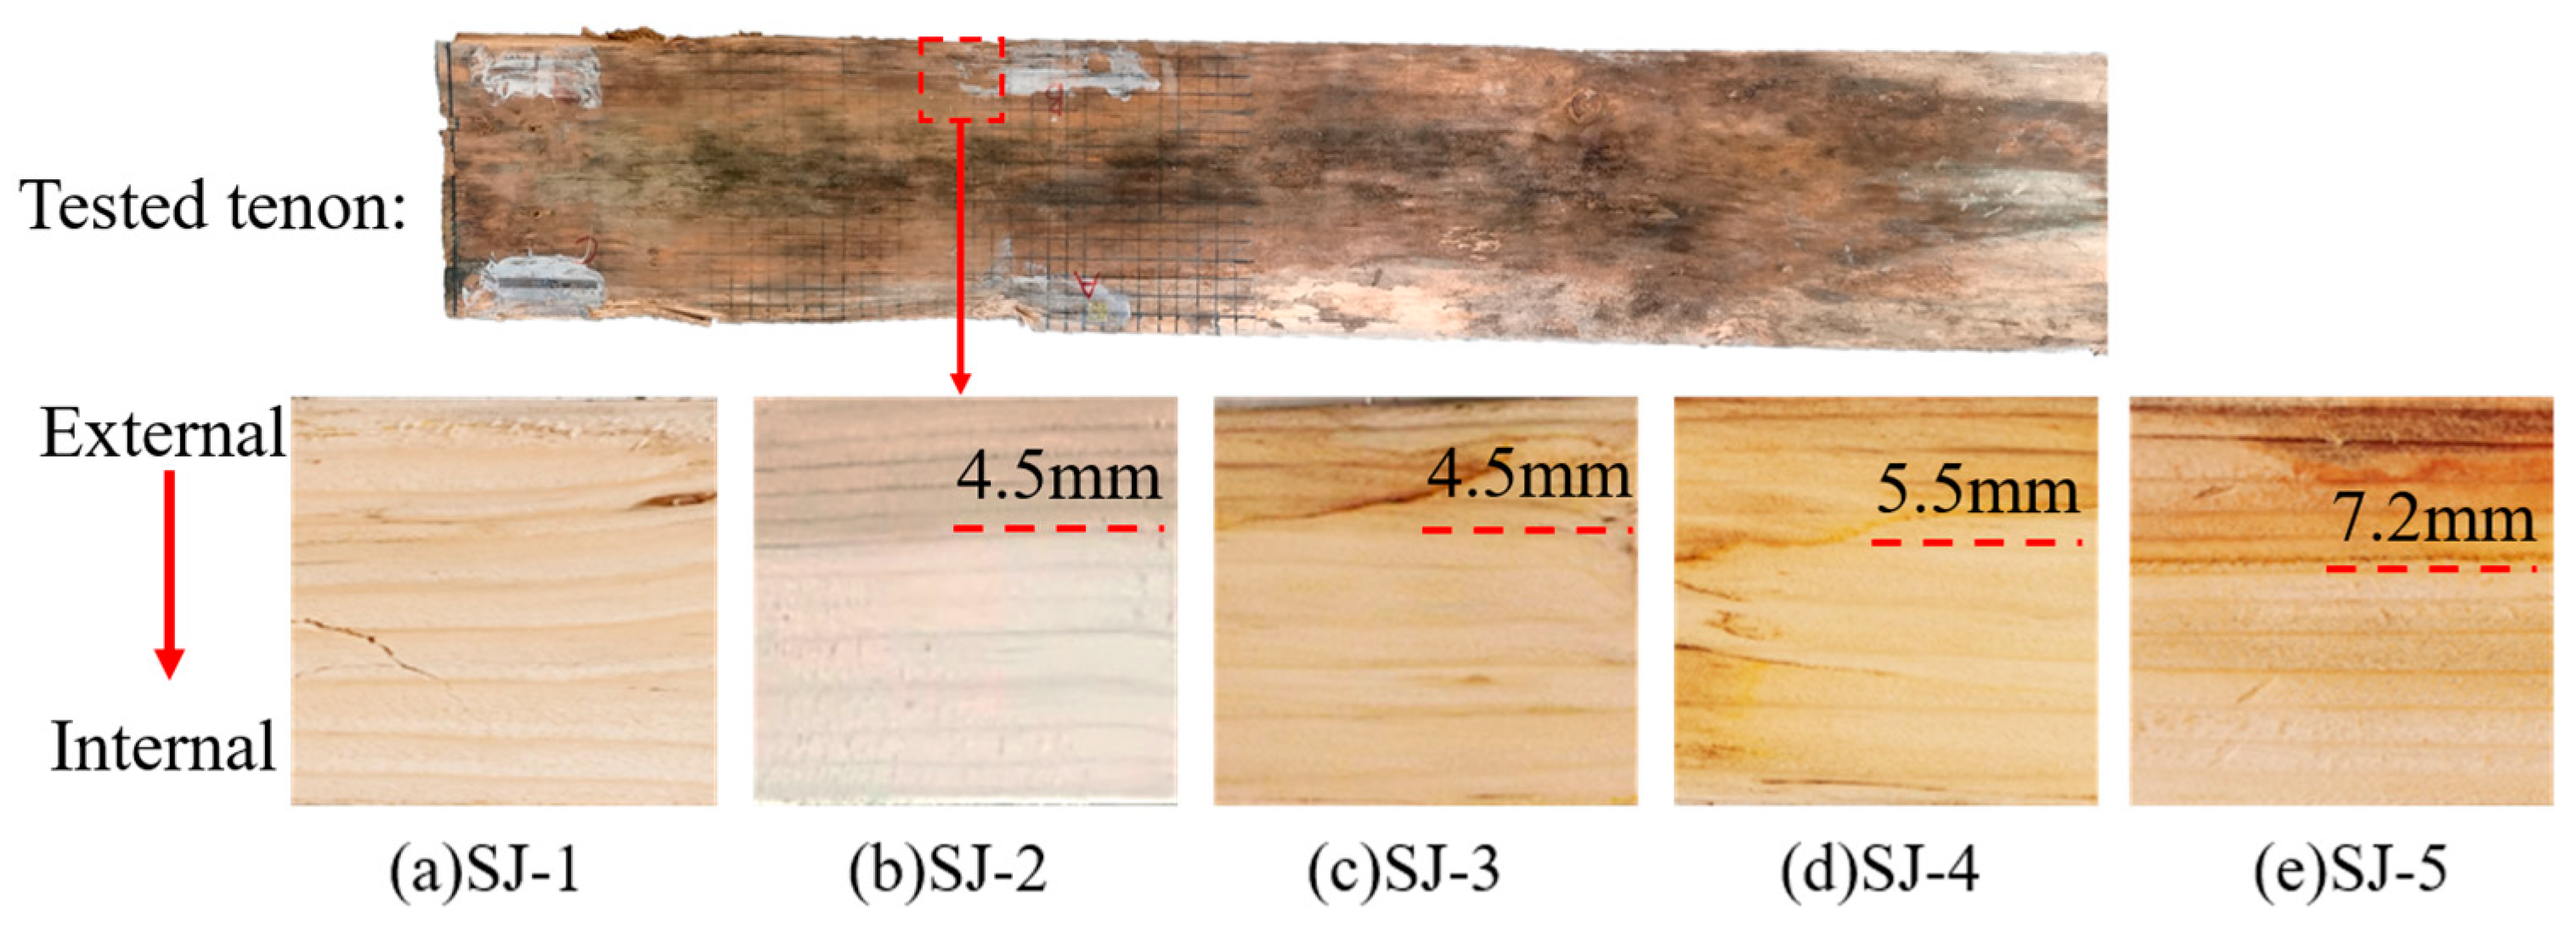
To visually observe the color changes inside the mortise tenons with different degrees of decay, after testing the tenons, the parts near the main force-bearing areas of the tenons were cut from the outside to the inside, with the cut surface parallel to the grain direction of the wood. The cut line was along the midline in the thickness direction of the mortise tenon, as shown in Figure 9. Notably, areas affected by decay exhibited a darker coloration, with decay intensity positively correlating with decay cycle duration. Furthermore, the decay appears to spread more uniformly throughout the internal structure, with the size of the decayed area displaying a direct relationship with the length of the decay cycle. The coloration within the decayed areas varied; generally, the outer end face had a darker shade, and color distribution within the decayed region became less uniform with prolonged decay cycle duration.
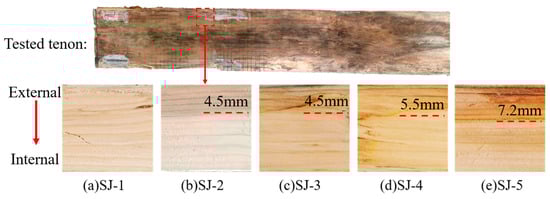
Figure 9.
Internal color change in tenons.
3.2. Hysteresis Curve and Skeleton Curve
The bending moment (M) and its corresponding rotation of the joint (θ) are determined as follows:
where P represents the load applied by the actuator, H denotes the distance between the upper surface of the column and the loading point, and Δ signifies the horizontal displacement of the loading point. Hysteresis curves and skeleton curves of the decayed SMTJs are provided in Figure 10.
M = PH,
θ = Δ/H,
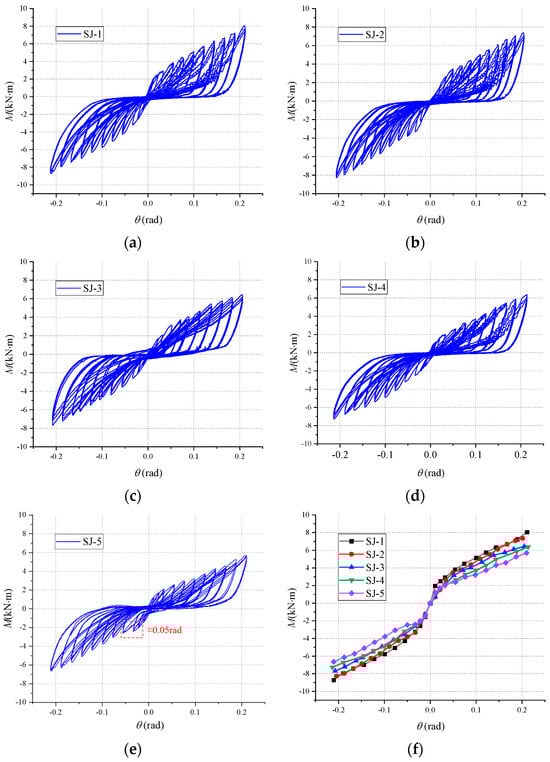
Figure 10.
(a) M-θ hysteresis curves of specimens cultured for 0 weeks. (b) M-θ hysteresis curves of specimens cultured for 6 weeks. (c) M-θ hysteresis curves of specimens cultured for 12 weeks. (d) M-θ hysteresis curves of specimens cultured for 18 weeks. (e) M-θ hysteresis curves of specimens cultured for 24 weeks. (f) M-θ skeleton curves of specimens.
All the hysteresis curves of the joints are reverse S-shaped with a noticeable pinch phenomenon. This indicates that SMTJs experienced slipping under low-cycle repeated loads. Furthermore, as the loading displacement and decay period increased, the slip phenomenon became more pronounced. Initially, the positive and negative bending moment values of the hysteresis curves are symmetrical corresponding to the early stage of experimental loading. This symmetry deteriorates relative to the later stages of loading, with the negative bending moment surpassing the positive loading bending moment. This can be attributed to the increased deformation of the SMTJs during the loading process, leading to slip phenomena. There was slightly more slippage during forward loading compared to negative loading, resulting in a decrease in the bending moment value during forward loading.
The hysteresis curve envelope initially presents a full shape for specimens SJ-1, SJ-2, SJ-3, SJ-4, and SJ-5, which grows less pronounced corresponding to the later stages of loading. This decrease indicates that the energy-dissipation performance of the joint deteriorated as the decay period and loading angle increased. Apart from a sudden significant slip of SJ-5 at a turning angle of around 0.05 rad, which led to a certain degree of decrease in the bending moment value, joints with longer decay cycles were more prone to deformation during loading. This caused an increase in clearance between the mortise and tenon in the later stages of loading, reducing frictional energy consumption in the joint.
Figure 10f illustrates the forward loading section of the SMTJs, where there are two distinct stages: the elastic stress stage and the plastic development stage. The elastic stress stage encompasses the initial loading stage and progresses until the slope of the skeleton curve in the forward loading section significantly declines. During this stage, the mortise and tenon gradually compressed, while the bending moment rapidly increased with the rotation angle. As loading continued, the joint began to exhibit plastic failure, resulting in a gradual increase in bending moment values and a decrease in the slope of the skeleton curve. The skeleton curves of the five cycles show where SJ-1 and SJ-2 remained in the elastic stage until reaching a loading angle of approximately 0.05 rad, while SJ-3 reached this stage at 0.035 rad, SJ-4 at 0.03 rad, and SJ-5 at 0.02 rad. This indicates that as the decay cycle increased, the degree of joint decay intensified, the elastic stress stage diminished, the plastic development stage extended, and the plastic performance of the nodes became more prominent.
Based on the technical code for the maintenance and strengthening of ancient timber buildings [43], the inter-story displacement angle of wood-structure buildings is limited to 1/30. In the case of Tusi Manor, the deformation of the internal wooden frame has primarily resulted from SMTJ deformation. Thus, it can be inferred that a rotational performance limit of 1/30 applies to SMTJs. As indicated in Figure 10f, when the turning angle of all nodes exceeds 0.20 rad (approximately 1/7), the bending moment value of the joint continues to increase. This suggests that SMTJs are highly durable, with favorable rotational performance even in the presence of decay. Furthermore, these results imply that the service life of Tusi Manor will be able to continue for some time.
3.3. Strength and Stiffness Degradation
Each low-cycle repeated loading process comprised three cycles of loading. Starting from the third loading stage, the peak load and hysteresis loop area of the first cycle exceeded those of the second and third cycles. This suggests that the SMTJs experienced plastic deformation during the first cycle, resulting in gaps between mortises and tenons during subsequent cycles. Consequently, there was a decrease in both the peak load and the hysteresis loop area. Phenomena wherein a horizontal load acting on a joint gradually decreases with increasing loading cycles are commonly referred to as “strength degradation”. The formula for calculating the strength degradation factor is as follows:
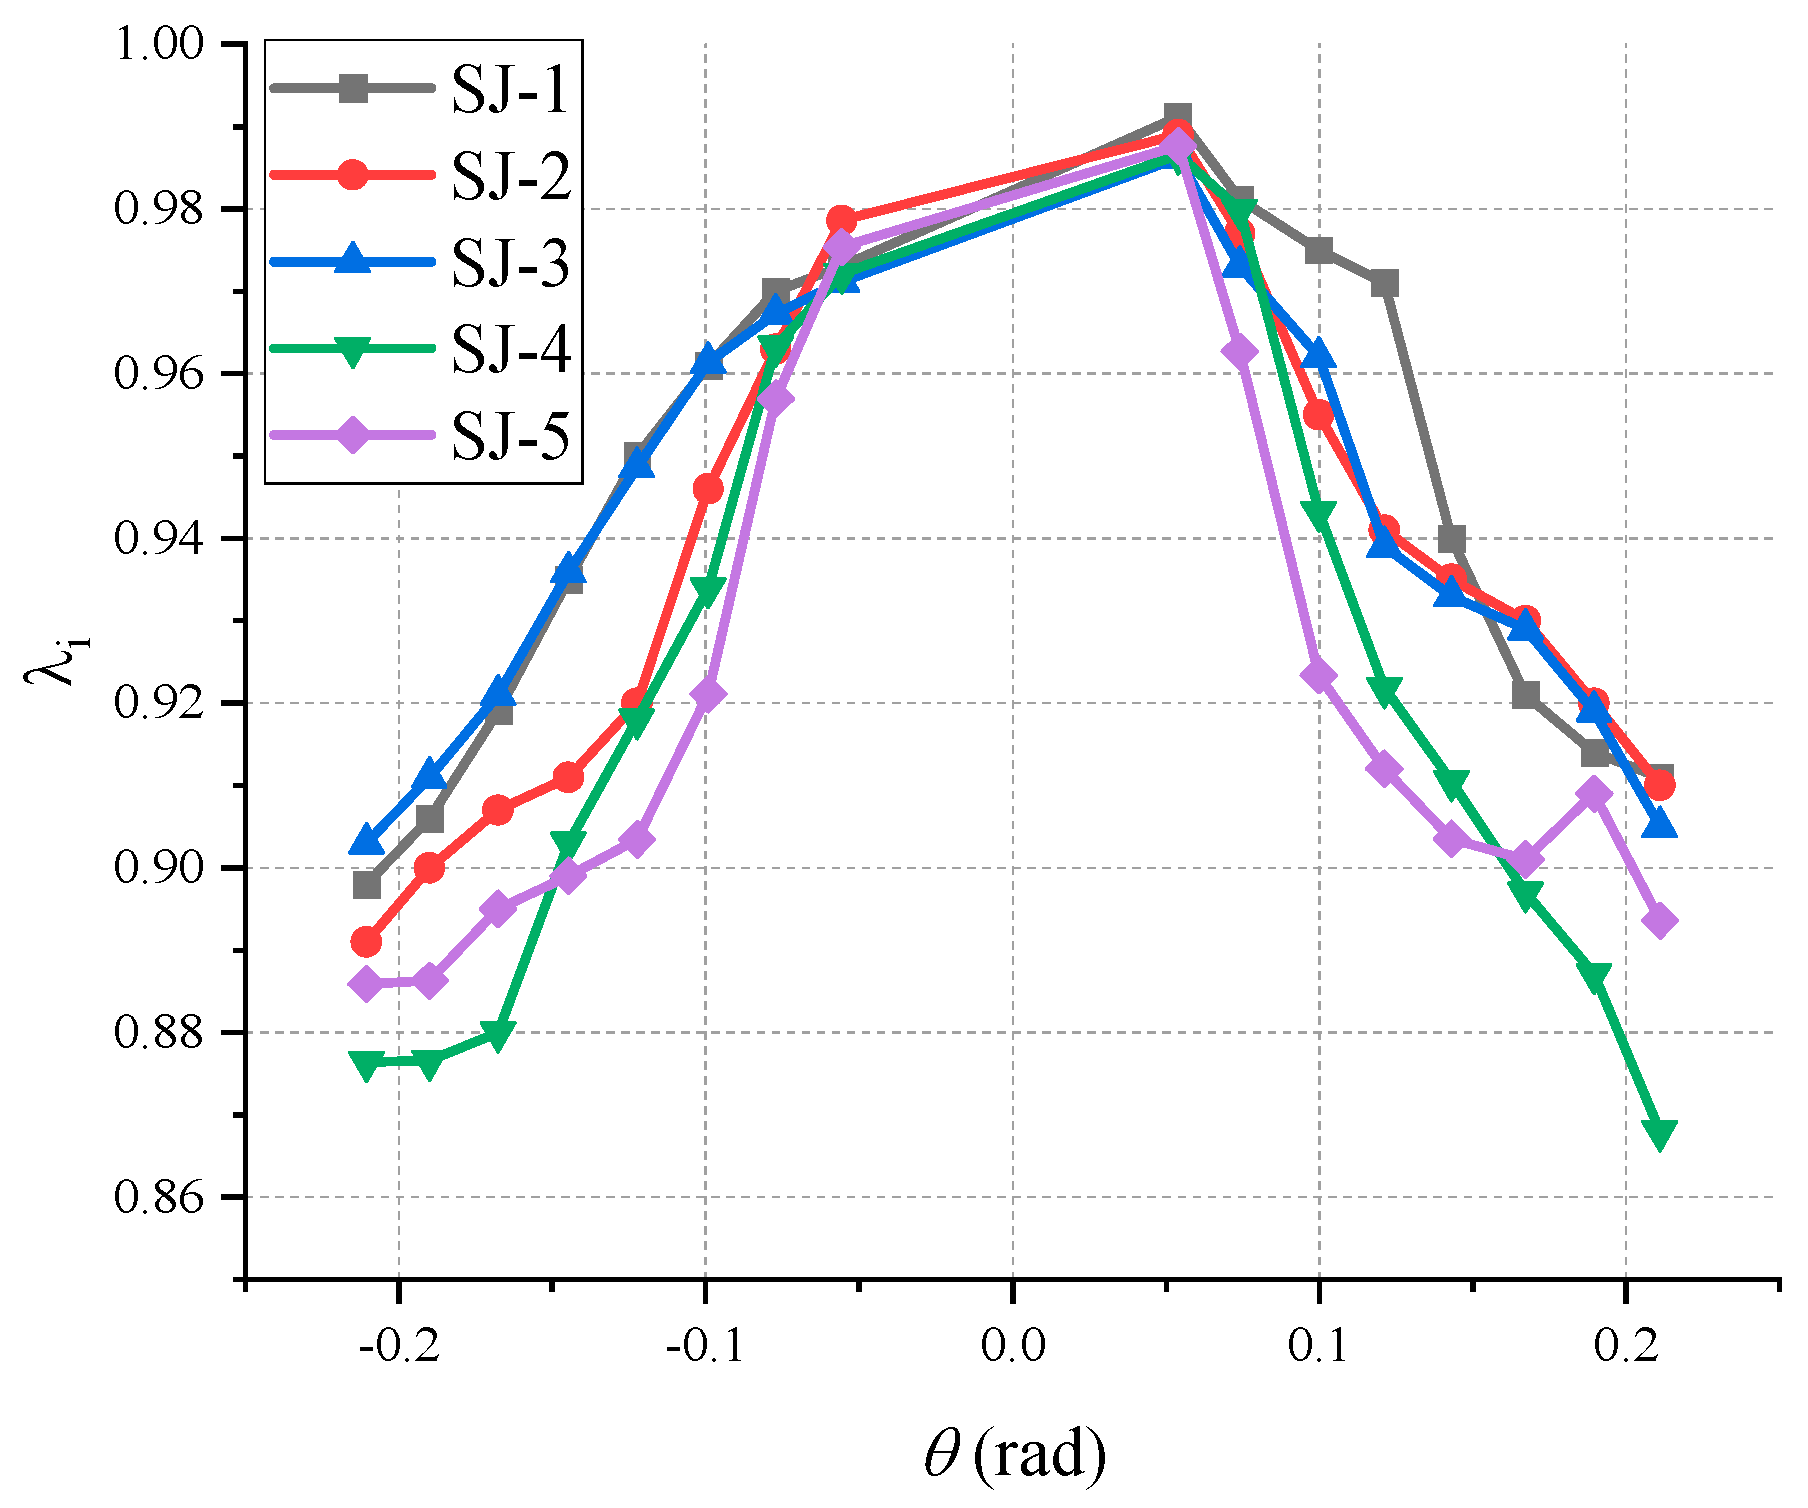
where the strength degradation factor for the i-th loading stage is denoted as λi. Pi,1 represents the peak load of the first cycle in the i-th loading stage, and Pi,3 represents the peak load of the third cycle in the same loading stage. By utilizing Equation (3) and referring to Figure 11, it is possible to calculate the variation pattern of the strength degradation factor for each node.
λi = Pi,3/Pi,1

Figure 11.
Strength degradation.
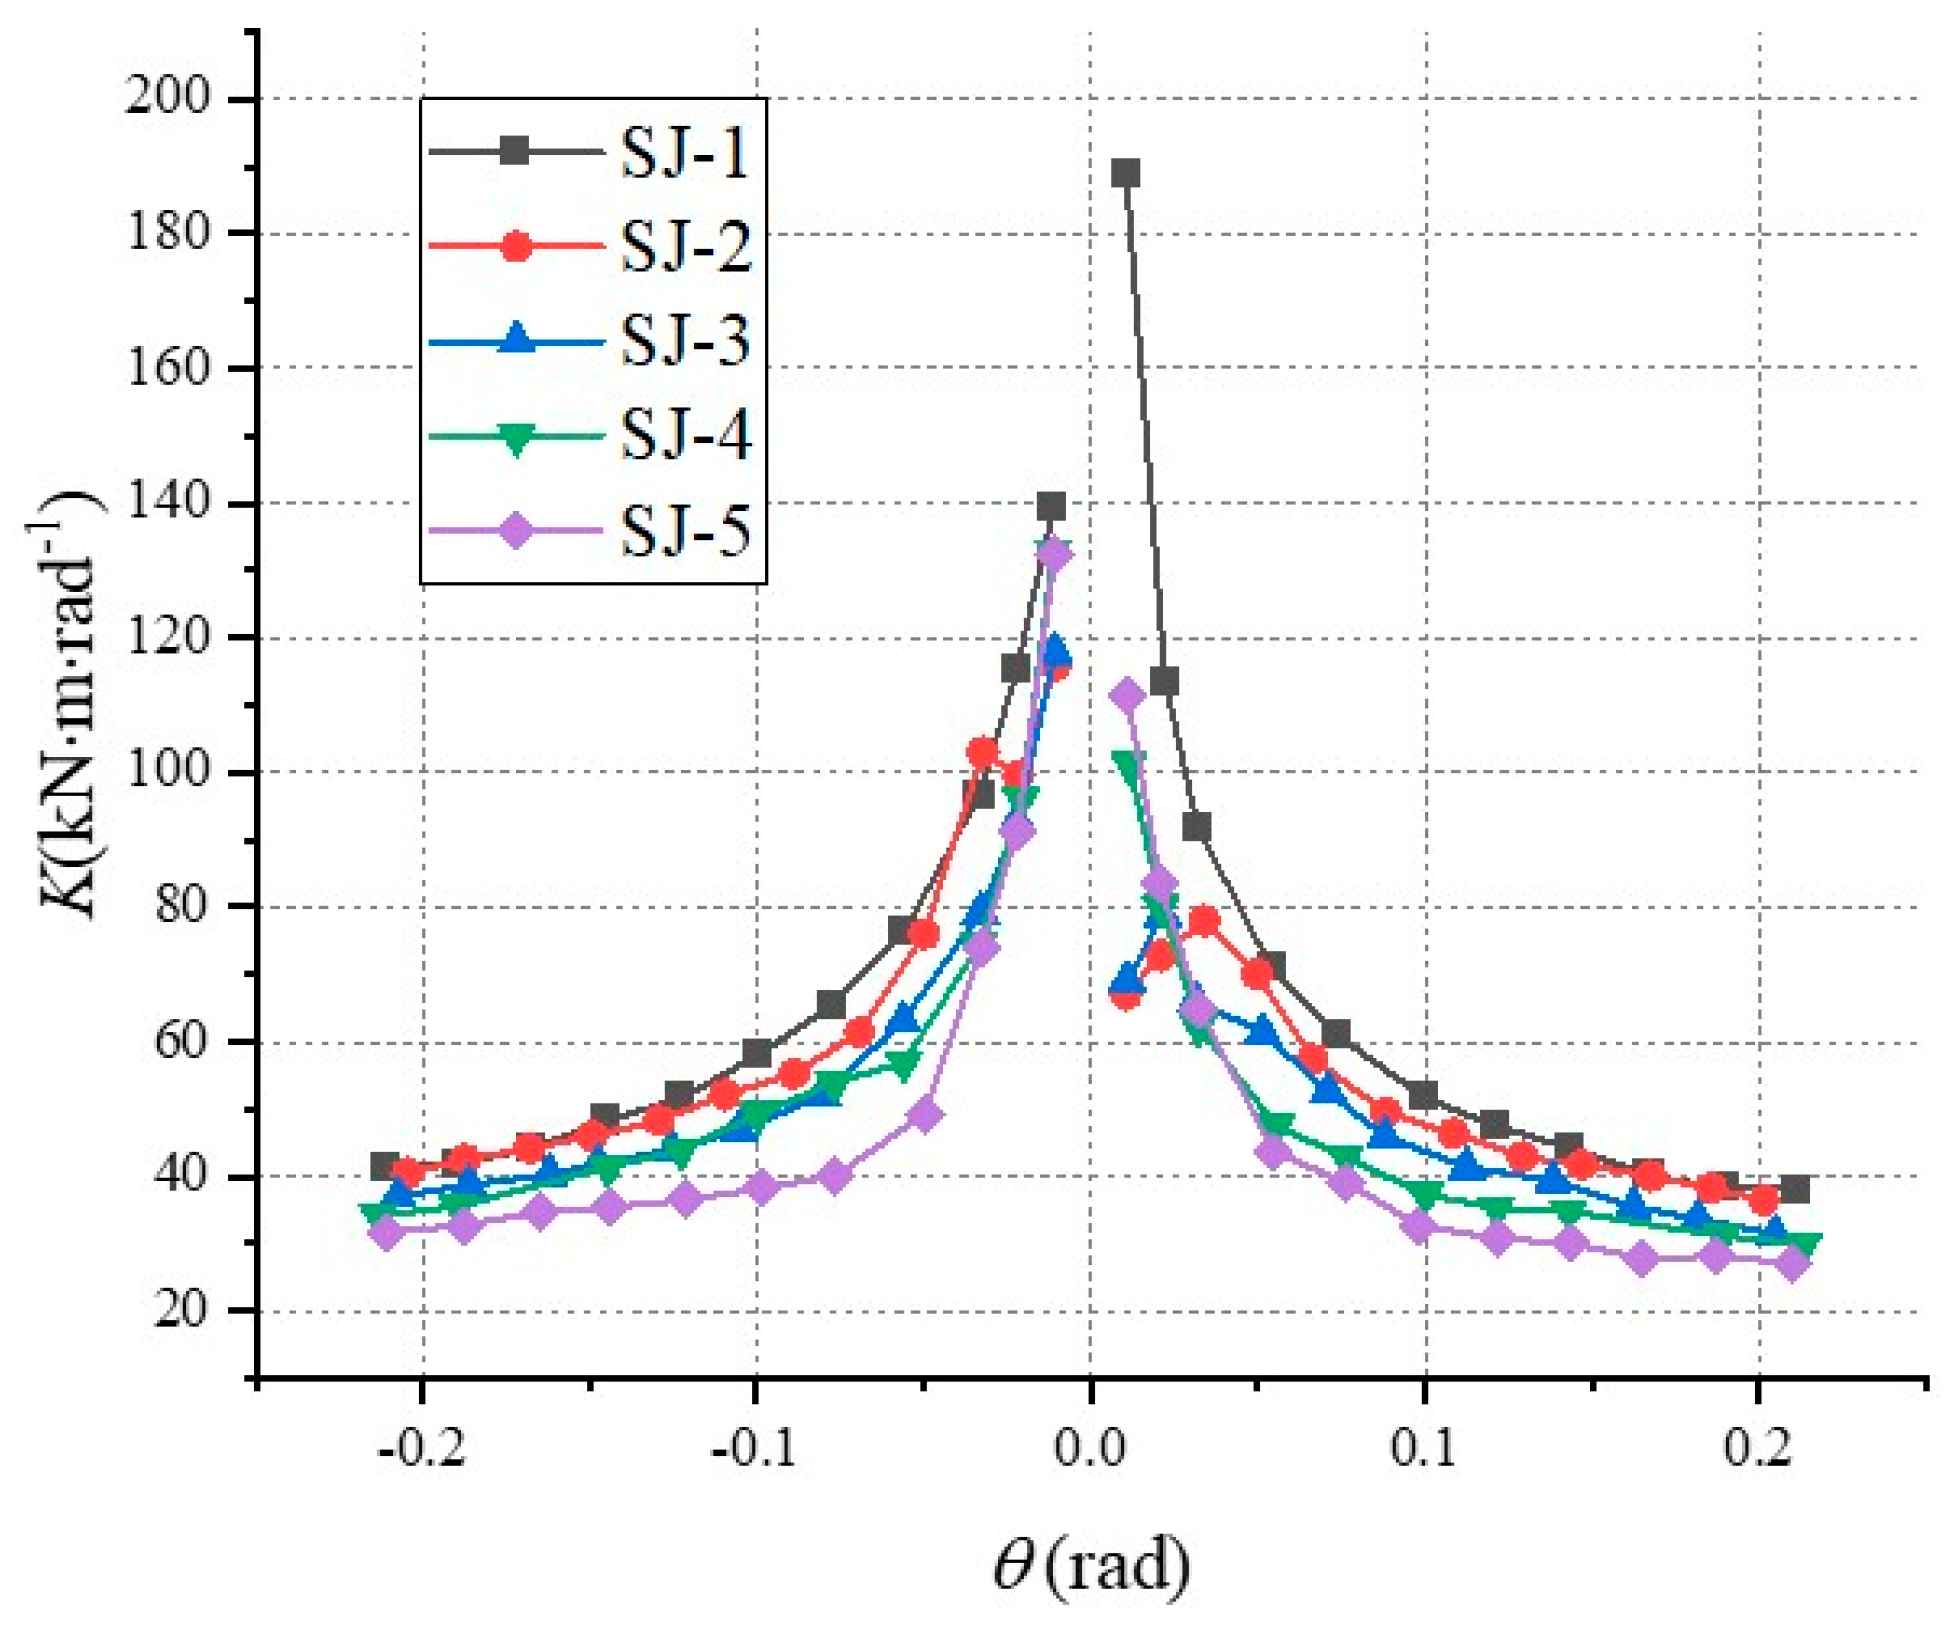
Phenomena whereby stiffness gradually decreases as the number of loading cycles and displacement increases are known as “stiffness degradation”. In the presence of horizontal repeated loads, stiffness can be represented by the secant stiffness obtained from hysteresis curves at different loading displacements. This secant stiffness can be calculated as follows:
where Ki is the secant stiffness under the i-th level loading displacement, Mi is the peak bending moment under the i-th level loading displacement, and θi is the joint rotation angle corresponding to Mi. The rotational stiffness of each joint calculated through Equation (4) is depicted in Figure 12.
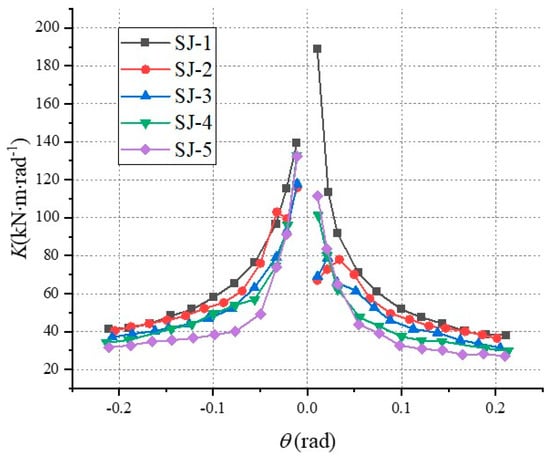
Figure 12.
Stiffness degradation.
As shown in Figure 11, there was a gradual increase in the strength degradation factor of all joints as loading displacement increased; this trend intensified as the decay duration increased. Initially, during the early loading stages, the strength degradation among joints was relatively uniform. However, at a loading angle of approximately 0.20 rad, the strength degradation factors of specimens SJ-1 and SJ-2 both stabilized around 0.9, while specimens SJ-4 and SJ-5 had already dropped below 0.88. This disparity can be attributed to the larger decay period causing significant internal damage within the tenon. Consequently, the joint experienced substantial deformation during the third loading stage, leading to a reduction in the bending moment value.
As depicted in Figure 12, the stiffness reduction in all joints exhibits a consistent trend; SMTJs stiffness gradually decreased as the loading displacement increased. Initially, the stiffness declined rapidly until the loading angle exceeded 0.05 rad, after which point the decrease became slower and eventually stabilized. With an increase in decay depth, the initial stiffness of the joint significantly decreased. Furthermore, the disparity between the initial stiffness of the joint and the stiffness at the end of the loading process also increased as the decay depth increased.
Among the specimens, SJ-1 demonstrates the largest discrepancy in initial stiffness when compared to the other four groups. This indicated that the occurrence of surface decay exerted the most substantial impact on the initial stiffness of the joint. However, the deepening of decay after this initial decay had a relatively minor influence on stiffness. After the loading angle surpassed 0.10 rad, the stiffness of SJ-2 approached or even exceeded that of SJ-1. This can be attributed to the relatively low decay depth of SJ-2. When the loading angle was larger, the external decay area of SJ-2 was compressed and compacted, while the internal non-decayed area still possessed favorable mechanical properties. As a result, it generated a larger bending moment during loading.
3.4. Degradation of Bearing Capacity and Energy Consumption Capacity
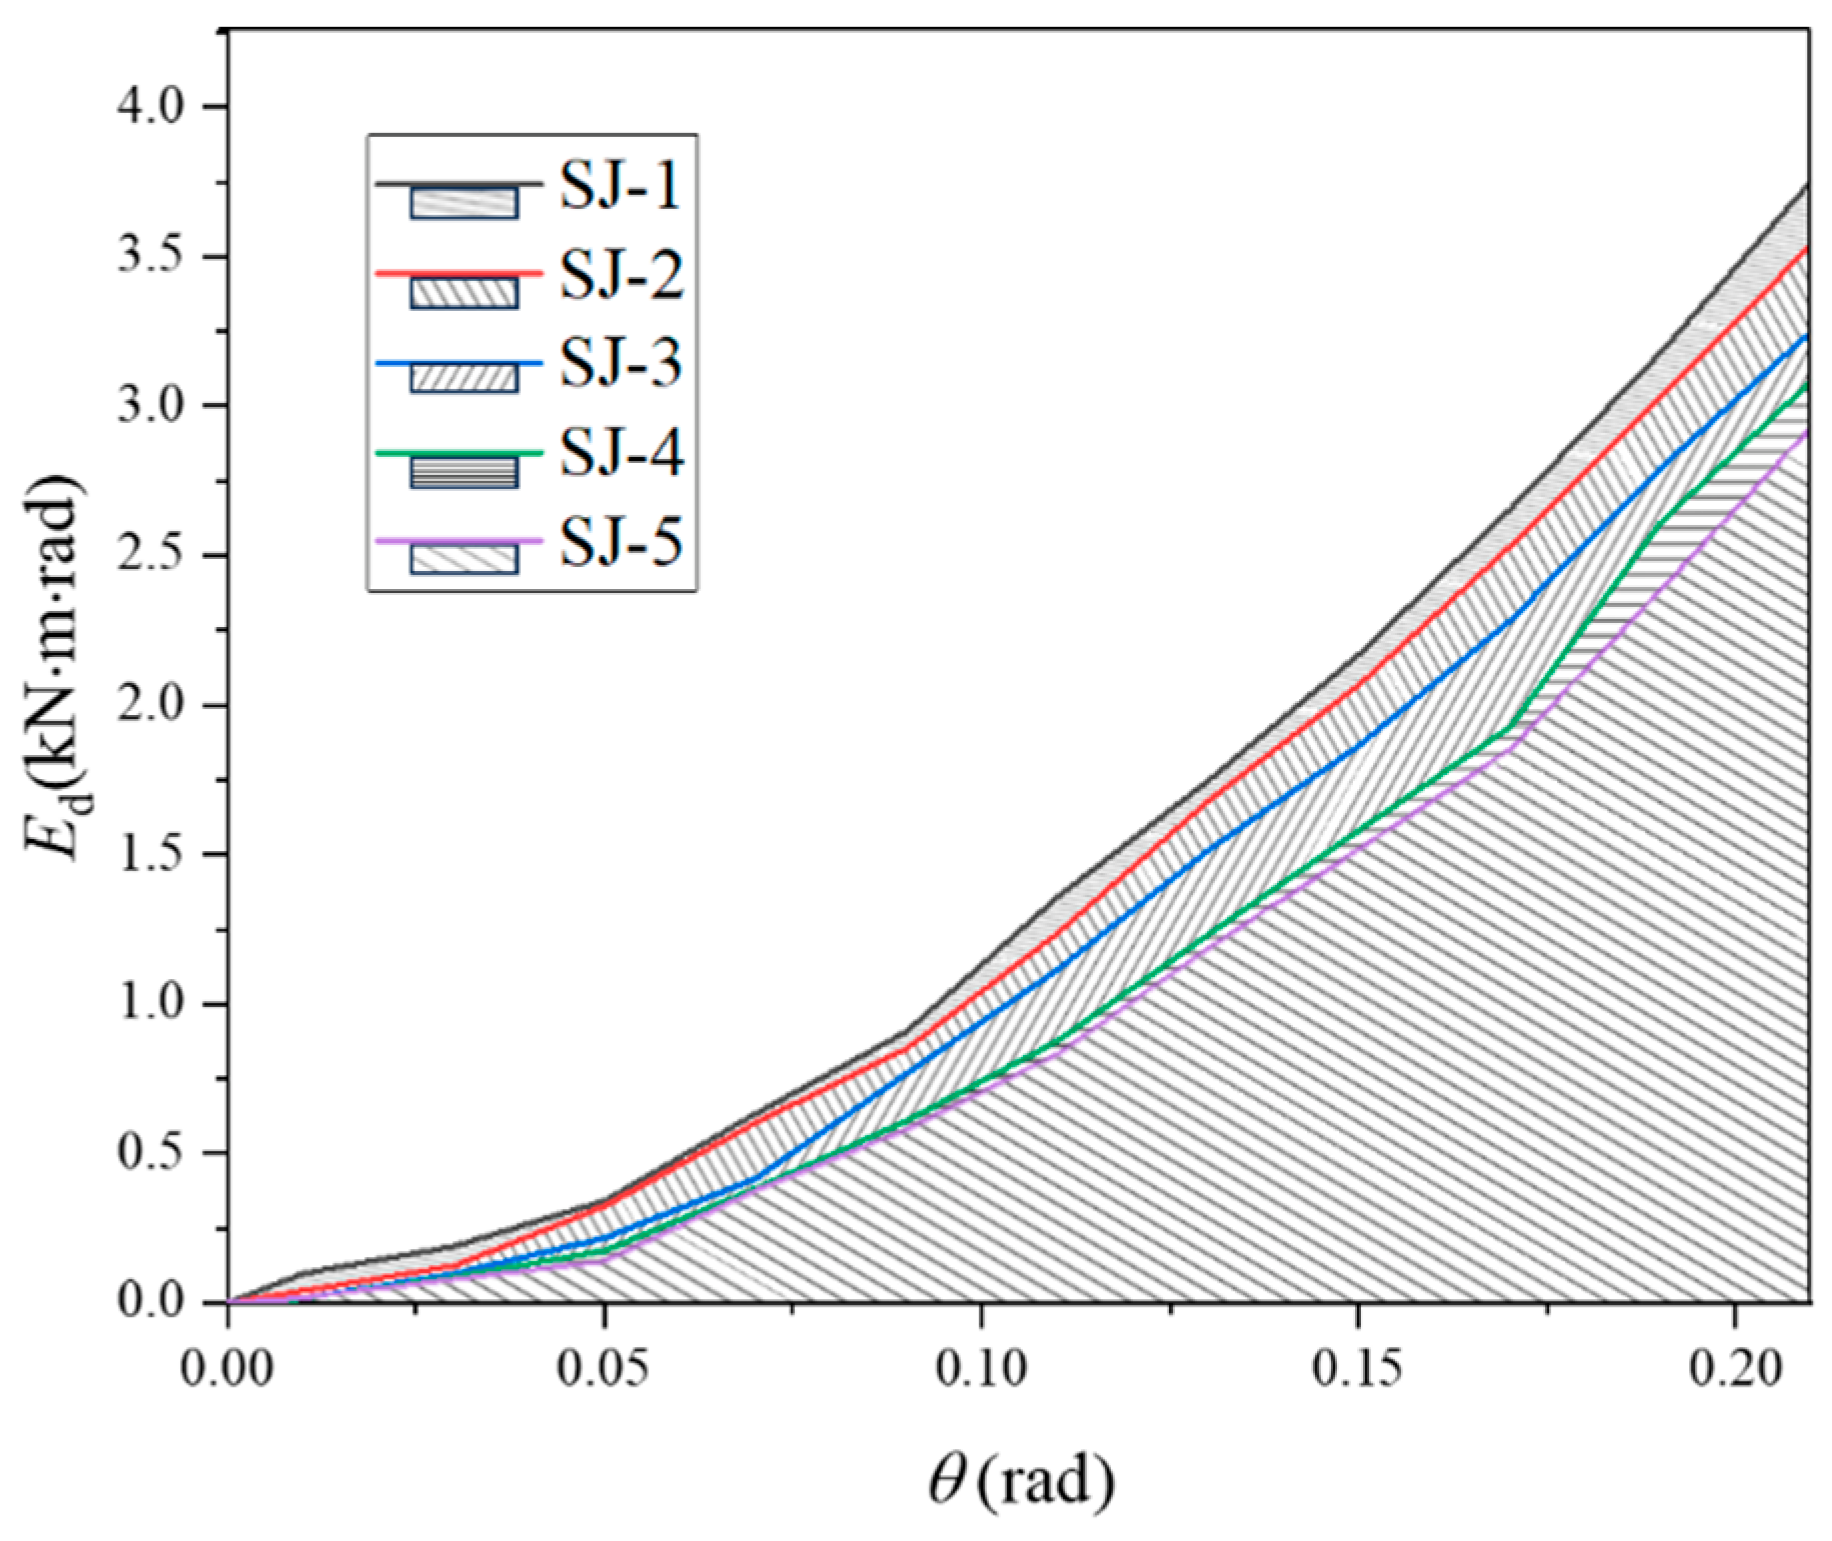
The hysteresis curve represents the energy-dissipation (Ed) capacity of the joint. The area enclosed by the hysteresis curve indicates the amount of energy consumed during loading and unloading cycles. In this experiment, the area of the hysteresis curve decreased as the degree of decay in the specimens intensified. By comparing the area surrounded by the hysteresis curves of different specimens, as shown in Figure 13, it becomes clear that compared to specimen SJ-1 (with no decay), the area of specimen SJ-2 decreased by 8.38%, SJ-3 decreased by 9.51%, SJ-4 decreased by 21.33%, and SJ-5 decreased by 33.31%.
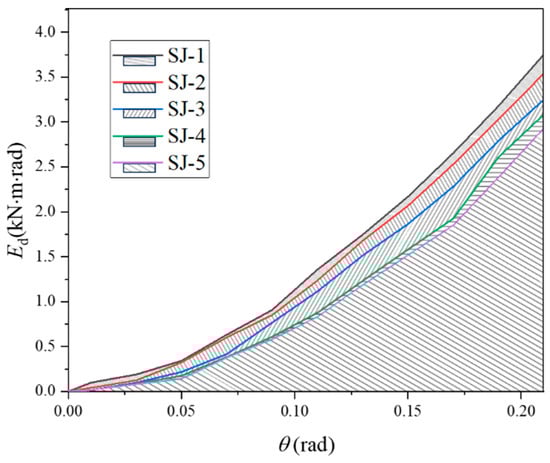
Figure 13.
Hysteresis curve envelope area.
Both forward and negative loading bending moments were considered in evaluating the load-bearing performance of the SMTJs. From the five decay cycles of the skeleton curve, it can be inferred that the negative loading moment is greater than the positive loading moment. Therefore, the absolute value of negative bending moments can be used to represent the maximum load-bearing performance of the joint.
Figure 14 shows how the ultimate bearing capacities of the specimens decreased as the decay cycles increased. For example, the 6-week-decayed SMTJs exhibited a decrease in the ultimate bearing capacity of approximately 5.17%, while after 12 weeks, this decrease was 11.83%, and it was 17.34% after 18 weeks and 23.54% after 24 weeks. In summary, the energy-dissipation capacity decreased and the load-bearing performance of the SMTJs was significantly affected as the extent of decay deepened. The decrease in the ultimate bearing capacity also became more pronounced with longer decay cycles.
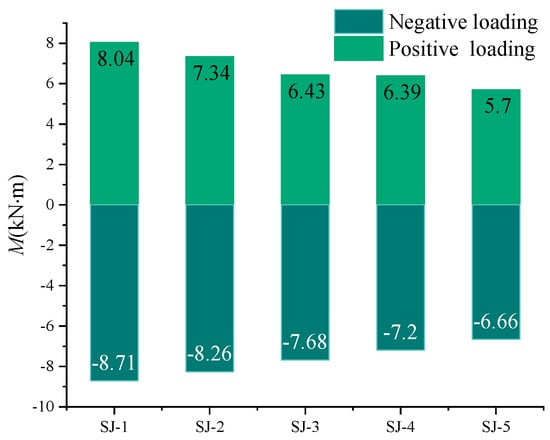
Figure 14.
Degradation of ultimate bearing performance.
The primary behavior of SMTJs under horizontal compression entails transverse compression in the tenon with longitudinal compression in the mortise [44]. Wood has a much higher compressive strength along the grain compared to across the grain. According to the data given in Table 1, this relationship remains consistent even with increasing decay. Decay exerts a minimal influence on the compressive performance along the grain. As a result, there exists a correlation between the decline in compressive properties across the transverse grain and the deterioration of mechanical properties in SMTJs. This correlation enabled us to assess the impact of degraded wood characteristics on the mechanical behavior of the joint specimens.
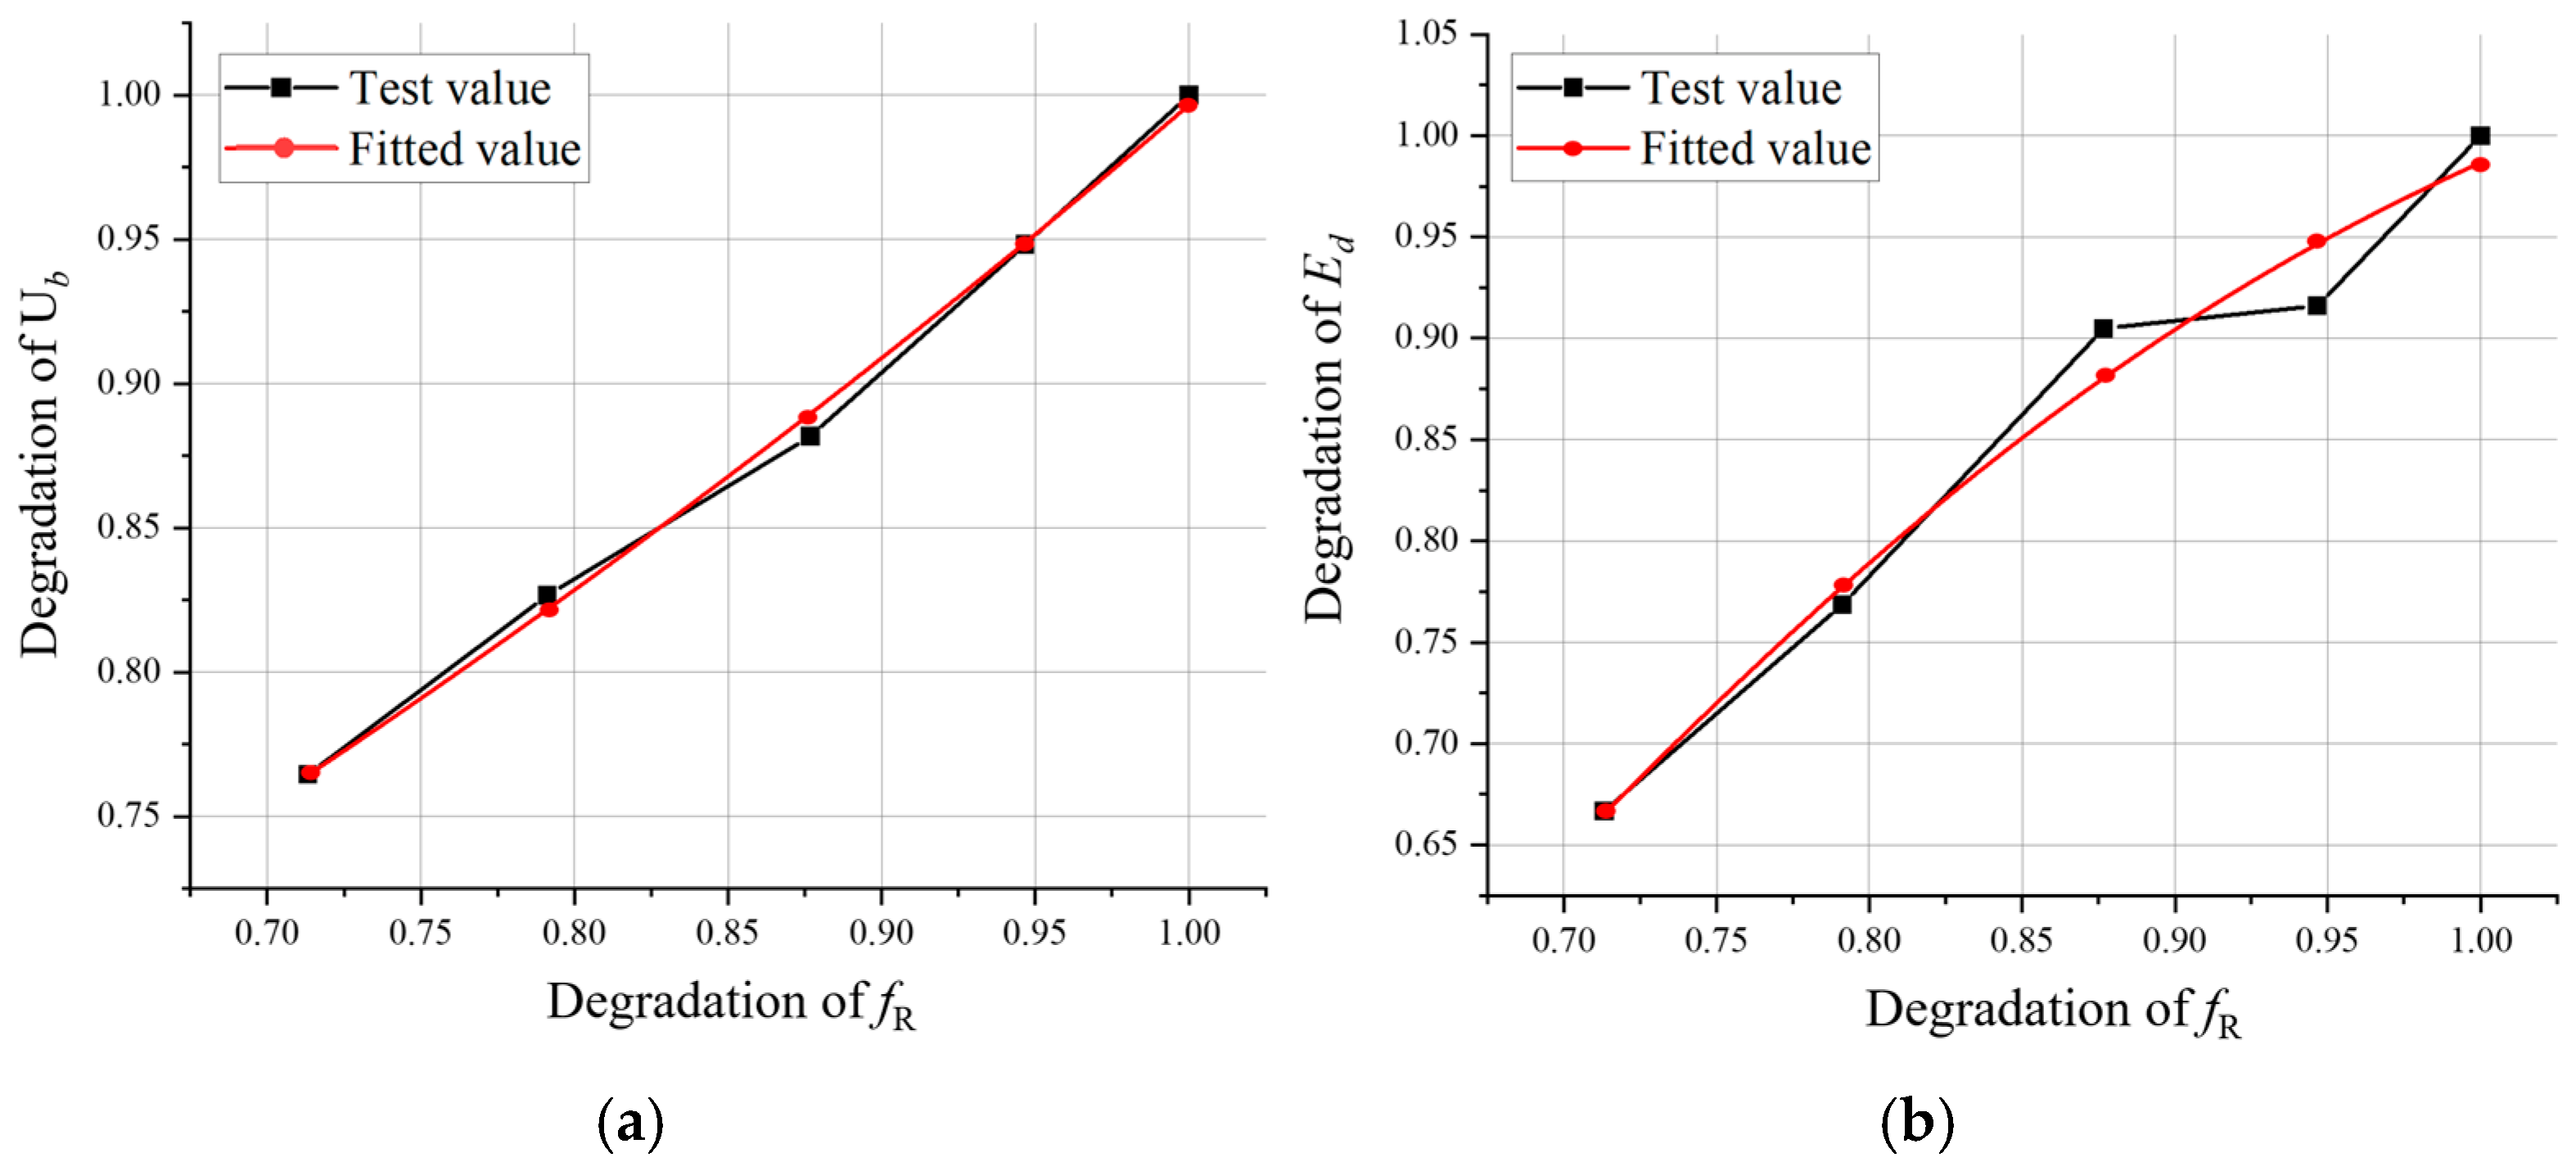
Given the degradation characteristics of mechanical properties in SMTJs, we utilized the sigmoid function, which is commonly employed in machine learning [45], to model the relationship between material property degradation and transverse compressive performance degradation. Employing Origin 2021 data analysis software, the least squares method was applied for numerical fitting to determine the functional relationship between transverse compressive strength and SMTJs mechanical properties, as depicted in Figure 15.
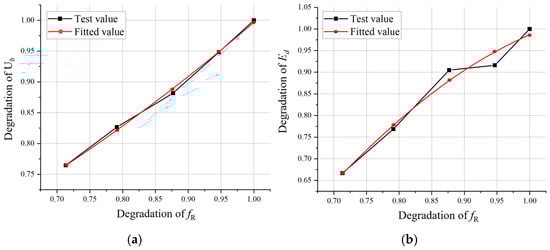
Figure 15.
Relationship between seismic performance of joint and degradation of mechanical properties. (a) The degradation relationship of ultimate load-bearing performance; (b) the degradation relationship of cumulative energy consumption performance.
The fitting formula for the relationship between the attenuation of mechanical performance in SMTJs and the attenuation of transverse compressive performance is as follows:
y = 1.872/(1 + exp(−0.97 x (x − 3.96))), R2 = 0.9972
The expression for the degradation coefficient of the ultimate load-bearing performance is as follows:
y = 1.122/(1 + exp(−5.59 x (x − 0.646))), R2 = 0.9745
The expression of the energy consumption performance degradation coefficient.
Both formulas have determination coefficients greater than 0.95, indicating a strong fitting effect. In practical engineering applications, the degradation of wood transverse compressive strength is relatively straightforward to measure. By analyzing the decrease in wood transverse compressive strength, it is possible to predict the degradation relationship between the ultimate bearing capacity and cumulative energy consumption performance of SMTJs.
4. Finite Element Analysis
4.1. Model Establishment
In these simulations, wood beams and columns were modeled using the three-dimensional solid element C3D8R. The wood was simplified as an orthotropic material, allowing for consideration of its perpendicular properties in the radial, rotational, and transverse directions.
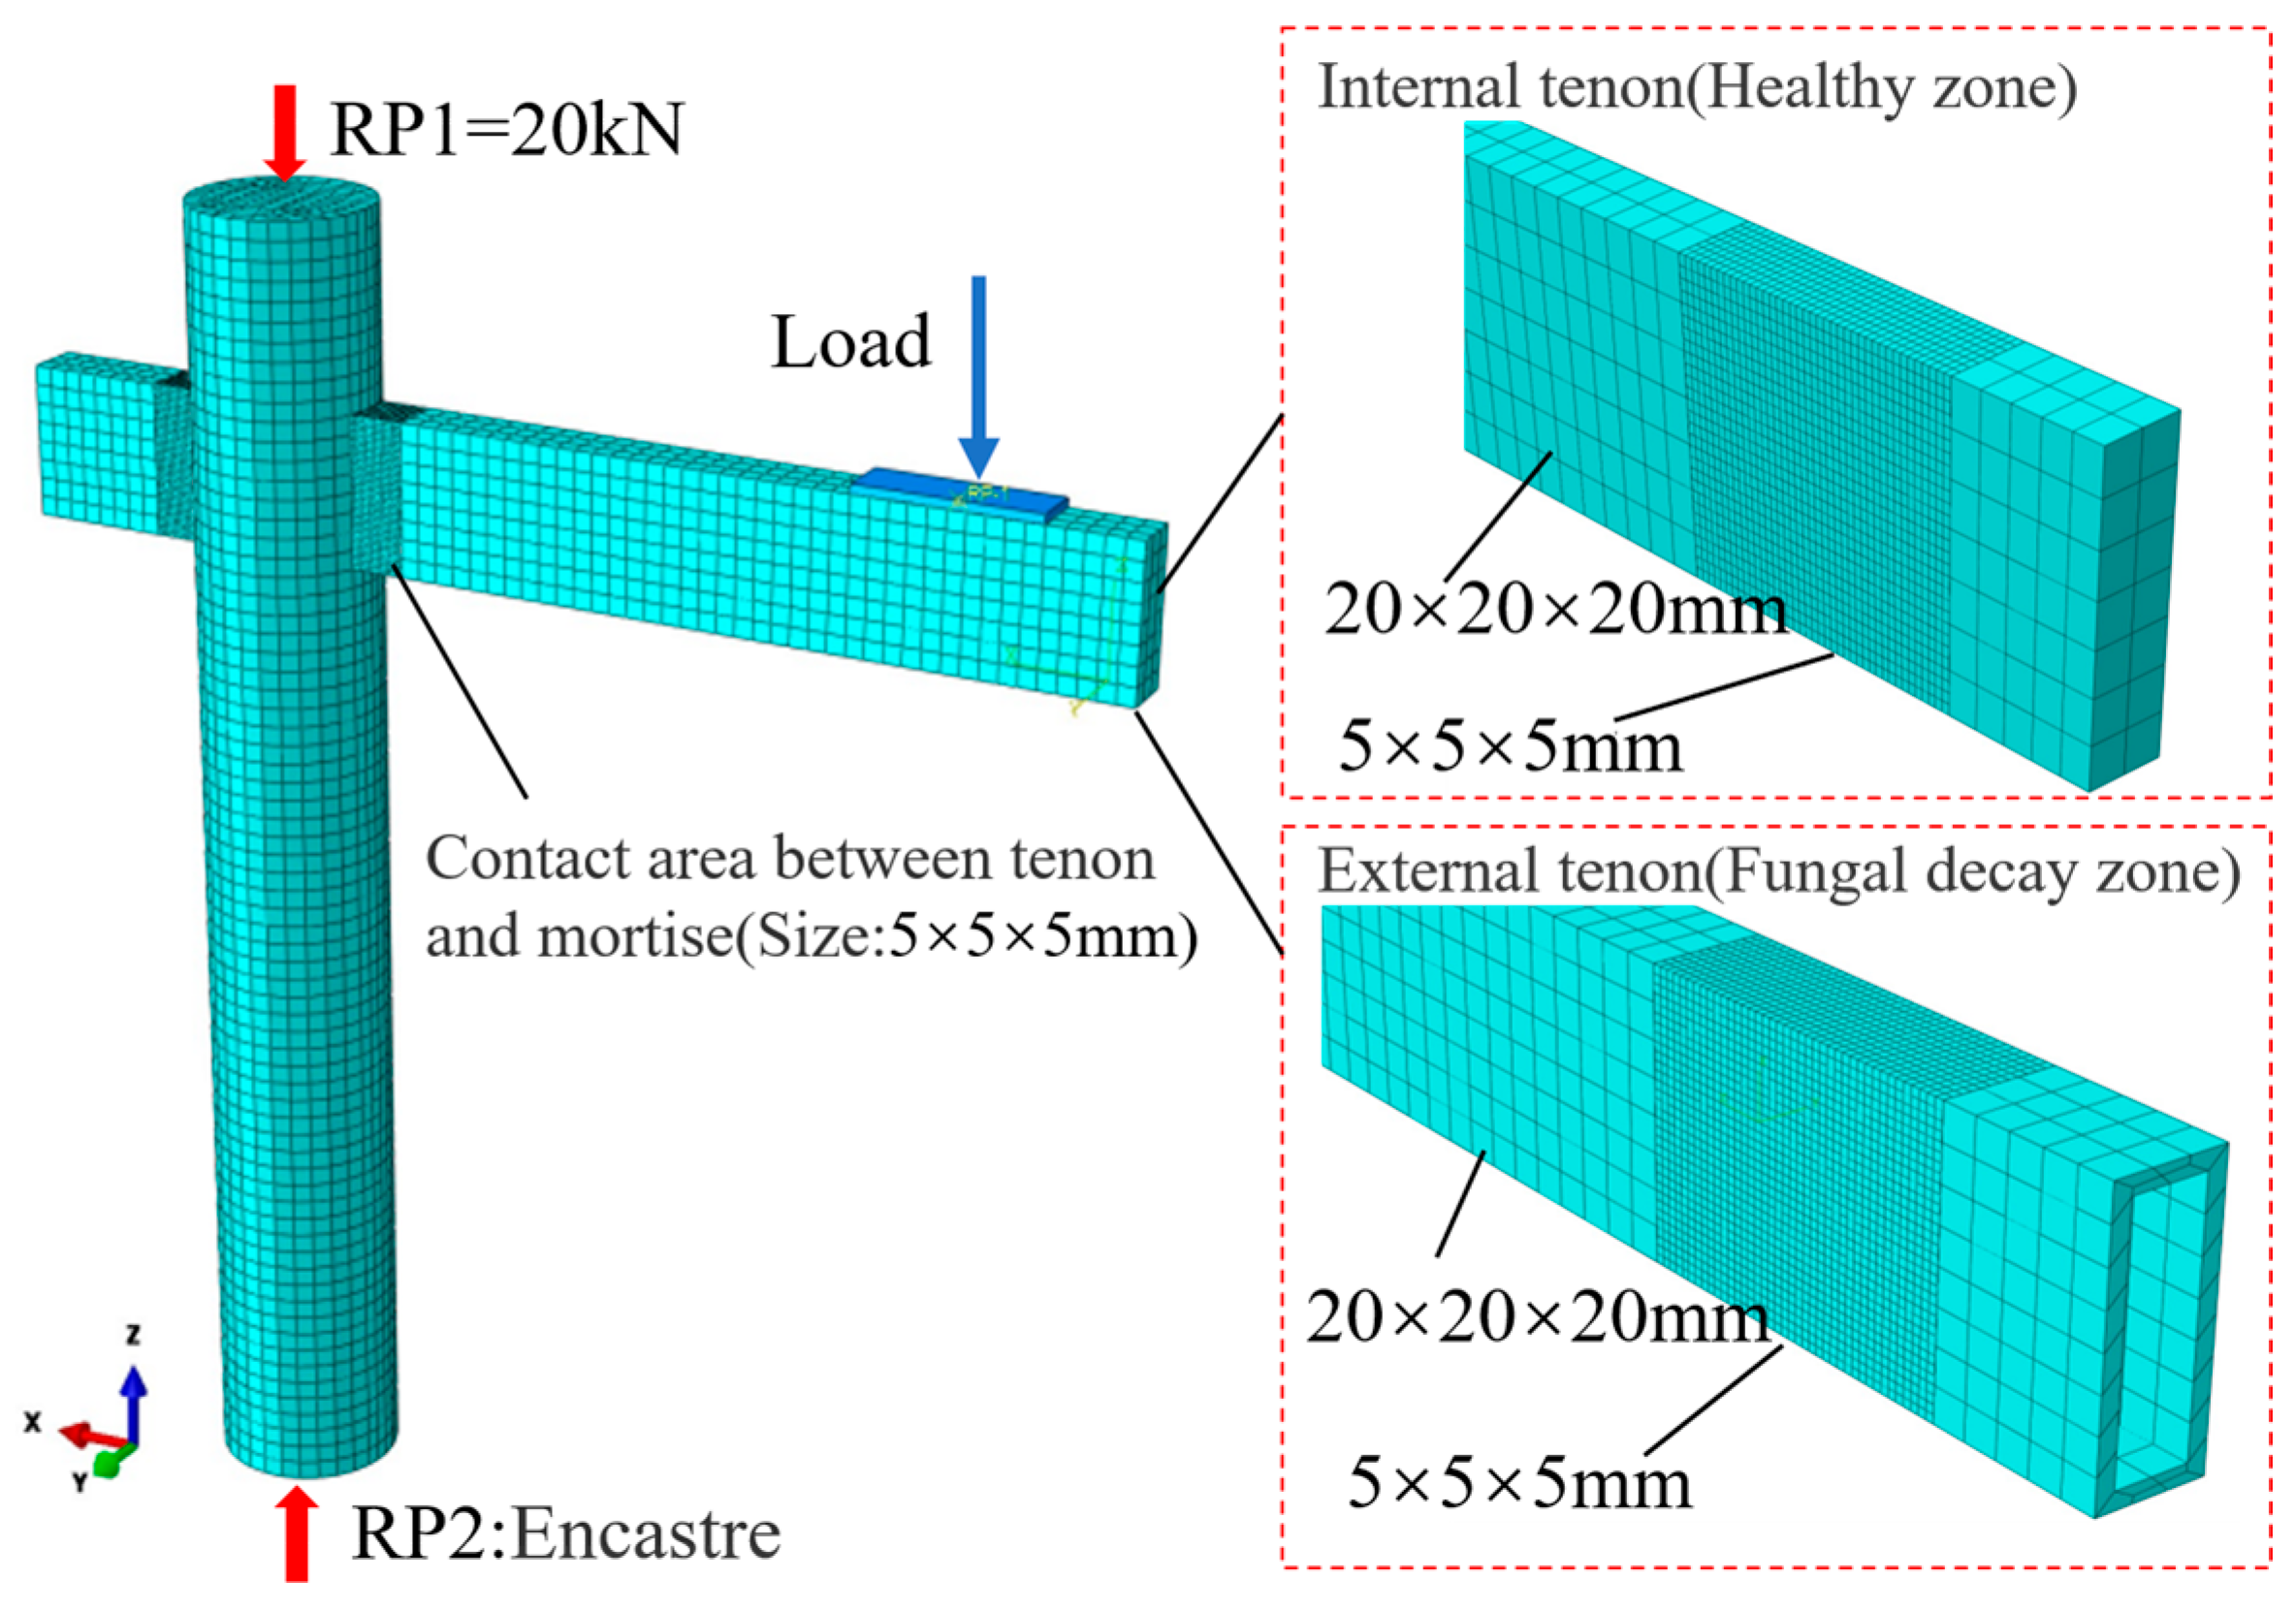
Determining the specific depth and area of decay is challenging due to the nature of fungal activity and its nonlinear development. As shown in Figure 9, the decay cycle gradually increased when the tenon decayed. To address this, the external decay layer was set to various depth gradients ranging from 0 mm to 30 mm (complete decay), with 5 mm intervals in the simulation. The material parameters corresponding to each depth gradient were analyzed, and the decay depth design group closest to the experimental value was selected for comparison. To ensure calculation accuracy and minimize computation time, in the primary contact areas between the tenon and mortise, a 5 mm side length hexahedron was used to divide the external decay layer beam and internal grid, while the remaining parts were divided into 20 mm side length hexahedrons, as depicted in Figure 16.
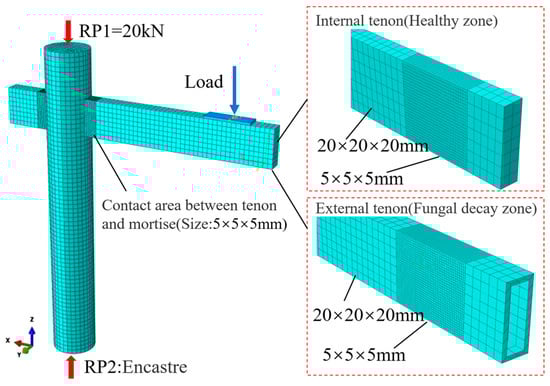
Figure 16.
Finite element model.
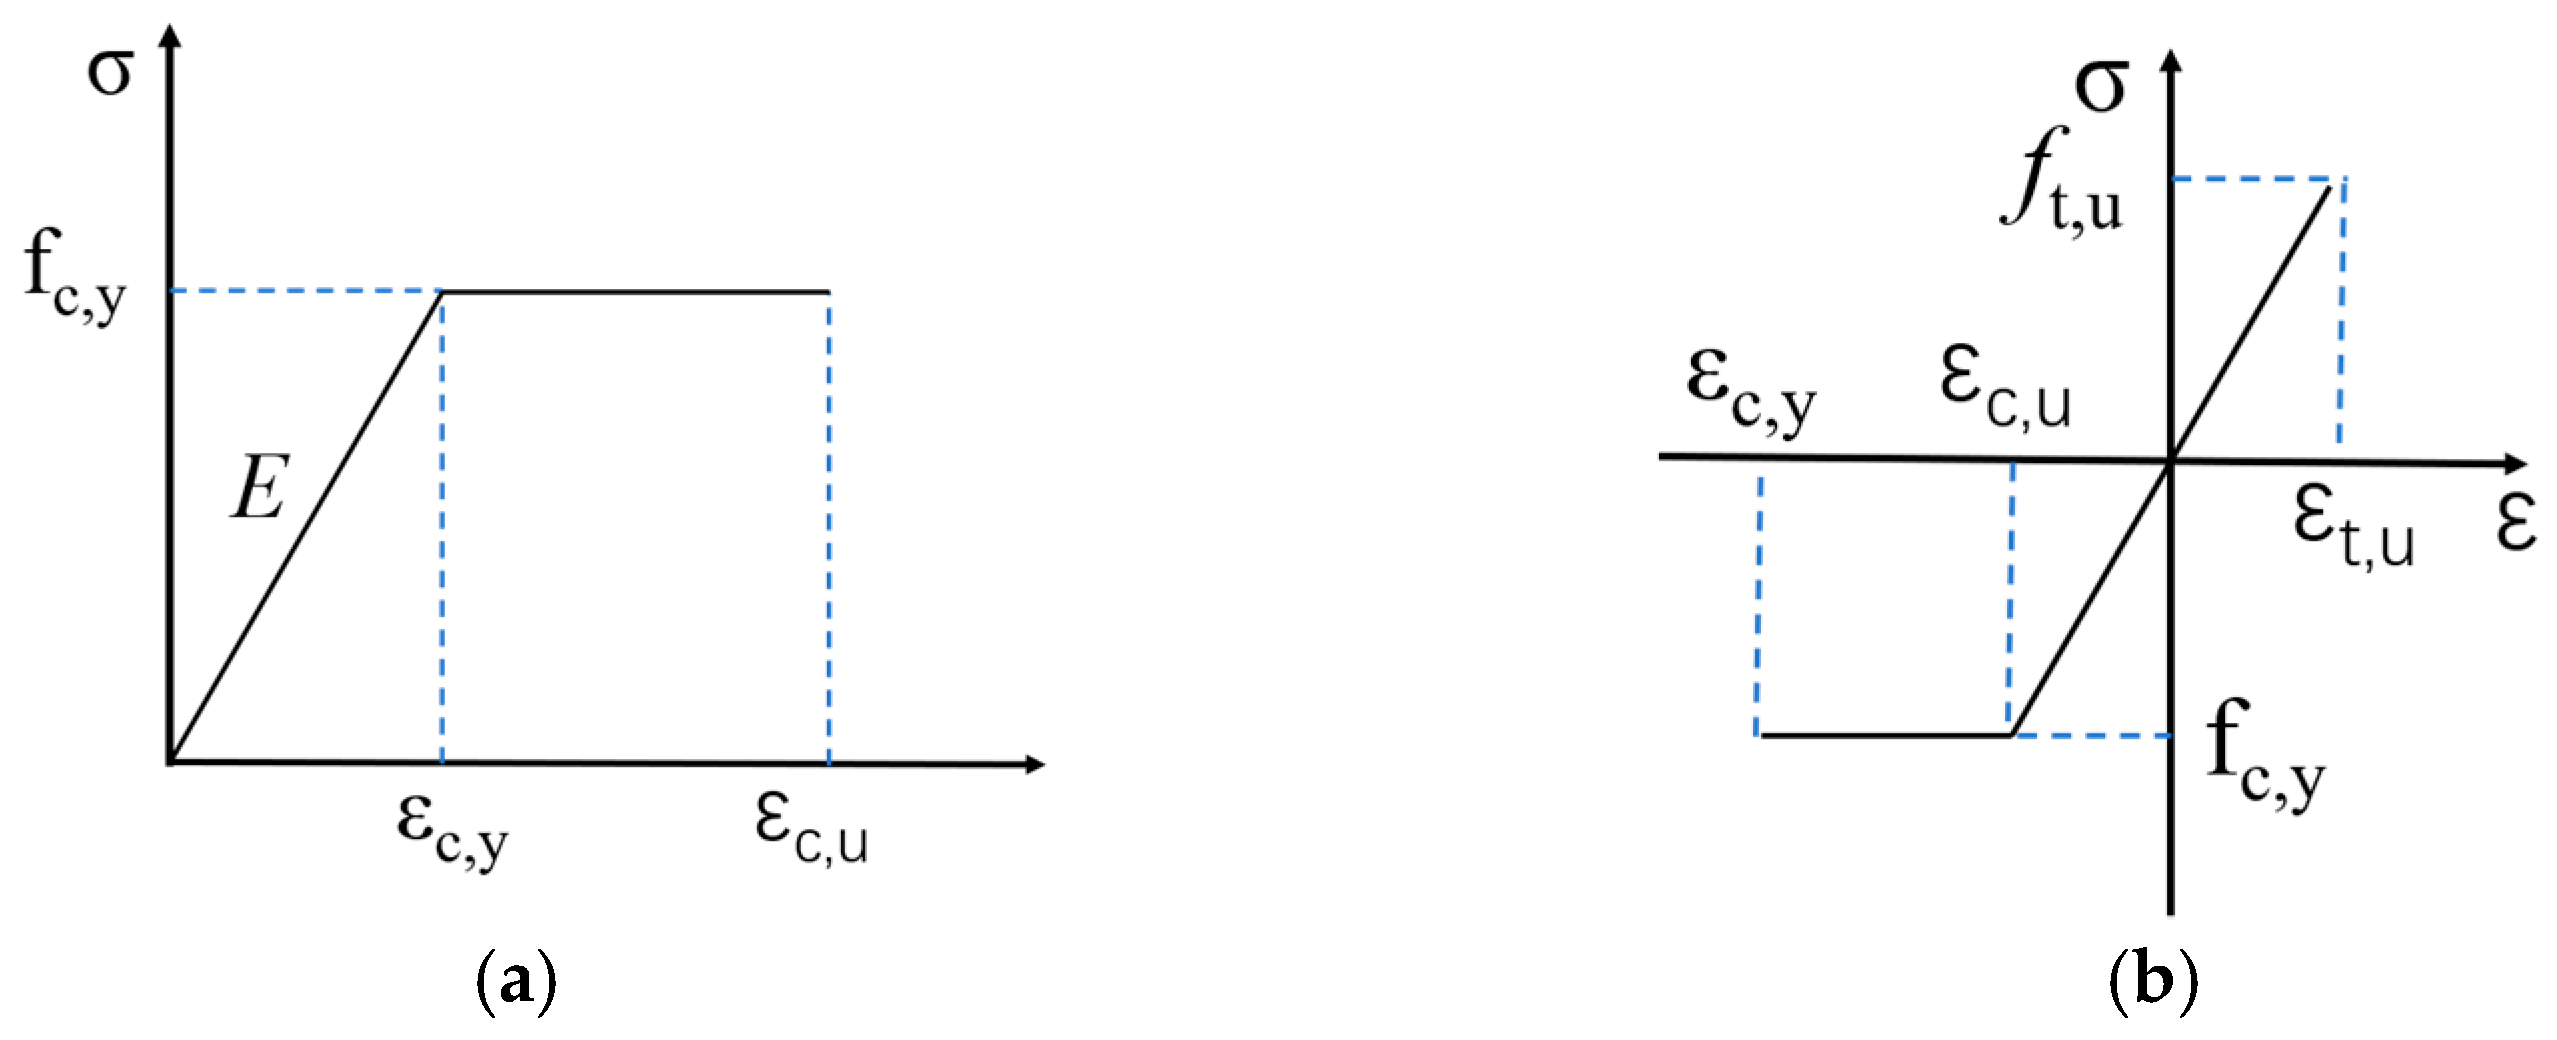
The compression behavior along the grain of the wooden beam is described here using an ideal elastic–plastic model. The transverse compression is characterized as a double broken line constitutive model. It is important to note that the joint’s tensile elastic modulus is equivalent to the compressive elastic modulus. The resulting constitutive model is shown in Figure 17.
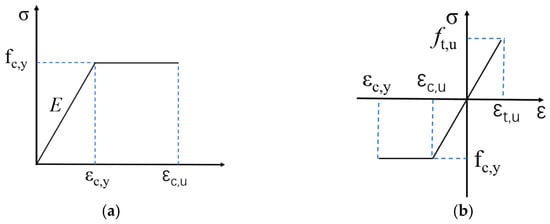
Figure 17.
Wood constitutive model. (a) The longitudinal compressive constitutive law; (b) the transverse compressive constitutive model.
The constitutive relationship for the elastic stage was defined using engineering constants. After the elastic stage, the Hill’s potential function (ABAQUS/CAE2021) was applied to define the initial yield ratio in the orthotropic directions of wood. Under this yield criterion, there are six anisotropic yield stress ratios (R11, R22, R33, R12, R13, and R23) necessary for defining yield stress ratios in different directions. These stress ratios can be obtained through Equation (7):
where is the self-defined reference yield stress, σij (i = 1,2,3; j = 1,2,3) is the initial yield strength in all directions, τ = σ0/, and σ0 = σ11.
The mechanical parameters for the non-decayed internal layer were set based on the values provided in Table 1 under the non-decayed column. For the outer decayed layer, corresponding values were set according to the respective decay cycles. In all SMTJ simulations, the mortise and tenon were considered under “general contact”, implying direct contact without any gap. A normal interaction was defined as hard contact, indicating a rigid connection. For a tangential interaction, a penalty function approach was used. Additionally, the sliding friction coefficient between the mortise and tenon was specified as 0.3. Binding constraints were employed to connect the external decayed layer with the internal non-decayed layer. The fixing and loading methods for the SMTJs were all kept in accordance with the experimental settings.
4.2. Comparison between Finite Element Simulation Results and Experimental Results
4.2.1. Numerical Analysis
As depicted in Figure 18, an increase in loading displacement led to plastic compression failure at the tenon, accompanied by a gradual widening of the gap between the tenon and the upper and lower surfaces. Towards the end of the loading process, a minor protrusion appeared near the compressed region of the tenon, while a noticeable depression was observed within the compressed area. These findings support the experimental deformation results, thereby validating the accuracy of the proposed model.
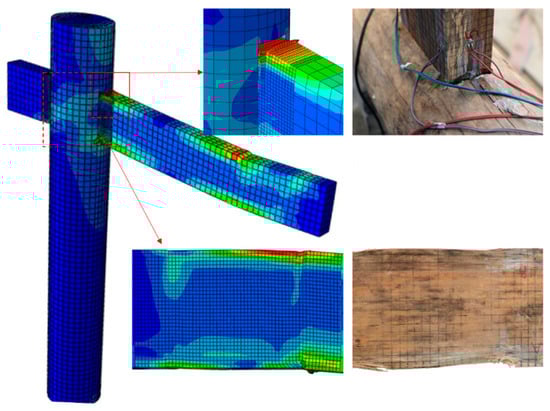
Figure 18.
Comparison of finite element and experimental deformation.
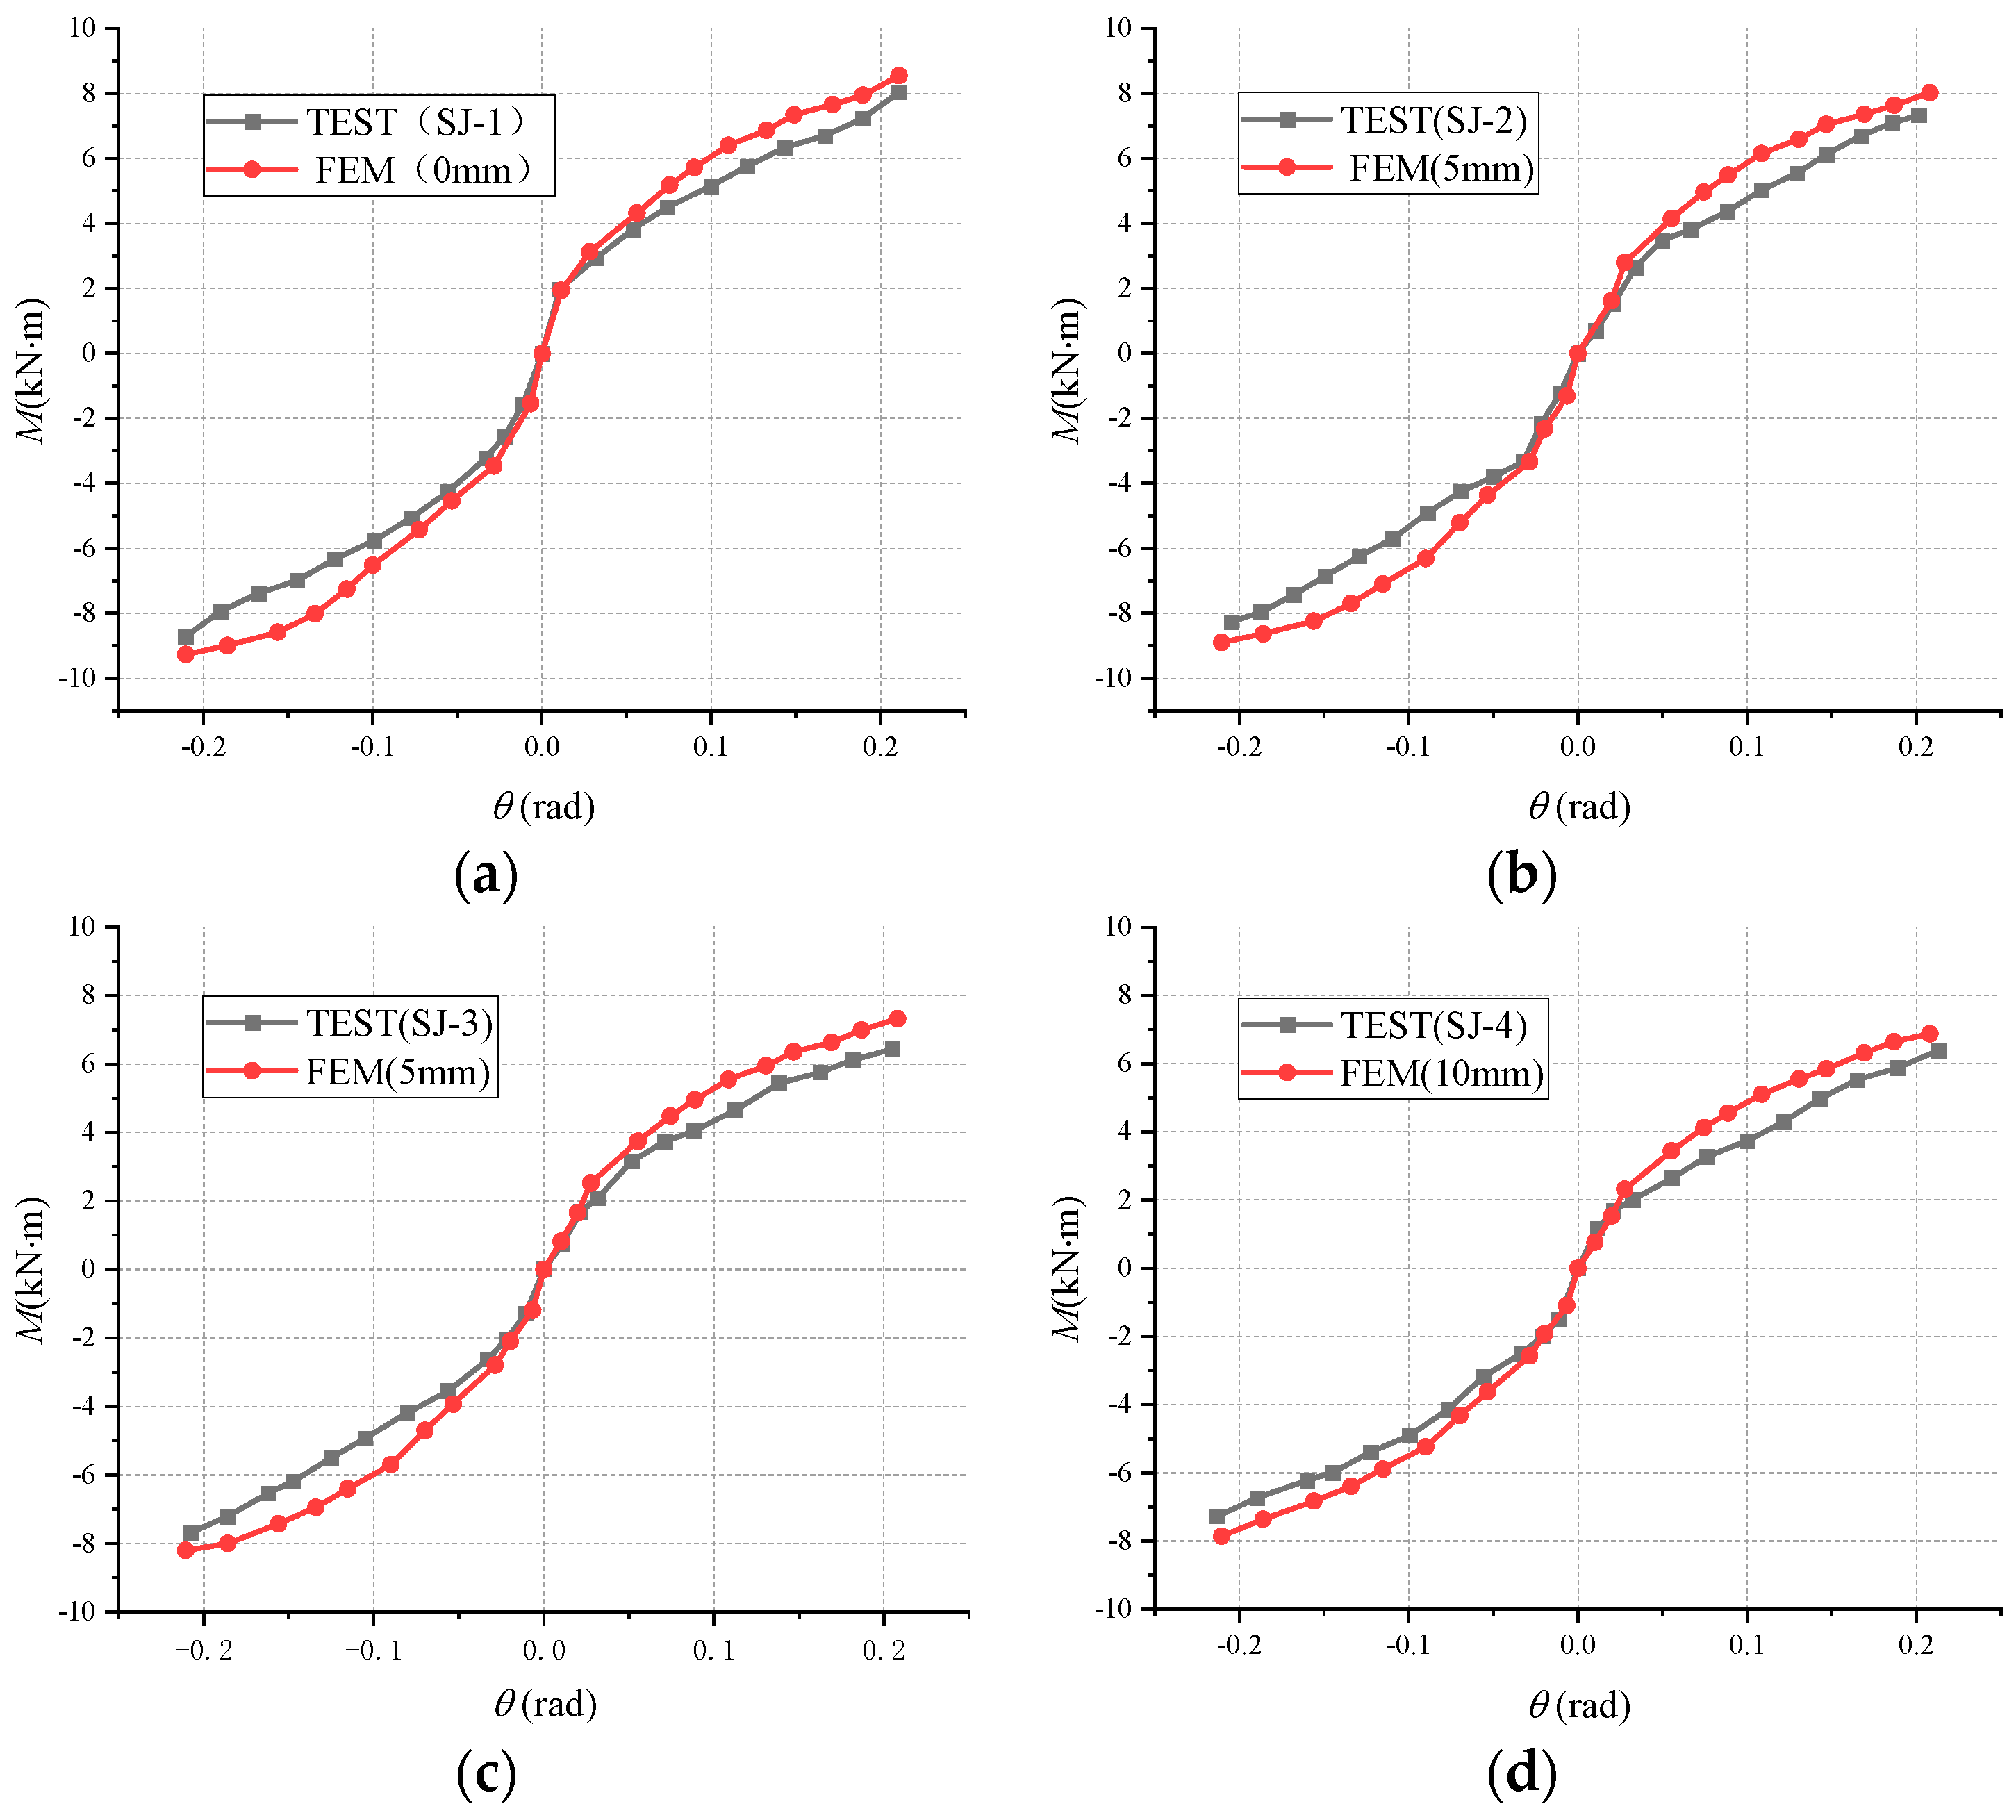
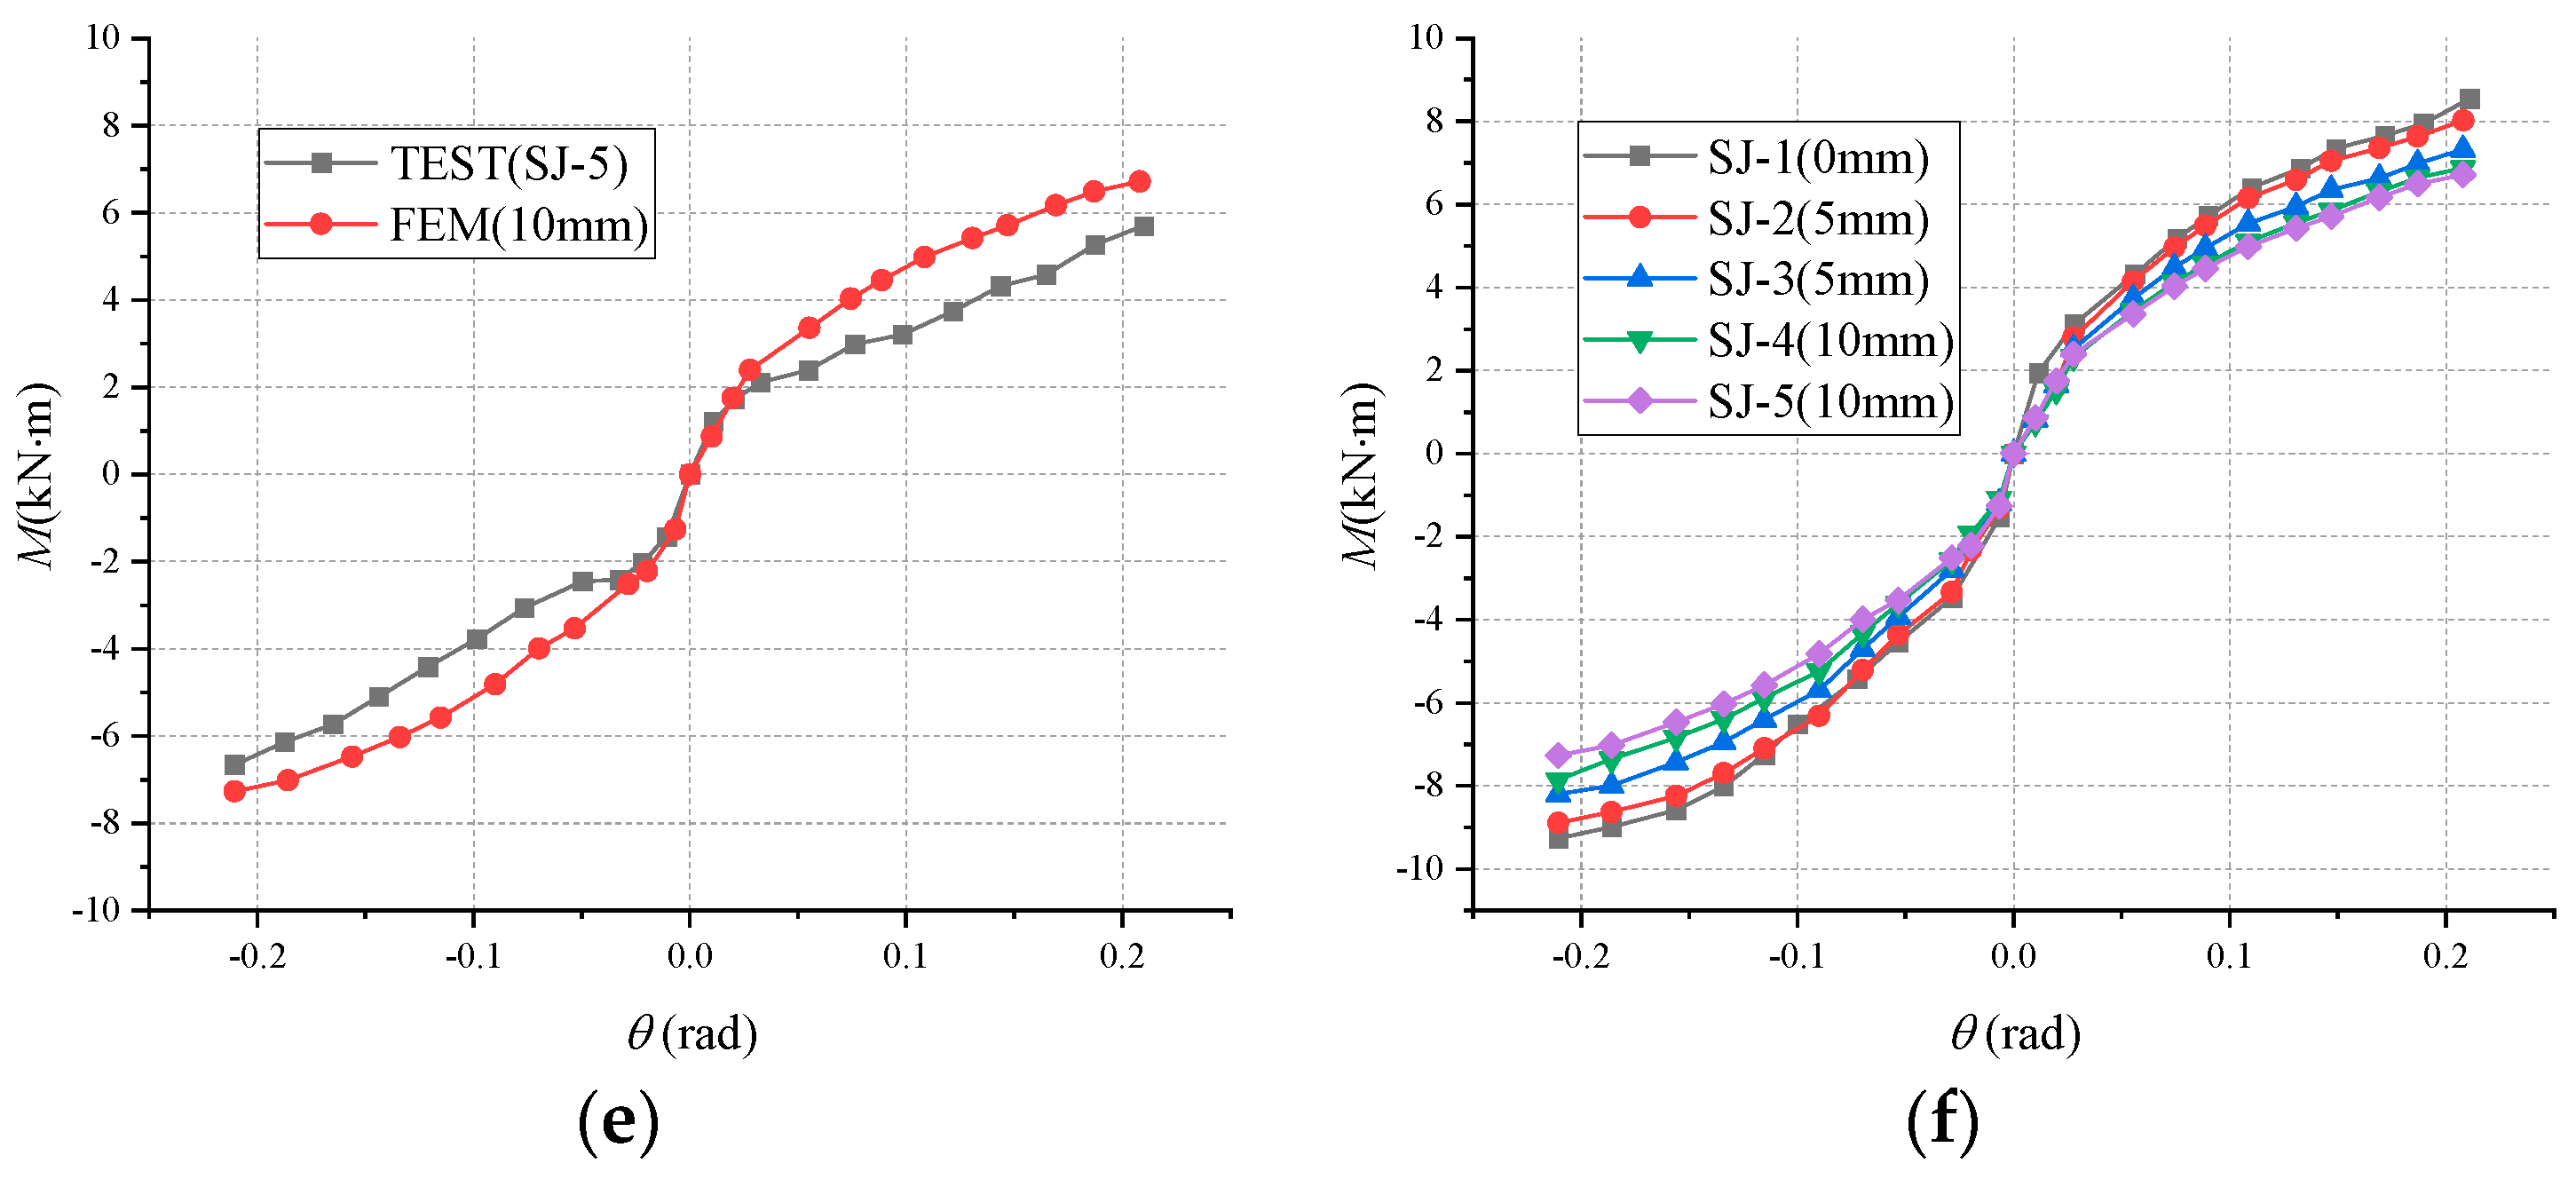
In the finite element simulations, a decay depth gradient was applied with 5 mm intervals for each decay cycle. The decay depth group that most closely matched the experimental values was selected for subsequent analysis. Specimens SJ-2 and SJ-3 exhibit the closest decay depth at 5 mm, whereas specimens SJ-4 and SJ-5 had the closest decay depth of 10 mm. The SMTJs exhibited a decay depth range of 0–5 mm within 12 weeks, which extended to 5–10 mm between 12 and 24 weeks. Notably, a significant portion of the node remained unaffected by decay, contributing to its retained load-bearing capacity. A comparison between the finite element simulation results and the experimental findings is illustrated in Figure 19.
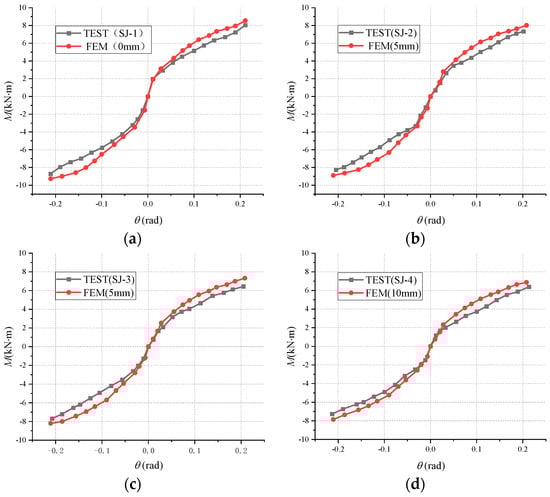
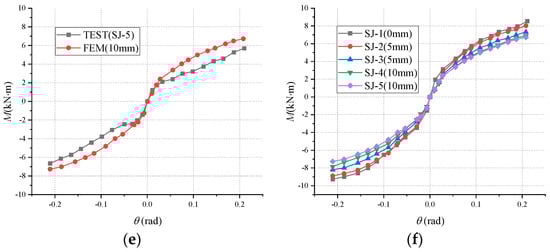
Figure 19.
(a) Non-decayed specimen. (b) Outer layer decay depth: 5 mm. (c) Outer layer decay depth: 5 mm. (d) Outer layer decay depth: 10 mm. (e) Outer layer decay depth: 10 mm. (f) Finite element skeleton curve diagram.
Upon comparing the finite element skeleton curves of the SMTJs, we found that the bending moment values simulated by the finite element method slightly exceeded the corresponding experimental values when rotation angles were kept constant. This discrepancy can be attributed to the presence of initial defects (e.g., knots) in the experimental wood, whereas finite element analysis assumed an ideal homogeneous wood without such imperfections. Furthermore, as the decay period extended, the disparity between the finite element simulated skeleton curve and the experimental skeleton curve gradually increased. This escalation can be attributed to an amplification of material property variations at different decay depths within the tenon having diminished the uniformity of the decay.
From the loading process until the plastic enhancement stage, significant differences were noted between the finite element simulation and experimental values. During experimentation, the joint experienced greater sliding in the forward loading stage compared to the reverse loading, with the sliding magnitude increasing as the loading angle increased. Consequently, there was a pronounced reduction in the node’s bending moment. Table 2 presents an error analysis of values obtained from both finite element simulations and experiments. Notably, the initial stiffness error range is the smallest. This can be attributed to the wood exhibiting elastic behavior during the initial loading phase; the constitutive model employed in the finite element analysis fits well with this elastic stage.
Table 2.
Comparison of main parameters.
4.2.2. Stress Analysis
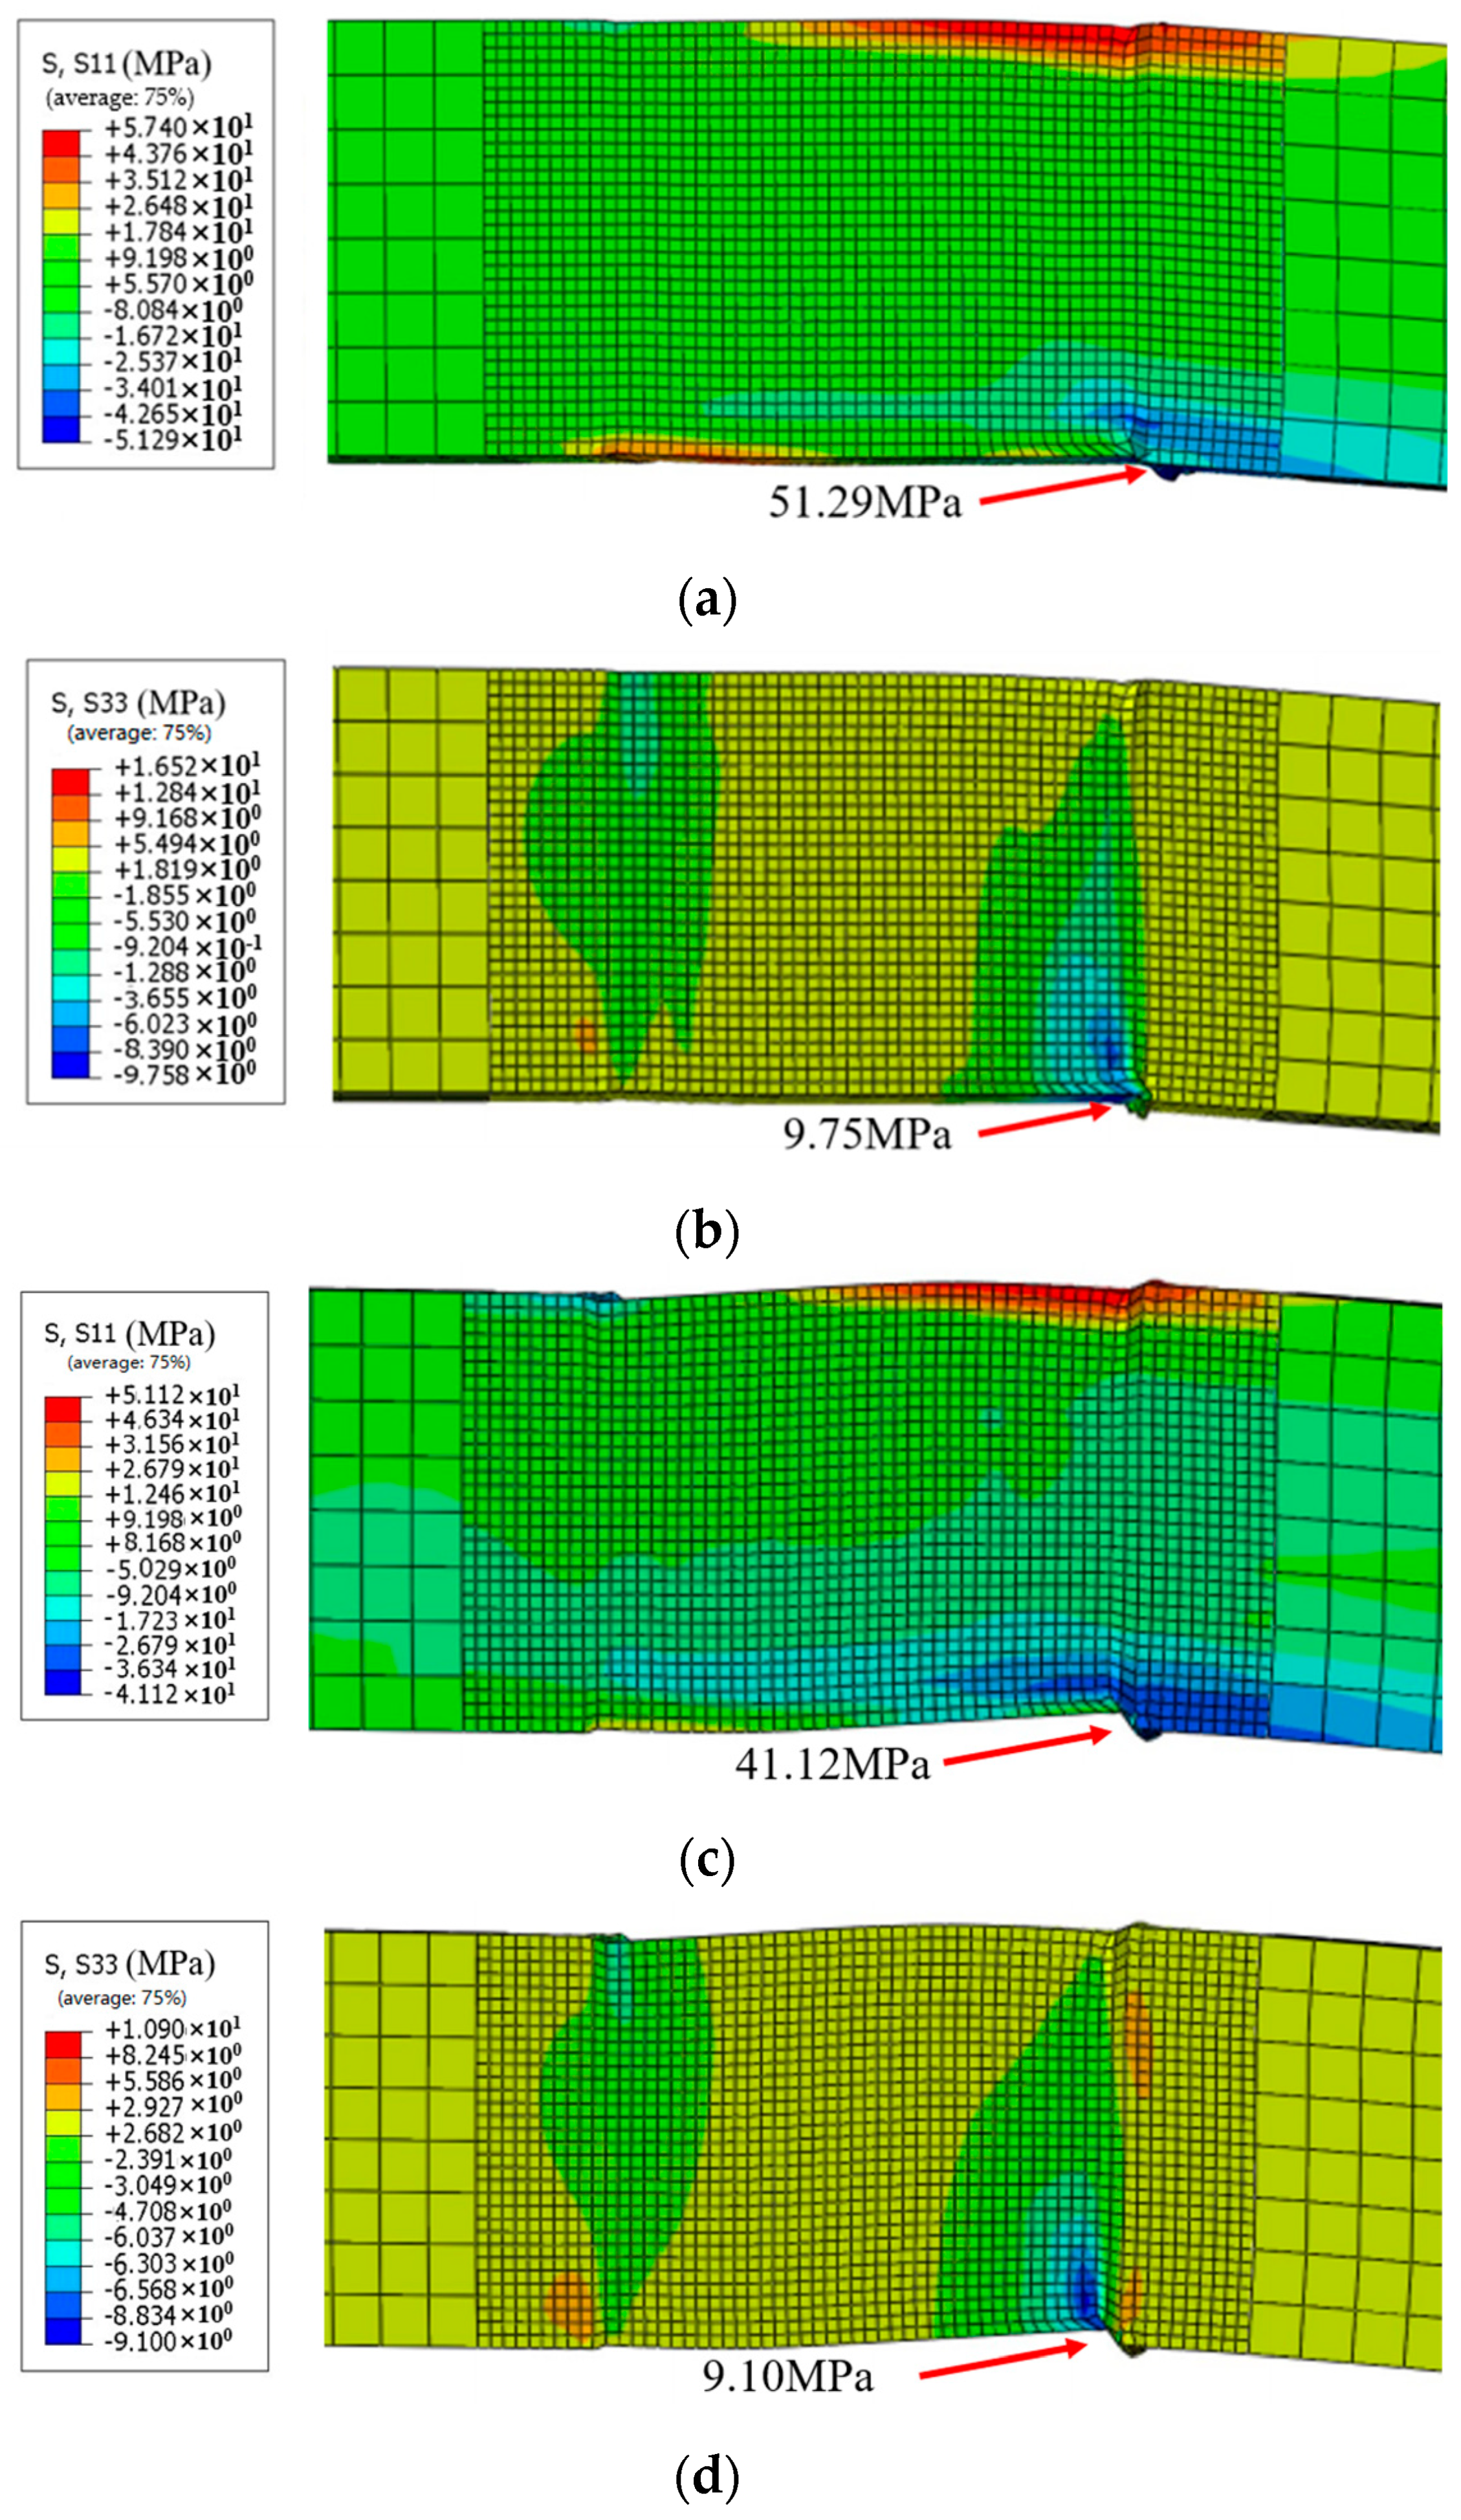
Figure 20 shows a stress cloud map of the tenon after rotating it to 0.20 rad, with the non-decayed specimen SJ-1 and the specimen with a 10 mm decay depth (SJ-5) as examples. The compressive stress on the upper and lower end faces of the tenon joint resulted in a maximum compressive stress of 51.29 MPa for specimen SJ-1. For specimen SJ-5, the value was 41.12 MPa. This value does not exceed the compressive strength (0 weeks: 65.1 MPa; 24 weeks: 51.2 MPa) of the wood along the grain, suggesting that the nodes were not damaged along the grain direction. The stress cloud map in the S33 direction reveals maximum compressive stresses of 9.75 MPa and 9.10 MPa for specimens SJ-1 and SJ-5, respectively. These values are close to the compressive strength of the wood’s transverse grain (0 weeks: 6.07 MPa; 24 weeks: 5.09 MPa), implying that transverse compression deformation would occur at the tenon. However, simulating fracture phenomena in specimens SJ-1 and SJ-5 was difficult in ABAQUS/CAE2021 due to the lack of a constitutive model that accurately represents wood fracture. The maximum tensile stress occurred near the compression area of the tenon and mortise, as the deformation of units in the compression area generated tension in the nearby units, causing an uplift near the compression area of the tenon.
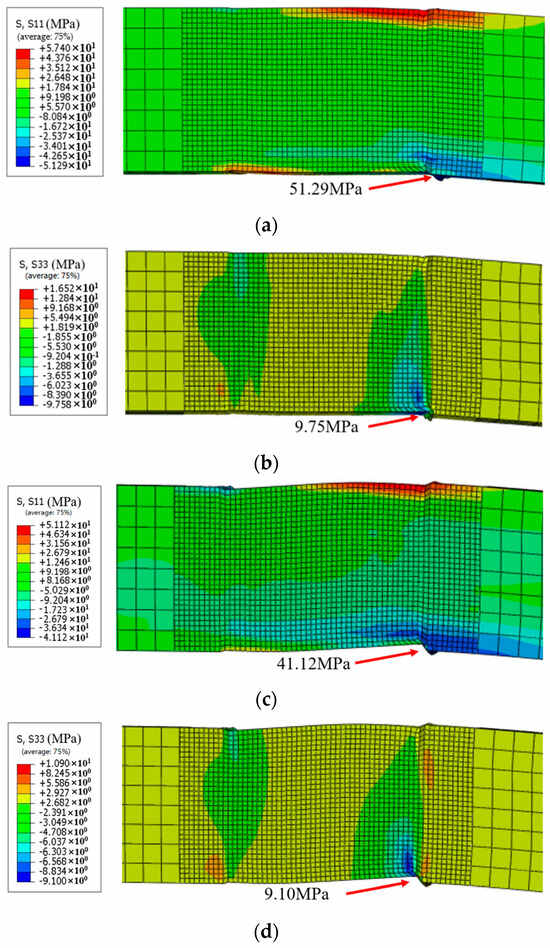
Figure 20.
Stress nephogram of tenon. (a) Stress nephogram of tenon of specimen SJ-1 (S11: grain direction); (b) stress nephogram of tenon of specimen SJ-1 (S33: radial direction); (c) stress nephogram of tenon of specimen SJ-5 (S11: grain direction); (d) stress nephogram of tenon of specimen SJ-5 (S33: radial direction).
5. Conclusions
Low-cycle repeated loading tests and foundation material property tests were conducted in this study on SMTJs with different decay cycles, followed by finite element numerical simulation analysis based on the experimental results. The following conclusions were drawn:
- (1)
- Under cyclic loading, SMTJs are prone to fracturing when subjected to tension. With increased decay cycles, the failure mode of the tenon remains relatively consistent, though plastic deformation induced by the tenon becomes more pronounced, leading to more severe occurrences of sliding and tenon pulling out. Moreover, the depth of tenon decay is directly proportional to the duration of fungal incubation.
- (2)
- Compared to specimens without fungal decay treatment, specimens treated with fungal decay for 6–24 weeks exhibit degraded mechanical properties. Their transverse compressive strength decreased by 5.33%, 12.33%, 20.88%, and 28.67% after 6, 12, 18, and 24 weeks, respectively, while their ultimate bearing capacity decreased by 5.17%, 11.83%, 17.34%, and 23.54%. Their cumulative energy consumption performance also degraded by 8.38%, 9.51%, 23.13%, and 33.31%, respectively. Notably, there exists a positive correlation between the degradation of mechanical performance in SMTJs and the degradation of transverse compressive strength. The degradation trend observed in SMTJ’s mechanical properties resulting from fungal decay adheres to the characteristics of the sigmoid function. Consequently, a sigmoid function can be established to describe the degradation of transverse compressive strength relative to the extent of mechanical properties degradation.
- (3)
- Utilizing the decay depth gradient can enhance accuracy in fitting internal decay in SMTJs. Combining experimental and finite element simulation results revealed that during short decay cycles, decay in the tenon progressively extends from outer to inner regions. Specifically, fungal decay lasting 6–12 weeks results in an approximately 5 mm depth of tenon damage, while cycles extending 18–24 weeks increase this depth to approximately 10 mm. Among the decay-related phenomena observed, severe degradation of the tenon’s outer surface significantly impacts the joint’s initial stiffness, rendering the structure susceptible to deformation following wood decay.
- (4)
- Even after 24 weeks of fungal decay, a considerable portion within the tenons of the SMTJs remain unaffected. This resistance contributes to the joint’s favorable rotational performance and allows it to retain a portion of its load-bearing capacity and energy consumption efficiency. In practical engineering scenarios, such as when a limited period of decay is observed in structures such as the Tusi Manor in the Yunnan–Tibet Region, it is feasible to maintain a certain level of safety by implementing preventive measures to halt decay progression.
Author Contributions
Y.S. contributed to the investigation, experiments, experimental analysis, and manuscript; Z.N. contributed to the experiments, finite element analysis, and writing—original draft; H.L. contributed to the investigation, experiments, and image processing; S.M. proposed improvement suggestions for the experiment; P.J. contributed to the experiments; M.Q. contributed to the funding acquisition, supervision, and manuscript revision; Z.W. contributed to the conceptualization and methodology. All authors have read and agreed to the published version of the manuscript.
Funding
This research was funded by the Joint Agricultural Project in Yunnan Province, China (Grant No. 202101BD070001-097), Southwest Forestry University Youth Project on Humanities and Social Sciences (Grant No. WKQN104), 2022 Yunnan University Student Innovation and Entrepreneurship Training Program Project Provincial key support project (Grant No. 2022373), and the 111 project (Grant No. D21027).
Data Availability Statement
No new data were created or analyzed in this study. Data sharing is not applicable to this article.
Conflicts of Interest
The authors declare no conflicts of interest.
References
- Liang, S.C. A Pictorial History of Chinese Architecture; MIT Press: Boston, MA, USA, 1984. [Google Scholar]
- Fang, D.P.; Iwasaki, S.; Yu, M.H.; Shen, Q.P.; Miyamoto, Y.; Hikosaka, H. Ancient Chinese timber architecture. I: Experimental study. J. Struct. Eng. 2001, 127, 1348–1357. [Google Scholar] [CrossRef]
- Hua, Y.; Nakatani, N. Historic conservation in Tibetan region amidst rapid urbanization: A case study of Dukezong Old Town. J. Asian Archit. Build. Eng. 2023, 1–15. [Google Scholar] [CrossRef]
- Hou, C.P.; Wu, H.R. Modern and Traditional Smart Improvements of the Traditional Tibetan Architectural Materials and Security. Appl. Mech. Mater. 2013, 353–356, 2817–2821. [Google Scholar] [CrossRef]
- Qin, S.; Yang, N. Strength degradation and service life prediction of timber in ancient Tibetan building. Eur. J. Wood Wood Prod. 2018, 76, 731–747. [Google Scholar] [CrossRef]
- Li, T.; Yang, N. Condition assessment of timber beam in a typical Tibetan heritage building under crowd load. Adv. Struct. Eng. 2021, 24, 1910–1925. [Google Scholar] [CrossRef]
- Dong, J.; Jin, H. The design strategy of green rural housing of Tibetan areas in Yunnan, China. Renew. Energy 2013, 49, 63–67. [Google Scholar] [CrossRef]
- Blanchette, R.A.; Held, B.W.; Jurgens, J.; Stear, A.; Dupont, C. Fungi attacking historic wood of Fort Conger and the Peary Huts in the High Arctic. PLoS ONE 2021, 16, e0246049. [Google Scholar] [CrossRef]
- Li, P.; Yang, N.; Wang, Y. Research on Structural Present State and Damage Reasons of Ancient Tibetan Buildings. Appl. Mech. Mater. 2013, 351–352, 1652–1656. [Google Scholar] [CrossRef]
- Venäläinen, M.; Partanen, H.; Harju, A. The strength loss of Scots pine timber in an accelerated soil contact test. Int. Biodeterior. Biodegrad. 2014, 86, 150–152. [Google Scholar] [CrossRef]
- Kleindienst, Q.; Besserer, A.; Antoine, M.-L.; Perrin, C.; Bocquet, J.-F.; Bléron, L. Predicting the beech wood decay and strength loss in-ground. Int. Biodeterior. Biodegrad. 2017, 123, 96–105. [Google Scholar] [CrossRef]
- Plaschkies, K.; Jacobs, K.; Scheiding, W.; Melcher, E. Investigations on natural durability of important European wood species against wood decay fungi. Part 1: Laboratory tests. Int. Biodeterior. Biodegrad. 2014, 90, 52–56. [Google Scholar] [CrossRef]
- Ueda, R.; Sawata, K.; Takanashi, R.; Sasaki, Y.; Sasaki, T. Degradation of shear performance of screwed joints caused by wood decay. J. Wood Sci. 2020, 66, 42. [Google Scholar] [CrossRef]
- Mi, X.; Li, Y.; Qin, X.; Li, J. Effects of natural weathering on aged wood from historic wooden building: Diagnosis of the oxidative degradation. Herit. Sci. 2023, 11, 109. [Google Scholar] [CrossRef]
- Zhang, D. Natural aging changes in wood properties of deciduous pine components in ancient architecture. J. Civ. Environ. Eng. 2021, 1–9. Available online: http://qks.cqu.edu.cn/cqdxxbcn/article/abstract/tm-202110052 (accessed on 1 April 2024). (In Chinese and English).
- Xu, M.; Qiu, H. Experimental Study on the Properties of Old Wood Materials in Ancient Buildings. Eng. Seism. Reinf. Renov. 2011, 33, 53–55+31. (In Chinese) [Google Scholar]
- Kim, G.-H.; Barnes, H.M.; Lyon, D.E. Effect of Decay on the Mechanical Properties of Full-Sized Lumber. Holzforschung 1994, 48, 145–149. [Google Scholar] [CrossRef]
- Yang, N.; Wang, Z.; Chang, P. Experimental Study on Mechanical Properties of Flawless Old Samples of Tibetan Poplar. J. Build. Struct. 2022, 43, 168–176. [Google Scholar]
- Singh, J.; White, N. Timber Decay in Buildings: Pathology and Control. J. Perform. Constr. Facil. 1997, 11, 3–12. [Google Scholar] [CrossRef]
- King, W.S.; Yen, J.Y.R.; Yen, Y.N.A. Joint characteristics of traditional Chinese wooden frames. Eng. Struct. 1996, 18, 635–644. [Google Scholar] [CrossRef]
- Zhang, B.; Xie, Q.; Liu, Y.; Zhang, L.; Li, S. Effects of gaps on the seismic performance of traditional timber frames with straight mortise-tenon joint: Experimental tests, energy dissipation mechanism and hysteretic model. J. Build. Eng. 2022, 58, 105019. [Google Scholar] [CrossRef]
- Bai, F.; Dong, F.; Sui, Y.; Xue, J.; Wu, C.; Song, D.; Hu, C. Experimental study on fracture damage and seismic performance of loose through-tenon joints in ancient timber structures. Constr. Build. Mater. 2023, 394, 132228. [Google Scholar] [CrossRef]
- Yang, Q.; Yu, P.; Law, S.-S. Load resisting mechanism of the mortise-tenon connection with gaps under in-plane forces and moments. Eng. Struct. 2020, 219, 110755. [Google Scholar] [CrossRef]
- Vassiliou, V.; Barboutis, I.; Kamperidou, V. Strength of corner and middle joints of upholstered furniture frames constructed with black locust and beech wood. Wood Res. 2016, 61, 495–504. [Google Scholar]
- Okamoto, S.; Nakatani, M.; Akiyama, N.; Tanaka, K.; Mori, T. Verification of the shear performance of mortise and tenon joints with top and bottom notches at the beam end. J. Wood Sci. 2021, 67, 47. [Google Scholar] [CrossRef]
- Guo, T.; Yang, N.; Yan, H.; Bai, F. Experimental study of moment carrying behavior of typical Tibetan timber beam-column joints. Adv. Struct. Eng. 2021, 24, 2402–2412. [Google Scholar] [CrossRef]
- Poletti, E.; Vasconcelos, G.; Branco, J.M.; Isopescu, B. Effects of extreme environmental exposure conditions on the mechanical behaviour of traditional carpentry joints. Constr. Build. Mater. 2019, 213, 61–78. [Google Scholar] [CrossRef]
- Zhang, C.; Chun, Q.; Lin, Y.; Han, Y.; Jia, X. Quantitative assessment method of structural safety for complex timber structures with decay diseases. J. Build. Eng. 2021, 44, 103355. [Google Scholar] [CrossRef]
- Udele, K.E.; Morrell, J.J.; Cappellazzi, J.; Sinha, A. Characterizing properties of fungal-decayed cross laminated timber (CLT) connection assemblies. Constr. Build. Mater. 2023, 409, 134080. [Google Scholar] [CrossRef]
- Ma, L.; Xue, J.; Zhang, X. Seismic Performance Evaluation of Damaged Ancient Timber Structures with Looseness Mortise-Tenon Joints. Int. J. Archit. Herit. 2023, 17, 2054–2068. [Google Scholar] [CrossRef]
- Chen, L.-K.; Li, S.-C.; Wang, Y.-T.; Zhao, Y.-J.; Zhang, M.; Song, X.-Y.; Li, X.-W.; Wu, T.; Jiang, L.-Z. Experimental Study on the Seismic Behaviour of Mortise-Tenon Joints of the Ancient Timbers. Struct. Eng. Int. 2017, 27, 512–519. [Google Scholar] [CrossRef]
- ISO 13061-1:2014; Physical and Mechanical Properties of Wood-Test Methods for Small Clear Wood Specimens—Part 1: Determination of Moisture Content for Physical and Mechanical Tests. ISO: Geneva, Switzerland, 2014.
- ISO 13061-2:2014; Physical and Mechanical Properties of Wood—Test Methods for Small Clearwood Specifications—Part 2: Determination of Density for Physical and Mechanical Tests. ISO: Geneva, Switzerland, 2014.
- GB/T 1927.2-2021; Test Methods for Physical and Mechanical Properties of Small Clear Wood Specimens—Part 2: Sampling Methods and General Requirements. Standardization Administration of the People’s Republic of China: Beijing, China, 2021.
- GB/T 1927.13-2022; Test Methods for Physical and Mechanical Properties of Small Clear Wood Specimens—Part 13: Determination of the Modulus of Elasticity in Compression Perpendicular to Grain. Standardization Administration of the People’s Republic of China: Beijing, China, 2022.
- D5379/D5379 M-12; Test Method for Shear Properties of Composite Materials by the V-Notched Beam Method. ASTM International: West Conshohocken, PA, USA, 2012.
- Yoshihara, H.; Ohsaki, H.; Kubojima, Y.; Ohta, M. Applicability of the losipescu shear test on the measurement of the shear properties of wood. J. Wood Sci. 1999, 45, 24–29. [Google Scholar] [CrossRef]
- Zhang, L.; Yang, N. Evaluation of a modified Iosipescu shear test method for determining the shear properties of clear wood. Wood Sci. Technol. 2017, 51, 323–343. [Google Scholar] [CrossRef]
- GB/T 13942.1-2009; Forestry RIoWICAo, Durability of Wood—Part 1: Method for Laboratory Test of Natural Decay Resistance, General Administration of Quality Supervision, Inspection and Quarantine of the People’s Republic of China. Standardization Administration of the People’s Republic of China: Beijing, China, 2009; p. 12.
- Hu, L.; Liu, L.; Wang, G.; Wu, J. Identification of decaying fungi on beams and columns of buildings in the Old Town of Lijiang. Mycol. Res. 2016, 14, 153–156. [Google Scholar]
- Yang, Z.; Jiang, Z.; Reng, H.; Qin, D. An Accelerated Laboratory Test Method to Assess Wood Decay. China Wood Ind. 2007, 21, 12–14. (In Chinese) [Google Scholar]
- JGJ/T 101-2015; China Academy of Building Research; Institute of Engineering Mechanics, China Earthquake Administration. Tongji University, Specification of Test Methods For Earthquake Resistant Building: Shanghai, China, 1996.
- GB 50165-1992; Sichuan Institute of Building Research; National Technical Committee for Timber and Composite Materials Standards. Technical Code for Maintenance and Strengthen of Ancient Timber Buildings. Standardization Administration of the People’s Republic of China: Beijing, China, 1992.
- Ma, L.; Xue, J.; Dai, W.; Zhang, X.; Zhao, X. Moment-rotation relationship of mortise-through-tenon connections in historic timber structures. Constr. Build. Mater. 2020, 232, 117285. [Google Scholar] [CrossRef]
- Mazhar, N.; Malik, F.M.; Raza, A.; Khan, R. Predefined-time control of nonlinear systems: A sigmoid function based sliding manifold design approach. Alex. Eng. J. 2022, 61, 6831–6841. [Google Scholar] [CrossRef]


Disclaimer/Publisher’s Note: The statements, opinions and data contained in all publications are solely those of the individual author(s) and contributor(s) and not of MDPI and/or the editor(s). MDPI and/or the editor(s) disclaim responsibility for any injury to people or property resulting from any ideas, methods, instructions or products referred to in the content. |
© 2024 by the authors. Licensee MDPI, Basel, Switzerland. This article is an open access article distributed under the terms and conditions of the Creative Commons Attribution (CC BY) license (https://creativecommons.org/licenses/by/4.0/).