Article

Electrical Properties at Multi-Frequencies for Analysis of Physical and Anatomical Properties of Fast-Growing Standing Teak Trees at Various Ages

by
Dyah Ayu Agustiningrum
1,2,*,
Iskandar Zulkarnaen Siregar
3,
Ratih Damayanti
4,
Warsito Purwo Taruno
5,
Harisma Nugraha
5,
Rohmadi
5 and
Lina Karlinasari
1,*
1
Department of Forest Product, Faculty of Forestry and Environment, IPB University, Bogor 16680, Indonesia
2
Research Center for Applied Botany, National Research and Innovation Agency (BRIN), Cibinong 16911, Indonesia
3
Department of Silviculture, Faculty of Forestry and Environment, IPB University, Bogor 16680, Indonesia
4
Directorate of Scientific Collection Management, National Research and Innovation Agency (BRIN), Cibinong 16911, Indonesia
5
C-Tech Labs EdWar Technology, Tangerang 15143, Indonesia
*
Authors to whom correspondence should be addressed.
Forests 2024, 15(4), 669; https://doi.org/10.3390/f15040669
Submission received: 24 December 2023 / Revised: 28 March 2024 / Accepted: 29 March 2024 / Published: 7 April 2024

Abstract

:
Fast-growing teak trees are cultivated extensively in Indonesia to meet the growing demand for teak wood. However, it is necessary to assess the conditions of teak stands throughout their growth period. The nondestructive testing of wood utilizing dielectric spectroscopy approaches based on electrical properties is currently under development, particularly for evaluating tree stands. This study aimed to analyze the dielectric values of fast-growing teak tree stands within a frequency range of 250 kHz to 60 MHz and to understand the relationship between their physical and anatomical properties. A capacitance measurement system was employed to collect dielectric spectroscopy data directly from trees aged 4, 5, and 7 years. Simultaneously, physical and anatomical samples were obtained using a 0.5 cm diameter increment borer. The results revealed significant differences in the fiber length, lumen diameter, and wall thickness at each age. The optimal dielectric frequency for distinguishing wood properties in standing trees was identified to be within a range of 18 MHz to 23 MHz. In the linear model, a moderate relationship was observed with a correlation coefficient of (r)0.403, although the coefficient of determination (r2) was weak at 0.162 for green density. However, a robust relationship was observed in the linear model for specific gravity with r = 0.826 and r2 = 0.682. A weak but significant relationship was also identified with r = 0.2, a coefficient of determination of r2 = 0.04, and a significance level < 0.05 in the predictive model of wood anatomy properties (vessel diameter and fiber wall thickness). Models with low r2 but high significance indicate that the independent variables still noticeably contribute to explaining the dependent variable. Further analysis and data processing can be enhanced by identifying the crucial variables in the capacitance measurement system.

1. Introduction

Owing to its inherent strength, durability, and attractive fiber structure, teak wood is widely used in various applications. Commercial teak wood usually comes from mature trees, which have long planting rotations, making it expensive to produce as finished products and raw resources. The challenges of supply and demand imbalances cannot be overlooked. Therefore, the development of fast-growing teak varieties has emerged as a potential solution [1,2,3].
Several studies have shown that fast-growing teaks can produce satisfactory quality with shorter rotations. However, they are still inferior to conventional teaks, particularly in terms of their density and hardness [4,5,6,7]. Fast-growing teaks are more susceptible to external disturbances such as weathering and attacks by wood-destroying organisms. In many cases, cavities are found in wood during harvesting, which affects its market value. To avoid losses owing to poor quality, efforts must be made to assess the condition of the tree to ensure that it is suitable for felling and processing. Tree health monitoring is the process of regularly monitoring and evaluating the condition of trees. Monitoring aims to quickly identify tree problems so that appropriate treatment can be applied to prevent further damage. Several studies on tree health assessment have led to the use of nondestructive (NDT) methods owing to their practicality, thus eliminating the need to fall trees [8,9,10,11]. The principle of nondestructive methods is to build a model to predict the value of a parameter based on noninvasive measurements and/or observable morphological correlates and characteristics.
Some studies have revealed the existence of electrical property potentials in trees that could be related to their physiological processes [12,13]. The tree electrical property approach is also used to determine the quality of trees for saw logs and breeding programs [14,15]. Quality prediction using the electrical potential approach in wood has been carried out in several studies on small wood samples, showing that the use of electrical capacitance sensors to determine the dielectric properties of wood samples, especially capacitance, in the low-frequency range has a high correlation with hardness and specific gravity [16,17]. The same method has been shown to have a high correlation for predicting the moisture content (MC) of wood chips [18,19]. Understanding the electrical properties of wood and the electrical potential of trees is still an evolving area of research that requires further investigation. However, the prediction model for trees can be challenging because of fresh conditions with a moisture content above 100%. Some studies have shown that fresh wood affects the signal, causing inaccuracies in quality prediction [19,20,21].
According to previous studies, the electrical properties of wood are influenced by its anatomical structure. Wood exhibits a high level of complexity due to its anisotropy, unsymmetrical molecules, and heterogeneous structure, which are evident from its composition and internal arrangement. The main components of wood include cell rays, parenchyma, fiber cells, vessels (in hardwood), and tracheids (in softwood). The anatomical arrangement is related to the chemical composition and density of wood. The higher the fiber composition, the higher the cellulose content (higher polarity). High porosity affects the presence of water, especially under saturated conditions, which increases polarity [16,17,22,23]. It is challenging to determine whether the proportion of the anatomical structure can be predicted through electrical property measurements.
Dielectric spectroscopy (DS), also known as impedance spectroscopy, is a widely employed technique for examining the response of a sample subjected to an electric field of varying frequency. It is a powerful tool for understanding the electrical behavior of materials and has broad applications in both fundamental research and practical applications. By analyzing the dielectric response over a range of frequencies, valuable information regarding the molecular structure, dynamics, and interactions within the material can be obtained. The measurement setup involves applying an alternating electric field to the material and measuring the resulting current or charge response. Using appropriate mathematical models, the complex permittivity is then calculated from the measured impedance or admittance. DS can be applied across an extensive frequency range, from very low frequencies in the millihertz (mHz) range to extremely high frequencies in the terahertz (THz) range [24,25,26,27,28].
In NDT evaluation, data analysis and modeling methods to predict wood quality are important for determining the accuracy of the model. Preprocessing data is necessary to avoid electrical system noise and to normalize data that carry important information [29]. This modeling approach is based on regression analysis [21,24,25]. The development of machine learning (ML)-based regression models has been increasingly explored [30,31,32,33]. ML models can handle complex datasets that encompass nonlinear or missing data.
The main objectives of this study were to analyze the dielectric characteristics of fast-growing teak standing trees using the DS method at multiple frequencies (ranging from 250 kHz to 60 MHz) and to determine the relationships between dielectric characteristics and physical and anatomical properties using model prediction.

2. Materials and Methods

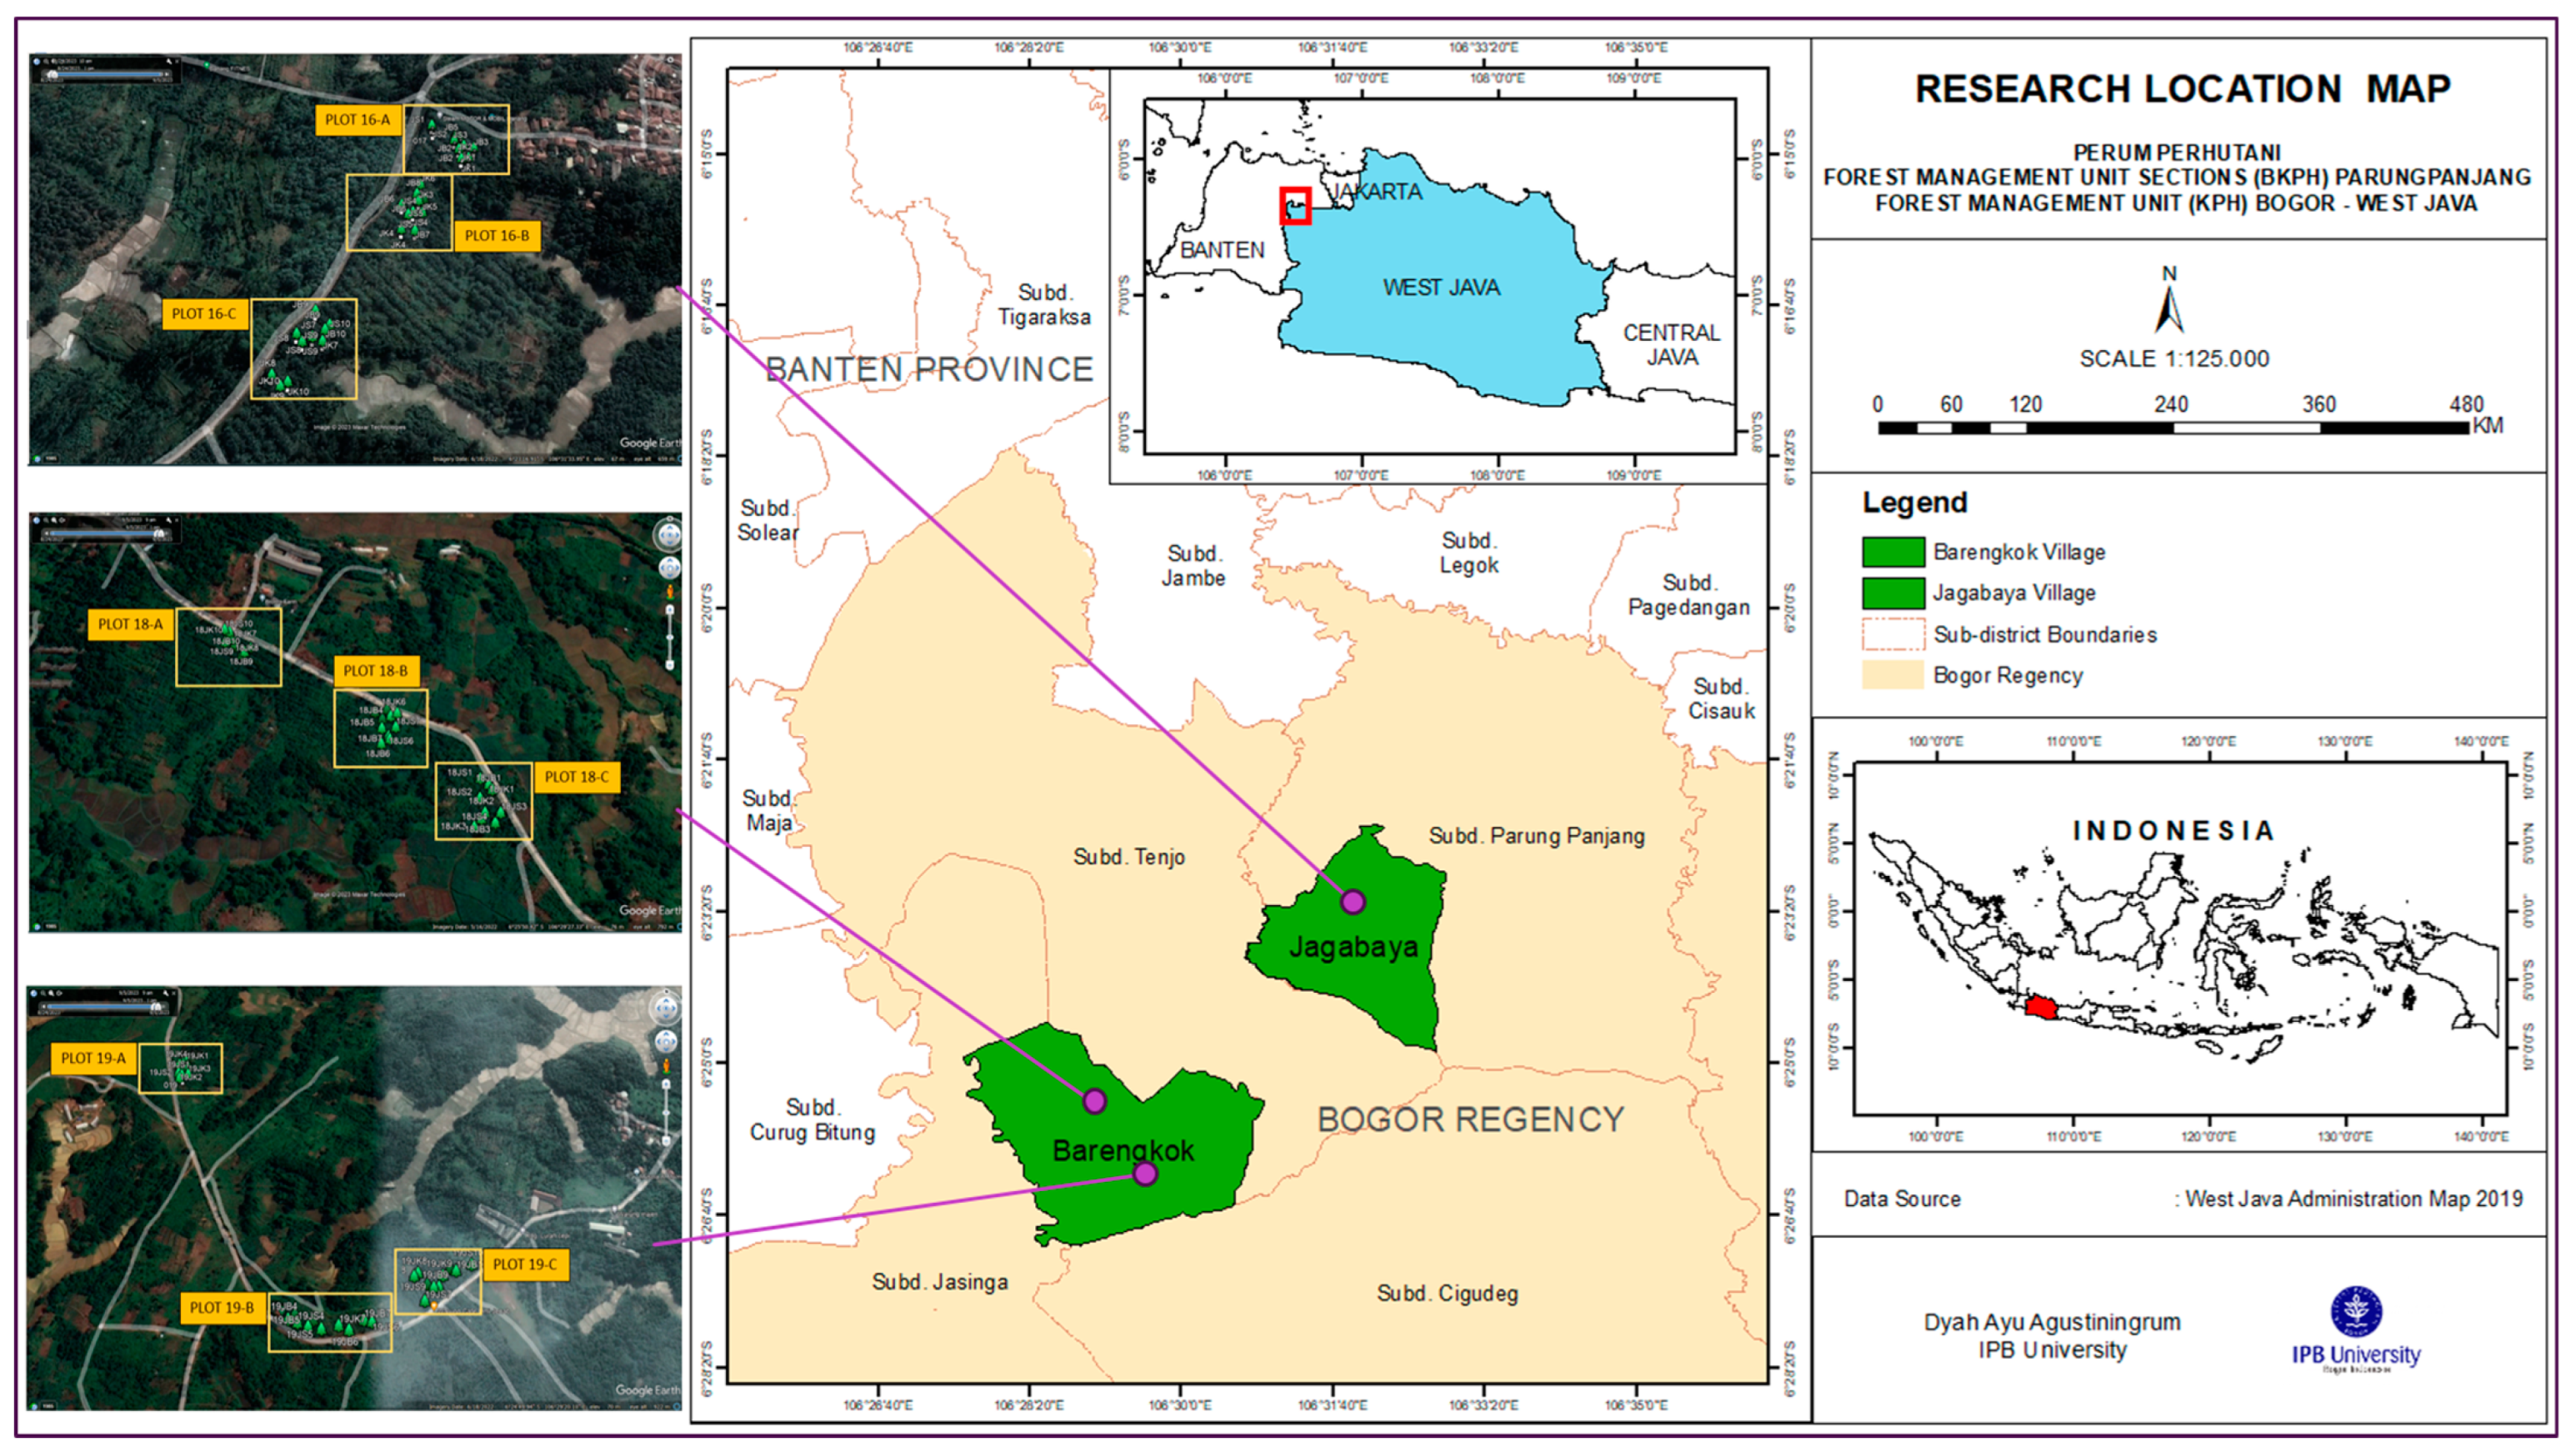
2.1. Site, Tree Selection, and Sampling

This study observed fast-growing standing teak trees grown at the state-owned plantation forest companies Perhutani KPH Bogor and BKPH Parungpanjang, Bogor, West Java, Indonesia. Trees of three different ages, that is, 4, 5, and 7 years, were selected from three different plots for each age. Information related to location, year of planting, and planting plots is shown in Table 1 and Figure 1. A total of 90 trees were selected from 30 trees in each age group.

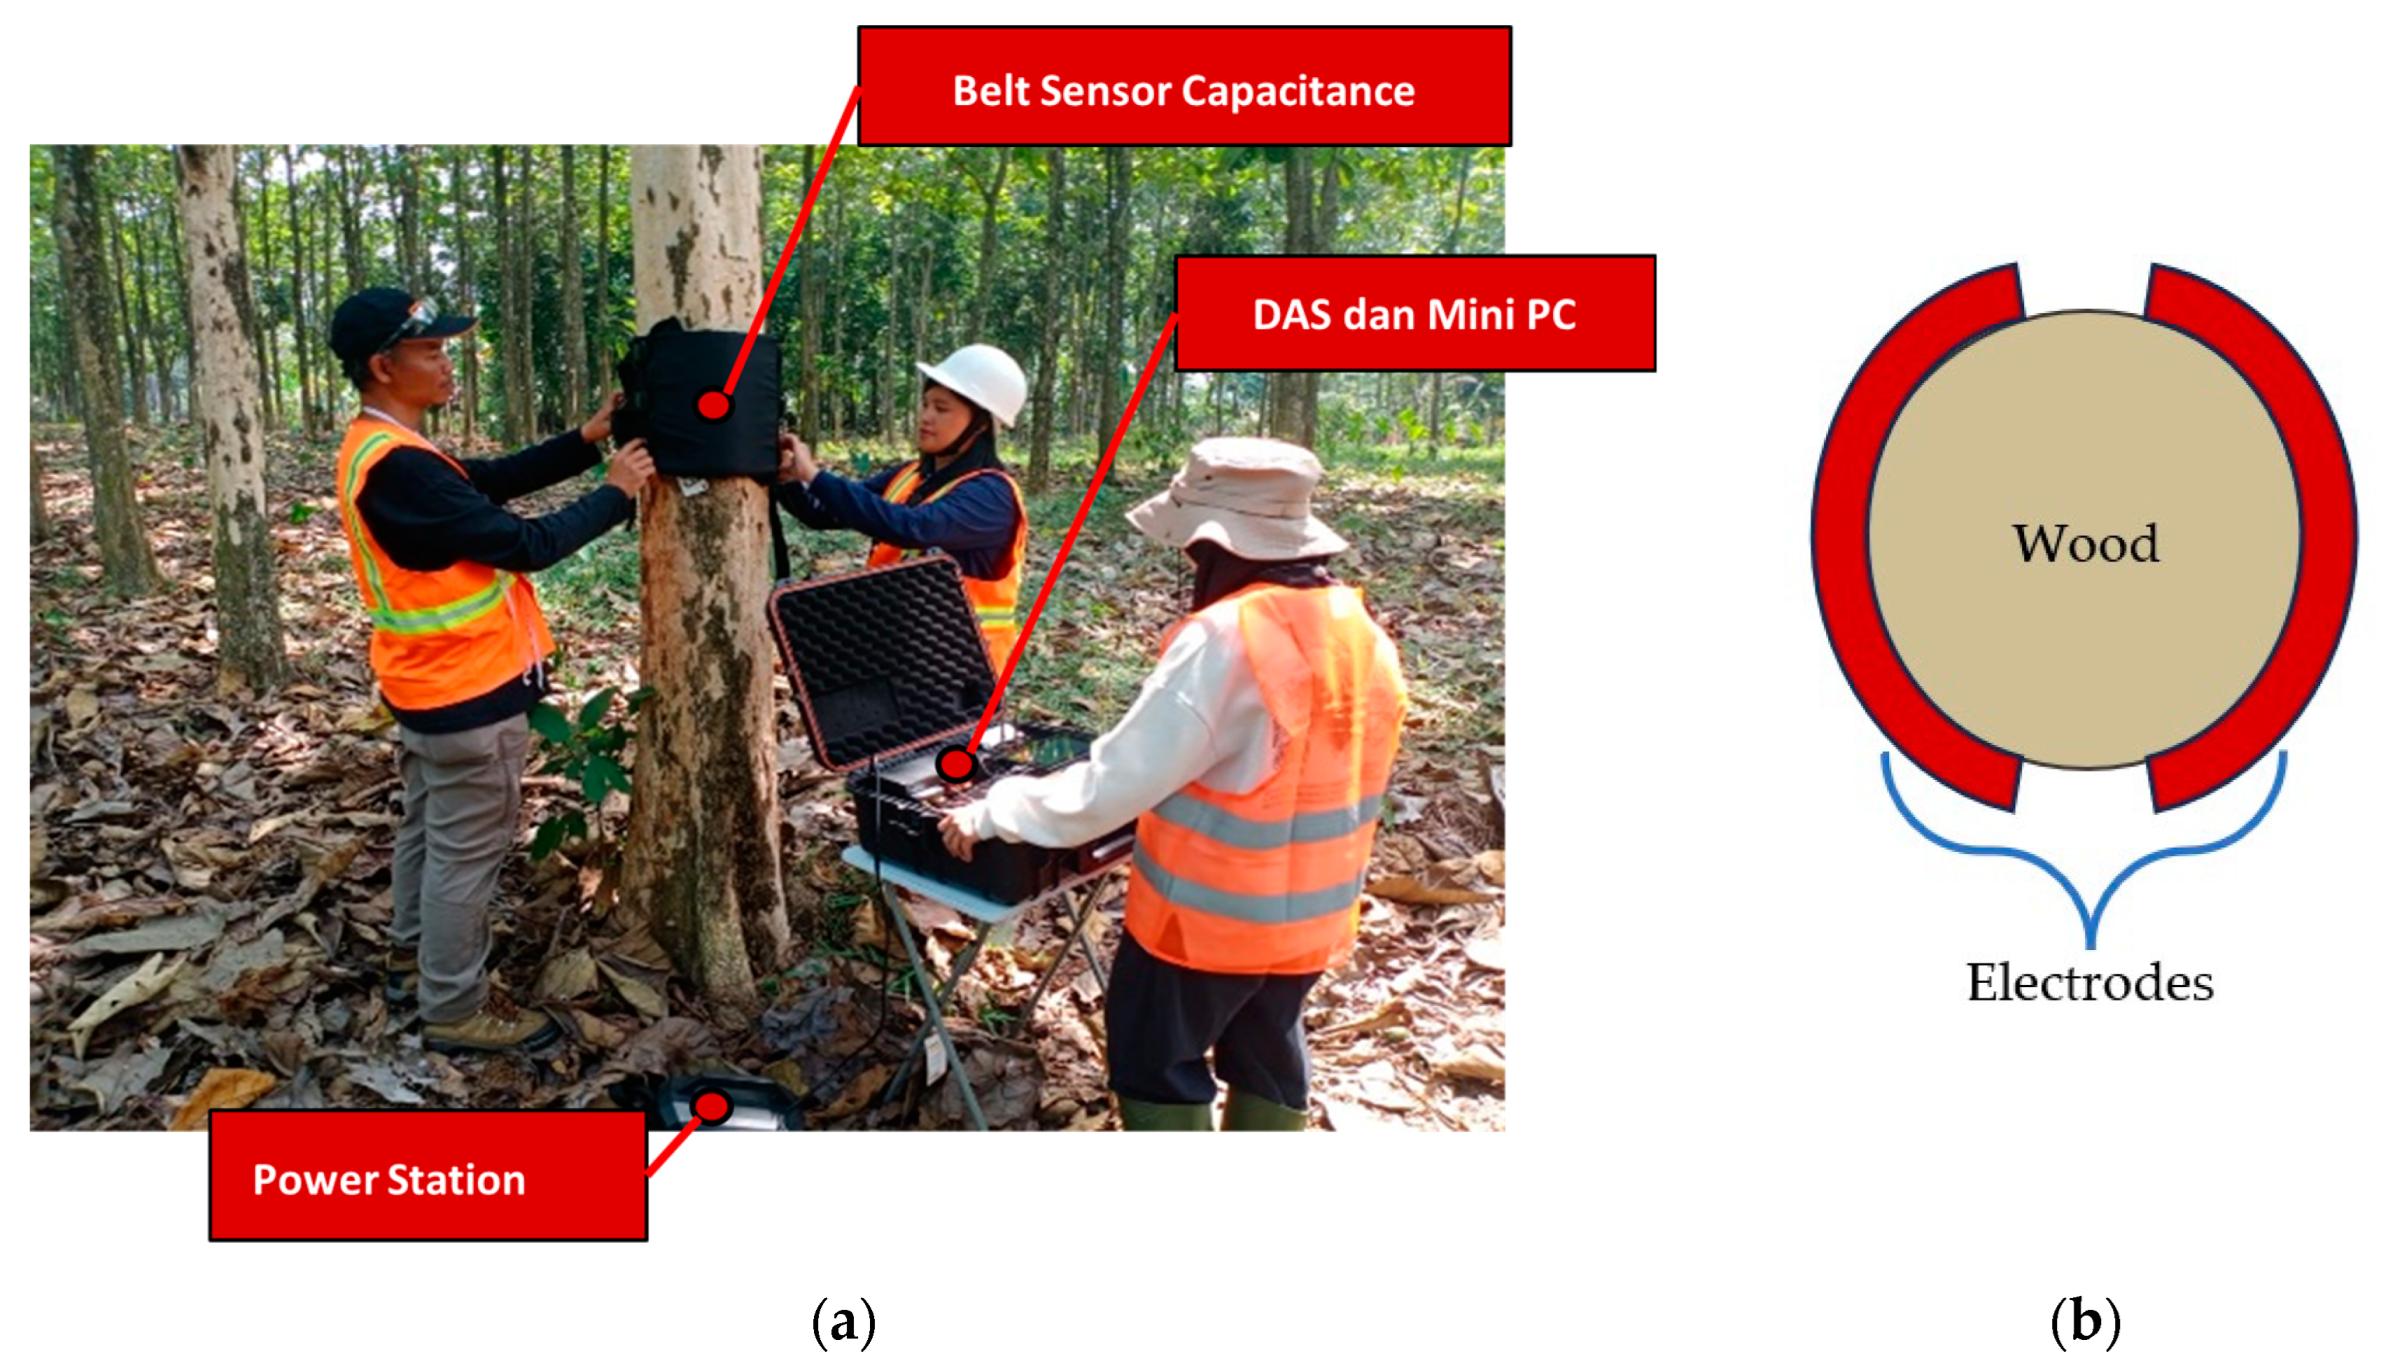
2.2. Field Measurement

The primary data on electrical capacitance values were collected using a capacitance measurement system designed for small wood samples with varying moisture contents [24]. This device operates based on the principle of DS, which emits multi-frequency static electricity. The frequency range used in this study was 250 to 60 MHz.
The instrument comprises a Vector Network Analyzer (VNA) along with additional equipment such as a display monitor and a portable battery. The sensor employed in this system was designed in the form of a belt tightly fastened around the circumference of a tree’s trunk, equipped with a buckle to secure its position and prevent easy shifting (Figure 2a). This sensor includes transmitter (Tx) and receiver (Rx) electrodes made from copper foil with a ground electrode layer to minimize noise interference. The two electrodes on the sensor were positioned facing each other, covering the perimeter of the tree trunk (Figure 2b). The maximum diameter of each measured tree was 30 cm.
The measurement process began with activating the instrument and configuring the system settings. The measurement was conducted by setting the VNA RedPitaya Application (by Pavel Demin) at frequency range between 250 kHz and 60 MHz, chosen based on the tool’s capabilities and preliminary research. The test port was calibrated at the beginning of the test. Subsequently, the computer was connected to the capacitive sensor, which was then affixed to the tree trunk at the diameter at breast height (DBH).
It is crucial to ensure the precise alignment of the two electrodes and secure attachment to the tree to prevent any shifting that could affect signal readings. Once the sensor was securely installed, electrical waves were generated through the control system, transmitted by the Tx electrode, propagated through the bark and wood medium, and received by the Rx electrode. The spectrum of the captured signal was then displayed as raw data on a monitor screen.

2.3. Physical and Anatomical Properties Observation

To evaluate the physical and anatomical properties, a core sample was obtained using an increment borer (diameter, 0.5 cm) extending from the bark to the tree pith. Each core sample was then stored inside a straw to prevent damage during storage, minimize moisture loss, and preserve the actual moisture content.
The measured physical properties included the moisture content (MC), green wood density (GD), and specific gravity (SG). Moisture content testing was conducted using the gravimetric method, which involved determining the initial weight and oven-dry weight of the sample at a temperature of 103 ± 2 °C until a consistent mass was achieved, following the procedure outlined in [34] and calculations based on Equation (1).
M C   % = o r i g i n a l   g r e e n   w e i g h t o v e n   d r y   w e i g h t   o v e n d r y   w e i g h t × 100 ,
Meanwhile, GD and SG were determined using the displacement method. A displacement method that uses water as a fluid is effective when applied to green materials because of minimal water absorption by wood [35]. GD and SG were calculated using Equations (2) and (3).
G D   g c m 3 = i n i t i a l   g r e e n   w e i g h t g r e e n   v o l u m e ,
S G = ( o v e n   d r y   w e i g h t g r e e n   v o l u m e ) / ρ   w a t e r
where ρ water is the water density.
The anatomical structure was observed in the sectioned specimens obtained from the core sample. The wood samples were first softened in a mixture of aquadest and glycerol (1:1) and gradually heated in a microwave oven. Subsequently, the softened samples were sliced into 18 μm thick sections using a sliding microtome to produce cross-, radial, and tangential sections. These sections were stained with a 2.5% safranin solution; dehydrated using graded alcohol; soaked in xylene (Loba Chemie Pvt. Ltd., Mumbai, India) and toluene (Merck KGaA, Darmstadt, Germany) to remove the dehydrating agent; and mounted on glass slides with entellan (Merck KGaA, Darmstadt, Germany). Macerated samples were prepared by making small sticks from each sample code, which were then placed in a test tube containing a mixture of hydrogen peroxide (H2O2) and glacial acetic acid (CH3COOH) in a 1:1 ratio (v/v) and heated in a water bath.
Anatomical features were assessed according to the guidelines provided by the International Association of Wood Anatomists (IAWA) for hardwood species [36] using a Digital Microscope Olympus DP22. The microscopic features evaluated included the fiber length (FL), fiber diameter (FD), lumen diameter (LD), and fiber wall thickness (FWT). Additionally, measurements were taken for vessel length (VL) and vessel diameter (VD). Thirty measurements were conducted randomly for each microscopic feature of each sample.

2.4. Data Analysis

The raw data collected from the capacitance measurement system were analyzed to obtain real data values. The analysis was conducted using the Python programming language and the sci-kit-learn package. The raw data from the prototype capacitance monitoring system remained in their original form, necessitating further processing to derive electrical values, such as impedance, resistance, and capacitance. This process, referred to as data preprocessing, encompasses several steps, including data extraction, outlier detection, outlier removal, filtering clean data, data scaling, and data transformation. Numerous methods are available for preprocessing raw data to extract pertinent information without losing other valuable insights.
Statistical analysis was performed to establish correlations between variables using Spearman’s correlation coefficient, while the predictive relationship model was developed using multivariate regression. This process entailed filtering and regression analyses to formulate prediction models [29,31].

3. Results

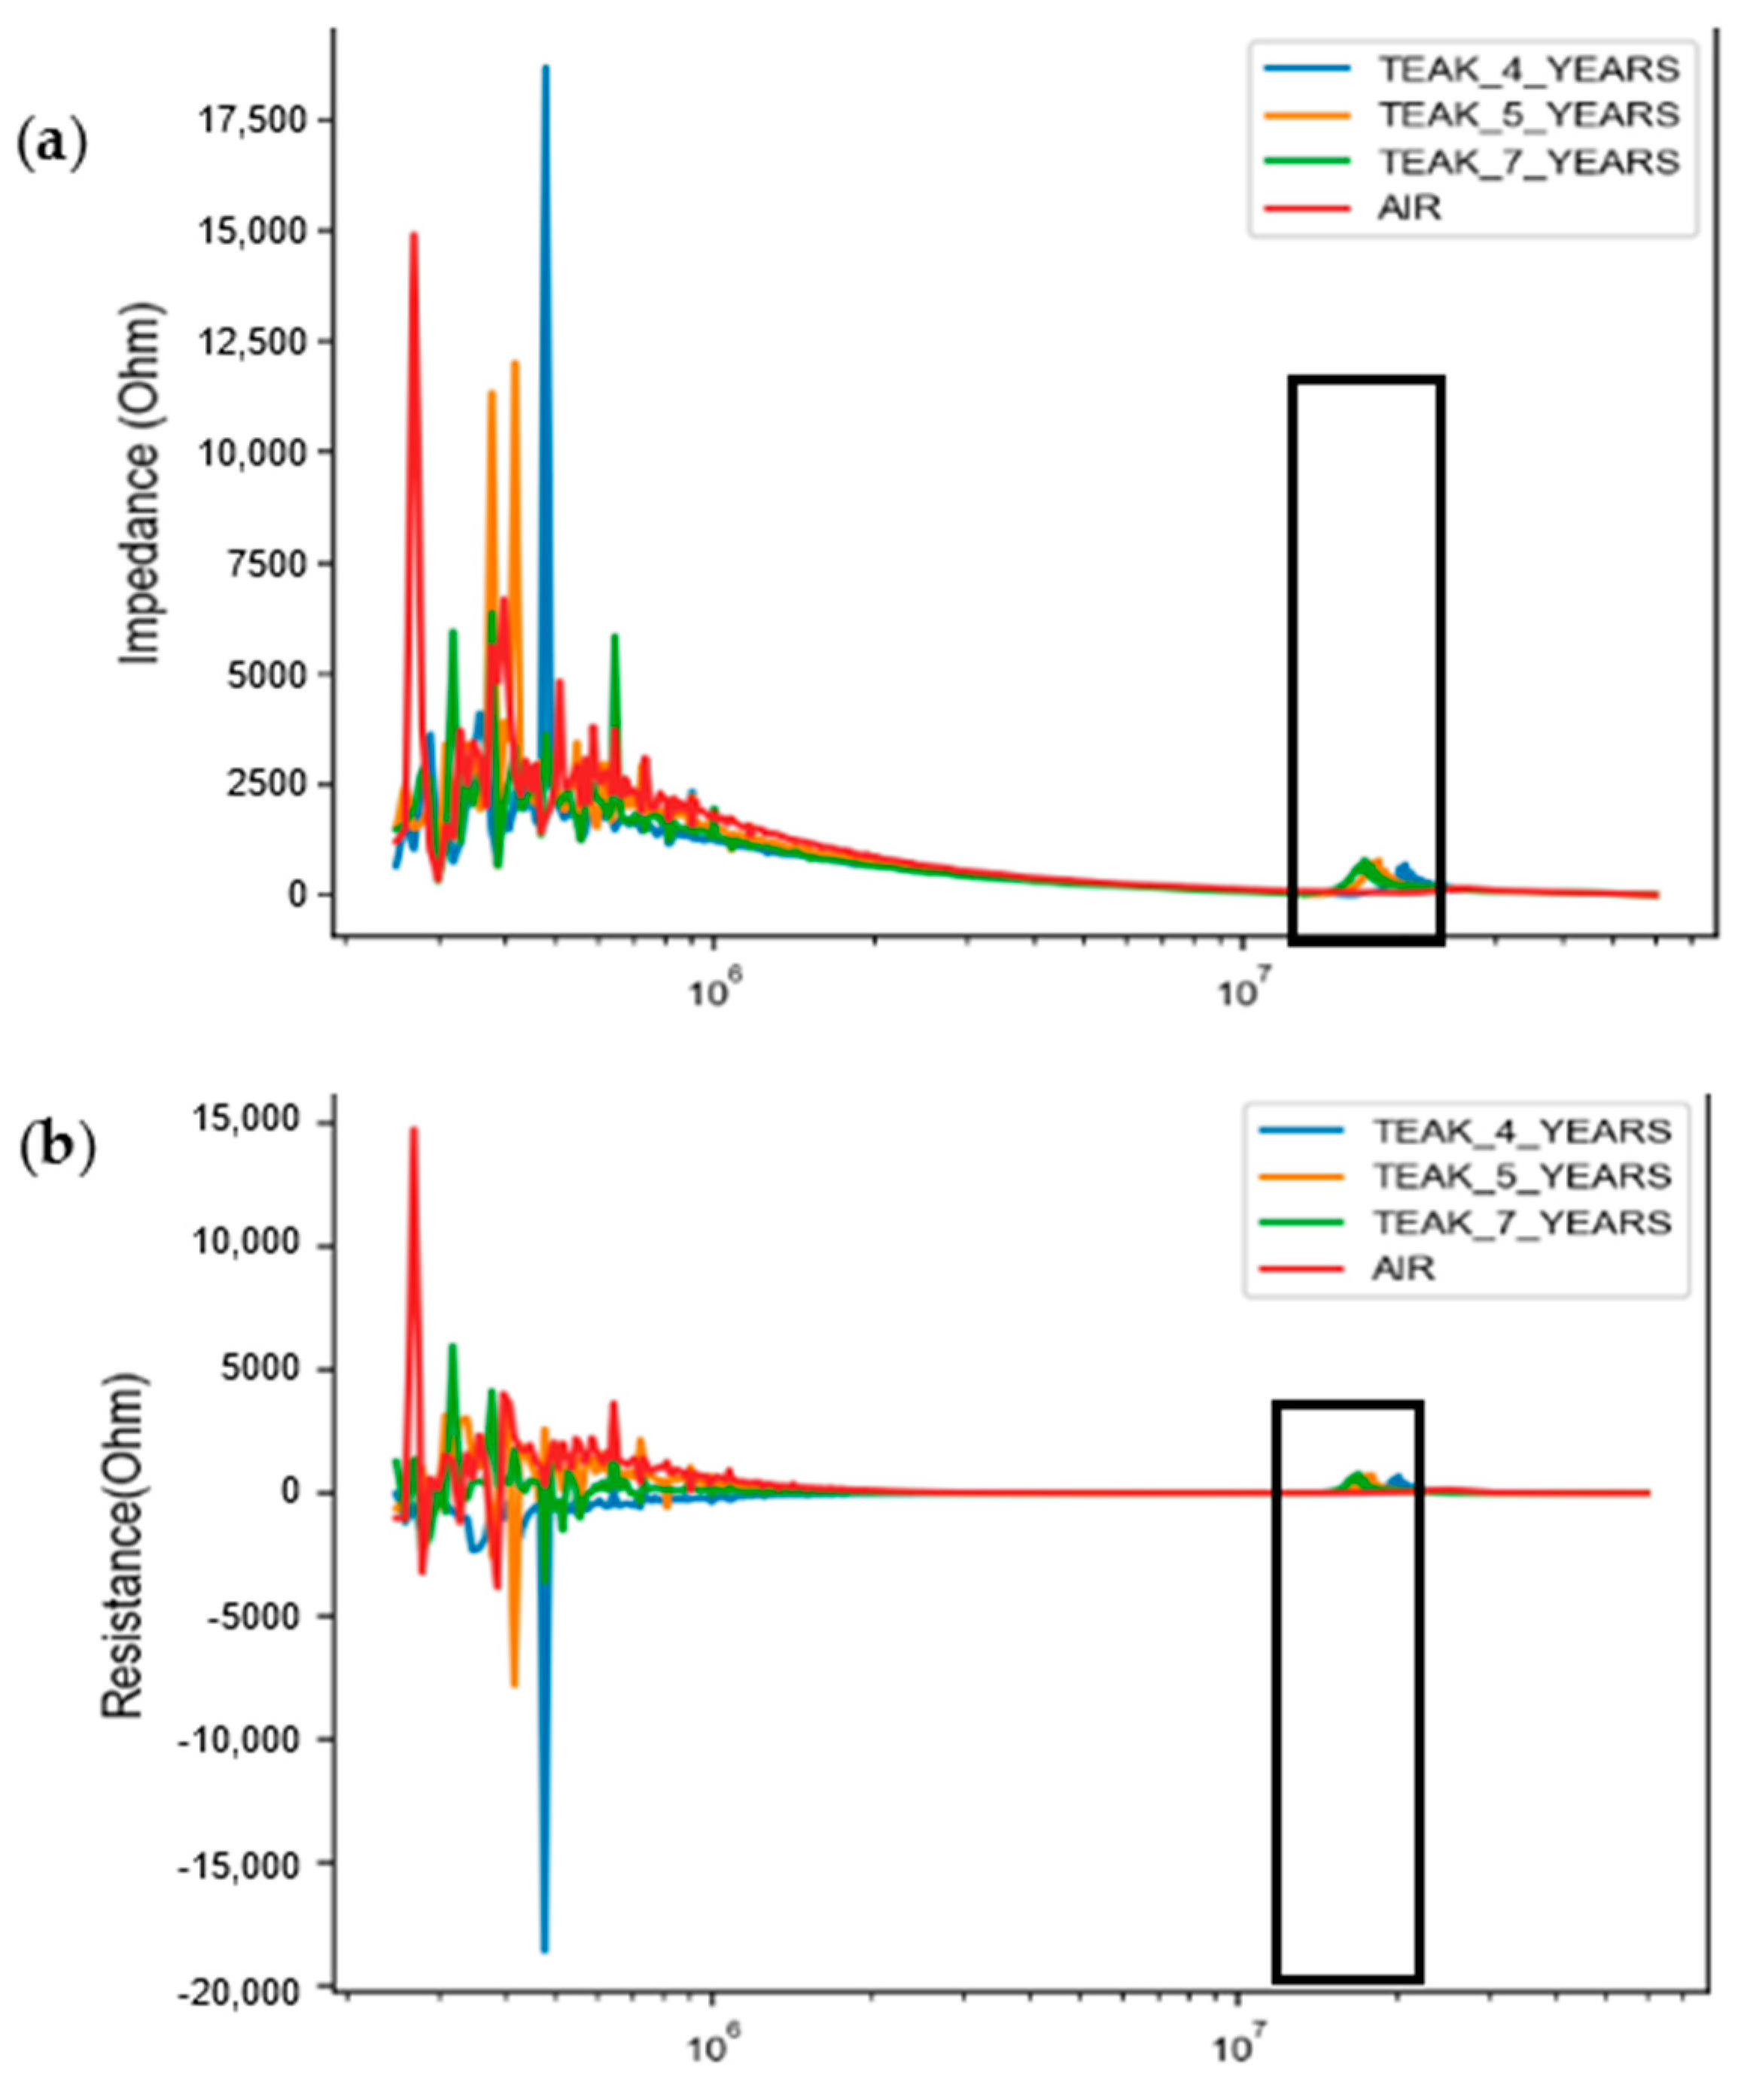
3.1. Dielectric Characteristics of Fast-Growing Teak

The measurement results obtained using the capacitance measurement system for fast-growing standing teak trees were still in the raw data form. Subsequently, data extraction was performed to determine the real values of the impedance, resistance, and capacitance within a frequency range of 250 kHz–60 MHz. The results of the extraction process are visualized graphically, showing the distribution of each dielectric value along the frequencies. The corresponding graphs are shown in Figure 3.
In Figure 3a,b, the distribution of the dielectric values for the impedance and resistance exhibits a decreasing trend as the frequency of the emitted static electricity increases within the observed frequency range. According to previous research [29], at nearly all temperature levels, the dielectric loss decreases with increasing frequency. Nevertheless, in the high-frequency range (>1 MHz), the dielectric loss curves reach a saturation point. The low-frequency region exhibits a significant energy loss, which can be attributed to the dipolar polarization, space charge, and polarization associated with the rotation direction that emerges in this particular frequency range.
The capacitance value exhibited a notable increase within a frequency range of 15–17 MHz, whereas, at other frequencies, it approached zero. However, it should be noted that the data at this stage are in their raw form, including outliers and missing values resulting from measurement errors that may be influenced by environmental factors, sensors, or the measurement system itself [26,28]. The subsequent step involves identifying and addressing outliers and missing data, thereby retaining intact data that contain crucial information regarding the polarization response of the material to the electric field.
This study explored a wide range of frequencies to identify the optimal dielectric frequency capable of distinguishing wood mass from air based on impedance, resistance, and capacitance properties. It is anticipated that the dielectric value spectra for standing trees and air will display different shapes owing to their distinct permittivities. Permittivity describes the effect of a material on the electric field in reaction with an electric charge. Air, having a lower permittivity compared with solid materials such as wood—and, notably, fresh tree wood, with its high water content (since water possesses a significantly high permittivity) [37]—was chosen as the control for this study. Given the lower permittivity of air, the spectrum is expected to reveal a distinct separation from other media, in this case, wood (teak trees). Thus, spectrum analysis is crucial for identifying the unique peaks that delineate the characteristics of teak wood.
The graphical representation derived from the raw data extraction highlighted noticeable differences in the dielectric values between wood and air at specific frequencies. Variations in frequency peaks were detected across trees of different ages. Notably, the dielectric values for 4-year-old teak trees showed the highest frequency peaks, followed by those of 5-year-old teak trees, whereas 7-year-old teak trees exhibited the lowest frequency peaks.
In Figure 3, the optimal frequency range is delineated using a black box. The peaks in the graph reveal distinctive characteristics associated with varying tree ages. Specifically, a 4-year-old teak tree displayed peak impedance (Z) and resistance (R) values at a frequency of 23 MHz and a peak capacitance (C) value of 20 MHz. For a 5-year-old teak tree, characteristic peaks for Z and R were identified at a frequency of 21 MHz, whereas the peak for C was at 19 MHz. In contrast, a 7-year-old teak tree exhibited peak values of Z, R, and C at a frequency of 18 MHz. These results suggest that the electrical properties of trees can be distinguished by age, with older trees exhibiting lower peak frequencies. Further investigations are necessary to corroborate these results. Table 2 presents detailed information on the optimal peak frequency characteristics corresponding to each tree age.
The dielectric frequencies listed in Table 2 reflect the properties of wood in rapidly growing standing teak trees. Thus, these variables can be employed as predictors in the development of a model aimed at estimating the physical and anatomical properties of wood.

3.2. Physical and Anatomical Properties

In the development of a predictive model aimed at assessing wood quality, incorporating data obtained from the destructive testing of the wood is considered crucial. Destructive testing data are indispensable for constructing reliable and robust predictive models. These data introduce a set of outcomes that the model does not encounter during its training phase, enabling a more objective evaluation of the model’s performance on previously unseen data. Utilizing destructive testing data allows for a more accurate assessment of a model’s actual predictive accuracy. The findings from destructive testing are detailed in Table 3 and Table 4.
Statistical analysis of the physical properties of the core sample showed no significant differences in MC, GD, or SG among trees of different ages, suggesting that these values are relatively stable across the age spectrum of the trees. However, there was a noticeable trend of increasing MC, GD, and SG values with advancing tree age. Notably, teak trees aged 7 years displayed the highest GD values. This phenomenon can be explained by the direct correlation between the density and growth rate of the hardwoods. In the case of teak, which is a hardwood, density is likely to increase alongside an accelerated growth rate, as a greater proportion of mature wood, which is denser, forms over time. This leads to an overall increase in the density. Both MC and GD values increased with the age of the tree, whereas SG values showed a noticeable increase only in trees that were 7 years old. The minimal differences in growth rates observed between 4- and 5-year-old teak trees might account for the scant variation in their physical properties.
Figure 4 illustrates the results of a regression analysis between MC and SG, revealing a negative coefficient of correlation (r) of −0.82 with a coefficient of determination (r2) of 0.67. This indicates that an increase in MC was associated with a decrease in SG. The negative correlation between MC and SG in wood primarily stems from the principle that, as the moisture content in wood increases, its overall density declines. The moisture content quantifies the amount of water within the wood, whereas the specific gravity assesses wood density relative to water. A higher moisture content implies that a greater proportion of the wood weight is attributable to water. Given that water has a lower density than solid wood material, the wood’s overall density diminishes with an increase in moisture content, leading to a reduction in its specific gravity. On the other hand, a decrease in moisture content results in the evaporation of water, causing the wood volume to reduce while its mass remains relatively unchanged, thereby elevating the wood density. Consequently, a decrease in the moisture content of the wood results in an increase in its density [38].
Anatomical property analysis was performed to ascertain the microscopic dimensional characteristics of the wood across different tree ages. This analysis involved taking dimensional measurements of both sectioned and macerated samples, as depicted in Figure 5. The purpose of these measurements was to elucidate the characteristics of the tree’s anatomical structure and to investigate any potential correlations with the tree’s dielectric values. The average results of these measurements are summarized in Table 4.
According to the analysis of the anatomical data, significant differences were observed in FL, LD, and FWT among the different tree ages. As shown in Table 4, FL tended to increase with tree age, along with FWT. Conversely, LD tends to decrease or become smaller. This reduction in lumen diameter can be attributed to the thickening of wood fiber walls during tree growth [35], which is further supported by the increased FWT with tree age. There were no significant differences in other anatomical structures based on tree age. However, FD tended to decrease, whereas VL and VD increased. Microscopic images of the cross-, radial, and tangential sections of fast-growing teak wood are shown in Figure 6.
Figure 6 presents a magnified microscopic image of sectioned fast-growing teak wood extracted from a core sample. These images were captured at a 20× magnification level, with a scale of 200 µm. Analysis of the microscopic images in the cross-section revealed that the lumen diameter of the 7-year-old teak appeared smaller, while the fiber walls appeared thicker than those of the teak at 4 and 5 years of age. Furthermore, examination of the radial plane demonstrated that the ray parenchyma of the 7-year-old wood was longer than that of the other samples.
The observed reduction in the lumen diameter of the 7-year-old teak, in contrast to the younger samples, can be attributed to the natural process of wood maturation and growth. As the trees age, their wood undergoes structural changes and becomes denser. In the case of teak, which is renowned for its high-density characteristics, growth rings become more pronounced with age [2,3,35].

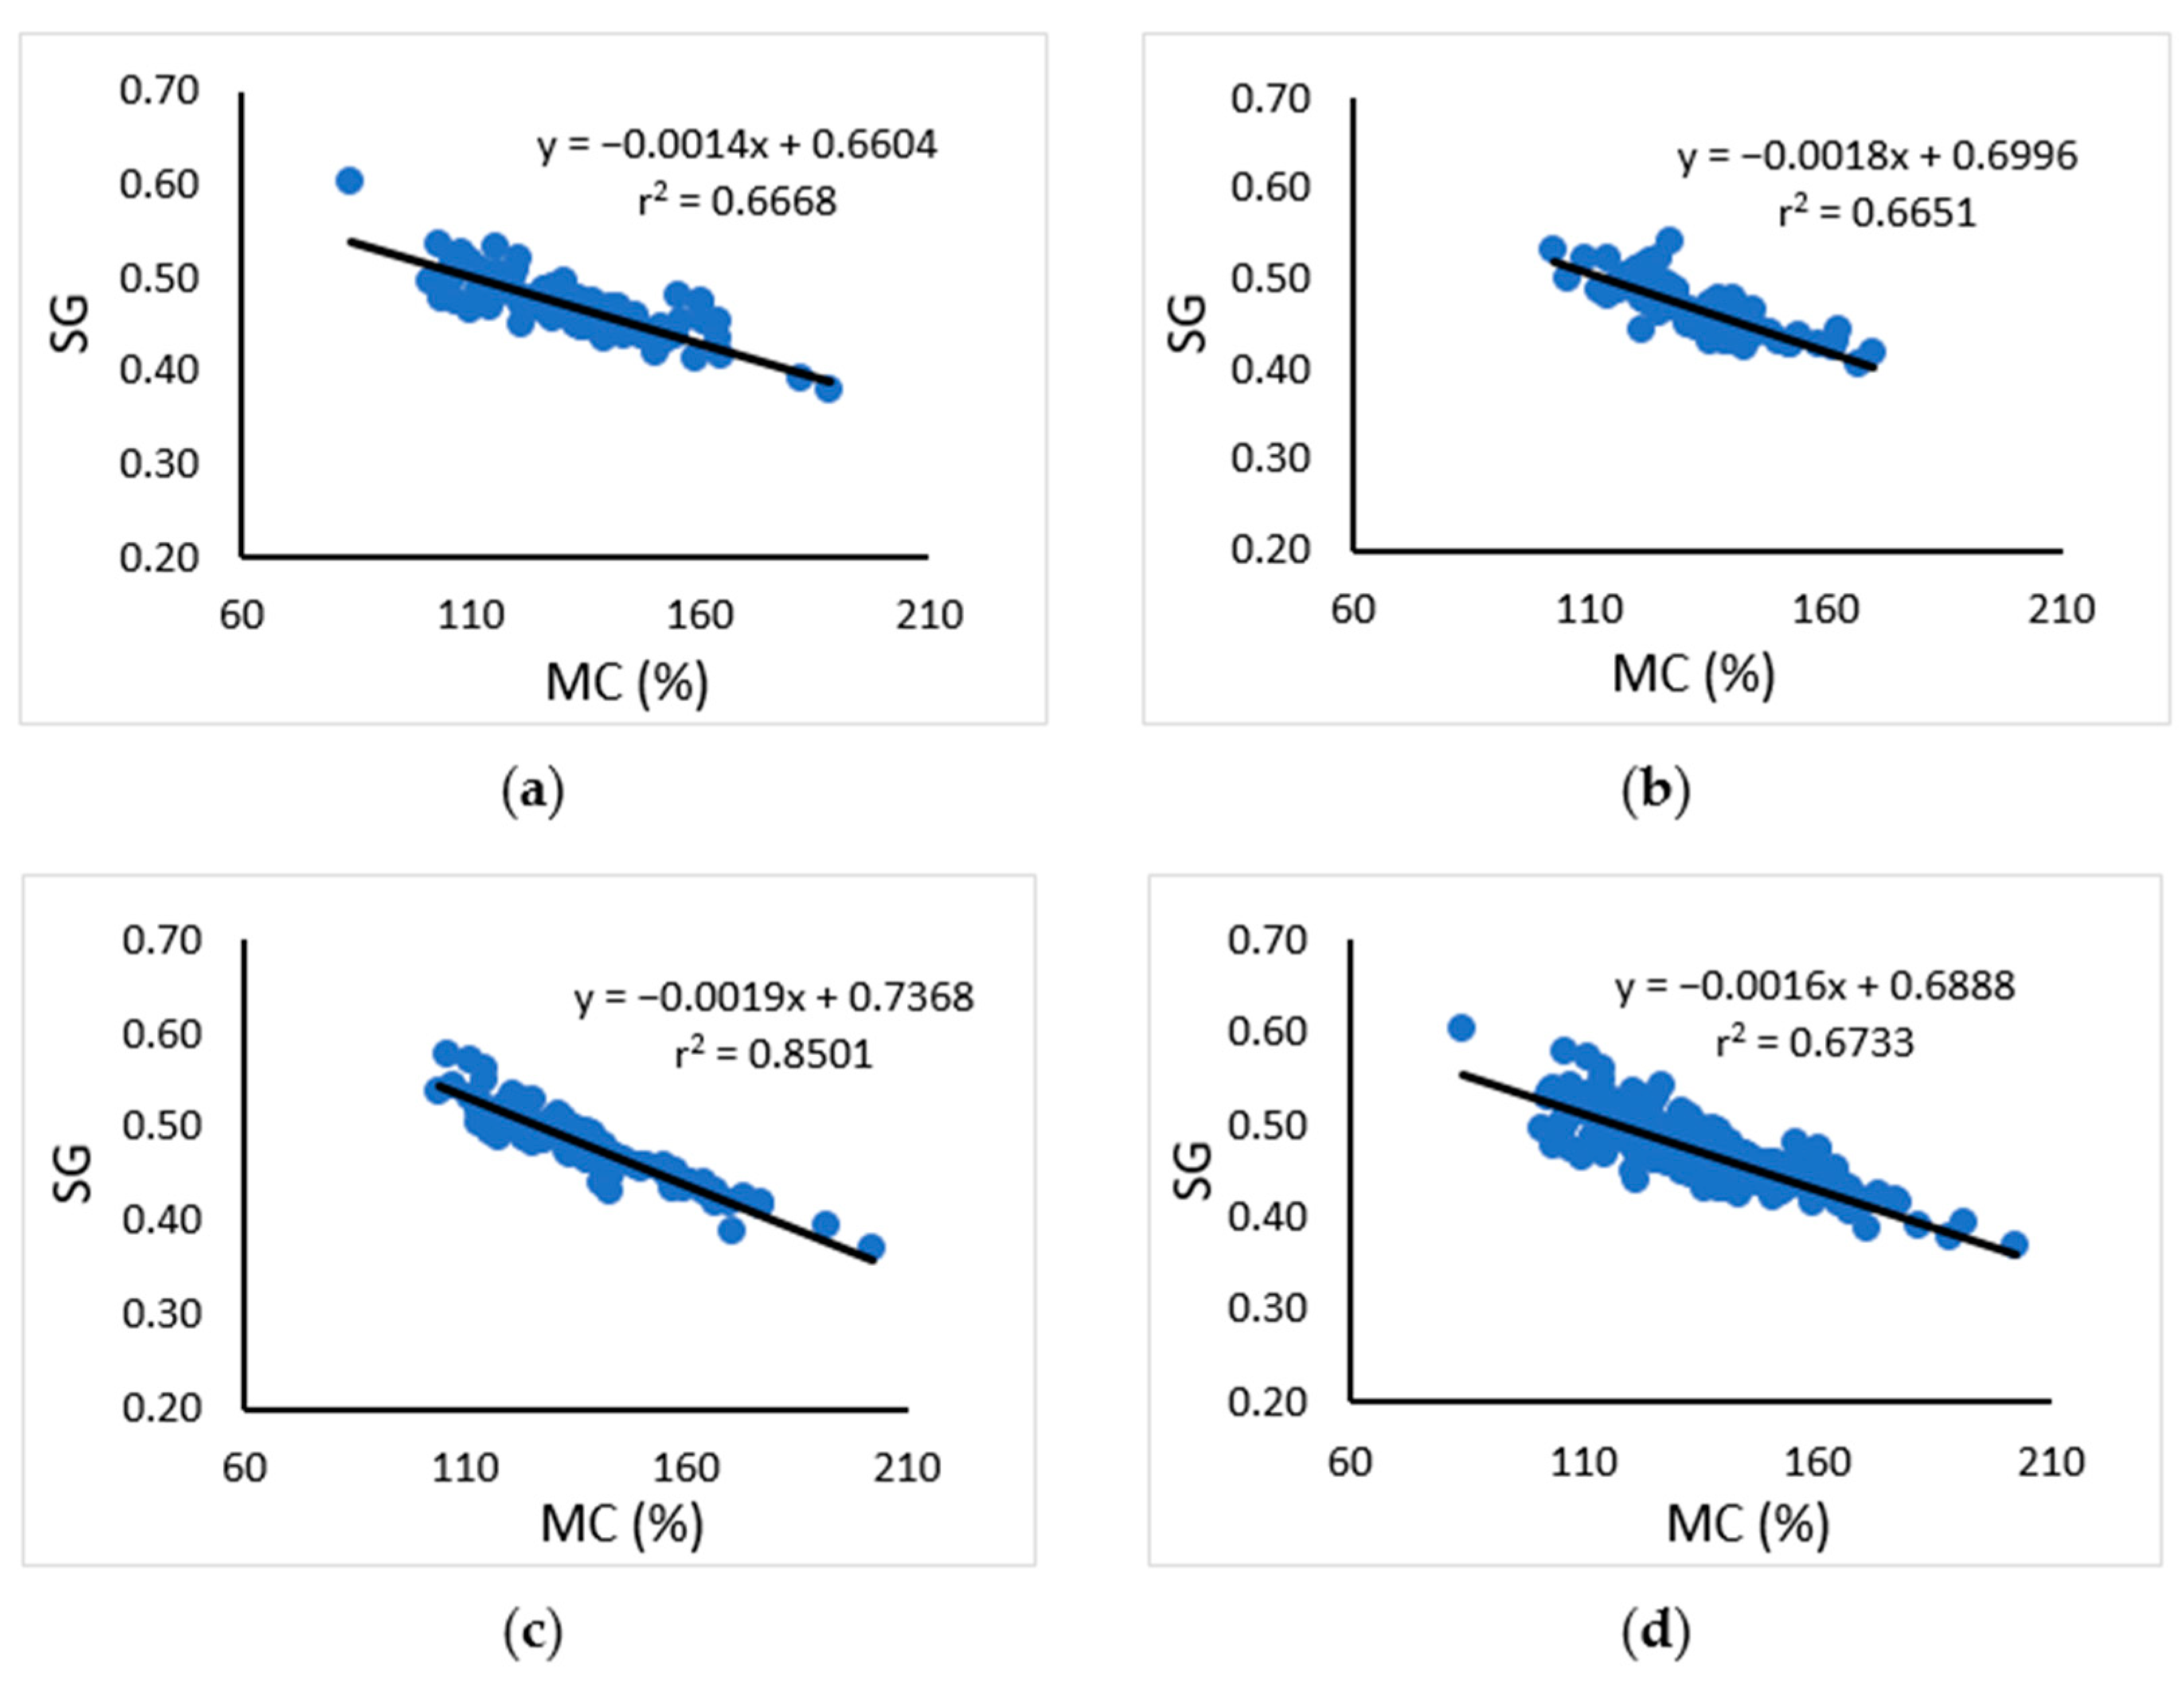
3.3. Regression Model Development

Modeling was undertaken on the electrical values Z, R, and C at the frequencies specified in Table 2 as independent variables to estimate the dependent variables, namely, MC, GD, SG, FL, FD, LD, FWT, VD, and VL. Given that MC is highly sensitive and acts as the primary physical characteristic of standing trees, it was included as an independent variable. Modeling was performed using a multivariate regression method. However, a potential concern regarding multicollinearity arose due to the inclusion of numerous independent variables in the regression model. A backward linear regression was used to mitigate this concern. This method aids in minimizing multicollinearity by iteratively eliminating independent variables with F probabilities exceeding 0.10 (or 10%), indicating a lack of a statistically significant contribution to the model. The resulting model is presented in Table 5.
Based on the regression model developed using the frequency variables Z, R, C, and MC, it was evident that these variables exhibited a strong relationship with SG, with r = 0.826 and r2 = 0.682. This robust relationship is consistent with findings from other studies conducted on wood samples, where correlation coefficients ranged from 0.8 to 0.9 [16,17]. Furthermore, the variables demonstrated a moderate relationship with GD, with a correlation coefficient of 0.403.
However, the variables did not demonstrate a satisfactory relationship with anatomical properties. Previous research on small wood samples by Esofita et al. [16] revealed that the anatomical structure correlates with wood capacitance. Specifically, a higher number of vessels and parenchyma cells is associated with lower wood density and hardness, as well as higher capacitance values. Additionally, the presence of more fibers is linked to increased cellulose content. Because cellulose is a polar molecule, a higher polarity results in higher capacitance values. Based on these findings, it was hypothesized that predicting anatomical dimensions using capacitance and/or dielectric properties would be challenging. Although attempts were made in this study to predict anatomical dimensions, the results were not accurate, indicating that the dielectric properties cannot specifically predict anatomical dimensions.
When constructing the multivariate linear regression model, several alternative models with different complexities were considered. However, the chosen model had the highest adjusted R-squared (Adj. r2). When interpreting regression results, r2 is commonly used to evaluate how well a regression model fits the observed data as a whole, whereas Adj. r2 is more useful when comparing different regression models with varying numbers of independent variables. Adj. r2 provides a fairer assessment of model performance by considering the complexity of the model and the number of samples utilized. Moreover, a higher Adj. r2 value indicates a lower standard error of estimation.

4. Discussion

The DS method examines the frequency-dependent behavior of materials within the frequency domain [8]. Polarization refers to the relationship between molecular properties and charge when subjected to an electric field [25]. The primary polarization processes include atomic or electronic polarization, ionic polarization, dipole or orientation polarization, and space charge polarization [27]. At low frequencies, the electric field direction allows for the free rotation of water molecule electric dipoles, leading to energy storage through polarization. Additionally, the positive and negative ions of dissolved salts move in response to the electric field, resulting in energy loss through the current. However, as the frequency increases, water molecules are unable to keep pace with changes in the direction of the electric field, leading to decreased energy storage and increased energy losses. This inability of water molecules to respond to higher frequencies is a key factor behind the lack of a significant material response at high frequencies, as observed in Figure 3. While hygroscopic materials, including wood, primarily consist of water, other factors such as physical properties (density and material structure), frequency, temperature, and chemical composition also influence the dielectric properties [39]. In particular, in saturated materials, such as standing tree wood, where water content can exceed 100%, water predominantly influences dielectric properties because of its higher permittivity compared with other chemical components [40].
These theories may also explain why dielectric properties exhibit different characteristics at various tree ages, particularly with respect to the frequencies containing peak values. As indicated in Table 3, the MC of fast-growing standing teak trees increased with tree age, consequently affecting the dielectric peaks reached at lower frequencies. Further investigations under diverse conditions and sample variations are warranted to explore the effect of water content on the dielectric frequency of standing trees.
However, instead of utilizing the dielectric values at low frequencies, the data in Table 2 were employed as variables to estimate the physical and anatomical properties of fast-growing standing teak trees. This decision stems from the absence of distinct peak differences between the wood and air materials at low frequencies, as depicted in Figure 3. Frequencies above 18 MHz were deemed optimal, as they effectively differentiated between wood and air dielectric materials.
The data in Table 5 suggest that the strongest correlation exists between the DS and SG variables. This can be attributed to the inclusion of MC as a predictor variable, which exhibited a high correlation with SG (r = 0.826). This finding aligns with the graphical regression equation in Figure 4 between MC and SG, indicating that MC is the most significant factor among the other predictors in the prediction model of wood physical properties using DS. Although the correlations with DS for the remaining variables tended to be weak, some relationships were significant at a level of less than 0.05, particularly for VD and FWT. According to the regression analysis, a model with a low coefficient of determination but high significance implies that a predictor still makes a noticeable contribution to explaining the variation in the dependent variable.

5. Conclusions

This research revealed differences in the dielectric, physical, and anatomical properties of fast-growing teak trees of various ages. Variations in physical and anatomical properties were found to be influenced by the tree growth rate, whereas the differing dielectric properties can be attributed to internal factors such as MC, density, and extractive substances, as well as external factors such as environmental temperature.
The regression model constructed using the frequency variables Z, R, C, and MC exhibited a strong correlation with SG, with an accuracy of r = 0.826. Furthermore, a moderate correlation was observed between these variables and GD, with an accuracy of r = 0.403. While the other variables showed relatively weak correlations with DS, some relationships were significant at levels below 0.05, particularly VD and FWT. This suggests that certain variables still make appreciable contributions to each other. However, the variables did not demonstrate a satisfactory relationship with the other anatomical properties.
In this study, analyses using model predictions were conducted at high frequencies, based on visual observations seen in graphs and data rows in Excel. However, a detailed analysis of the differences in polarity due to the moisture content and other factors was not performed. Therefore, further analysis across all frequency ranges using ML is required to comprehensively understand the electrical behavior of trees.
Overall, the use of other NDT tools, such as tree tomography, is not yet sufficient to comprehensively predict wood quality. Hence, reinforcement with a combination of dielectric spectroscopy is necessary to understand tree behavior based on dielectric responses to transmitted electric fields. However, additional research is needed to better understand the correlation between dielectric properties and wood or tree behavior, unveiling the factors influencing these properties and their potential applications in various fields related to wood and forestry.

Author Contributions

Conceptualization, D.A.A., L.K., I.Z.S., R.D. and W.P.T.; methodology, D.A.A., L.K., W.P.T. and R.; software, D.A.A., H.N. and R.; validation, D.A.A., H.N. and R.; formal analysis, D.A.A., H.N. and R.; investigation, D.A.A.; data curation, D.A.A., H.N. and R.; writing—original draft preparation, D.A.A.; writing—review and editing, L.K., I.Z.S., R.D. and W.P.T.; visualization, D.A.A.; supervision, L.K., I.Z.S., R.D. and W.P.T. All authors have read and agreed to the published version of the manuscript.

Funding

This research was funded by the Indonesia Ministry of Education, Culture, Research, and Technology (KEMENDIKBUDRISTEK), and IPB University supported this research through the Doctoral Dissertation Research Grant, FY 2023 (grant numbers: 1881/IT3.D10/PT.01.03/P/B/2023 and 102/E5/PG.02.00.PL/2023).

Data Availability Statement

The authors confirm that the data underlying this research are included in the article. The raw data that support the results are available upon reasonable request from the corresponding authors.

Acknowledgments

The authors are grateful to Perum Perhutani for their assistance and providing samples for this project and to Ulfa Adzkia for their valuable contribution to project administration. Furthermore, the authors are grateful to the BRIN Team for the assistance rendered with the field and laboratory work.

Conflicts of Interest

The authors declare no conflicts of interest. The funders had no role in the design of the study; in the collection, analyses, or interpretation of the data; in the writing of the manuscript; or in the decision to publish the results.

References

  1. Corryanti; Muharyani, N. The opportunities and challenges of Jati plus Perhutani. Wood Res. J. 2018, 9, 1–3. [Google Scholar] [CrossRef]
  2. Rizanti, D.E.; Darmawan, W.; George, B.; Merlin, A.; Dumarcay, S.; Chapuis, H.; Gérardin, C.; Gelhaye, E.; Raharivelomanana, P.; Sari, R.K.; et al. Comparison of teak wood properties according to forest management: Short versus long rotation. Ann. For. Sci. 2018, 75, 39. [Google Scholar] [CrossRef]
  3. Riantin, N.V.; Wahyudi, I.; Priadi, T. Anatomical structure and physical properties of the 13 years old solomon-clone teakwood planted in Bogor, Indonesia. IOP Conf. Ser. Mater. Sci. Eng. 2020, 935, 012040. [Google Scholar] [CrossRef]
  4. Adi, D.S.; Himmi, S.K.; Sudarmanto; Amin, Y.; Darmawan, T.; Dwianto, W. Radial variation of wood properties of eight years-old fast-growing teak (Tectona grandis—Platinum teak wood). IOP Conf. Ser. Earth Environ. Sci. 2020, 591, 012035. [Google Scholar] [CrossRef]
  5. Basri, E.; Wahyudi, I. Wood basic properties of Jati plus Perhutani from different ages and their relationships to drying properties and qualities. J. Penelit. Has. Hutan 2013, 31, 93–102. [Google Scholar] [CrossRef]
  6. Hidayati, F.; Sulistyo, J.; Lukmandaru, G.; Listyanto, T.; Praptoyo, H.; Pujiarti, R. Physical and mechanical properties of 10-year-old superior and conventional teak planted in Randublatung Central Java Indonesia. J. Ilmu Teknol. Kayu Trop. 2015, 13, 11–21. [Google Scholar]
  7. Listyanto, T.; Yudhana, F.; Putera, H.P.; Purwanta, S.; Lukmandaru, G.; Sulistyo, J.; Marsoem, S.N. Physical properties and natural durability of fast-growing teak at 12 years-old against subterranean and drywood termites. In Proceedings of the 9th International Symposium of Indonesia Wood Research Society (IWoRS), Bali, Indonesia, 26–29 September 2017; pp. 144–152. [Google Scholar]
  8. Nicolotti, G.; Socco, L.V.; Martinis, R.; Godio, A.; Sambuelli, L. Application and comparison of three tomographic techiques for detection decay in trees. J. Arboric. 2003, 29, 66–78. [Google Scholar]
  9. Wang, H.; Liu, Y.; Wei, Y.; Wu, C.K.; Zhu, H.; Tsang, K.F. NB-IoT based tree health monitoring system. In Proceedings of the 2019 IEEE International Conference on Industrial Technology (ICIT), Melbourne, VIC, Australia, 13–15 February 2019; pp. 1796–1799. [Google Scholar]
  10. Karlinasari, L.; Adzkia, U.; Puspitasari, T.; Nandika, D.; Nugroho, N.; Syafitri, U.D.; Siregar, I.Z. Tree morphometric relationships and dynamic elasticity properties in tropical rain tree (Samanea saman Jacq. Merr). Forests 2021, 12, 1711. [Google Scholar] [CrossRef]
  11. Martiansyah, I.; Zulkarnaen, R.N.; Hariri, M.R.; Hutabarat, P.W.K.; Wardani, F.F. Tree health monitoring of risky trees in the hotel open space: A case study in Rancamaya, Bogor. J. Sylva Lestari 2022, 10, 180–201. [Google Scholar] [CrossRef]
  12. Meng, X.; Zheng, Y.; Liu, W. Development of non-destructive testing device for plant leaf expansion monitoring. Electronics 2023, 12, 249. [Google Scholar] [CrossRef]
  13. Wu, Y.; Yang, Z.; Liu, Y. A non-destructive measurement of trunk moisture content in living trees based on multi-sensory data fusion. Appl. Sci. 2023, 13, 6990. [Google Scholar] [CrossRef]
  14. Du Toit, F.; Coops, N.C.; Ratcliffe, B.; El-Kassaby, Y.A.; Lucieer, A. Modelling internal tree attributes for breeding in applications in douglas-fir progeny trials using RPAS-ALS. Sci. Remote Sens. 2023, 7, 100072. [Google Scholar] [CrossRef]
  15. Karlinasari, L.; Danu, M.I.; Nandika, D.; Turjaman, M. Drilling resistance method to evacuate density and hardness properties of resinous wood of agarwood (Aquilaria malaccensis). Wood Res. 2017, 62, 683–690. [Google Scholar]
  16. Esofita, M.; Djamal, M.; Taruno, W.P.; Al Huda, M.; Baidillah, M.; Pari, G.; Damayanti, R. Analysis of wood’s capacitance characteristic to its hardness. Appl. Mech. Mater. 2015, 771, 161–164. [Google Scholar] [CrossRef]
  17. Oktapiani, C.; Damayanti, R.; Karlinasari, L.; Agustiningrum, D.A.; Pari, R.; Djarwanto; Rahmanto, R.G.H.; Sofianto, I.A.; Dewi, L.M. The effect of anatomical structure on hygroscopicity of four wood species. In Proceedings of the 14th International Symposium of IWoRS, Jatinangor, Bandung, Indonesia, 3–4 August 2022. [Google Scholar]
  18. Fridh, L.; Eliasson, L.; Bergström, D. Precision and accuracy in moisture content determination of wood fuel chips using a handheld electric capacitance moisture meter. Silva Fenn. 2018, 52, 6993. [Google Scholar] [CrossRef]
  19. Lev, J.; Křepčík, V.; Šarauskis, E.; Kumhála, F. Electrical capacitance characteristics of wood chips at low frequency ranges: A cheap tool for quality assessment. Sensors 2021, 21, 3494. [Google Scholar] [CrossRef] [PubMed]
  20. Mačiulaitis, R.; Jefimovas, A.; Lipinskas, D. Research on the electrical capacitance and electrical conductivity of char resulting from natural and treated wood. J. Civ. Eng. Manag. 2014, 21, 11–20. [Google Scholar] [CrossRef]
  21. Dietsch, P.; Franke, S.; Franke, B.; Gamper, A.; Winter, S. Methods to determine wood moisture content and their applicability in monitoring concepts. J. Civ. Struct. Health Monit. 2014, 5, 115–127. [Google Scholar] [CrossRef]
  22. Husein, I.; Sadiyo, S.; Nugroho, N.; Wahyudi, I.; Agustina, A.; Komariah, R.N.; Khabibi, J.; Purba, C.Y.C.; Ali, D.; Iftor, M.; et al. Electrical properties of indonesian hardwood case study: Acacia mangium, Swietenia macrophylla and Maesopsis eminii. Wood Res. 2014, 59, 695–704. [Google Scholar]
  23. Jamayani, E.; Rahman, M.R.; Hamdan, S.; Kyari, M.I.; Bakri, M.K.B.; Sanaullah, K.; Khan, A. Dielectric properties of natural borneo woods: Keranji, kayu malam, and kumpang. BioResources 2020, 15, 7815–7827. [Google Scholar] [CrossRef]
  24. El-Hadad, A.; Brodie, G.; Ahmed, B. The effect of wood condition on sound wave propagation. Open J. Acoust. 2018, 8, 37–51. [Google Scholar] [CrossRef]
  25. Venkatesh, M.S.; Raghavan, G.S.V. An overview of microwave processing and dielectric properties of agri-food materials. Biosys. Eng. 2004, 88, 1–18. [Google Scholar] [CrossRef]
  26. Skierucha, W.; Wilczek, A.; Szypłowska, A. Dielectric spectroscopy in agrophysics. Int. Agrophys. 2012, 26, 187–197. [Google Scholar] [CrossRef]
  27. Khaled, D.E.; Castellano, N.N.; Gázquez, J.A.; Perea-Moreno, A.-J.; Manzano-Agugliaro, F. Dielectric spectroscopy in biomaterials: Agrophysics. Materials 2016, 3, 310. [Google Scholar] [CrossRef] [PubMed]
  28. Deshmukh, K.; Sankaran, S.; Ahamed, B.; Sadasivuni, K.K.; Pasha, K.S.K.; Ponnama, D.; Sreekanth, P.S.R.; Chidambaram, K. Dielectric spectroscopy. In Spectroscopic Methods for Nanomaterials Characterization; Elsevier: Amsterdam, The Netherlands, 2017; pp. 237–299. [Google Scholar]
  29. Leitzke, J.P.; Zangl, H. A review on electrical impedance tomography spectroscopy. Sensors 2020, 20, 5160. [Google Scholar] [CrossRef]
  30. Nogales, R.E.; Benalcázar, M.E. Analysis and evaluation of feature selection and feature extraction methods. Int. J. Comput. Intell. Syst. 2023, 16, 153. [Google Scholar] [CrossRef]
  31. Abellan-Nebot, J.V.; Subirón, F.R. A review of machining monitoring systems based on artificial intelligence process models. Int. J. Adv. Manuf. Technol. 2010, 47, 237–257. [Google Scholar] [CrossRef]
  32. Blokland, J.; Nasir, V.; Cool, J.; Avramidis, S.; Adamopoulos, S. Machine learning-based prediction of surface checks and bending properties in weathered thermally modified timber. Constr. Build. Mater. 2021, 307, 124996. [Google Scholar] [CrossRef]
  33. Sun, P. Wood quality defect detection based on deep learning and multicriteria framework. Math. Probl. Eng. 2022, 2022, 4878090. [Google Scholar] [CrossRef]
  34. EN 14774-1:2009; Solid Biofuels—Determination of Moisture Content—Oven Dry Method—Part 1: Total Moisture—Reference Method. Swedish Standards Institute: Stockholm, Sweden, 2009. Available online: https://www.sis.se/api/document/preview/71672/ (accessed on 5 September 2023).
  35. Shmulsky, R.; Jones, P.D. Forest Products and Wood Science: An Introduction, 6th ed.; John Wiley & Sons, Inc.: Hoboken, NJ, USA, 2019; pp. 154–196. [Google Scholar]
  36. Wheleer, E.A.; Baas, P.; Gasson, P.C. IAWA List of Microscopic Features for Hardwood Identification; IAWA Bulletin: Leiden, The Netherlands, 1990. [Google Scholar]
  37. Ellingson, S.W. Electromagnetics I: Virginia Tech: LibreTexts. Available online: https://phys.libretexts.org/Bookshelves/Electricity_and_Magnetism/Electromagnetics_I_(Ellingson) (accessed on 15 December 2023).
  38. Simpson, W.T. Specific Gravity, Moisture Content, and Density Relationship for Wood; General Technical Report FPL-GTR-76; U.S. Department of Agriculture, Forest Service, Forest Products Laboratory: Madison, WI, USA, 1993; pp. 1–13. [Google Scholar]
  39. Simanjuntak, T. Measurement of Dielectric Properties Values of Pepper (Piper nigrum L.) and Andaliman (Zanthoxylum acanthopodium DC.) in the Radio Frequency Range. Master’s Thesis, IPB University, Bogor, Indonesia, 2002. [Google Scholar]
  40. Tiitta, M.; Kainulainen, P.; Harju, A.M.; Venäläinen, M.; Manninen, A.-M.; Vuorinen, M.; Viitanen, H. Comparing the effect of chemical and physical properties on complex electrical impedance of scots pine wood. Holzforschung 2003, 57, 433–439. [Google Scholar] [CrossRef]
Figure 1. Research map location of fast-growing teak tree sample observation.
Forests 15 00669 g001
Figure 2. Setup testing of wood capacitance measurement system: (a) placement of the sensor and testing processing; (b) sensor covering the tree trunk.
Forests 15 00669 g002
Figure 3. Distribution of dielectric values at frequency ranges of 250 kHz–60 MHz: (a) impedance, (b) resistance, and (c) capacitance.
Forests 15 00669 g003aForests 15 00669 g003b
Figure 4. Relationship between SG and MC: (a) teak, 4 years; (b) teak, 5 years; (c) teak, 7 years; (d) total teak at all ages.
Forests 15 00669 g004
Figure 5. Microscopic feature measurement method for the maceration sample: (a) fiber and (b) vessel.
Forests 15 00669 g005
Figure 6. Microscopic sections (magnified 20×) of fast-growing teak core samples, each consisting of cross-, radial, and tangential sections in teak, 4 years, for (ac); teak, 5 years for (df); and teak, 7 years for (gi).
Forests 15 00669 g006
Table 1. Information about the teak trees observed in this study includes planting year, tree age, plot number, plot name, forest management resort (RPH), district location, and coordinates.
Year of PlantingTree AgeRPHPlot NumberPlot NameVillageCoordinates
20194 yearsJagabaya43A-2Plot 19-A
Plot 19-B
Plot 19-C
JagabayaLat. 6°23′8.95″ S–6°23′18.27″ S
Long. 106°31′20.03″ E–106°31′27.10″ E
20185 yearsMaribaya31A-1Plot 18-A
Plot 18-B
Plot 18-C
BarengkokLat. 6°25′49.82″ S–6°28′58.28″ S
Long. 106°28′52.53″ E–106°29′7.46″ E
20167 yearsMaribaya23B-1Plot 16-A
Plot 16-B
Plot 16-C
BarengkokLat. 6°25′53.61″ S–6°25′54.91″ S
Long. 106°28′52.53″ E–106°29′8.66″ E
Table 2. The characteristics of the dielectric value for each tree age were determined based on the frequency exhibiting the peak value.
Tree AgeFrequency Containing Peak
ZRC
4 years23 MHz23 MHz20 MHz
5 years21 MHz21 MHz19 MHz
7 years18 MHz18 MHz18 MHz
Note: Z = impedance, R = resistance, C = capacitance.
Table 3. Information on tree age and mean data of DBH and physical properties analysis from the core sample.
Tree AgeDBH (cm)MC (%)GD (gr/cm3)SG
4 years12.463132.908 a1.078 a0.465 a
5 years13.953133.881 a1.084 a0.465 a
7 years21.317138.360 a1.134 a0.479 a
Note: DBH = diameter breast height; MC = moisture content; GD = green density of wood; SG = specific gravity; letter in same column denotes no significant difference at α = 0.05.
Table 4. Mean data of anatomical property dimension measurements.
Tree AgeFLFDLDFWTVLVD
4 years1329.38 a24.69 a11.49 a5.41 a287.12 a161.22 a
5 years1270.24 ab24.00 a12.52 a5.93 b289.27 a178.54 a
7 years1483.18 b23.16 a11.14 b6.04 b291.05 a168.89 a
Note: FL = fiber length; FD = fiber diameter; LD = lumen diameter; FWT = fiber wall thickness; VD = vessel diameter; VL = vessel length; letter in same column denotes no significant difference at α = 0.05.
Table 5. Model prediction for each dependent variable according to independent variables as factors.
VariableModelrr2Adj. r2F-RatioSig.
GDGD = 0.997 + 0.001 MC + 0.021 Z23M − 0.044 C20M0.4030.1620.11512.5960.000
SGSG = 0.696 − 0.002 MC − 0.06 Z21M + 0.010 Z23M − 0.006 R23M − 0.019 C20M0.8260.6820.67694.3340.000
FLFL = 1220.419 + 0.419 MC − 56.750 Z21M + 128.039 R18M − 80.542 C18M − 0.019 C19M 0.1570.0250.0061.3280.253
FDFD = 27.021 − 0.027 MC + 1.752 Z23M − 1.197 R21M − 1.064 C18M − 1.095 C19M0.1630.0270.0051.1740.320
LDLD = 12.214 − 0.013 MC + 1.154 Z18M − 1.493 R21M + 2.663 R23M + 1.156 C19M0.1780.0320.0151.7970.130
FWTFWT = 7.019 − 0.007 MC − 0.564 Z18M + 0.744 Z21M + 1.071 R18M − 1.408 C18M − 0.957 C19M0.2090.0440.0222.0090.065
VDVD = 139.843 + 37.449 MC + 37.768 Z21M − 55.786 Z23M + 55.505 R21M + 44.834 R23M0.2170.0470.0292.6040.026
VLVL = 337.448 − 0.290 MC − 53.424 Z18M + 54.630 C18M + 22.411 C19M − 34.574 C20M0.1750.0310.0121.6720.142
Notes: GD = green density of wood; SG = specific gravity; FL = fiber length; FD = fiber diameter; LD = lumen diameter; FWT = fiber wall thickness; VD = vessel diameter; VL = vessel length; MC = moisture content; Z18M = Z at frequency 18 MHz; Z21M = Z at frequency 21 MHz; Z23M = Z at frequency 23 MHz; R18M = R at frequency 18 MHz; R21M = R at frequency 21 MHz; R23M = R at frequency 23 MHz; C18M = C at frequency 18 MHz; C19M = C at frequency 19 MHz; C20M = C at frequency 20 MHz; r = coefficient of correlation; r2 = coefficient of determination; Adj. r2 = adjusted coefficient of determination.
Disclaimer/Publisher’s Note: The statements, opinions and data contained in all publications are solely those of the individual author(s) and contributor(s) and not of MDPI and/or the editor(s). MDPI and/or the editor(s) disclaim responsibility for any injury to people or property resulting from any ideas, methods, instructions or products referred to in the content.

