Article

The Spatiotemporal Variation Characteristics and Influencing Factors of Green Vegetation in China

1
Institute of Human Settlements in Southern Xinjiang, Tarim University, Alaer 843300, China
2
College of Civil Engineering and Architecture, Zhejiang University, Hangzhou 310058, China
3
Faculty of Innovation and Design, City University of Macau, Macau 999078, China
4
College of Urban, Rural Planning and Architectural Engineering, Shangluo University, Shangluo 726000, China
*
Author to whom correspondence should be addressed.
Forests 2024, 15(4), 668; https://doi.org/10.3390/f15040668
Submission received: 6 March 2024 / Revised: 1 April 2024 / Accepted: 4 April 2024 / Published: 7 April 2024
(This article belongs to the Special Issue Application of Remote Sensing in Vegetation Dynamic and Ecology)

Abstract

:
Green vegetation is one of the main objects of ecological environment restoration and protection, objectively reflecting the quality of regional ecological environments. Studying its spatial distribution characteristics is of great significance to the formulation of ecological environment restoration policies. Based on data on urban green vegetation in China from 2000 to 2022, this study attempts to analyze the destruction and protection patterns of urban green vegetation in China from the perspectives of total changes in green vegetation contraction and growth and spatial evolution characteristics and trends, and it explores the driving factors affecting the change in green vegetation area. The results show the following: (1) Green vegetation growth and contraction occurred alternately in China from 2000 to 2022. Vegetation contraction showed a “point–line–plane” evolution pattern, forming a contraction stage of point-like aggregation, linear series, and planar spread. Vegetation growth has always presented a frontal pattern. (2) The growth and contraction of green vegetation in China showed a north–south differentiation phenomenon. The vegetation contraction phenomenon spread in the Central Plains urban agglomeration and its surrounding areas and showed an expanding trend. The growth trend is obviously moving northward, mainly concentrated in Inner Mongolia, Ningxia, Gansu, Xinjiang, and other northern provinces, which also coincides with the key ecological restoration policies in northern China in recent years. (3) City scale, economic level, population scale, agro-industrial structure, and water resources content have significant effects on the spatial distribution of green vegetation.

1. Introduction

The impact of China’s rapid urbanization on vegetation growth cannot be ignored, and the dynamic change in vegetation also reflects the process of urbanization [1]. Since the mid-20th century, with the acceleration of China’s industrialization and urbanization, China’s vegetation area has decreased, and a large amount of natural land cover has been transformed into urban construction land and agricultural land, bringing about a series of ecological problems [2]. At the end of the 20th century, the implementation of the national regional development and ecological protection project improved China’s vegetation coverage [3]. In China, policy regulation and economic driving forces are still important factors affecting the dynamic change in vegetation [4]. Large-scale urban expansion and industrial construction have also led to vegetation degradation [5]. Vegetation degradation has led to a series of ecological and environmental problems, such as desertification, air pollution, greenhouse effects, and groundwater level reduction [6]. The characteristics of the dynamic change in China’s vegetation and its influencing mechanisms have become urgent problems to be explored [7]. This study is also of great significance for China in adjusting ecological protection measures and promoting the harmonious development of natural ecosystems and social economy.
Vegetation is the natural link between soil, atmosphere, and water, and it acts as an “indicator” of global change through the carbon cycle [8]. Vegetation plays an irreplaceable role in the terrestrial ecosystem. The coverage status is an important evaluation index that can be used to analyze environment quantity and the status of ecosystem balance in a region. The normalized difference vegetation index (NDVI) is the best indicator for evaluating the vegetation cover and ecological environment of the whole world or separate regions [9,10]. The NDVI is an effective indicator of vegetation cover and growth conditions, which has been widely used for monitoring large-scale vegetation change [11]. It is the ratio parameter of the near-infrared band and the infrared band (red) in a remote sensing image [12]. It can reflect the changes in vegetation cover, biomass, and ecosystem parameters well [13] and is often used to study changes in vegetation cover, which also directly reflects the evolution of an ecological environment, thus representing the whole state of the ecosystem to a great extent. The growth and contraction of vegetation areas may greatly affect the balance of regional ecological environments [14]. Due to being affected by climate change in recent decades, the stability of the vegetation ecosystem in China has weakened, especially in the ecologically fragile areas such as the northwest desert steppe area and southwest karst area; here, there are ecological problems such as frequent natural disasters, desert degradation, and accelerated soil erosion, which seriously affect regional ecological sustainable development [15]. Therefore, it is very important to study the spatial and temporal variation characteristics of green vegetation and its influencing factors for the sustainable development of urban ecological environments in China.
Once the NDVI was put forward, many researchers studied it and obtained rich results and conclusions. Tucker (1985) studied vegetation along African roads using NOAA/AVHRR data monitoring [16]. Tucker (1991) studied vegetation in the Sahel area and used the annual average value of the NDVI and its coefficient of variation to monitor dynamic changes in vegetation [17]. Yang took meteorological factors as research objects in a study of North American grassland vegetation and used the NDVI to study the relationship between seasons and meteorological factors [18]. Weiss studied vegetation growth conditions under different climatic growth environments in semi-arid areas in New Mexico. The research results show that there is a certain positive correlation between the best climatic environment for plant growth and the NDVI [19]. Song compared the GIMSS-NDVI and SPOT VEGETATION-NDVI and found that there is a linear relationship between them [20]. Jin used MODIS-NDVI data to study the relationship between vegetation growth and precipitation, groundwater level, and relative humidity in the Hailiutu River Basin [21]. Tong used the Sen + Mann–Kendall method and the Hurst index monitoring method to study the dynamic change characteristics of vegetation in the Mongolia Plateau over the past 30 years [22]. Beatrice Monteleone used vulnerability curves applied to vegetation growth to predict the correlation between boundaries and vulnerability curves to assess the range of variation in wheat response to water deficit [23]. Ehsan Moradi began to analyze the vulnerability of vegetation to hydro-meteorological pressure in water-scarce areas using machine learning and remote sensing technology [24] and further proposed modern research methods for NDVI data. In conclusion, the NDVI has been used in most studies to explore vegetation change characteristics in local areas in detail.
In recent years, by using NDVI data analysis, a large number of scholars also found that China’s vegetation has changed significantly [7,15]. The change in urban vegetation coverage is related to the present climate conditions, such as urban temperature, wind speed, and precipitation [6,7]. Temperature increase had a positive effect on vegetation growth in the southeast and middle parts of the Loess Plateau, while vegetation growth in the northwest showed an opposite trend [25]. A lot of research has been carried out to elucidate the response of vegetation to climate change [26]. However, most of the studies focus on ecologically fragile areas such as the Loess Plateau, Qinghai–Tibet Plateau, Yangtze River Basin, and rapidly urbanized areas such as Beijing, Tianjin, and Hebei [27,28]. The above studies reveal the characteristics of vegetation change and its driving factors on a regional scale, which is of great value to regional ecological protection. However, it is still necessary to explore the spatial differentiation characteristics of vegetation persistence and fluctuation processes at the national scale [29]. At the same time, most studies focus on the effects of precipitation and temperature on vegetation change and identify the effects of human activities through changes in vegetation area [30,31,32]. Few studies have explored the law of urban vegetation change from the perspective of China’s urbanization; further exploration of vegetation change from the perspective of China’s rapid urbanization still needs to be promoted.
At present, in the process of urbanization in China, the planning and management of urban vegetation in China has been paid more and more attention by the state, and its importance has become increasingly prominent [33]. With the acceleration of urbanization, the distribution and morphology of urban vegetation have become more complex and diverse, and it is more and more difficult to accurately evaluate urban vegetation changes using coarse-resolution remote sensing data [34]. In view of the above deficiencies, we do not have a clear understanding of the spatiotemporal change pattern of urban vegetation in China, which leads to the divergence of understanding of the impact of urbanization on the change in vegetation cover [35]. On the one hand, rapid urban expansion has led to dramatic changes in land use, which may have adverse effects on local ecosystems, mainly in the form of significant reductions in urban vegetation and water areas, especially in the rapid industrialization phase of urbanization [36]. On the other hand, many studies have also reported the benefits of urbanization. From 2000 to 2018, 70.72% of China’s 20 cities showed significant improvements in vegetation growth, indicating that green space construction in China’s cities has developed simultaneously with the rapid development of urbanization [37,38]. These results indicate that the relationship between urban development and urban vegetation coverage is still unclear, and further analysis of the relationship between urban vegetation spatial and temporal distribution patterns and urban development and construction is needed [39].
Based on this, we first analyze the spatial differentiation characteristics of the vegetation NDVI in China from 2000 to 2022 at the national scale by using the spatial visualization function and statistical analysis method of ArcGIS 10.2 (Redlands, California, United States) and SPSS 19.0 (Armonk, New York, United States); we explore the relationship between urban vegetation cover change and urban open construction. Then, we discuss the relationship between vegetation change and urban population, economy, industry, and water resources in China. Finally, we put forward ecological protection strategies against the background of new urbanization construction, aiming to provide a theoretical basis for the implementation of ecological restoration projects and ecological civilization construction in the future.
The purpose of this study is mainly three-fold. Firstly, we summarize the spatial variation characteristics of green vegetation in China from 2000 to 2022 and provide experience for local governments to formulate urban development plans in the future. Secondly, we analyze the growth and contraction trend of green vegetation in China, which also provides direction for the Chinese government to control vegetation destruction in the future. Finally, we construct an explanation model of vegetation change influenced by urban development and construction-related indicators. Local governments can directly regulate the relevant impact indicators to achieve the goal of green vegetation restoration. Of course, these vegetation restoration experiences can also be used for reference by developing countries of the same type.

2. Methods and Materials

2.1. Research Methods

2.1.1. Vegetation Growth and Contraction Index

The vegetation growth and contraction index is used to characterize the growth and contraction level of the vegetation cover area by calculating the annual average growth rate of the NDVI at two time points [40,41]. The calculation formula is
Q = S i + j S i S i × 100 %
In this formula, Q is the vegetation growth and contraction index of the study area. S i + j and S i represent the NDVI at two time points. j is the length of the study period. When Q is less than 0, it indicates that the green vegetation in the study area is contracting during the study period. The smaller the Q value, the stronger the vegetation contraction intensity and the more serious the vegetation destruction in the study area. When Q is greater than 0, it indicates that the green vegetation in the study area has increased during this period. The larger the Q value, the stronger the vegetation growth intensity in the study area, meaning the vegetation is recovering rapidly.

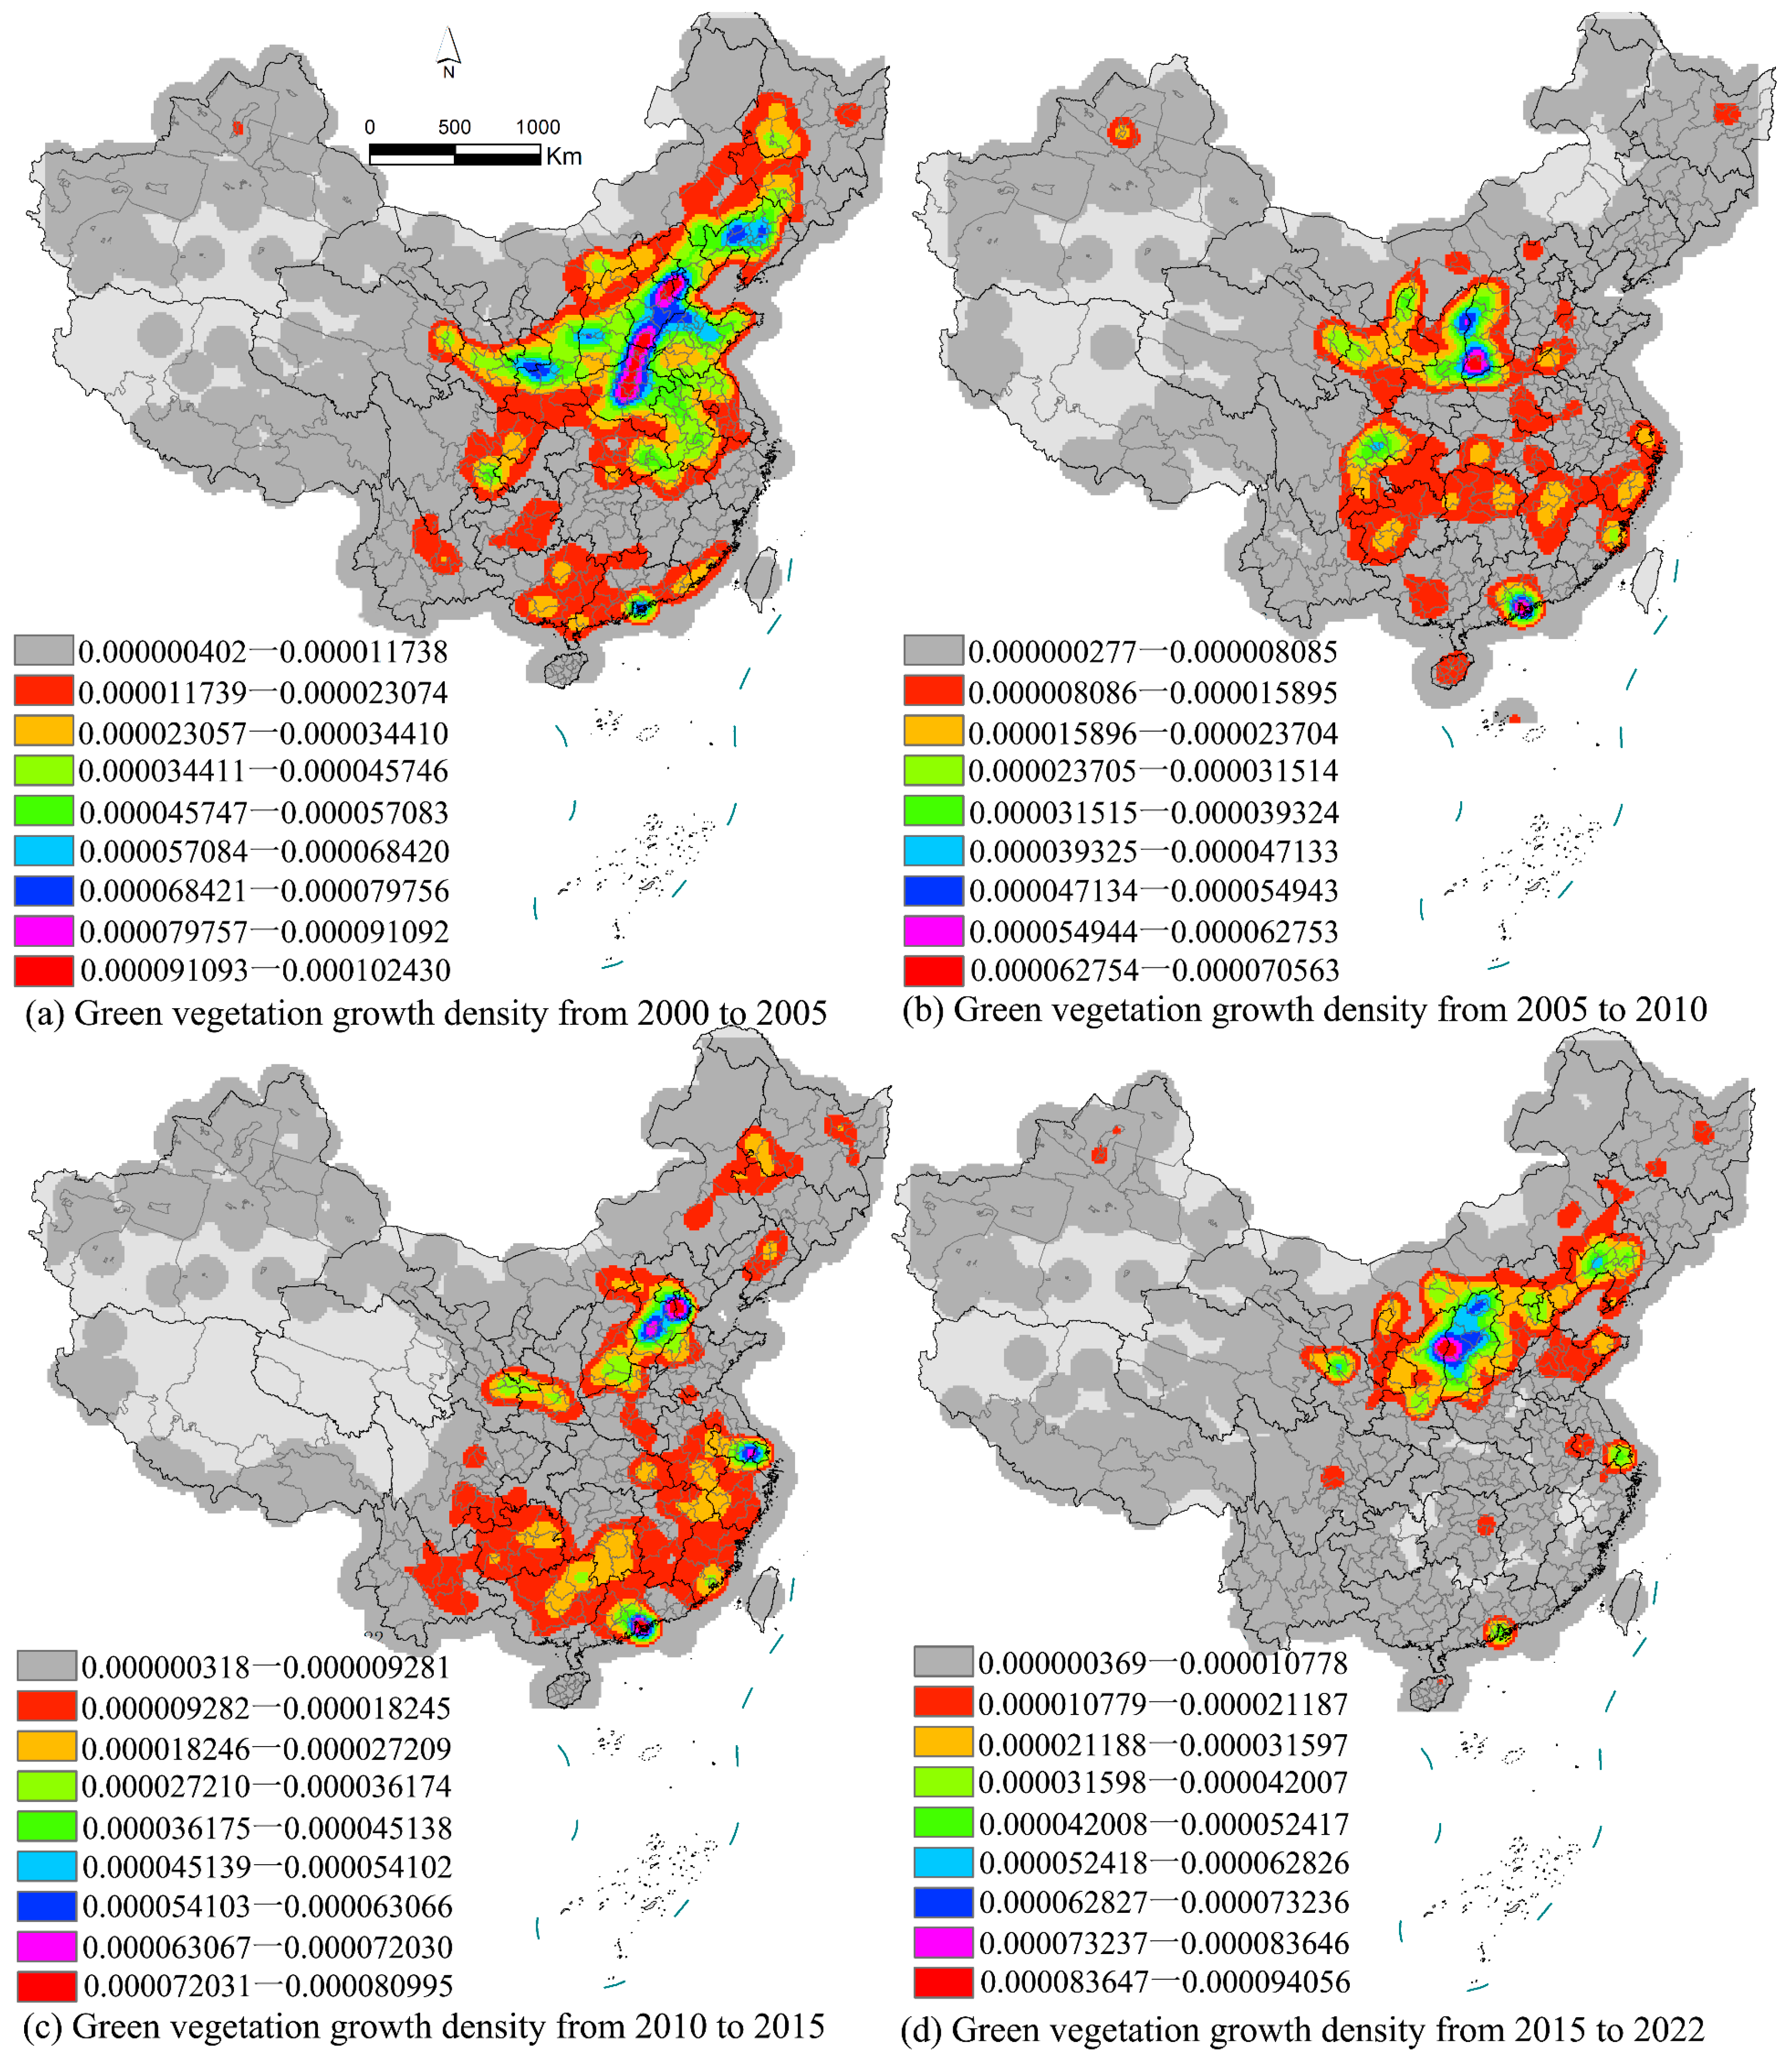
2.1.2. Vegetation Change Nuclear Density

Nuclear density is often used to calculate the distribution density of the study object within the study unit [42]. We used the kernel density to calculate the density distribution of the vegetation area in each city, and the results form a continuous kernel density plane. This study helps us to characterize the spatial distribution of urban vegetation growth and contraction in China from a quantitative perspective. The lower the nuclear density value, the less significant the increase or contraction in the green vegetation area, and vice versa [43]. The nuclear density expression is
λ ^ r P = n = 1 m 3 π r 4 1 q q n 2 m 2 2
where P represents the object for which the density needs to be calculated, and m is the total number of study sites. λ ^ h ( P ) represents the calculated value of the urban vegetation density, q is the center of the circle, r is the radius, and q n is the position of the nth object that falls within the circle with q as the circle and r as the radius.

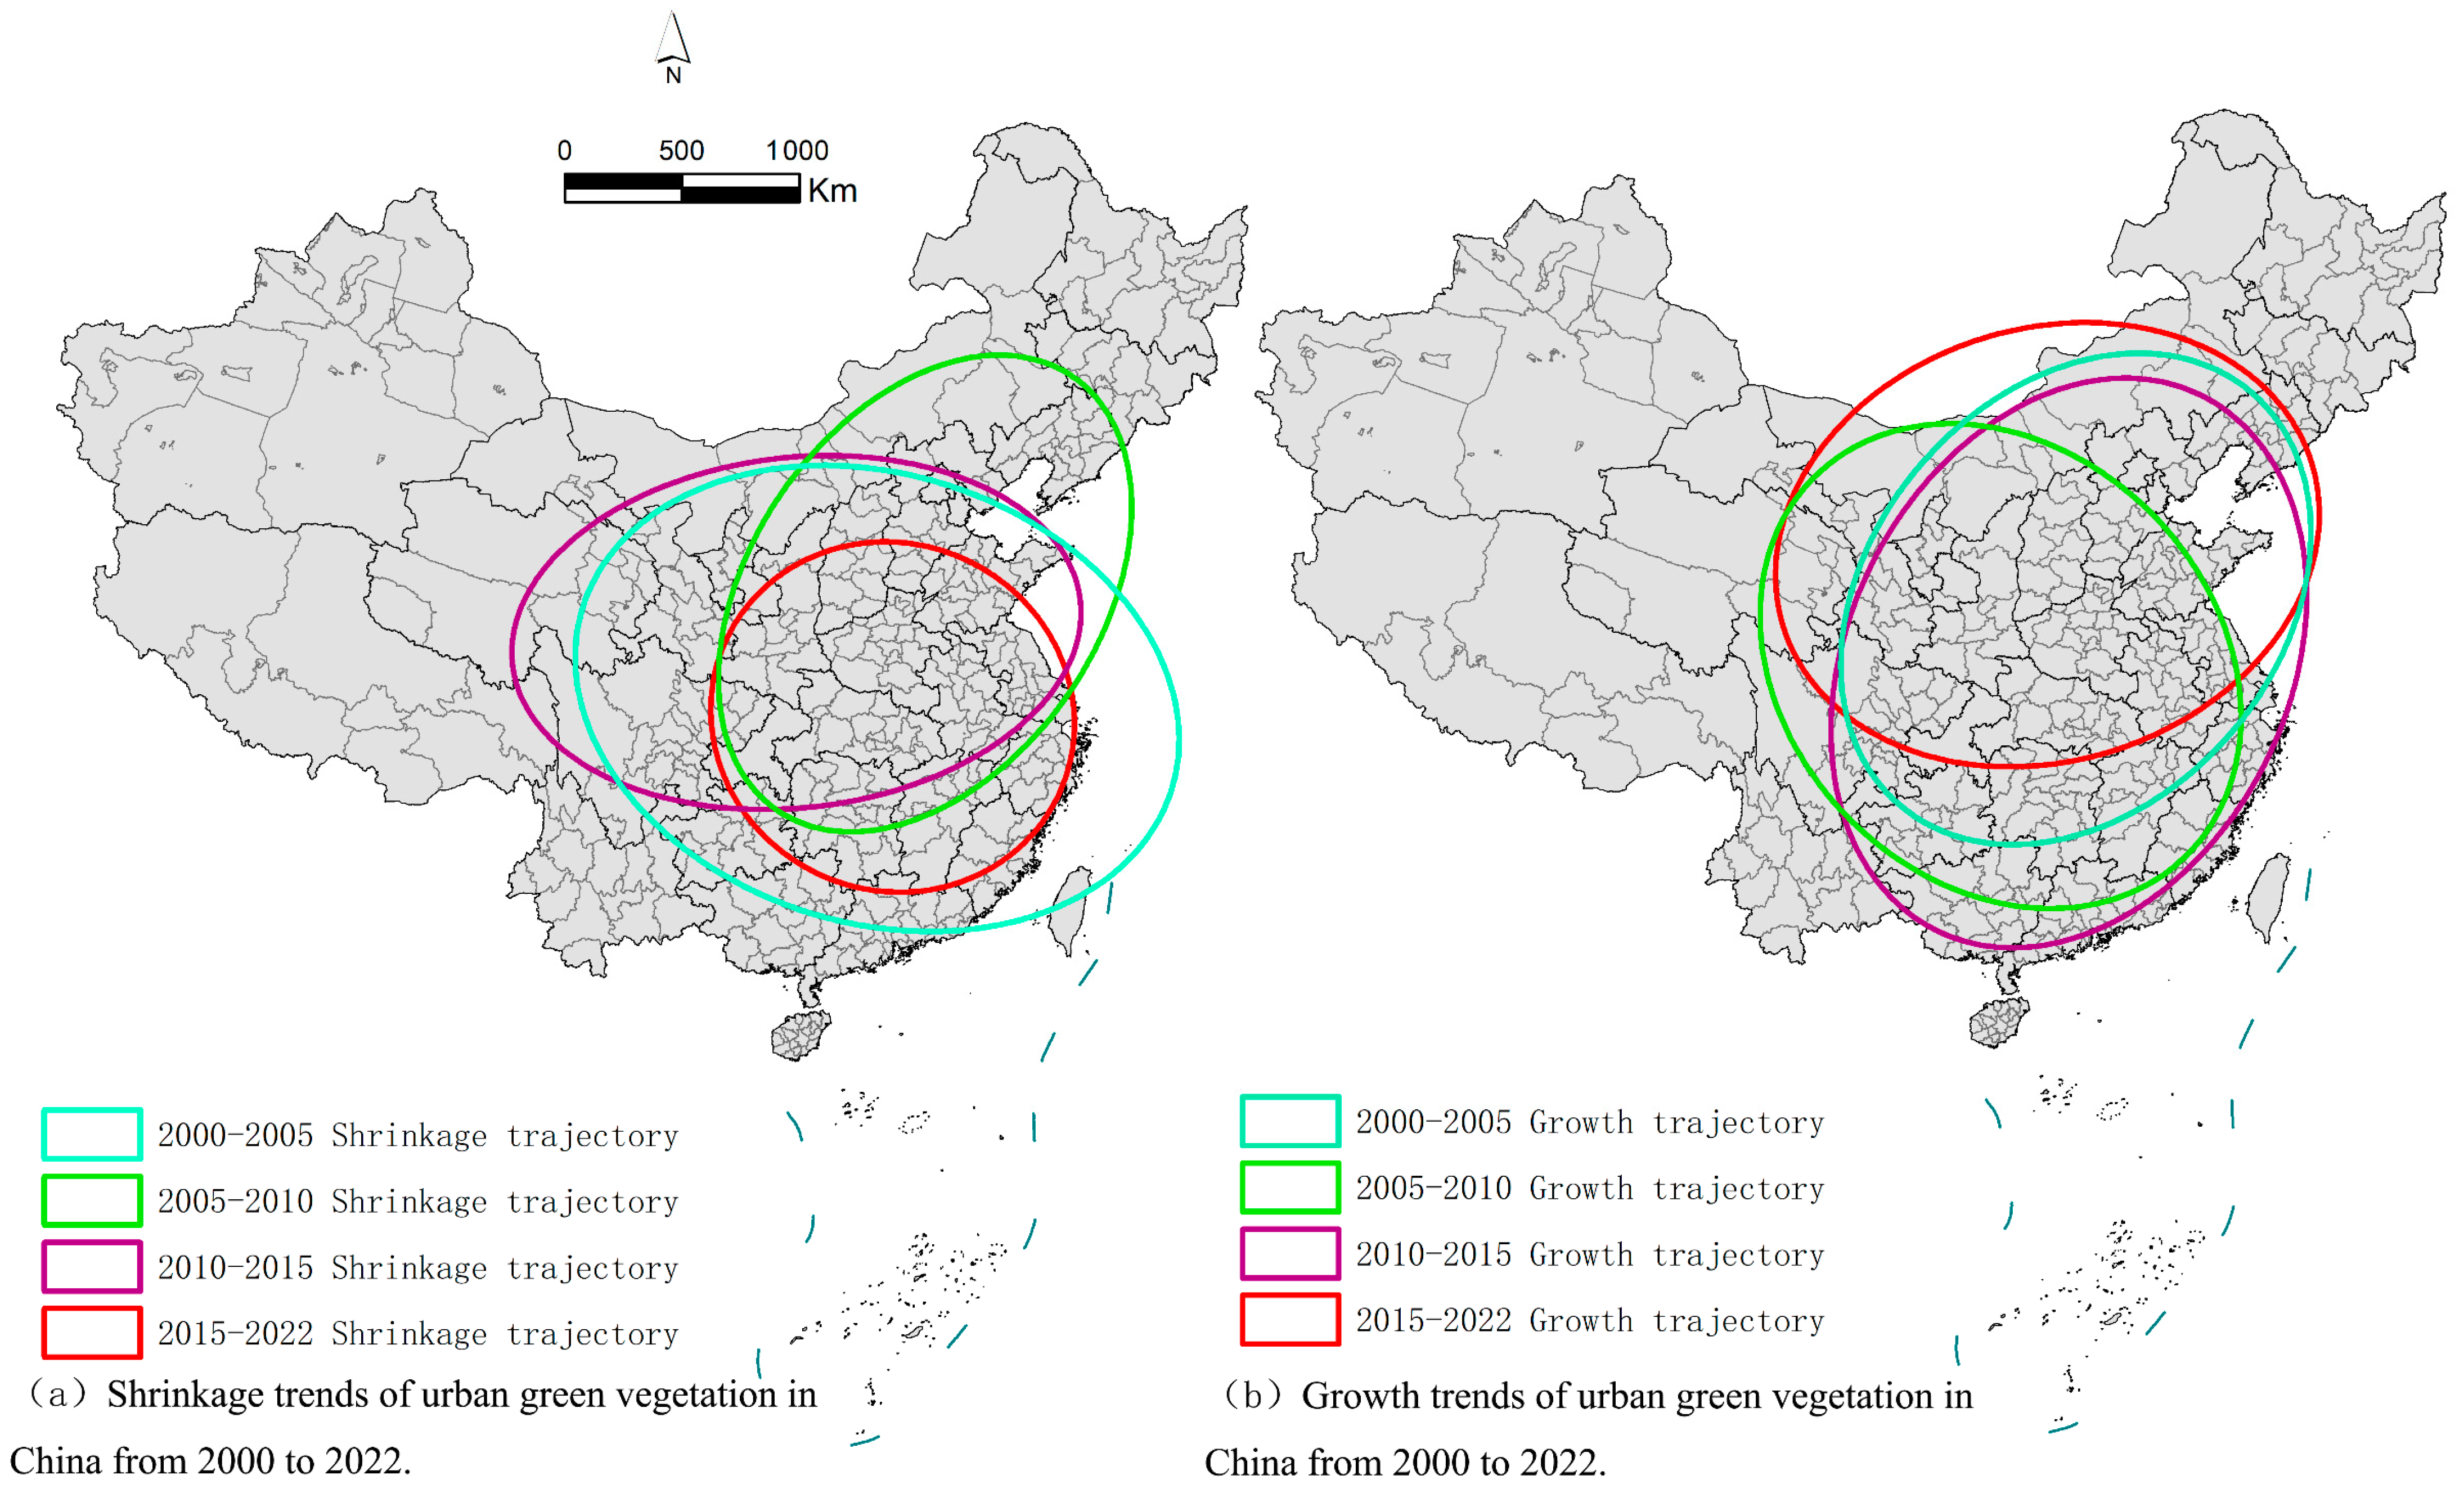
2.1.3. Vegetation Change Standard Deviation Ellipse

Standard deviation ellipses are often used to characterize spatial trends in a set of data [44]. In order to study the future change trend of green vegetation in China, we calculated the ellipse gravity center, azimuth angle, and long and short axes of urban vegetation area change in China from 2000 to 2022; we analyzed the trend of urban vegetation contraction, growth evolution, and direction through standard deviation ellipse changes. Among them, the elliptical azimuth can be used to judge the direction in which green vegetation increases and decreases. The barycenter can be used to judge the change in the barycenter of vegetation. The long and short axes are used to predict the direction of vegetation area change [45]. The equations for calculating the azimuth, center of gravity, and major and minor axes of an ellipse are as follows:
X = i = 1 n w i × x i i = 1 n w i , Y = i = 1 n w i × y i i = 1 n y i
where X and Y are the barycentric coordinates of the normalized ellipse, x i and y i are the position coordinates of the ith element, w i is the weight of the ith element, and n is the total number of pixels.
S D E x = i = 1 n x i x n , S D E y = i = 1 n y i y n
S = x S D E x 2 + y S D E y 2
S D E x and S D E y are the major and minor axes of the normalized ellipse, respectively, x and y are the arithmetic mean centers of x i and y i , respectively, and S is the area of the standard deviation ellipse.
tan θ = i = 1 n x k 2 i = 1 n y i 2 + i = 1 n x k 2 i = 1 n y k 2 2 + 4 i = 1 n x k y k 2 2 i = 1 n x k y k
δ x = 2 i = 1 n x k cos β y k sin β 2 n ,     δ y = 2 i = 1 n x k sin β + y k cos β 2 n
x k and y k are the differences between x i and y i and x and y , respectively; β is the azimuth of the standard deviation ellipse, which is positive if rotated clockwise from due north; and δ x and δ y are the standard deviations of the X-axis and Y-axis, respectively.

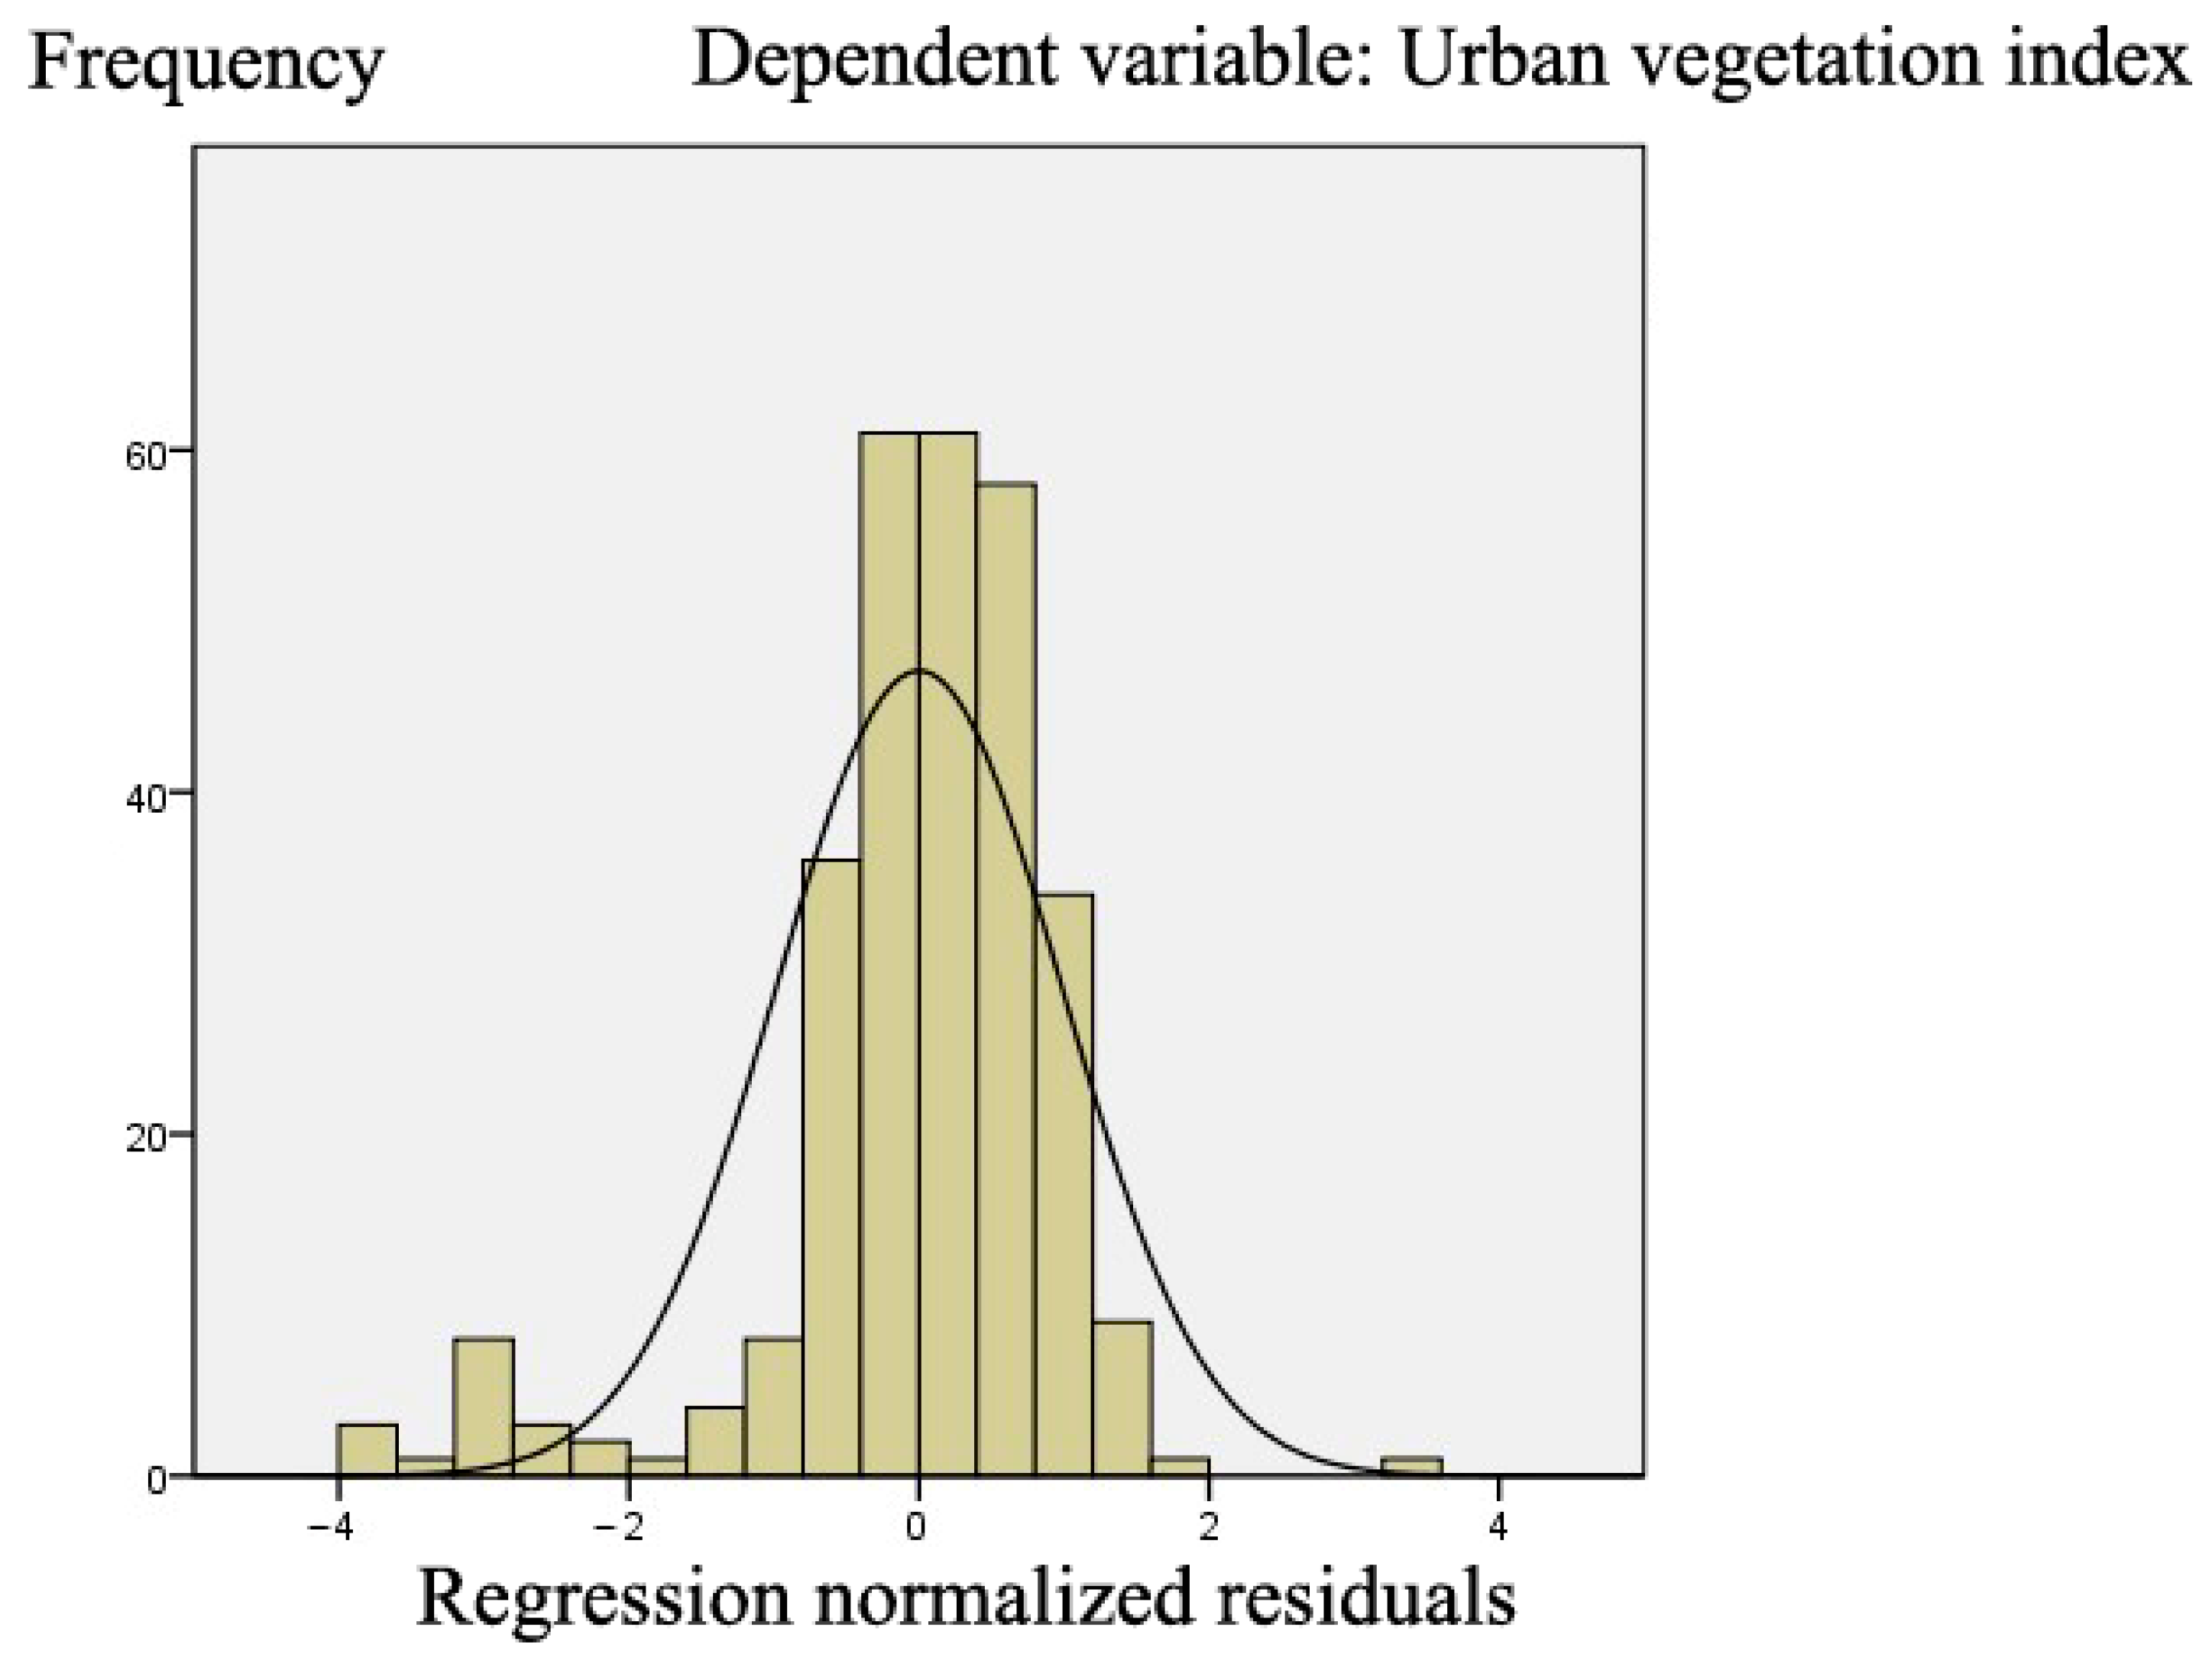
2.1.4. Multiple Linear Regression Model

In this study, we used SPSS19.0 software for the multiple linear regression statistical method to explore the key factors affecting the distribution of green vegetation [46,47]. The driving factors affecting the spatial distribution of green vegetation in China were explored, and multiple regression models were constructed to analyze the spatial distribution of green vegetation in China and the related factors, such as city size, industrial structure, population size, economic level, and water resources. Then, we tested the fitness and robustness of the regression model and explained the evolution logic of spatial difference distribution of green vegetation in China with regard to the relevant influencing factors; this provides a reference for local governments to carry out green vegetation protection and restoration in China. The general expression of the regression model is
Y i = α i + n = 1 m β i n X i n
where Yi represents the green vegetation area of city i. β is the coefficient of each regression model variable, α is a constant term, and X is the value of the regression model variable.

2.2. Data Collection

NDVI data and China Urban Statistical Yearbook data were used in this study. Among them, the NDVI is an important indicator for characterizing plant growth, vegetation coverage, growth status, and biomass. This index can be used to evaluate vegetation cover and its growth activity qualitatively and quantitatively, and it is an effective parameter for monitoring vegetation change [48]. We can also think of it simply as an indicator of vegetation density and health (source of raw data: https://search.earthdata.nasa.gov/, accessed on 1 May 2023). The Terra Moderate Resolution Imaging Spectroradiometer (MODIS) implements the policy of global free reception, which is a rare, cheap, and practical data resource for most scientists in China at present. The NDVI data are derived from the MODIS dataset and MOD13A3 data (https://doi.org/10.5067/MODIS/MOD13A3.006, accessed on 1 May 2023) [49]. The data were downloaded on 1 May 2023. The original NDVI is raster data. We averaged the grid values of each province, each prefecture-level city, and each county and obtained the year-by-year NDVI at the provincial, municipal, and county levels. In addition, the data from the China Urban Statistical Yearbook mainly come from the National Bureau of Statistics, which mainly include urban population, urban economy, urban scale, urban water resource reserves, and other indicators related to urban construction and development [50]. It is worth noting that the statistical yearbook data do not include these regions due to inconsistent statistical caliber and delayed publication time in some regions, such as Hong Kong, Macao, and Taiwan. Therefore, these regions were also excluded from the statistical analysis.

3. Result Analysis

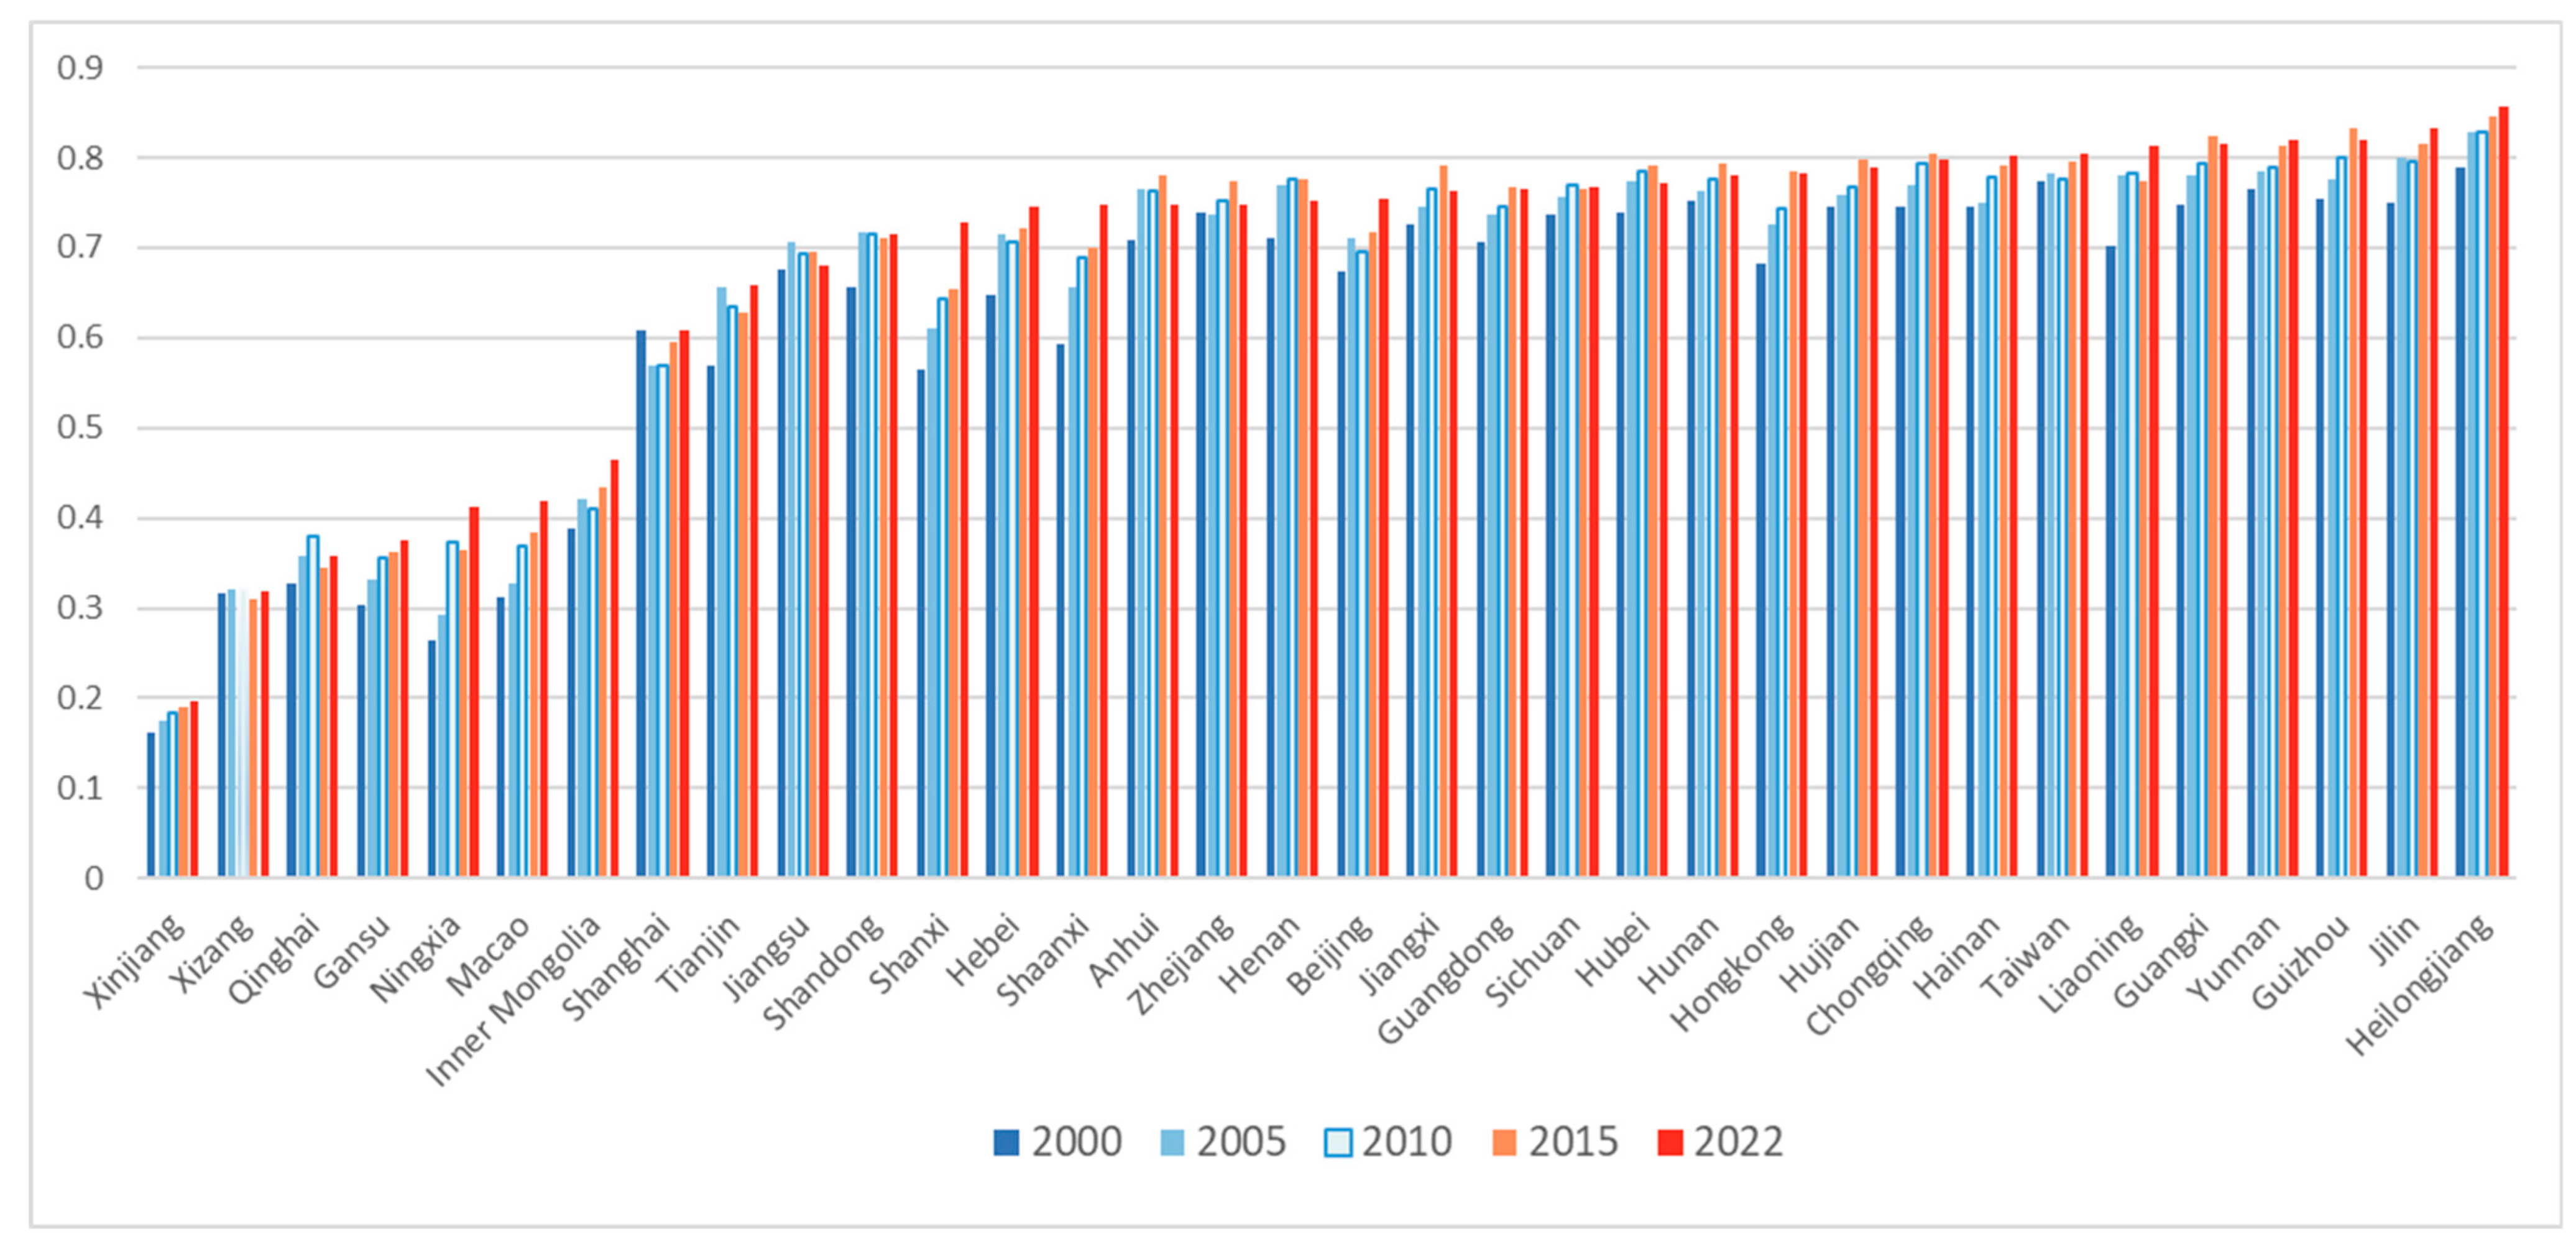
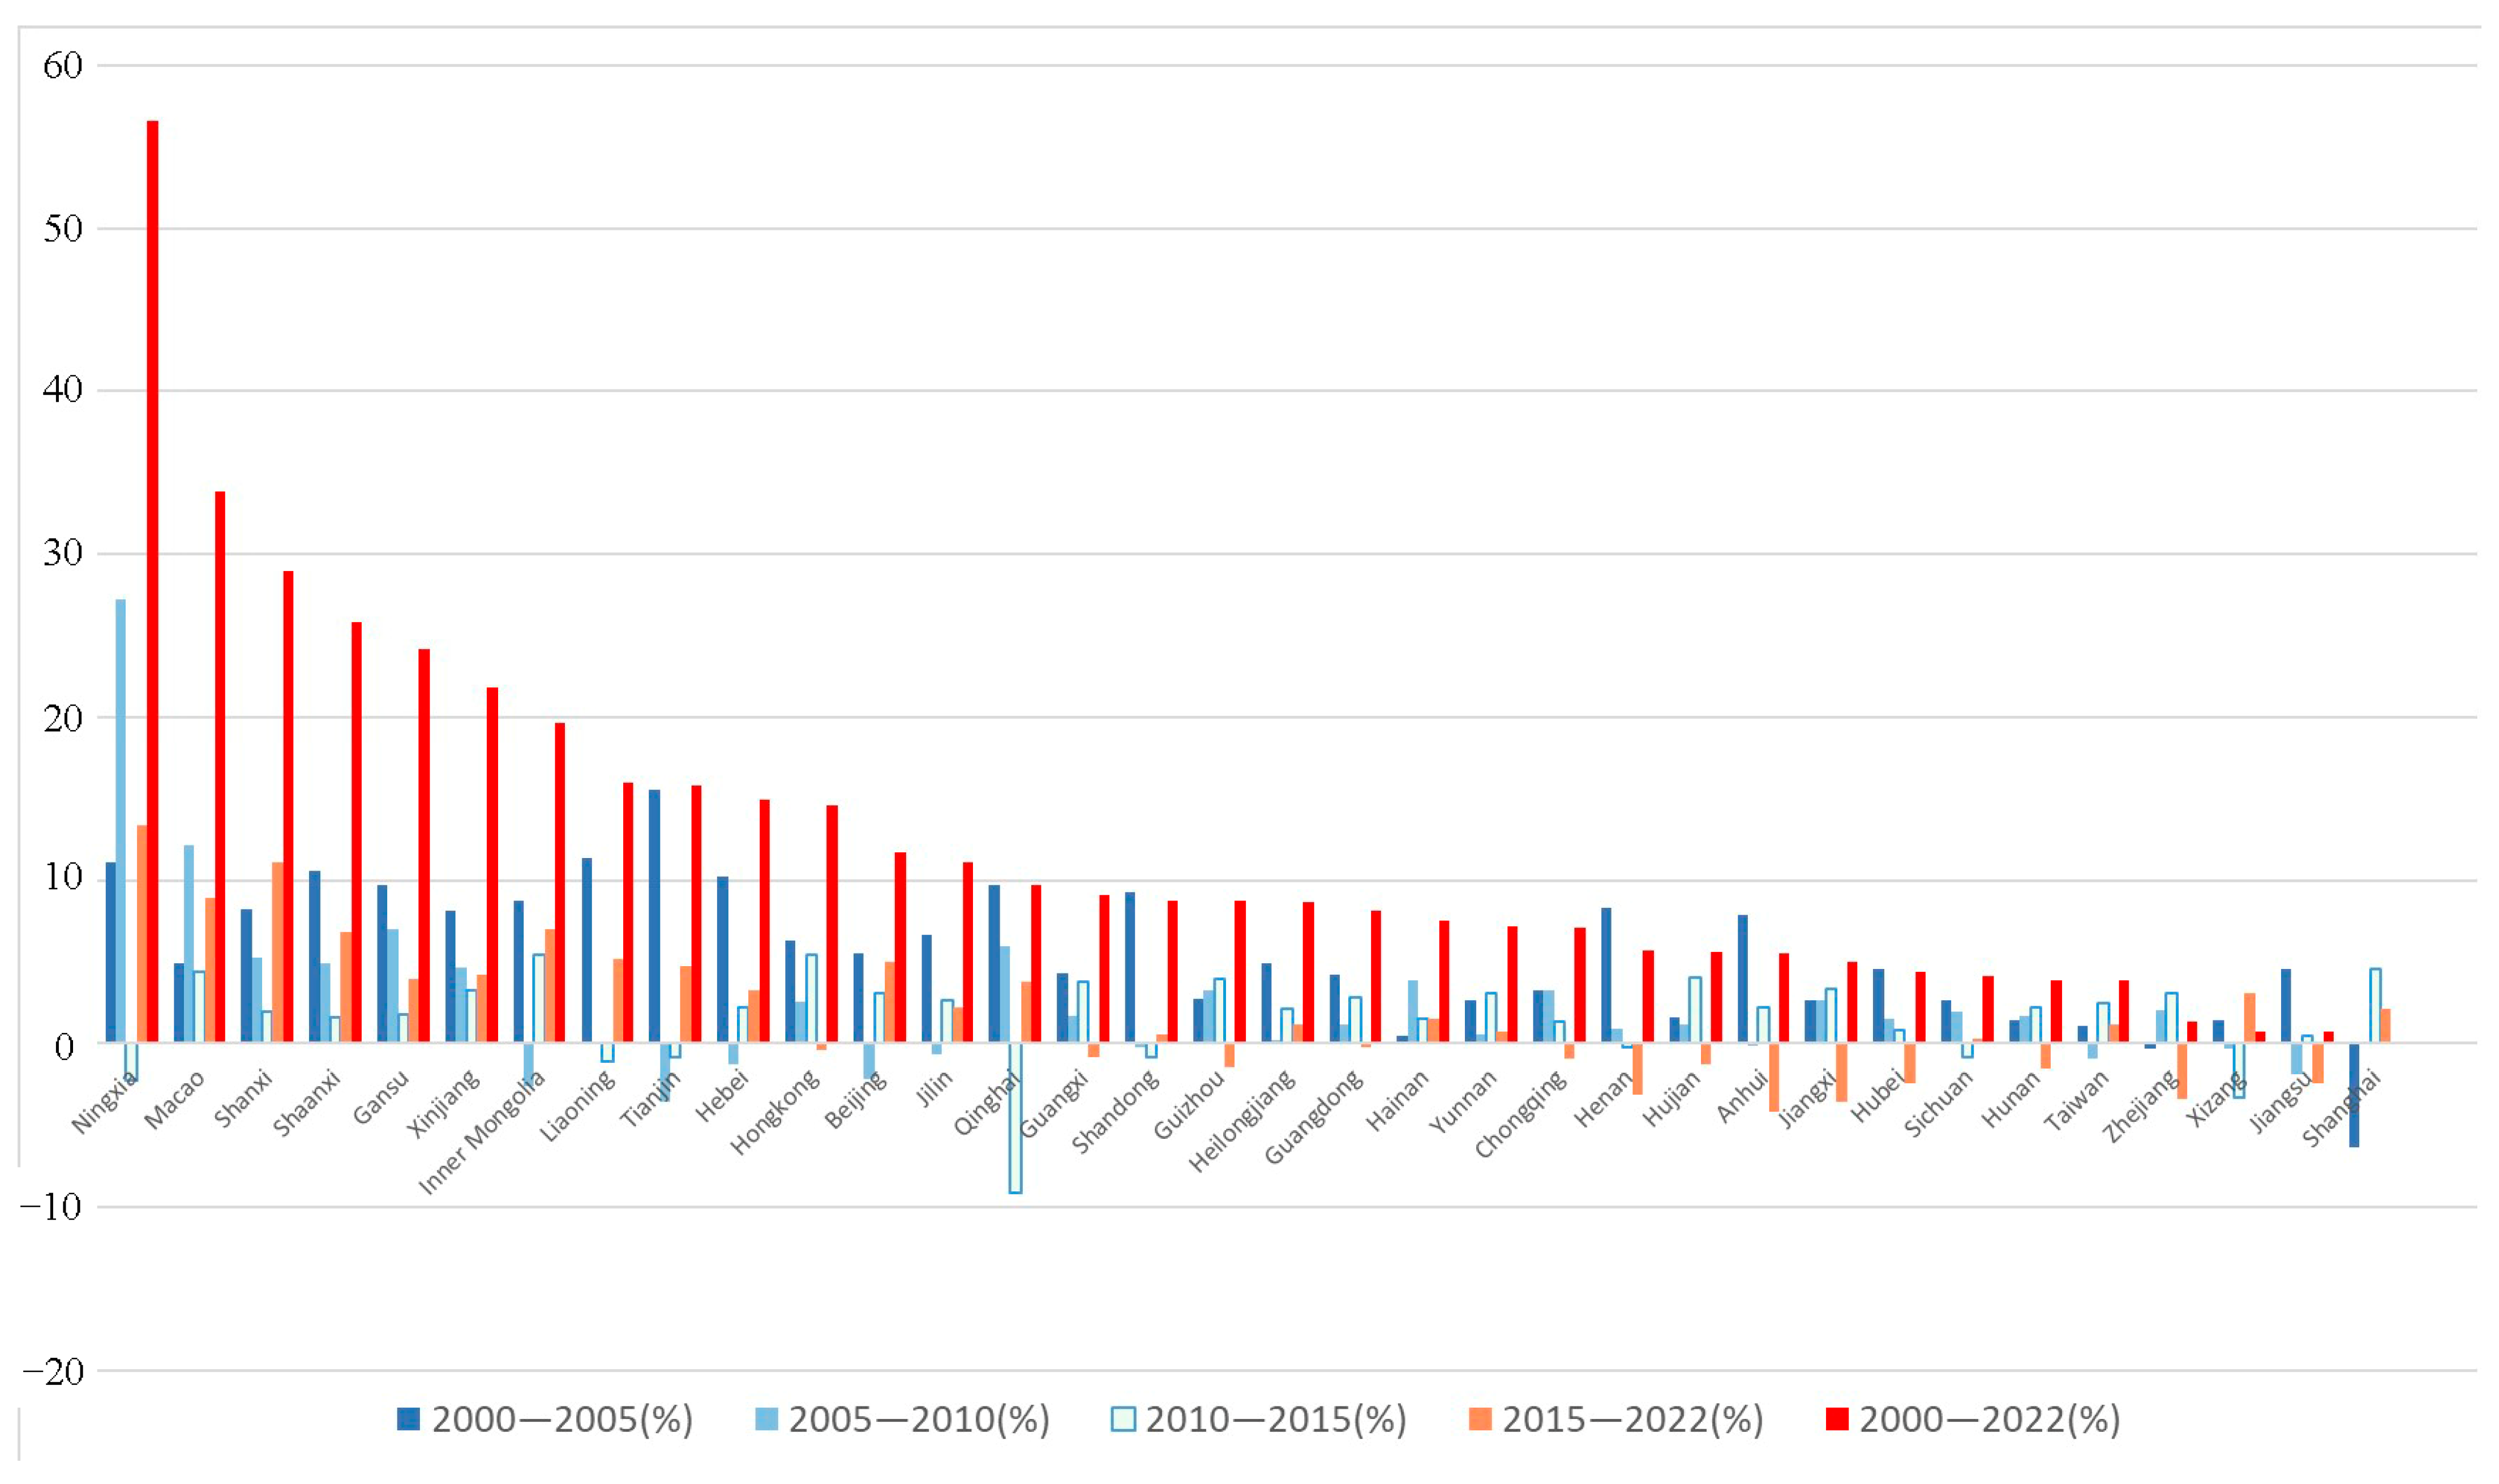
3.1. Analysis of Total Shrinkage and Growth of Urban Vegetation

From the perspective of the amount of provincial total green vegetation, the overall green vegetation in China showed an increasing trend from 2000 to 2022 (Figure 1). A total of 34 provinces and municipalities showed an increasing trend of the green vegetation NDVI. Heilongjiang, Guizhou, Jilin, Guangxi, Yunnan, and Chongqing ranked first in the total NDVI of green vegetation in China. This indicates that the green vegetation in economically underdeveloped areas, such as northeast China and the Yun-gui-chuan River, is relatively stable. These areas not only have low urbanization levels but also relatively good water and land resource conditions, which are conducive to vegetation growth and diffusion. Xinjiang, Xizang, Qinghai, and Gansu are at the bottom of the NDVI results. The economic level and climatic conditions in these areas are relatively poor, which is obviously unfavorable for large-scale vegetation growth. Ningxia, Macao, and Shanxi ranked in the top three in terms of total green vegetation growth rate, while Xizang, Shanghai, Jiangsu, and Zhejiang had the lowest green vegetation growth rate (Figure 2), except for the relatively harsh climatic conditions in Xizang, which are not conducive to vegetation growth. Shanghai, Jiangsu, Zhejiang, and other economically developed provinces have the lowest vegetation growth rate. This also reflects the fact that economic development promotes rapid urban expansion, destroys a large amount of vegetation, and has a significant inhibitory effect on the growth of regional vegetation.
From the micro-spatial level of districts and counties (Figure 3), the growth of green vegetation in China shows a trend of moving westward across the “Hu-Huanyong Line”. From 2000 to 2022, the number of districts and counties with a green vegetation index exceeding 0.8 increased from 184 to 749, an increase of four times. The number of districts and counties with a green vegetation index lower than 0.4 decreased from 314 to 184. The overall amount of green vegetation index increased obviously, showing a “point–line–plane” spatial growth pattern, forming a point-like aggregation, linear series, and planar spread regarding the spatial evolution stage. In 2000, there were relatively few concentrated areas with a high green vegetation index, and these were mainly concentrated near the boundary of the three northeastern provinces. As time went on, a belt-like growth trend gradually formed along the second ladder of China. With the Qinling, Wushan Mountains, Xuefeng, Wuyi, and Nanling Mountains forming the belt core, the growth trend has spread to the surrounding areas. The superior geographical environment and natural conditions guarantee the growth of green vegetation. In 2002, the state launched a project aimed at returning farmland to forests in the western region, further ensuring the rapid restoration of green vegetation in the central and western regions. Green vegetation gradually formed a planar growth trend in the western region and the three northeastern provinces. Of course, the high-value green vegetation index in the Central Plains and the upper reaches of the Yangtze River also showed a significant decreasing trend. A macro-pattern of decreasing green vegetation in the east and increasing in the west has been formed in China.

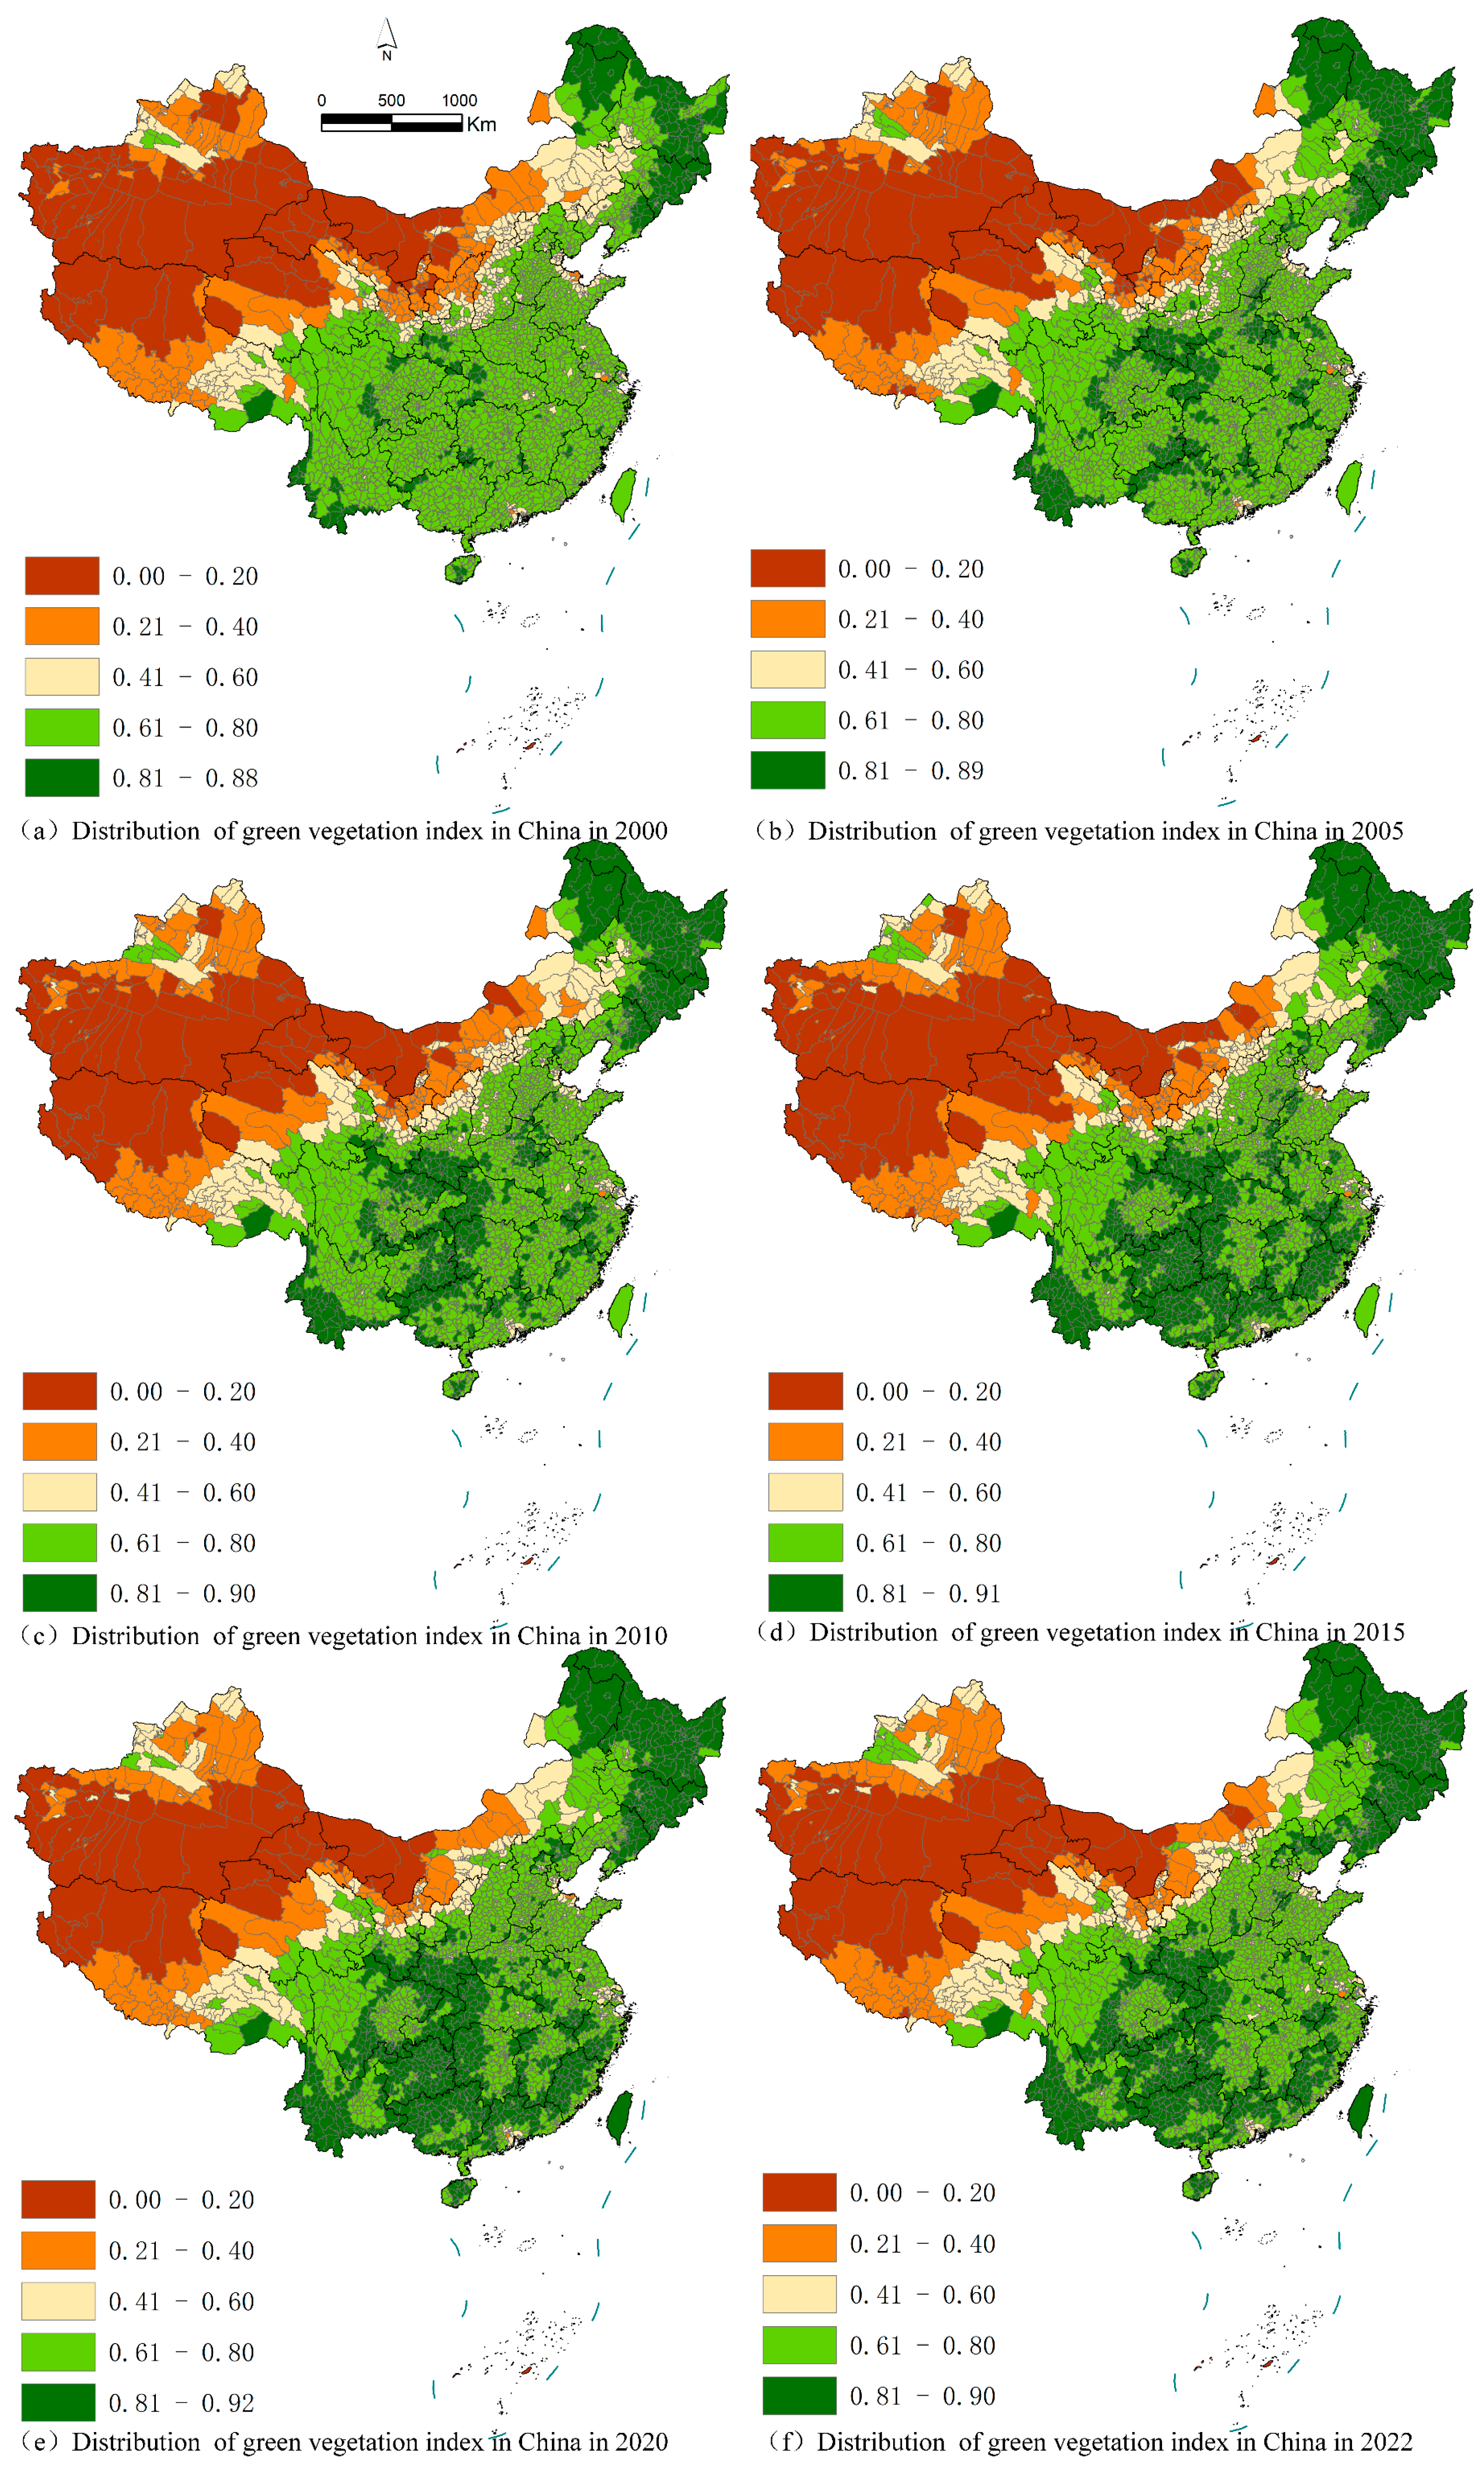
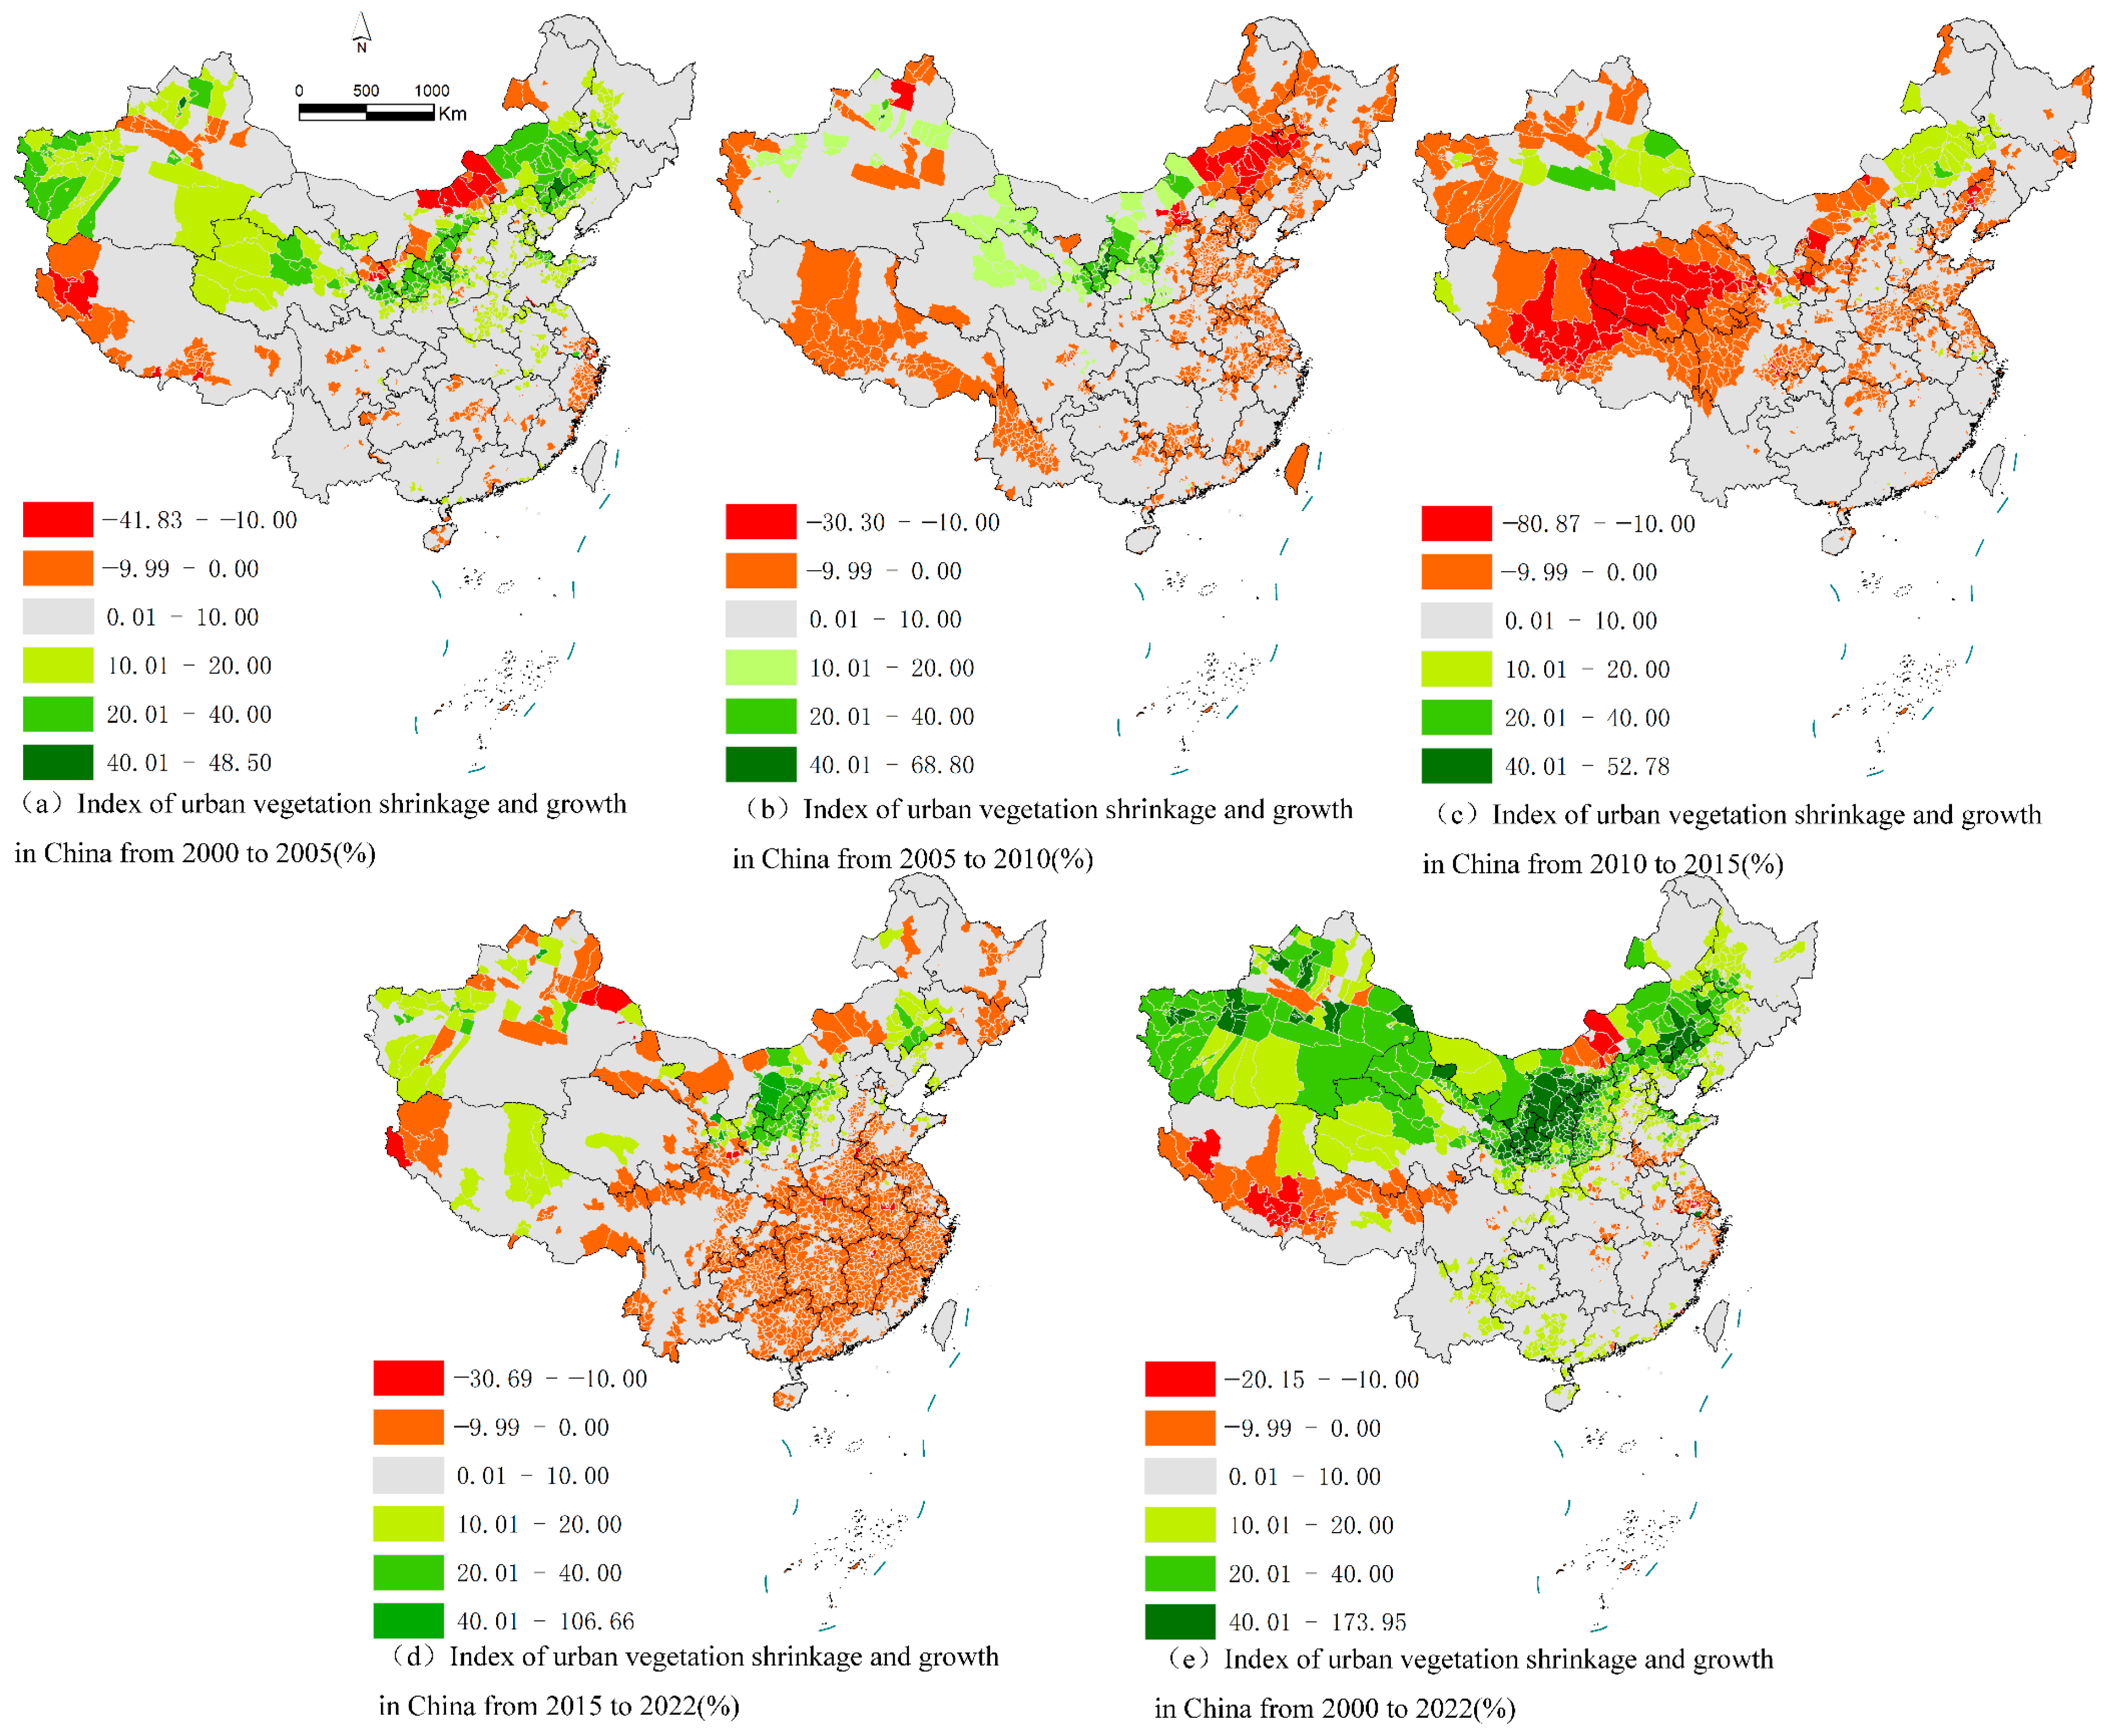
3.2. Analysis of Spatial Evolution Characteristics of Urban Vegetation Shrinkage and Growth

Urban vegetation plays a key role in improving the urban environment. The urban vegetation growth and contraction index is an important index to measure the quality of urban vegetation, which can reflect the growth status, distribution pattern, and structural changes in urban vegetation. Therefore, we used the urban growth and shrinkage index to explore the spatial evolution characteristics of urban vegetation in China, which is crucial to ensure sustainable urban development (Figure 4). The results showed that there were 352 cities with a shrinking green vegetation index from 2000 to 2005, accounting for 12.23%. From 2005 to 2010, 1061 urban green vegetation areas showed a shrinking phenomenon, accounting for 36.88%. From 2010 to 2015, 836 cities showed negative growth in green vegetation. From 2015 to 2022, the number of green vegetation contraction districts and counties rebounded to 1132, accounting for 39.34%. Obviously, the growth and contraction of urban green vegetation in China occur alternately, and the destruction of urban green vegetation in China was relatively scattered before 2005. After 2005, the greenbelt planting area was seriously damaged. From 2010 to 2015, green vegetation in northwest China was destroyed in large areas and gradually transferred to southern China after 2015. However, the green vegetation in these areas experienced a stage of contraction and then a growth stage. With the rapid development of China’s economy, the Chinese government has also implemented policies such as the project of returning farmland to forests, water and soil conservation projects, demonstration projects to combat desertification, and the prohibition of protected areas on decertified land. Green vegetation restoration and protection plans, such as the National Plan for Desertification Prevention and Control (2021–2030) and the Overall Plan for Major Projects for the Protection and Restoration of National Important Ecosystems, have been proposed, providing an important guarantee for the protection of green vegetation throughout the country. Finally, the scale of green vegetation in most parts of China showed a positive growth trend.
Vegetation is the most important part of a terrestrial ecosystem. The vegetation core density can reflect vegetation growth and coverage density in the study area, so it has been widely used in vegetation ecological monitoring analysis. In order to further characterize the spatial evolution characteristics of urban vegetation contraction and growth in China from 2000 to 2022, this study selects urban vegetation cover growth and contraction data, respectively, and adopts the kernel density analysis method of ArcGIS 10.2. The vegetation kernel density values were divided according to natural breakpoints (Figure 5 and Figure 6) for comparative analysis.
The results showed that vegetation has a dynamic “dot-line-plane” contraction structure and also a plane (mainly) and dot auxiliary growth structure. From the point of view of vegetation contraction, the vegetation area in China was mainly punctate in the early stage and mainly contracted in the provincial capital core cities from 2000 to 2005. With the passage of time, the contraction core gradually transferred to the surrounding areas of Beijing, Tianjin, and Hebei, gradually forming a planar contraction structure with the Central Plains urban agglomeration as the core. From 2015 to 2022, a planar contraction structure with the Central Plains as the core was formed. This evolution pattern is basically consistent with China’s urban opening and construction pattern. As far as growth is concerned, it has always shown a planar growth pattern. From 2000 to 2005, a planar growth pattern centered on the Central Plains urban agglomeration was formed, but this growth pattern began to shrink after 2005. After 2005, the planar growth pattern shifted to western and northwest China. With the western development strategy put forward, the growth pattern of the western area began to move to the south and north in 2010. With Beijing’s PM2.5 explosions in 2013, most people began to pay attention to the connection between particulate pollution and vegetation contraction. China has stepped up efforts to restore and protect vegetation around Beijing. After 2015, the planar growth pattern of vegetation in China will move northward in an all-round way. Obviously, the vegetation contraction pattern is mainly affected by urban expansion and construction, and vegetation growth mainly depends on regional environmental protection policies.

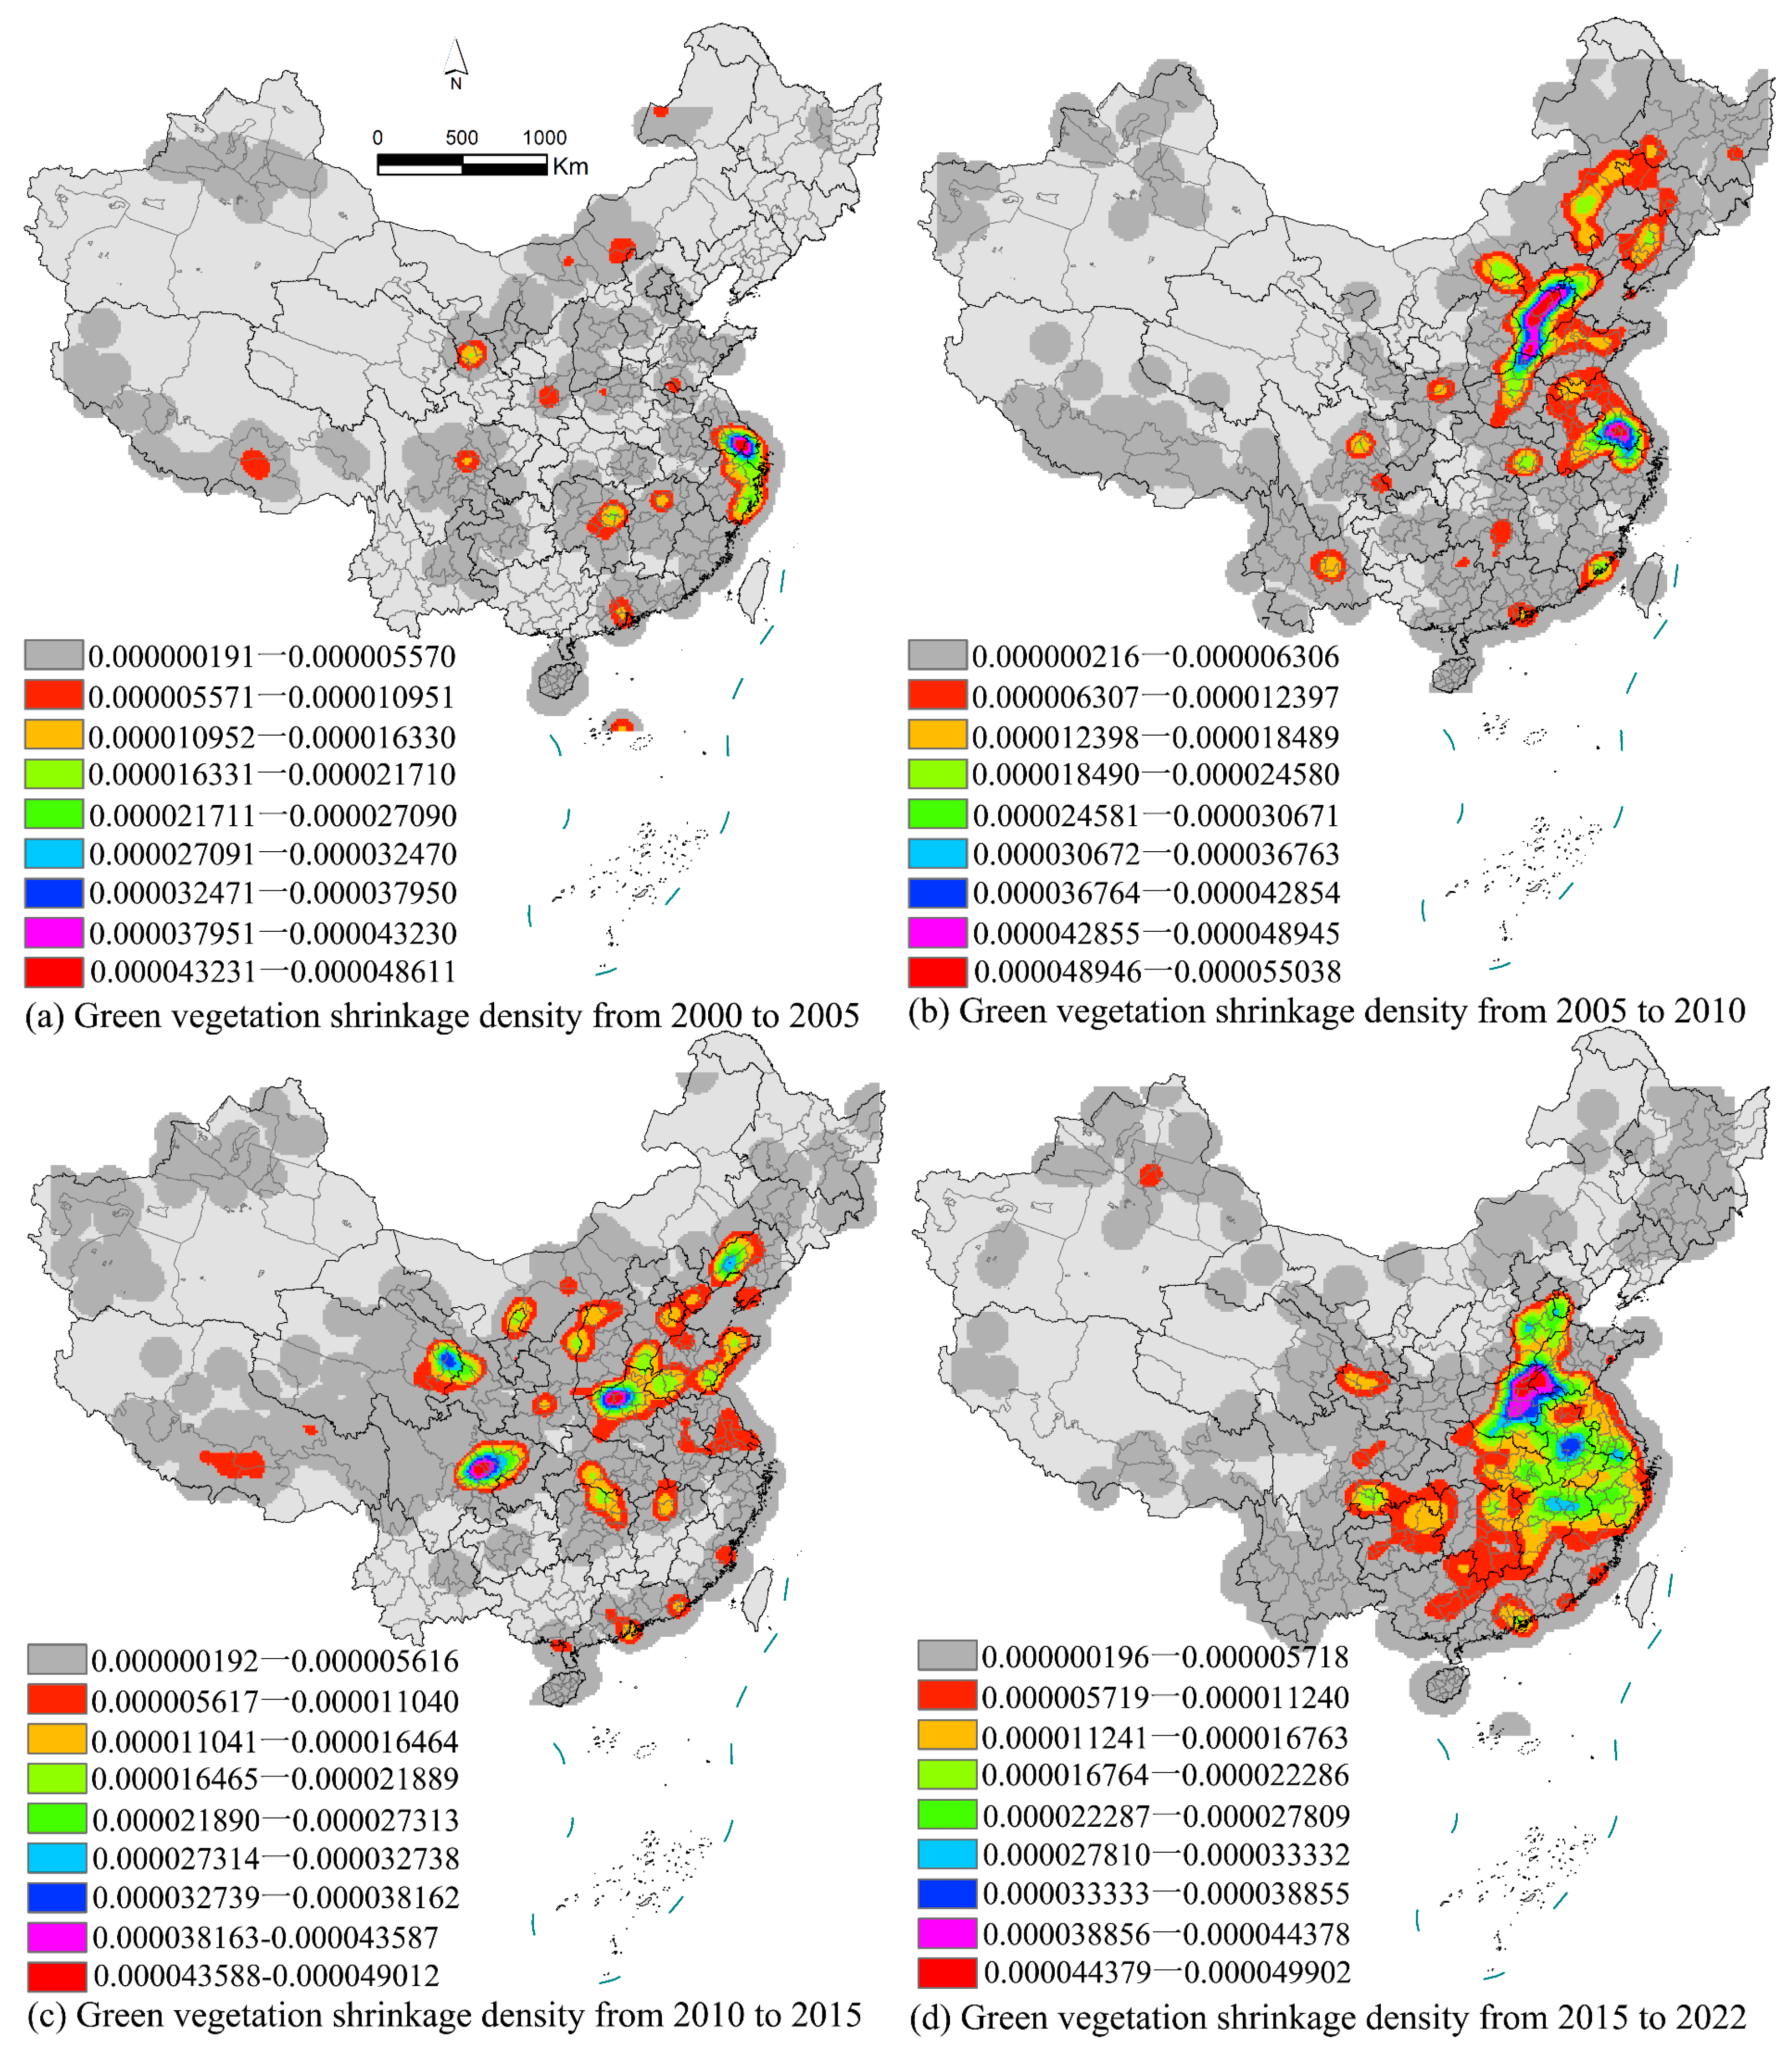
3.3. Analysis of Shrinkage and Growth Trends for Urban Vegetation

In order to characterize the trend of urban vegetation contraction and growth, we used the standard deviation ellipse tool within ArcGIS10.2 to conduct a segmented analysis from 2000 to 2022 to reflect the changing track of urban vegetation cover growth and contraction (Figure 7). From the point of view of the forward center of gravity, the vegetation contraction center of gravity moves north and then south. The center of gravity of vegetation growth moved southward first and then northward. These two show a trend of reverse development. From the point of view of standard deviation ellipse change, the major axis, minor axis, area, and direction of urban vegetation contraction in China from 2000 to 2022 have obvious fluctuation changes. From 2000 to 2005, the urban vegetation contracted relatively evenly. With the industrial depression in Northeast China, industrialization began to rise in the surrounding areas of Beijing, and a large amount of green vegetation was destroyed. From 2005 to 2010, a large amount of vegetation contracted in the surrounding areas of Beijing, Tianjin, and Hebei, which led to the obvious northward movement of the ellipse. As the industrialization and urbanization of the Central Plains gradually matured, the focus of industrial development gradually shifted to the northwest, resulting in an obvious northward shift of the ellipse after 2010. Large-scale industrialization and urbanization have also seriously damaged the ecological environment of northwest China. The focus of industrial development has gradually shifted to central China. This has also led to the obvious contraction of the long axis and short axis of the ellipse after 2015 and the substantial reduction in the axis length in the X- and Y-axis directions. The problem of green vegetation destruction has begun to shift to central China. The shift in the path of the industrial development center of gravity is also coordinated with the growth track of urban green vegetation. Urban green plants were gradually restored with a shift in the industrial center of gravity. In other words, the shrinkage and growth of green vegetation in China showed a north–south differentiation phenomenon, as well as a pattern of shrinkage in the south and growth in the north. How to promote vegetation restoration in central China in the future will become an urgent issue.

4. Analysis of the Influencing Factors

Green vegetation is an indicator of regional ecological environments; its growth status can indicate the quality of the environment, and vegetation growth is affected by natural factors and human factors. From the above research, it is not difficult to observe that there are regional differences in the spatial evolution characteristics and evolution trends of urban vegetation contraction and growth in China. The influencing factors that lead to differences in the distribution of vegetation are also inconsistent and are seriously affected by local climate conditions, geographical environment, development construction, and development policies [51]. Of course, many scholars have carried out research in this area from the perspectives of climatic conditions, geographical environment, and development policies [12,25,52,53], but few scholars have analyzed the distribution of vegetation differences from the perspective of urban development and construction [54]. Therefore, we selected the indicators related to urbanization construction. In order to facilitate the establishment of green vegetation restoration and protection policies in China, we tried to excavate the main causes of the spatial distribution of green vegetation in China from the perspectives of urban population, scale, industry, economy, and water resources. We comprehensively analyzed the impacts of urbanization development-related indicators, such as urban population, urban scale, urban economy, urban industry, and water resources, on the increase and decrease in urban green vegetation in China and constructed an explanatory model for vegetation growth and contraction. Firstly, we used the SPSS19.0 correlation statistical analysis tool to judge the correlation degree of explanatory variables of vegetation difference distribution. The significant correlation variables that affect vegetation increase and decrease were screened out. Secondly, we performed multiple regression analysis using significantly correlated variables and dependent variables. We gradually eliminated urban real estate development investment, urban residential land area, urban green space area, and other variables that had low correlation and weak collinearity. Finally, we obtained the key variables with a high correlation, strong collinearity, and high fitting degree (Table 1).
The results in Table 1 show that the Sig. value of the regression model is 0.000a, which proves that the regression model has strong statistical significance [55]. The absolute values of the t-tests of the regression models were all greater than 1.96, indicating that the independent variables had a significant influence on the regression models [56]. The Sig. values of each independent variable were all lower than 0.05, which indicated that there was a significant correlation between the independent variables and dependent variables. Secondly, the collinearity VIF values of the independent variables were all lower than 7.5, indicating no collinearity between the variables. Furthermore, the model passed the robustness test, and the R2 value of the explanatory model was 0.639 (not less than 0.5), which further proved that the interpretative model has a high degree of fit, high robustness, and good quality. Additionally, the residual histogram of the regression model also shows a normal distribution pattern (Figure 8), which further confirms that the regression model is of good quality, has high robustness, a strong fitting degree, and strong statistical significance. The regression model can be used to explain the main causes of the differential distribution of urban vegetation growth and contraction in China. The regression model is
Y = 0.77751 + 0.00014X1 − 0.01791X2 − 0.01130X3 + 0.00518X4 − 0.00024X5 + 0.00010X6 − 0.02609X7 + 0.02848X8,
where X1 represents the average annual population of the city (104 people); X2 represents the land area of administrative regions in the city (104 km2); X3 represents the per capita GDP of the city (CNY); X4 represents the proportion of employees in the primary industries in the city (%); X5 represents the amount of industrial electricity consumption throughout the city (100 million kWh); X6 represents the total amount of water resources in the city/100 million cubic meters; X7 represents the number of industrial sulfur dioxide emissions in the city (104 tons); and X8 represents the number of industrial nitrogen oxide emissions in the city (104 tons).
From the regression model, it is not difficult to observe that urban population, urban scale, urban economy, agriculture and industry, water resources, and urban emissions are significantly correlated with the increase and decrease in the urban vegetation index. Among them, urban air pollutant emission has the most significant effect on the vegetation index. When other independent variables are unchanged, the urban vegetation index decreased by 0.026 for every 10,000-ton increase in urban industrial sulfur dioxide emissions. The proper control of industrial sulfur dioxide emissions is conducive to the growth of urban green vegetation. Conversely, increasing urban NOx emissions also contributes to urban green vegetation growth. In addition, the area of the urban administrative region also has a significant impact on the increase and decrease in green vegetation. For every 10,000 square kilometer increase in administrative scale, the urban green vegetation index decreases by 0.018. Obviously, the larger the administrative scale of the city, the higher the maintenance cost of urban vegetation, the weaker the control, and the easier the vegetation is destroyed. Therefore, moderately controlling the size of the urban administrative area is helpful in the restoration and conservation of urban vegetation. Secondly, urban GDP per capita also has a negative impact on the increase and decrease in the urban vegetation index. A per capita GDP increase of CNY 10,000 sees an urban vegetation index decrease of 0.011. The higher the per capita GDP of the city, the higher the requirements for quality of life and living space, which further squeezes the growth space of green vegetation, and the growth space of green vegetation will clearly be reduced. Obviously, urban economic development also occupies the growth space of urban green vegetation. Local governments need to strengthen the protection of green vegetation while developing the economy. Urban industrial electricity consumption is also negatively correlated with the vegetation index. The larger the urban industrial electricity consumption is, the smaller the urban vegetation index is. Local governments need to eliminate inefficient and energy-intensive industrial activities. The proper control of the industrial production scale contributes to urban vegetation growth. Of course, there are also positive factors driving the growth of green vegetation. The total amount of urban water resources, the proportion of employees in urban primary industries, and the scale of the urban population are positively correlated with the green vegetation index. The more abundant the urban water resources, the larger the urban vegetation coverage area. This is more in line with the growth needs of vegetation. Additionally, the scale of primary industry also promotes the growth of vegetation, which also shows that primary industries protect the growth of vegetation. Finally, urban population size also plays a positive role in urban vegetation growth, but the impact index is not too obvious.
In other words, the city scale, economy, population, agriculture, industry, and water resources are the driving factors of the differential distribution of urban vegetation growth and contraction in China. The relationship between these factors and the urban green vegetation index is positive and negative. Any independent variable in the regression model will affect the growth and contraction scale of urban green vegetation. Each local government can combine the independent variables of the regression model to formulate its own green vegetation restoration measures and protection policies. Only in this way can we achieve the general goal of ecological civilization construction and realize China’s sustainable development.

5. Strategic Recommendations

China has clearly put forward the goal of a “carbon peak” by 2030 and “carbon neutral” by 2060 [57]. Urban vegetation restoration is the key link to completing the double carbon strategy [58]. Based on the above-mentioned research on vegetation increase and decrease characteristics and their influencing factors in China, we conducted analysis and discussion from the perspectives of macro-restoration strategies, spatial differentiation restoration paths, and different types of vegetation differentiation restoration methods.

5.1. Differential Repair of Macro-Strategy Dimension

Local governments should adjust control variables and formulate green vegetation differential restoration policies according to local conditions in combination with the local city scale, economic level, population scale, agricultural proportion, industrial proportion, water resource retention, and other factors [59]. The response of vegetation coverage to ecological restoration is a complex process [60]. Because of the spatial overlap between the vegetation contraction area and vegetation growth area, local governments should consider vegetation protection and restoration countermeasures in different areas as a whole, comprehensively arrange a vegetation protection and restoration time sequence, and avoid conflict between specific countermeasures [61]. Following the principle of “protection first, natural restoration first, artificial restoration second” [62], the restoration work should be carried out on the vegetation system interfered with or damaged by urban development and construction. Priority should be given to assessing the integrity of regional vegetation systems, and vegetation restoration and protection should be carried out according to local conditions. For areas with an excellent ecological background and good vegetation system recovery ability, natural restoration measures should be implemented to eliminate artificial intervention. The artificial restoration of original vegetation systems that have not exceeded the critical point of vegetation system restoration capacity should be carried out with appropriate ecological engineering. Vegetation system remodeling should be carried out according to local conditions for vegetation systems exceeding the critical point of vegetation system resilience. In the deployment of vegetation system restoration engineering, it is necessary to focus on integrating agricultural and industrial layout models. This can be achieved through the establishment of cultivated land function restoration pilot projects, the promotion of green and efficient agricultural planting models, the implementation of cultivated land pollution prevention and control and restoration technologies, the creation of multi-functional vegetation systems, and the improvement in the stability of the vegetation system. At the same time, vegetation destruction factors will be incorporated into the vegetation protection and restoration supervision system, and the monitoring and prevention of vegetation shrinkage risk levels in key areas will be strengthened in order to achieve the sustainable development of regional vegetation systems.

5.2. Differential Repair of Spatial Dimensions

In terms of the spatial dimension, the contraction and growth of green vegetation in China showed a north–south differentiation phenomenon, showing a trend of contraction in the south and growth in the north [63]. We should give full consideration to climate change, geographical conditions, water resource conditions, and urban scale to balance the amount of green vegetation in the north and south around urban water conservation, wind prevention, sand fixation, water and soil conservation, coastal protection, etc. [64]; this will ensure the balanced development of vegetation restoration in the north and south of China and avoid the ecological restoration phenomenon of losing one or the other [65]. In the urban spatial dimension, we should take the city as a whole vegetation system and place it within the regional scale to measure and analyze the carrying capacity of urban vegetation resources. Starting from urban and rural regional planning, economically developed areas, such as Shanghai, Jiangsu, and Zhejiang, should adhere to the following concepts: green and sustainable development in various urban development and construction activities, serve economic development, the cultural shaping and ecological functions of the city, consider landscape functions when necessary, connect regional ecological corridors, form vegetation system networks, and comprehensively optimize the distribution pattern of urban vegetation. In the dimension of the agricultural space, according to the spatial planning of township land, this dimension should take cultivated land ecology as the starting point, carry out the comprehensive restoration of rural vegetation in the whole region, optimize the spatial distribution pattern of rural vegetation, protect the rural natural landscape, maintain rural vegetation diversity, and ensure the stable and healthy development of vegetation systems in underdeveloped areas.

5.3. Differential Restoration of Vegetation Type Dimension

Different types of vegetation have different growth habits, so we should take different restoration measures [66]. Firstly, grassland is one of the main restoration objects in vulnerable areas of vegetation in China [67]. Grassland overload is serious in Xinjiang, Inner Mongolia, and Xizang, where overgrazing by local residents leads to the desertification of large areas of grassland and the continuous reduction in grassland area. We should adopt a policy of fallow grazing and cultivation. Secondly, China’s desert area continues to expand. Windblown sand erodes the green vegetation on the edge of the desert. Local governments should establish shelterbelts at the edge of deserts to prevent the vegetation on the edge of deserts from being continuously destroyed. The tropical rain forests, deciduous broad-leaved forests, coniferous forests, and evergreen broad-leaved forests in southern China are also shrinking due to excessive human development, resulting in the extinction of some plants and animals, and the vegetation coverage area is obviously shrinking. It is mainly concentrated in developed areas such as the Pearl River Delta and Yangtze River Delta. The rapid increase in population leads to ecological imbalance. While developing the urban economy, local governments also need to establish nature reserves, establish sustainable agricultural policies, establish green industrial production chains, and ensure the integrity of vegetation systems [68].

5.4. Differentiated Repair of Administrative and Market Dimensions

The responsibilities of administrative departments and central and local governments should be clarified [69]. The state plans to carry out key vegetation restoration in areas where vegetation safety plays an important role and benefits a wide range of people [70]. Local governments need to restore other areas with a strong geographical coverage of vegetation [71]. For vegetation system restoration, there is a need to increase the diversified input from the government and the market, establish a central and local financial relationship with clear rights and responsibilities, coordinate financial resources and balanced regions, and form a stable financial input system. There is also a need to give full play to the decisive role of the market in resource allocation and encourage all kinds of market entities, especially all kinds of enterprises, to participate in vegetation restoration and cultivate the vegetation restoration industry. We should strengthen financial support and encourage and guide all kinds of enterprises to participate in the national green sustainable development strategy by means of financial subsidies, green credit, awards instead of subsidies, loan discount interest, etc. Enterprises participating in vegetation restoration shall enjoy certain tax concessions according to the regulations. We should adhere to the principle of “who restores, who benefits”, encouraging enterprises to invest in the vegetation restoration industry by means of equity participation, franchising, and leasing by granting property rights arrangements, such as the right to use natural resources assets for a certain period of time. At the same time, we should standardize the market order of vegetation restoration, strengthen market supervision, create a fair competition environment for enterprises to participate in vegetation restoration, and create sufficient market space.

6. Conclusions

Based on the vegetation cover index data of China from 2000 to 2022, this paper analyzes the growth and contraction process of urban green vegetation in China from the perspectives of growth and contraction change, spatial evolution, evolution trends, and influencing factors. The main conclusions are as follows:
Green vegetation grows and shrinks alternately in China, forming a macro-pattern of shrinking in the east, stabilizing in the south, and growing in the west and north. In terms of total growth, the western region is obviously higher than other regions, and the vegetation contraction area in the eastern region is the most obvious. Vegetation contraction is most significant in economically developed provinces. The shrinking trend of green vegetation in China is clearly moving southward, and the phenomenon of vegetation contraction spreads in the Central Plains urban agglomeration and its surrounding areas, presenting an expanding trend. The growth trend of green vegetation in China is obviously moving northward, mainly concentrated in Inner Mongolia, Ningxia, Gansu, and Xinjiang, which coincides with the key ecological restoration policies in northern China in recent years. The increase and decrease in green vegetation were significantly correlated with the city scale, economic level, population scale, agricultural and industrial structure, water resource content, and other factors. All these factors have an obvious influence on the increase and decrease in urban vegetation.
Of course, in order to maintain a balanced development of vegetation restoration in China, both southern and northern China need to attach importance to vegetation restoration [72]. In particular, the economically developed provinces in the south should pay more attention to vegetation restoration, not only urban development and construction, regardless of ecological environment protection. This study is innovative in that it vectorizes remote sensing data. By combining spatial analysis and statistical analysis, we first studied the patterns in the past 20 years and future trends of green vegetation change in China, and we analyzed the main influencing factors of green vegetation change from the perspective of urban development and construction. However, this study has some shortcomings. In the future, we will analyze the degree of damage to green vegetation caused by construction land expansion combined with China’s construction land data. Future research will analyze the trend of vegetation increase and decrease in China from the perspectives of climatic conditions, geographical environment, and ecological protection policies. Local governments should combine the above factors, formulate urban green vegetation restoration strategies according to local conditions, complete the general goal of green ecological civilization construction in China, and realize China’s sustainable development strategy. This study provides a reference and experience for other countries’ ecological environment protection.

Author Contributions

H.H. conceived and designed the study; X.Z. performed the experiments and analyzed the data. A.D. and Y.X. drew the drawings and analyzed the data. All authors have read and agreed to the published version of the manuscript.

Funding

This research is supported by the Center for Balance Architecture of Zhejiang University (Project No: K Heng 20203512-02B, Index and planning methods of resilient cities).

Institutional Review Board Statement

Not applicable.

Informed Consent Statement

Not applicable.

Data Availability Statement

Data are contained within the article.

Conflicts of Interest

The authors declare no conflicts of interest.

References

  1. Li, D.; Wu, S.; Liang, Z.; Li, S. The impacts of urbanization and climate change on urban vegetation dynamics in China. Urban For. Urban Green. 2020, 54, 126764. [Google Scholar] [CrossRef]
  2. Piao, S.; Yin, G.; Tan, J.; Cheng, L.; Huang, M.; Li, Y.; Liu, R.; Mao, J.; Myneni, R.B.; Peng, S.; et al. Detection and attribution of vegetation greening trend in China over the last 30 years. Glob. Change Biol. 2015, 21, 1601–1609. [Google Scholar] [CrossRef]
  3. Lu, F.; Hu, H.; Sun, W.; Zhu, J.; Liu, G.; Zhou, W.; Zhang, Q.; Shi, P.; Liu, X.; Wu, X.; et al. Effects of national ecological restoration projects on carbon sequestration in China from 2001 to 2010. Proc. Natl. Acad. Sci. USA 2018, 115, 4039–4044. Available online: https://www.pnas.org/doi/abs/10.1073/pnas.1700294115 (accessed on 1 May 2023). [CrossRef]
  4. Wang, J.; Chen, Y.; Shao, X.; Zhang, Y.; Cao, Y. Land-use changes and policy dimension driving forces in China: Present, trend and future. Land Use Policy 2012, 29, 737–749. [Google Scholar] [CrossRef]
  5. Sieghardt, M.; Mursch-Radlgruber, E.; Paoletti, E.; Couenberg, E.; Dimitrakopoulus, A.; Rego, F.; Hatzistathis, A.; Randrup, T.B. The abiotic urban environment: Impact of urban growing conditions on urban vegetation. Urban For. Trees A Ref. Book 2005, 11, 281–323. Available online: https://springer.dosf.top/chapter/10.1007/3-540-27684-X_12 (accessed on 2 May 2023).
  6. D’Odorico, P.; Bhattachan, A.; Davis, K.F.; Ravi, S.; Runyan, C.W. Global desertification: Drivers and feedbacks. Adv. Water Resour. 2013, 51, 326–344. Available online: https://www.sciencedirect.com/science/article/pii/S0309170812000231 (accessed on 2 May 2023). [CrossRef]
  7. Qu, S.; Wang, L.; Lin, A.; Yu, D.; Yuan, M. Distinguishing the impacts of climate change and anthropogenic factors on vegetation dynamics in the Yangtze River Basin, China. Ecol. Indic. 2020, 108, 105724. Available online: https://www.sciencedirect.com/science/article/pii/S1470160X19307174 (accessed on 2 May 2023). [CrossRef]
  8. Stephenson, N.L. Climatic control of vegetation distribution: The role of the water balance. Am. Nat. 1990, 135, 649–670. [Google Scholar] [CrossRef]
  9. Pettorelli, N.; Ryan, S.; Mueller, T.; Bunnefeld, N.; Jędrzejewska, B.; Lima, M.; Kausrud, K. The Normalized Difference Vegetation Index (NDVI): Unforeseen successes in animal ecology. Clim. Res. 2011, 46, 15–27. [Google Scholar] [CrossRef]
  10. Cihlar, J.; Laurent, L.S.; Dyer, J.A. Relation between the normalized difference vegetation index and ecological variables. Remote Sens. Environ. 1991, 35, 279–298. Available online: https://www.sciencedirect.com/science/article/pii/0034425791900182 (accessed on 2 May 2023). [CrossRef]
  11. Pettorelli, N.; Vik, J.O.; Mysterud, A.; Gaillard, J.M.; Tucker, C.J.; Stenseth, N.C. Using the satellite-derived NDVI to assess ecological responses to environmental change. Trends Ecol. Evol. 2005, 20, 503–510. Available online: https://www.cell.com/trends/ecology-evolution/abstract/S0169-5347(05)00162-X (accessed on 2 May 2023). [CrossRef] [PubMed]
  12. Tucker, C.J. Red and photographic infrared linear combinations for monitoring vegetation. Remote Sens. Environ. 1979, 8, 127–150. Available online: https://www.sciencedirect.com/science/article/pii/0034425779900130 (accessed on 2 May 2023). [CrossRef]
  13. Stow, D.A.; Hope, A.; McGuire, D.; Verbyla, D.; Gamon, J.; Huemmrich, F.; Houston, S.; Racine, C.; Sturm, M.; Tape, K.; et al. Remote sensing of vegetation and land-cover change in Arctic Tundra Ecosystems. Remote Sens. Environ. 2004, 89, 281–308. Available online: https://www.sciencedirect.com/science/article/pii/S0034425703002803 (accessed on 3 May 2023). [CrossRef]
  14. Dirnböck, T.; Dullinger, S.; Grabherr, G. A regional impact assessment of climate and lande in Arctic Tundra Ecosystems. Remote Sens. Environ. 2004, 89, 281–308. Available online: https://www.sciencedirect.com/science/article (accessed on 3 May 2023).
  15. Sun, W.; Song, X.; Mu, X.; Gao, P.; Wang, F.; Zhao, G. Spatiotemporal vegetation cover variations associated with climate change and ecological restoration in the Loess Plateau. Agric. For. Meteorol. 2015, 209, 87–99. Available online: https://www.sciencedirect.com/science/article/pii/S0168192315001446 (accessed on 3 May 2023). [CrossRef]
  16. Tucker, C.J.; Townshend, G., Jr.; Goff, T.E. African land-cover classification using satellite data. Science 1985, 227, 369–375. [Google Scholar] [CrossRef] [PubMed]
  17. Tucker, C.J.; Newcomb, W.W.; Los, S.O.; Prince, S.D. Mean and inter-year variation of growing-season normalized difference vegetation index for the Sahel 1981–1989. Int. J. Remote Sens. 1991, 12, 1133–1135. [Google Scholar] [CrossRef]
  18. Yang, L.; Wylie, B.K.; Tieszen, L.L.; Reed, B.C. An analysis of relationships among climate forcing and time-integrated NDVI of grasslands over the US northern and central Great Plains. Remote Sens. Environ. 1998, 65, 25–37. [Google Scholar] [CrossRef]
  19. Weiss, J.L.; Gutzler, D.S.; Coonrod, J.E.; Dahm, C.N. Long-term vegetation monitoring with NDVI in a diverse semi-arid setting, central New Mexico, USA. J. Arid. Environ. 2004, 58, 249–272. [Google Scholar] [CrossRef]
  20. Song, Y.; Ma, M.; Veroustraete, F. Comparison and conversion of AVHRR GIMMS and SPOT VEGETATION NDVI data in China. Int. J. Remote Sens. 2010, 31, 2377–2392. [Google Scholar] [CrossRef]
  21. Jin, X.M.; Guo, R.H.; Zhang, Q.; Zhou, Y.X.; Zhang, D.R.; Yang, Z. Response of vegetation pattern to different landform and water-table depth in Hailiutu river basin, northwestern China. Environ. Earth Sci. 2014, 71, 4889–4898. [Google Scholar] [CrossRef]
  22. Tong, S.; Zhang, J.; Bao, Y.; Lai, Q.; Lian, X.; Li, N.; Bao, Y. Analyzing vegetation dynamic trend on the Mongolian Plateau based on the Hurst exponent and influencing factors from 1982–2013. J. Geogr. Sci. 2018, 28, 595–610. [Google Scholar] [CrossRef]
  23. Monteleone, B.; Borzí, I.; Arosio, M.; Cesarini, L.; Bonaccorso, B.; Martina, M. Modelling the response of wheat yield to stage-specific water stress in the Po Plain. Agric. Water Manag. 2023, 287, 108444. Available online: https://www.sciencedirect.com/science/article/pii/S0378377423003098 (accessed on 3 May 2023). [CrossRef]
  24. Moradi, E.; Darabi, H.; Alamdarloo, E.H.; Karimi, M.; Kløve, B. Vegetation vulnerability to hydrometeorological stresses in water-scarce areas using machine learning and remote sensing techniques. Ecol. Inform. 2023, 73, 101838. Available online: https://www.sciencedirect.com/science/article/pii/S1574954122002886 (accessed on 3 May 2023). [CrossRef]
  25. Hatfield, J.L.; Prueger, J.H. Temperature extremes: Effect on plant growth and development. Weather. Clim. Extrem. 2015, 10, 4–10. Available online: https://www.sciencedirect.com/science/article/pii/S2212094715300116 (accessed on 3 May 2023). [CrossRef]
  26. Richardson, A.D.; Keenan, T.F.; Migliavacca, M.; Ryu, Y.; Sonnentag, O.; Toomey, M. Climate change, phenology, and phenological control of vegetation feedbacks to the climate system. Agric. For. Meteorol. 2013, 169, 156–173. Available online: https://www.sciencedirect.com/science/article/pii/S0168192312002869 (accessed on 3 May 2023). [CrossRef]
  27. Li, H.; Liu, L.; Liu, X.; Li, X.; Xu, Z. Greening implication inferred from vegetation dynamics interacted with climate change and human activities over the Southeast Qinghai–Tibet Plateau. Remote Sens. 2019, 11, 2421. [Google Scholar] [CrossRef]
  28. Li, H.R.; Ma, S.; Zhang, M.; Yin, Y.K.; Wang, L.J.; Jiang, J. Determinants of ecological functional zones in the Qinghai-Tibet Plateau ecological shelter at different scales in 2000 and 2015: From the perspective of ecosystem service bundles. Ecol. Indic. 2023, 154, 110743. Available online: https://www.sciencedirect.com/science/article/pii/S1470160X23008853 (accessed on 3 May 2023). [CrossRef]
  29. Wu, J.; Loucks, O.L. From balance of nature to hierarchical patch dynamics: A paradigm shift in ecology. Q. Rev. Biol. 1995, 70, 439–466. [Google Scholar] [CrossRef]
  30. Weltzin, J.F.; Loik, M.E.; Schwinning, S.; Williams, D.G.; Fay, P.A.; Haddad, B.M.; Harte, J.; Huxman, T.E.; Knapp, A.K.; Lin, G.; et al. Assessing the response of terrestrial ecosystems to potential changes in precipitation. Bioscience 2003, 53, 941–952. [Google Scholar] [CrossRef]
  31. Jiang, L.; Bao, A.; Guo, H.; Ndayisaba, F. Vegetation dynamics and responses to climate change and human activities in Central Asia. Sci. Total Environ. 2017, 599, 967–980. Available online: https://www.sciencedirect.com/science/article/pii/S0048969717311087 (accessed on 4 May 2023). [CrossRef] [PubMed]
  32. Ge, W.; Deng, L.; Wang, F.; Han, J. Quantifying the contributions of human activities and climate change to vegetation net primary productivity dynamics in China from 2001 to 2016. Sci. Total Environ. 2021, 773, 145648. Available online: https://www.sciencedirect.com/science/article/pii/S0048969721007166 (accessed on 4 May 2023). [CrossRef] [PubMed]
  33. Li, J.; Song, C.; Cao, L.; Zhu, F.; Meng, X.; Wu, J. Impacts of landscape structure on surface urban heat islands: A case study of Shanghai, China. Remote Sens. Environ. 2011, 115, 3249–3263. Available online: https://www.sciencedirect.com/science/article/pii/S0034425711002525 (accessed on 4 May 2023). [CrossRef]
  34. Weng, Q. Remote sensing of impervious surfaces in the urban areas: Requirements, methods, and trends. Remote Sens. Environ. 2012, 117, 34–49. Available online: https://www.sciencedirect.com/science/article/pii/S0034425711002811 (accessed on 4 May 2023). [CrossRef]
  35. Aronson, M.F.; La Sorte, F.A.; Nilon, C.H.; Katti, M.; Goddard, M.A.; Lepczyk, C.A.; Warren, P.S.; Williams, N.S.; Cilliers, S.; Clarkson, B.; et al. A global analysis of the impacts of urbanization on bird and plant diversity reveals key anthropogenic drivers. Proc. R. Soc. B Biol. Sci. 2014, 281, 20133330. [Google Scholar] [CrossRef] [PubMed]
  36. McNeill, J.R.; Engelke, P. The Great Acceleration: An Environmental History of the Anthropocene Since 1945; Harvard University Press: Boston, MA, USA, 2016. [Google Scholar]
  37. Zhou, X.; Wang, Y.C. Spatial–temporal dynamics of urban green space in response to rapid urbanization and greening policies. Landsc. Urban Plan. 2011, 100, 268–277. Available online: https://www.sciencedirect.com/science/article/pii/S0169204611000223 (accessed on 4 May 2023). [CrossRef]
  38. Long, H.; Liu, Y.; Hou, X.; Li, T.; Li, Y. Effects of land use transitions due to rapid urbanization on ecosystem services: Implications for urban planning in the new develo** area of China. Habitat Int. 2014, 44, 536–544. Available online: https://www.sciencedirect.com/science/article/pii/S0197397514001490 (accessed on 4 May 2023). [CrossRef]
  39. Konrad, C.P.; Booth, D.B. Hydrologic changes in urban streams and their ecological significance. Am. Fish. Soc. Symp. 2005, 47, 17. Available online: https://www.academia.edu/download/37039485/Konrad_and_Booth_2005.pdf (accessed on 4 May 2023).
  40. Vicente-Serrano, S.M.; Camarero, J.J.; Olano, J.M.; Martín-Hernández, N.; Peña-Gallardo, M.; Tomás-Burguera, M.; Gazol, A.; Azorin-Molina, C.; Bhuyan, U.; El Kenawy, A. Diverse relationships between forest growth and the Normalized Difference Vegetation Index at a global scale. Remote Sens. Environ. 2016, 187, 14–29. Available online: https://www.sciencedirect.com/science/article/pii/S003442571630373X (accessed on 4 May 2023). [CrossRef]
  41. Berner, L.T.; Beck, P.S.; Bunn, A.G.; Lloyd, A.H.; Goetz, S.J. High-latitude tree growth and satellite vegetation indices: Correlations and trends in Russia and Canada (1982–2008). J. Geophys. Res. Biogeosci. 2011, 116, 1–13. [Google Scholar] [CrossRef]
  42. Ericson, T. The statistical model and nuclear level densities. Adv. Phys. 1960, 9, 425–511. [Google Scholar] [CrossRef]
  43. Castenholz, R.W. Thermophilic blue-green algae and the thermal environment. Bacteriol. Rev. 1969, 33, 476–504. Available online: https://journals.asm.org/doi/pdf/10.1128/br.33.4.476-504.1969 (accessed on 4 May 2023). [CrossRef] [PubMed]
  44. Scott, L.M.; Janikas, M.V. Spatial Statistics in ArcGIS[M]//Handbook of Applied Spatial Analysis: Software Tools, Methods and Applications; Springer: Berlin/Heidelberg, Germany, 2009; pp. 27–41. Available online: https://springer.dosf.top/chapter/10.1007/978-3-642-03647-7_2 (accessed on 4 May 2023).
  45. Harding, D.J.; Carabajal, C.C. ICESat waveform measurements of within-footprint topographic relief and vegetation vertical structure. Geophys. Res. Lett. 2005, 32, 1–4. [Google Scholar] [CrossRef]
  46. Zhang, Y.; Shao, Z. Assessing of urban vegetation biomass in combination with LiDAR and high-resolution remote sensing images. Int. J. Remote Sens. 2021, 42, 964–985. [Google Scholar] [CrossRef]
  47. Yang, S.; Ge, M.; Li, X.; Pan, C. The spatial distribution of the normal reference values of the activated partial thromboplastin time based on ArcGIS and GeoDA. Int. J. Biometeorol. 2020, 64, 779–790. Available online: https://springer.dosf.top/article/10.1007/s00484-020-01868-2 (accessed on 4 May 2023). [CrossRef] [PubMed]
  48. Silleos, N.G.; Alexandridis, T.K.; Gitas, I.Z.; Perakis, K. Vegetation indices: Advances made in biomass estimation and vegetation monitoring in the last 30 years. Geocarto Int. 2006, 21, 21–28. [Google Scholar] [CrossRef]
  49. Pechanec, V.; Mráz, A.; Benc, A.; Cudlín, P. Analysis of spatiotemporal variability of C-factor derived from remote sensing data. J. Appl. Remote Sens. 2018, 12, 016022. [Google Scholar] [CrossRef]
  50. Chan, K.W. Misconceptions and complexities in the study of China’s cities: Definitions, statistics, and implications. Eurasian Geogr. Econ. 2007, 48, 383–412. [Google Scholar] [CrossRef]
  51. Wang, X.; Xie, H.; Guan, H.; Zhou, X. Different responses of MODIS-derived NDVI to root-zone soil moisture in semi-arid and humid regions. J. Hydrol. 2007, 340, 12–24. Available online: https://www.sciencedirect.com/science/article/pii/S0022169407002004 (accessed on 4 May 2023). [CrossRef]
  52. Zhang, Y.; Lu, Y.; Song, X. Identifying the Main Factors Influencing Significant Global Vegetation Changes. Forests 2023, 14, 1607. [Google Scholar] [CrossRef]
  53. Fenu, G.; Carboni, M.; Acosta, A.T.R.; Bacchetta, G. Environmental factors influencing coastal vegetation pattern: New insights from the Mediterranean Basin. Folia Geobot. 2013, 48, 493–508. Available online: https://springer.dosf.top/article/10.1007/s12224-012-9141-1 (accessed on 4 May 2023). [CrossRef]
  54. Luo, J.; Fu, H. Constructing an urban cooling network based on PLUS model: Implications for future urban planning. Ecol. Indic. 2023, 154, 110887. Available online: https://www.sciencedirect.com/science/article/pii/S1470160X23010294 (accessed on 4 May 2023). [CrossRef]
  55. Kafle, S.C. Correlation and regression analysis using SPSS. Manag. Technol. Soc. Sci. 2019, 126. Available online: https://journal.oxfordcollege.edu.np/file/1681898552journal-1.pdf#page=126 (accessed on 4 May 2023).
  56. Weir, J.P. Quantifying test-retest reliability using the intraclass correlation coefficient and the SEM. J. Strength Cond. Res. 2005, 19, 231–240. Available online: https://journals.lww.com/nsca-jscr/abstract/2005/02000/quantifying_test_retest_reliability_using_the.38.aspx (accessed on 5 May 2023). [PubMed]
  57. Zhao, X.; Ma, X.; Chen, B.; Shang, Y.; Song, M. Challenges toward carbon neutrality in China: Strategies and countermeasures. Resour. Conserv. Recycl. 2022, 176, 105959. Available online: https://www.sciencedirect.com/science/article/pii/S0921344921005681 (accessed on 5 May 2023). [CrossRef]
  58. Ke, N.; Lu, X.; Zhang, X.; Kuang, B.; Zhang, Y. Urban land use carbon emission intensity in China under the “double carbon” targets: Spatiotemporal patterns and evolution trend. Environ. Sci. Pollut. Res. 2023, 30, 18213–18226. Available online: https://springer.dosf.top/article/10.1007/s11356-022-23294-0 (accessed on 5 May 2023). [CrossRef]
  59. Kumar, P.; Geneletti, D.; Nagendra, H. Spatial assessment of climate change vulnerability at city scale: A study in Bangalore, India. Land Use Policy 2016, 58, 514–532. Available online: https://www.sciencedirect.com/science/article/pii/S0264837716301363 (accessed on 5 May 2023). [CrossRef]
  60. He, J.; Shi, X.; Fu, Y. Identifying vegetation restoration effectiveness and driving factors on different micro-topographic types of hilly Loess Plateau: From the perspective of ecological resilience. J. Environ. Manag. 2021, 289, 112562. Available online: https://www.sciencedirect.com/science/article/pii/S0301479721006241 (accessed on 5 May 2023). [CrossRef]
  61. Butun, I.; Österberg, P.; Song, H. Security of the Internet of Things: Vulnerabilities, attacks, and countermeasures. IEEE Commun. Surv. Tutor. 2019, 22, 616–644. [Google Scholar] [CrossRef]
  62. Hyman, J.B.; Leibowitz, S.G. A general framework for prioritizing land units for ecological protection and restoration. Environ. Manag. 2000, 25, p23. [Google Scholar] [CrossRef]
  63. Wang, S.; Xiao, S.; Lu, X.; Zhang, Q. North–south regional differential decomposition and spatiotemporal dynamic evolution of China’s industrial green total factor productivity. Environ. Sci. Pollut. Res. 2023, 30, 37706–37725. Available online: https://springer.dosf.top/article/10.1007/s11356-022-24697-9 (accessed on 5 May 2023). [CrossRef] [PubMed]
  64. Dow, K. Exploring differences in our common future(s): The meaning of vulnerability to global environmental change. Geoforum 1992, 23, 417–436. Available online: https://www.sciencedirect.com/science/article/pii/0016718592900526 (accessed on 5 May 2023). [CrossRef]
  65. Li, M.S. Ecological restoration of mineland with particular reference to the metalliferous mine wasteland in China: A review of research and practice. Sci. Total Environ. 2006, 357, 38–53. Available online: https://www.sciencedirect.com/science/article/pii/S0048969705003712 (accessed on 6 May 2023). [CrossRef]
  66. Hobbs, R.J.; Harris, J.A. Restoration ecology: Repairing the earth’s ecosystems in the new millennium. Restor. Ecol. 2001, 9, 239–246. [Google Scholar] [CrossRef]
  67. Kang, L.; Han, X.; Zhang, Z.; Sun, O.J. Grassland ecosystems in China: Review of current knowledge and research advancement. Philos. Trans. R. Soc. B Biol. Sci. 2007, 362, 997–1008. [Google Scholar] [CrossRef]
  68. Chel, A.; Kaushik, G. Renewable energy for sustainable agriculture. Agron. Sustain. Dev. 2011, 31, 91–118. Available online: https://springer.dosf.top/article/10.1051/agro/2010029 (accessed on 6 May 2023). [CrossRef]
  69. Qi, Y.; Ma, L.; Zhang, H.; Li, H. Translating a global issue into local priority: China’s local government response to climate change. J. Environ. Dev. 2008, 17, 379–400. [Google Scholar] [CrossRef]
  70. Gann, G.D.; McDonald, T.; Walder, B.; Aronson, J.; Nelson, C.R.; Jonson, J.; Hallett, J.G.; Eisenberg, C.; Guariguata, M.R.; Liu, J.; et al. International principles and standards for the practice of ecological restoration. Restor. Ecol. 2019, 27, S1–S46. Available online: https://espace.curtin.edu.au/handle/20.500.11937/88522 (accessed on 6 May 2023). [CrossRef]
  71. Elmqvist, T.; Setälä, H.; Handel, S.N.; van der Ploeg, S.; Aronson, J.; Blignaut, J.N.; Gómez-Baggethun, E.; Nowak, D.J.; Kronenberg, J.; de Groot, R. Benefits of restoring ecosystem services in urban areas. Curr. Opin. Environ. Sustain. 2015, 14, 101–108. Available online: https://www.sciencedirect.com/science/article/pii/S1877343515000433 (accessed on 6 May 2023). [CrossRef]
  72. Zhang, Z.; Huisingh, D. Combating desertification in China: Monitoring, control, management and revegetation. J. Clean. Prod. 2018, 182, 765–775. Available online: https://www.sciencedirect.com/science/article/pii/S0959652618302646 (accessed on 6 May 2023). [CrossRef]
Figure 1. Distribution of NDVI total in various provinces in China.
Forests 15 00668 g001
Figure 2. Distribution of growth rate of green vegetation in various provinces in China.
Forests 15 00668 g002
Figure 3. Distribution of green vegetation index in Chinese counties and districts.
Forests 15 00668 g003
Figure 4. Index of urban vegetation shrinkage and growth in China from 2000 to 2022.
Forests 15 00668 g004
Figure 5. Distribution of vegetation contraction kernel density in Chinese cities.
Forests 15 00668 g005
Figure 6. Distribution of vegetation growth kernel density in Chinese cities.
Forests 15 00668 g006
Figure 7. Growth and shrinkage trends of urban green vegetation in China.
Forests 15 00668 g007
Figure 8. Standardized residual histogram.
Forests 15 00668 g008
Table 1. Multiple linear regression analysis of urban vegetation index and related influencing variables in China.
ModelClassification of IndicatorsVariableBTSig.VIF
Model 1:
(Dependent variable: Urban vegetation index)
(constant)0.7775145.1600.000
Urban populationAverage annual population of the city /104 people (X1)0.000146.0360.0001.300
Urban sizeLand area of administrative regions in the city /104 km2 (X2)−0.01791−8.2870.0001.094
Urban economicPer capita GDP of the city/104 CNY (X3) −0.01130−4.9580.0001.583
Urban agricultureThe proportion of employees in the primary industry in the city/% (X4)0.005183.7740.0001.080
Urban industrialIndustrial electricity consumption throughout the city/100 million kWh (X5)−0.00024−4.1520.0001.968
Urban water resourcesThe total amount of water resources in the city/100 million cubic meters (X6)0.000102.7390.0071.066
Urban emissionsIndustrial sulfur dioxide emissions in the city/104 tons (X7)−0.02609−2.8850.0043.615
Industrial nitrogen oxide emissions in the city/104 tons (X8)0.028483.3390.0013.888
Disclaimer/Publisher’s Note: The statements, opinions and data contained in all publications are solely those of the individual author(s) and contributor(s) and not of MDPI and/or the editor(s). MDPI and/or the editor(s) disclaim responsibility for any injury to people or property resulting from any ideas, methods, instructions or products referred to in the content.

