
Evolutionary Characterization of tubulin Gene Family in the Desert Biomass Willow (Salix psammophila) and Expression of the β-tubulin Gene SpsTUB10 during Different Stresses


 and
and 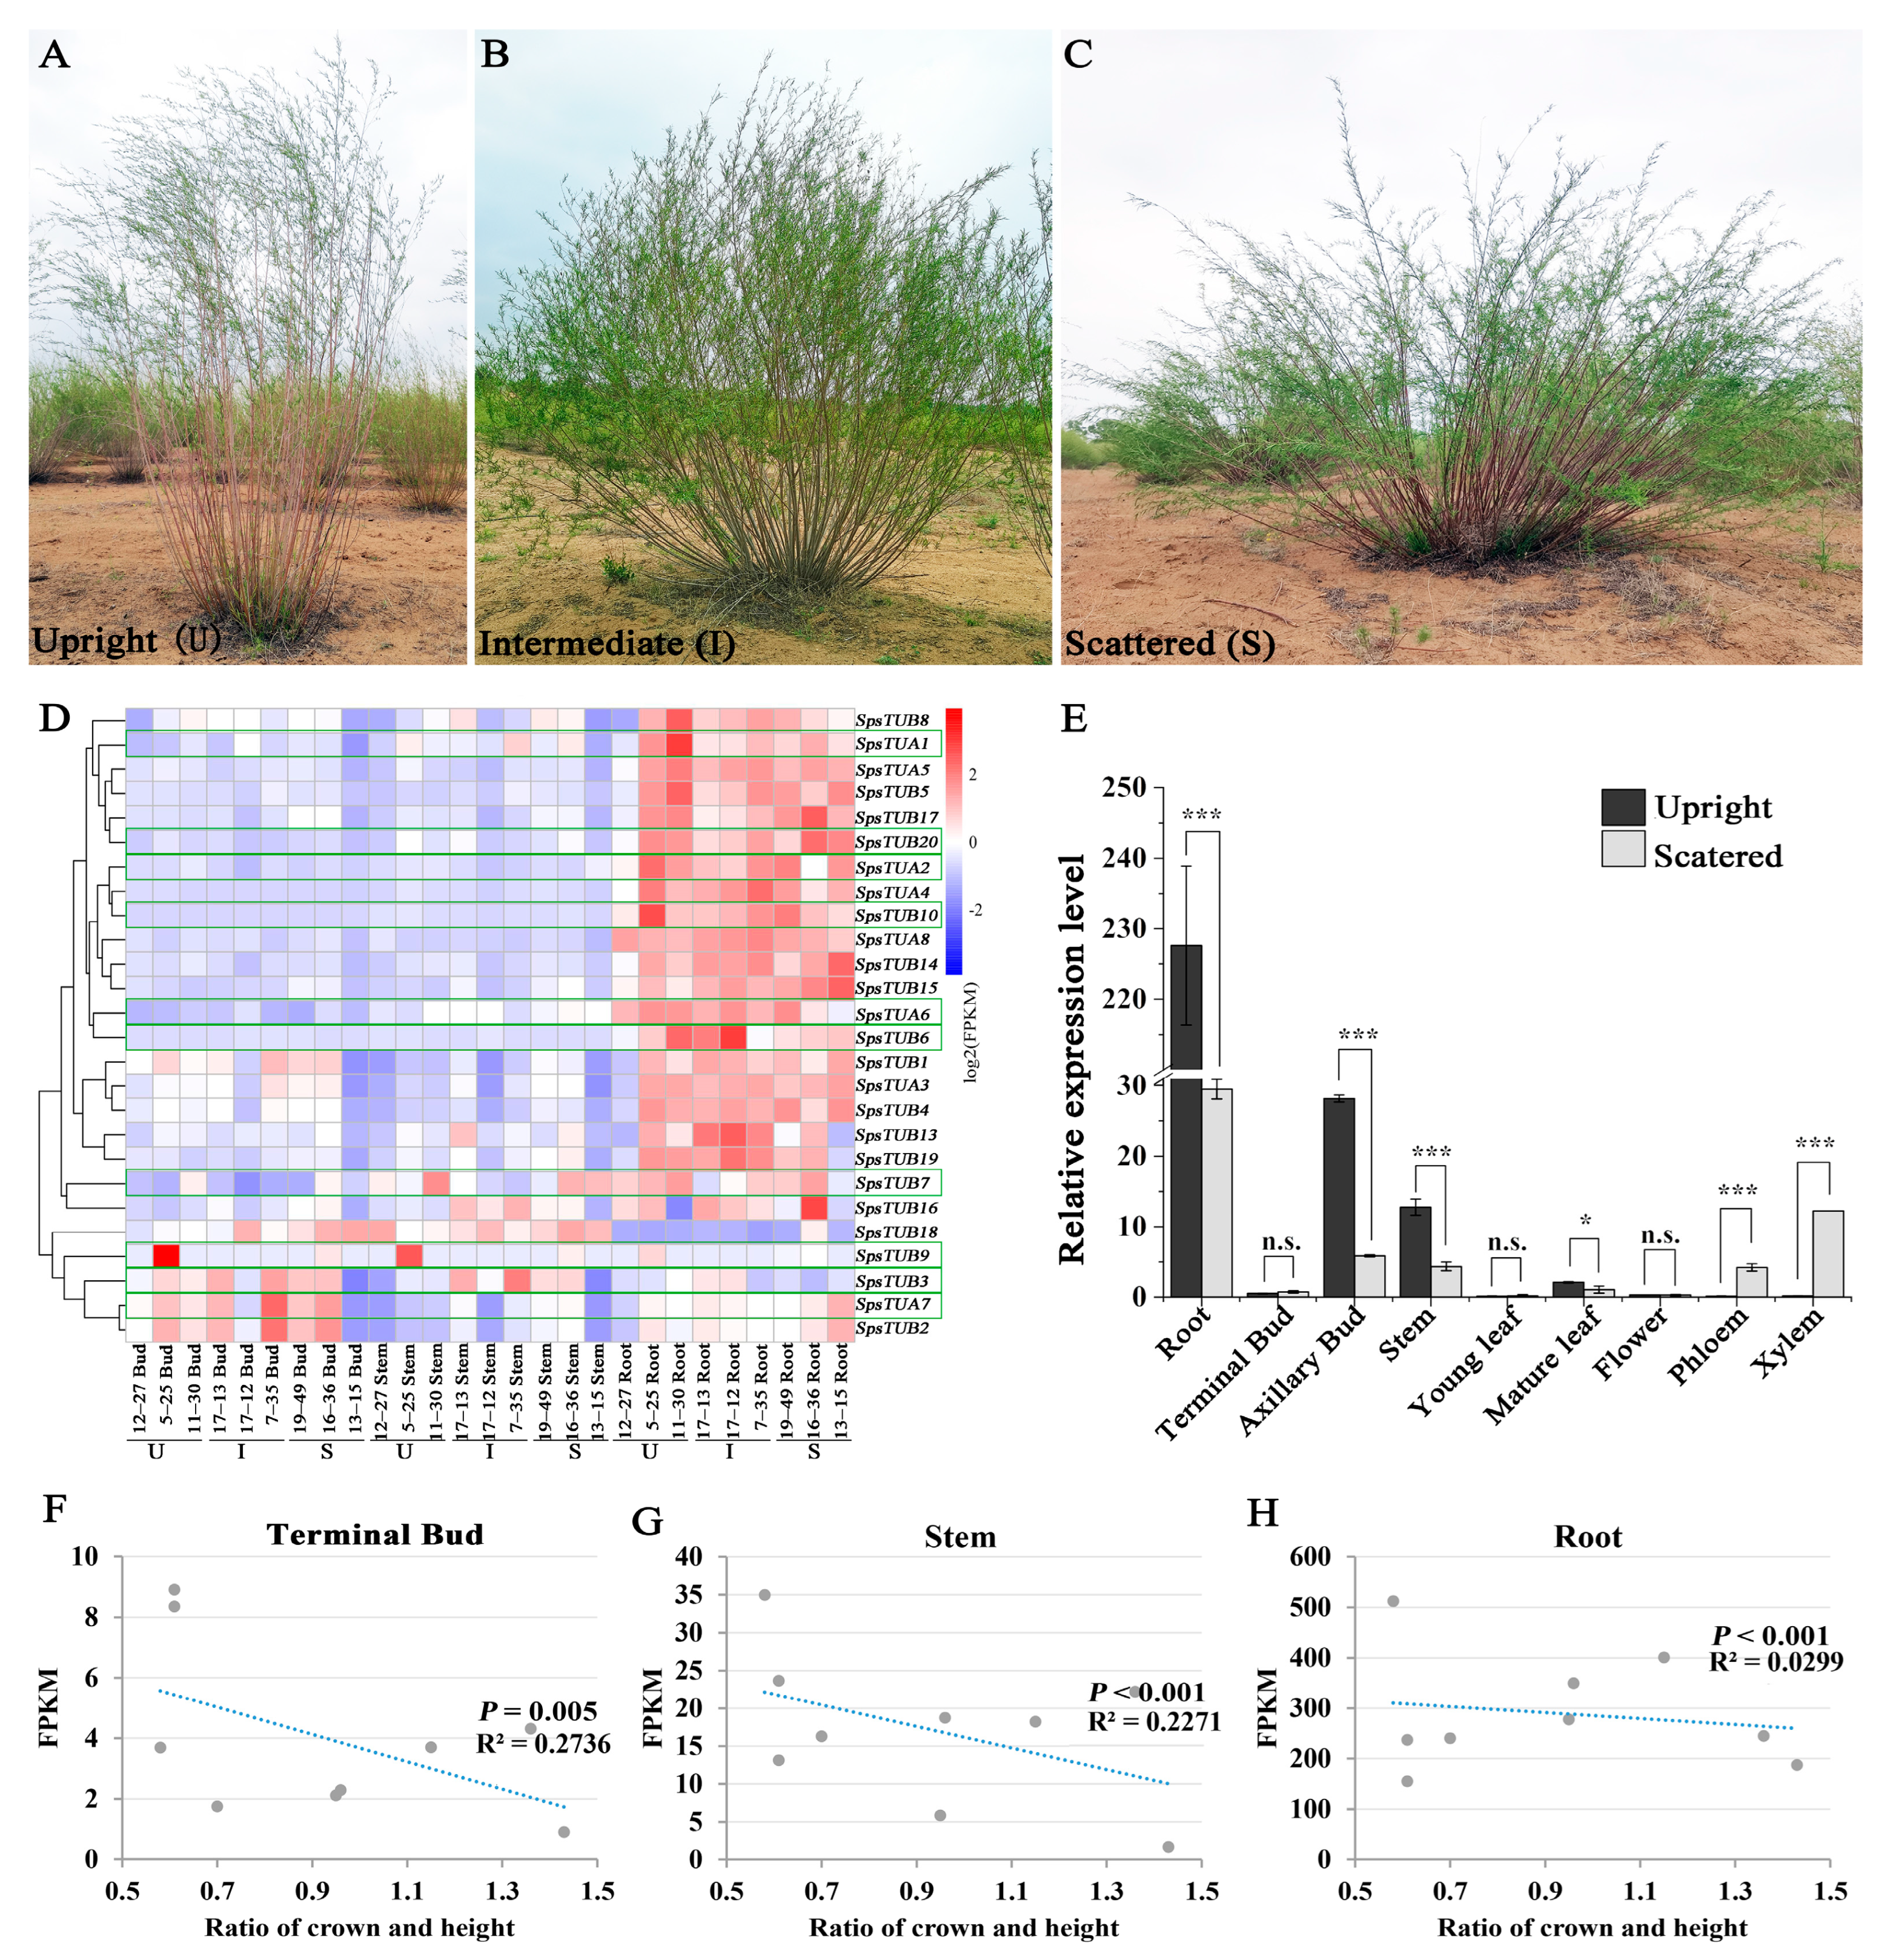
Abstract
:1. Introduction
2. Materials and Methods
2.1. Plant Materials
2.2. Plant Organ Collection and RNA-Sequencing
2.3. Identification of the Tubulin Genes Using the RNA-Seq Data
2.4. Expression Profiles of the SpsTubulin Genes and the Phylogenetic Analysis
2.5. Sequence Analysis and Structural Characterization of SpsTUB10
2.6. Relative Expression Levels of SpsTUB10 under Different Stress Treatments
3. Results
3.1. Transcriptome Sequencing and Expression Profiles of SpsTubulin Genes
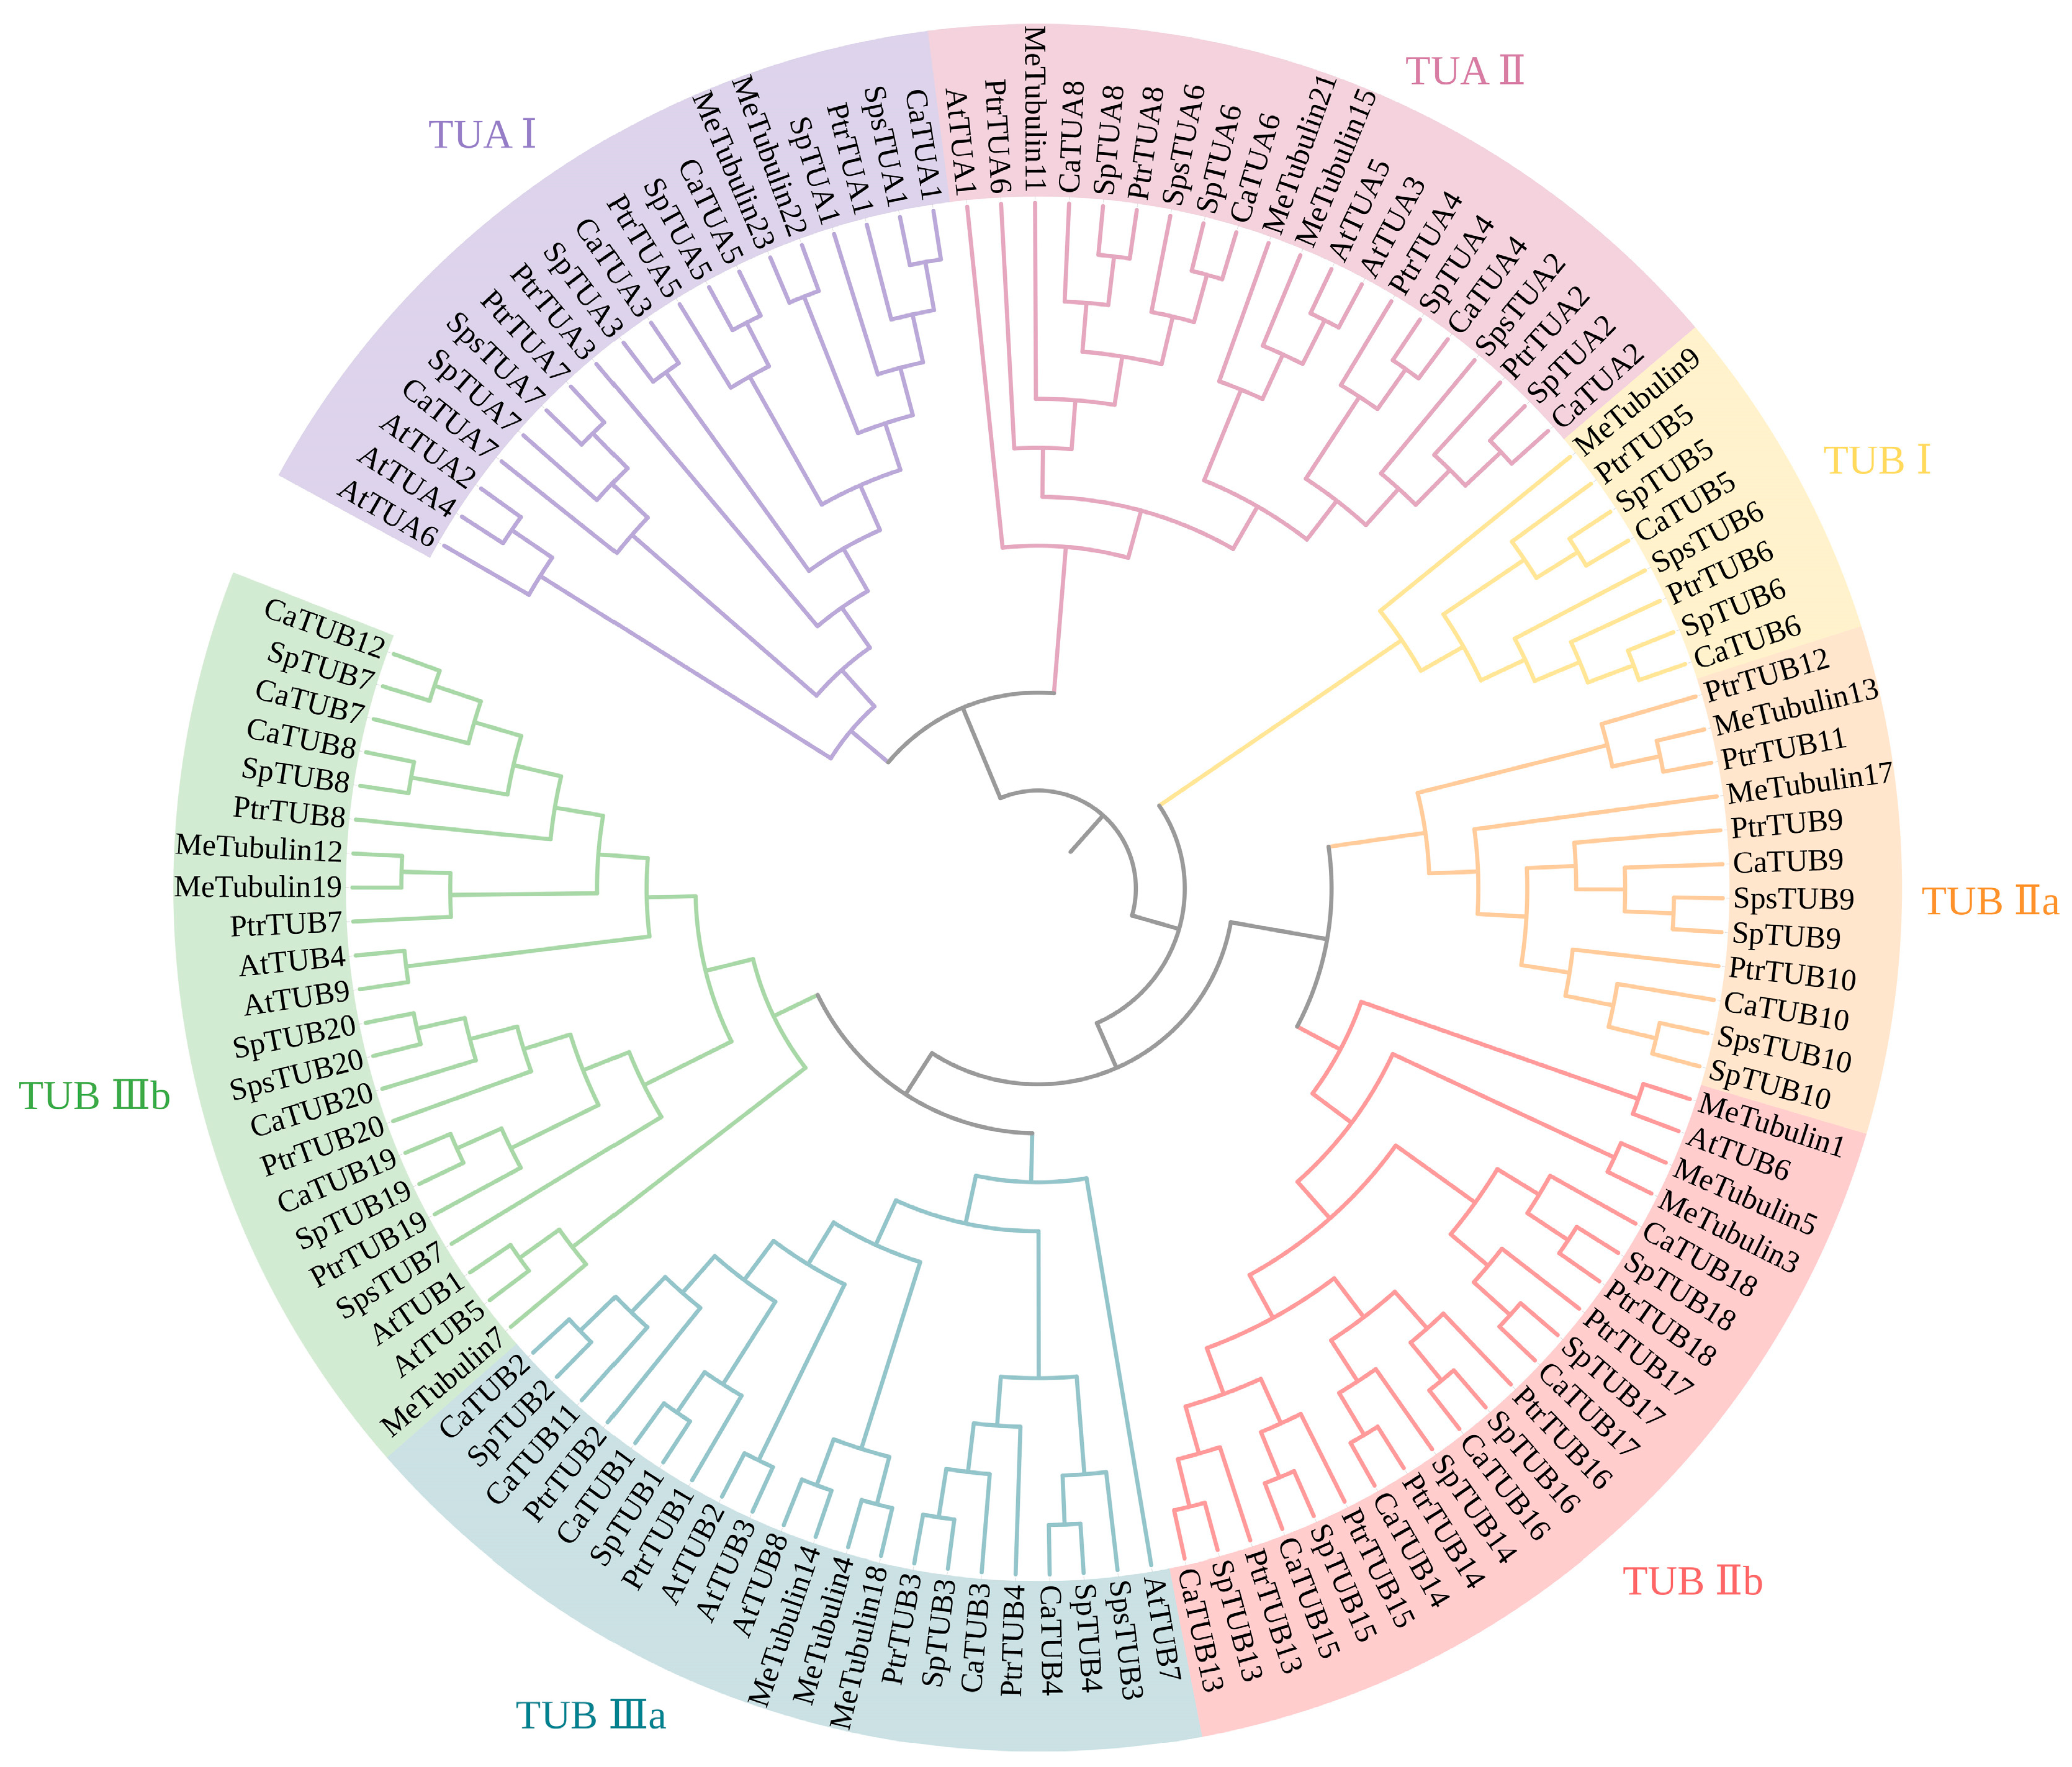
3.2. Phylogenetic Analysis of the SpsTubulin Genes
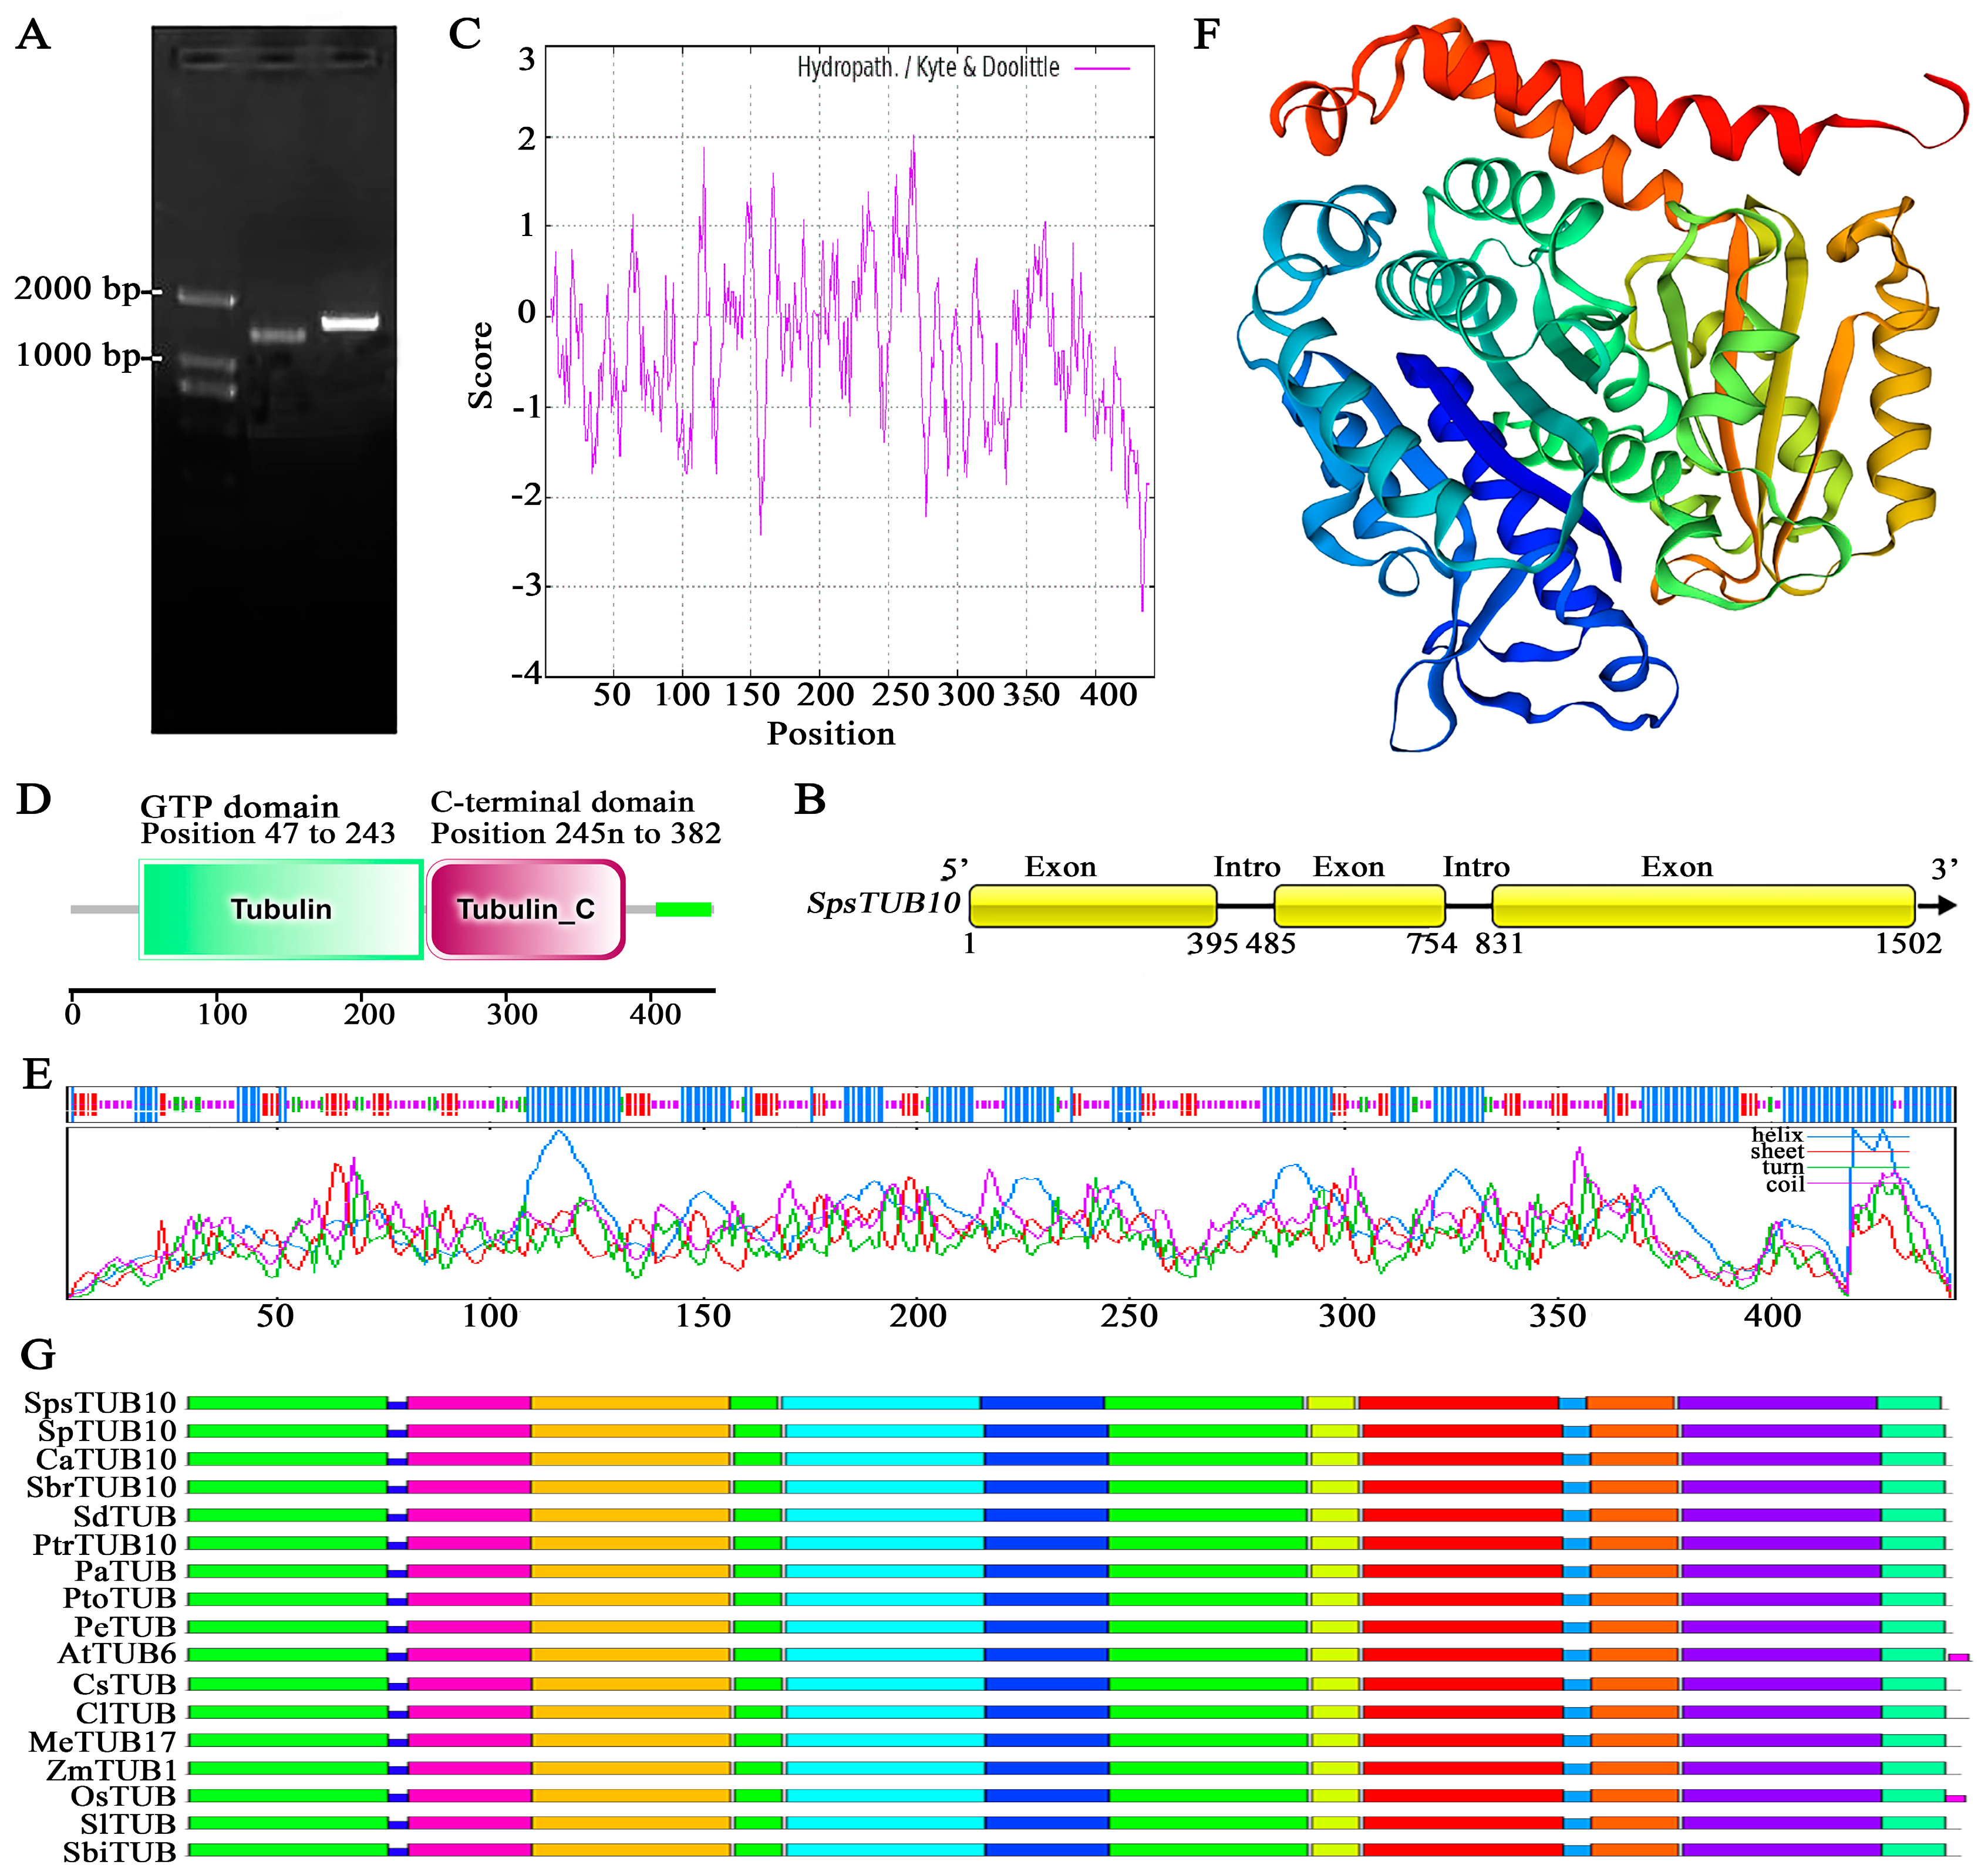
3.3. Cloning, Sequence, and Structural Analyses of SpsTUB10
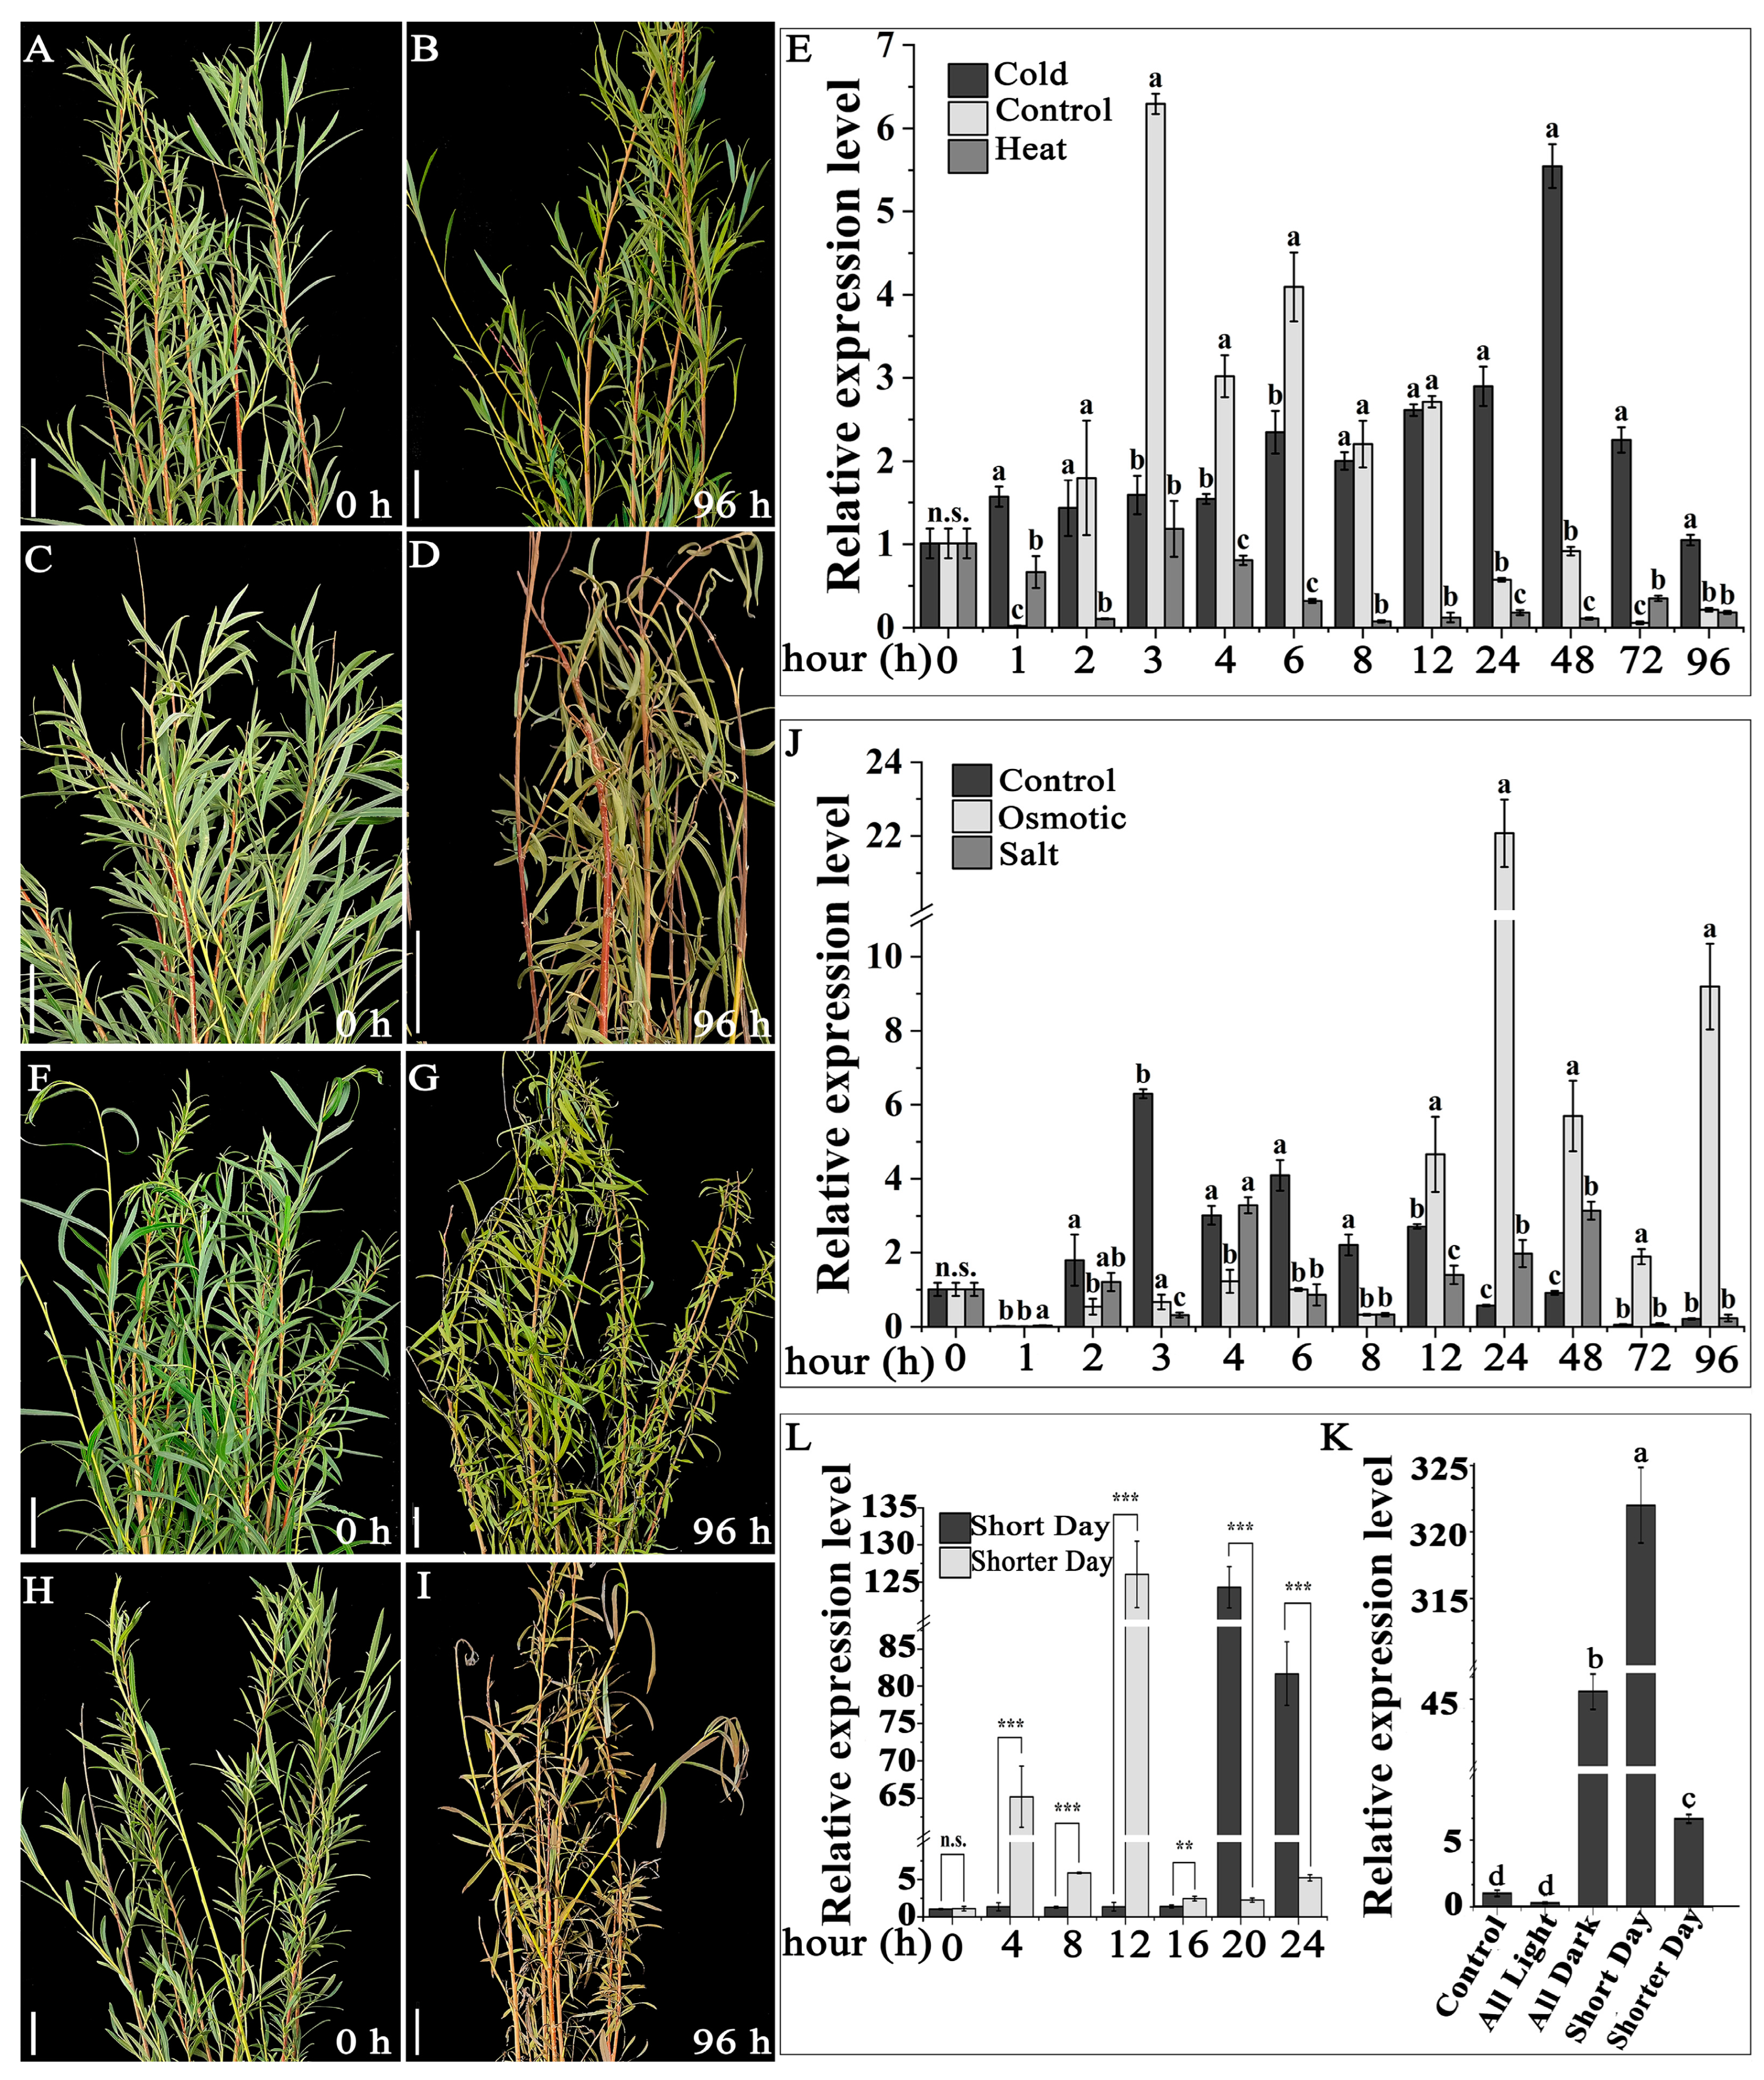
3.4. Expression of the SpsTUB10 Gene under Various Abiotic Stresses
4. Discussion
5. Conclusions
Supplementary Materials
Author Contributions
Funding
Data Availability Statement
Acknowledgments
Conflicts of Interest
References
- Barthélémy, D.; Caraglio, Y. Plant architecture: A dynamic, multilevel and comprehensive approach to plant form, structure and ontogeny. Ann. Bot. 2007, 99, 375–407. [Google Scholar] [CrossRef] [PubMed]
- Wasteneys, G.O. Progress in understanding the role of microtubules in plant cells. Curr. Opin. Plant Biol. 2004, 7, 651–660. [Google Scholar] [CrossRef] [PubMed]
- Ledbetter, M.C.; Porter, K.R. A “microtubule” in plant cell fine structure. J. Cell Biol. 1963, 19, 239–250. [Google Scholar] [CrossRef] [PubMed]
- Dutcher, S.K. The tubulin fraternity: Alpha to eta. Curr. Opin. Cell Biol. 2001, 13, 49–54. [Google Scholar] [CrossRef] [PubMed]
- Nogales, E.; Wolf, S.G.; Downing, K.H. Structure of the αβ tubulin dimer by electron crystallography. Nature 1998, 391, 199–203. [Google Scholar] [CrossRef] [PubMed]
- Bondstar, J.F.; Fridovich-Keil, J.L.; Pillus, L.; Mulligan, R.C.; Solomon, F. A chicken-yeast chimeric β-tubulin protein is incorporated into mouse microtubules in vivo. Cell 1986, 44, 461–468. [Google Scholar]
- Anthony, R.G.; Hussey, P.J. Dinitroaniline herbicide resistance and the microtubule cytoskeleton. Trends Plant Sci. 1999, 4, 112–116. [Google Scholar] [CrossRef]
- Onelli, E.; Idilli, A.I.; Moscatelli, A. Emerging roles for microtubules in angiosperm pollen tube growth highlight new research cues. Front. Plant Sci. 2015, 6, 51. [Google Scholar] [CrossRef]
- Paredez, A.; Somerville, C.; Ehrhardt, D. Visualization of cellulose synthase demonstrates functional association with microtubules. Science 2006, 312, 1491–1495. [Google Scholar] [CrossRef]
- Chen, X.; Grandont, L.; Li, H.; Hauschild, R.; Paque, S.; Abuzeineh, A.; Ralcusova, H.; Benkova, E.; Perrot-Rechenmann, C.; Friml, J. Inhibition of cell expansion by rapid ABP1-mediated auxin effect on microtubules. Nature 2014, 516, 90–93. [Google Scholar] [CrossRef]
- Rao, G.; Zeng, Y.; He, C.; Zhang, J. Characterization and putative post-translational regulation of α- and β-tubulin gene families in Salix arbutifolia. Sci. Rep. 2016, 6, 19258. [Google Scholar] [CrossRef] [PubMed]
- Zhou, R.; Macaya-Sanz, D.; Carlson, C.H.; Schmutz, J.; Jenkins, J.W.; Kudrna, D.; Sharma, A.; Sandor, L.; Shu, S.; Barry, K.; et al. A willow sex chromosome reveals convergent evolution of complex palindromic repeats. Genome Biol. 2020, 21, 38. [Google Scholar] [CrossRef] [PubMed]
- Li, S.; Cao, P.; Wang, C.; Guo, J.; Zang, Y.; Wu, K.; Ran, F.; Liu, L.; Wang, D.; Min, Y. Genome-wide analysis of tubulin gene family in cassava and expression of family member FtsZ2-1 during various stress. Plants 2021, 10, 668. [Google Scholar] [CrossRef] [PubMed]
- Li, S.; Lei, L.; Somerville, C.; Gu, Y. Cellulose synthase interactive protein 1 (CSI1) links microtubules and cellulose synthase complexes. Proc. Natl. Acad. Sci. USA 2012, 109, 185–190. [Google Scholar] [CrossRef] [PubMed]
- Oakley, R.V.; Wang, Y.S.; Ramakrishna, W.; Harding, S.A.; Tsai, C.J. Differential expansion and expression of α- and β-tubulin gene families in Populus. Plant Physiol. 2007, 145, 961–973. [Google Scholar] [CrossRef] [PubMed]
- Chu, B.; Snustad, D.P.; Carter, J.V. Alteration of β-tubulin gene expression during low-temperature exposure in leaves of Arabidopsis thaliana. Plant Physiol. 1993, 103, 371–377. [Google Scholar] [CrossRef] [PubMed]
- Leu, W.M.; Cao, X.L.; Wilson, T.J.; Snustad, D.P.; Chua, N.H. Phytochrome A and phytochrome B mediate the hypocotyl-specific downregulation of TUB1 by light in Arabidopsis. Plant Cell 1995, 7, 2187–2196. [Google Scholar]
- Jongewaard, I.; Colon, A.; Fosket, D.E. Distribution of transcripts of the tubB1 gene in developing soybean (Glycine max [L.] Merr.) seedling organs. Protoplasma 1994, 18, 77–85. [Google Scholar] [CrossRef]
- Temel, A.; Gozukirmizi, N. Salinity-induced physiological and molecular changes in barley and wheat. Procedia Environ. Sci. 2015, 175, 2950–2960. [Google Scholar] [CrossRef]
- Ma, X.Y.; Jia, F.X.; Zhao, Y.L.; Zhao, J.C. Reference genes screening for quantitative real-time PCR in barley under drought and salt stress. Mol. Plant Breed. 2016, 14, 3093–3101. [Google Scholar]
- Tang, X.; Zhang, N.; Si, H.; Calderón-Urrea, A. Selection and validation of reference genes for RT-QPCR analysis in potato under abiotic stress. Plant Methods 2017, 13, 85. [Google Scholar] [CrossRef] [PubMed]
- Wang, H.L.; Chen, J.H.; Tian, Q.Q.; Wang, S.; Xia, X.L.; Yin, W.L. Identification and validation of reference genes for Populus euphratica gene expression analysis during abiotic stresses by quantitative real-time PCR. Physiol. Plant. 2014, 152, 529–545. [Google Scholar] [CrossRef] [PubMed]
- Ri, X.; Yang, J.; Zhao, L.Q.; Qing, H.; Latanzhula, A.; Yao, Z.Y.; Zhu, L.; Wu, Y.H.; Tian, J.B.; Cao, X.P. Establishment, development, and decline of Salix psammophila communities: Changes in soil conditions and floristic composition in dune slacks. Glob. Ecol. Conserv. 2020, 22, e00967. [Google Scholar] [CrossRef]
- Lu, D.Y.; Zhang, G.S.; Zhang, L.; Hao, L.; Huang, H.G. Progress in the research of Salix psammophila. Mol. Plant Breed. 2020, 18, 3427–3432. [Google Scholar]
- Hao, L.H.; Zhang, L.Z.; Zhang, G.Z.; Wang, Y.W.; Han, S.H.; Bai, Y.B. Genetic diversity and population genetic structure of Salix psammophila. Acta Bot. Boreali-Occident. Sin. 2017, 37, 1507–1516. [Google Scholar]
- Zhao, K.; He, R.; Zhang, G.; Qin, F.; Yue, Y.; Li, L.; Dong, X. Screening and expression characteristics of plant type regulatory genes in Salix psammophila. Forests 2024, 15, 103. [Google Scholar] [CrossRef]
- Hao, L.; Zhang, G.S.; Mu, X.Y.; Han, S.L.; Wang, Y.; Ning, R.X.; Bai, Y.R.; Zhang, L. Phenotypic diversity of Salix psammophila populations in germplasm resources. Acta Bot. Boreali-Occident. Sin. 2017, 37, 1012–1021. [Google Scholar]
- Sui, J.K.; Rao, G.D.; Zhang, J.G. Cloning and sequence analysis of β-Tubulin Gene families in willows. Acta Bot. Boreali-Occident. Sin. 2016, 36, 0902–0909. [Google Scholar]
- Kim, D.; Ben, L.; Steven, L.S. HISAT: A fast spliced aligner with low memory requirements. Nat. Methods 2015, 12, 357–360. [Google Scholar] [CrossRef]
- Trapnell, C.; Williams, B.A.; Pertea, G.; Mortazavi, A.; Kwan, G.; van Baren, M.J.; Salzberg, S.L.; Wold, B.J.; Pachter, L. Transcript assembly and quantification by RNA-seq reveals unannotated transcripts and isoform switching during cell differentiation. Nat. Biotechnol. 2010, 28, 511–515. [Google Scholar] [CrossRef]
- Pertea, M.; Pertea, G.M.; Antonescu, C.M.; Chang, T.C.; Mendell, J.T.; Salzberg, S.L. StringTie enables improved reconstruction of a transcriptome from RNA-seq reads. Nat. Biotechnol. 2015, 33, 290–295. [Google Scholar] [CrossRef] [PubMed]
- Tamura, K.; Stecher, G.; Peterson, D.; Filipski, A.; Kumar, S. MEGA6: Molecular Evolutionary Genetics Analysis Version 6.0. Mol. Biol. Evol. 2013, 30, 2725–2729. [Google Scholar] [CrossRef]
- Jia, H.; Li, J.; Zhang, J.; Sun, P.; Lu, M.; Hu, J. The Salix psammophila SpRLCK1 involved in drought and salt tolerance. Plant Physiol. Biochem. 2019, 144, 222–233. [Google Scholar] [CrossRef] [PubMed]
- Zhu, J.K. Abiotic Stress Signaling and Responses in Plants. Cell 2016, 167, 313–324. [Google Scholar] [CrossRef] [PubMed]
- Wang, L.; Sadeghnezhad, E.; Nick, P. Upstream of gene expression: What is the role of microtubules in cold signalling? J. Exp. Bot. 2020, 71, 36–48. [Google Scholar] [CrossRef] [PubMed]
- Lloyd, C.; Hussey, P. Microtubule-associated proteins in plants—Why we need a map. Nat. Rev. Mol. Cell Biol. 2001, 2, 40–47. [Google Scholar] [CrossRef] [PubMed]
- Zhu, J.; Lee, B.H.; Dellinger, M.; Cui, X.; Zhang, C.; Wu, S.; Nothnagel, E.A.; Zhu, J.K. A cellulose synthase-like protein is required for osmotic stress tolerance in Arabidopsis. Plant J. 2010, 63, 128–140. [Google Scholar] [CrossRef]
- Zhu, J.K. Salt and drought stress signal transduction in plants. Annu. Rev. Plant Biol. 2002, 53, 247–273. [Google Scholar] [CrossRef]
- Quarrie, S.A. Genotypic differences in leaf water potential, abscisic acid and proline concentrations in spring wheat during drought stress. Ann. Bot. 1980, 46, 383–394. [Google Scholar] [CrossRef]
- Yang, H.; Zhang, L.; Li, A.; Hao, P.; Zhang, G.; Wei, D.; Fan, L.; Zhang, X.; Hu, J. Heterologous expression of SpsLAZY1a in Populus enhanced the sensitiveness of plant architecture. Ind. Crop. Prod. 2023, 197, 116572. [Google Scholar] [CrossRef]
- Thomashow, M.F. Molecular basis of plant cold acclimation: Insights gained from studying the CBF cold response pathway. Plant Physiol. 2010, 154, 571–577. [Google Scholar] [CrossRef] [PubMed]


Disclaimer/Publisher’s Note: The statements, opinions and data contained in all publications are solely those of the individual author(s) and contributor(s) and not of MDPI and/or the editor(s). MDPI and/or the editor(s) disclaim responsibility for any injury to people or property resulting from any ideas, methods, instructions or products referred to in the content. |
© 2024 by the authors. Licensee MDPI, Basel, Switzerland. This article is an open access article distributed under the terms and conditions of the Creative Commons Attribution (CC BY) license (https://creativecommons.org/licenses/by/4.0/).
Share and Cite
He, Y.; Fan, L.; Wang, R.; Han, S.; Sun, G.; Yu, F.; Yang, Q.; Yang, H.; Zhang, G. Evolutionary Characterization of tubulin Gene Family in the Desert Biomass Willow (Salix psammophila) and Expression of the β-tubulin Gene SpsTUB10 during Different Stresses. Forests 2024, 15, 696. https://doi.org/10.3390/f15040696
He Y, Fan L, Wang R, Han S, Sun G, Yu F, Yang Q, Yang H, Zhang G. Evolutionary Characterization of tubulin Gene Family in the Desert Biomass Willow (Salix psammophila) and Expression of the β-tubulin Gene SpsTUB10 during Different Stresses. Forests. 2024; 15(4):696. https://doi.org/10.3390/f15040696
Chicago/Turabian StyleHe, Yujiao, Lijiao Fan, Ruiping Wang, Shengli Han, Guirong Sun, Fengqiang Yu, Qi Yang, Haifeng Yang, and Guosheng Zhang. 2024. "Evolutionary Characterization of tubulin Gene Family in the Desert Biomass Willow (Salix psammophila) and Expression of the β-tubulin Gene SpsTUB10 during Different Stresses" Forests 15, no. 4: 696. https://doi.org/10.3390/f15040696