
Attraction and Retention Green Place Images of Taipei City


Abstract
1. Introduction
2. Literature Review
2.1. Greenspace Place Image
2.1.1. Greenspace Place Brand (PB)
2.1.2. Greenspace Visual Image (VI)
2.1.3. Greenspace Place Reputation (PR)
2.1.4. Greenspace Sense of Place (SOP)
2.1.5. Greenspace Place Identity (PI)
2.2. Four Types of Urban Greenspace
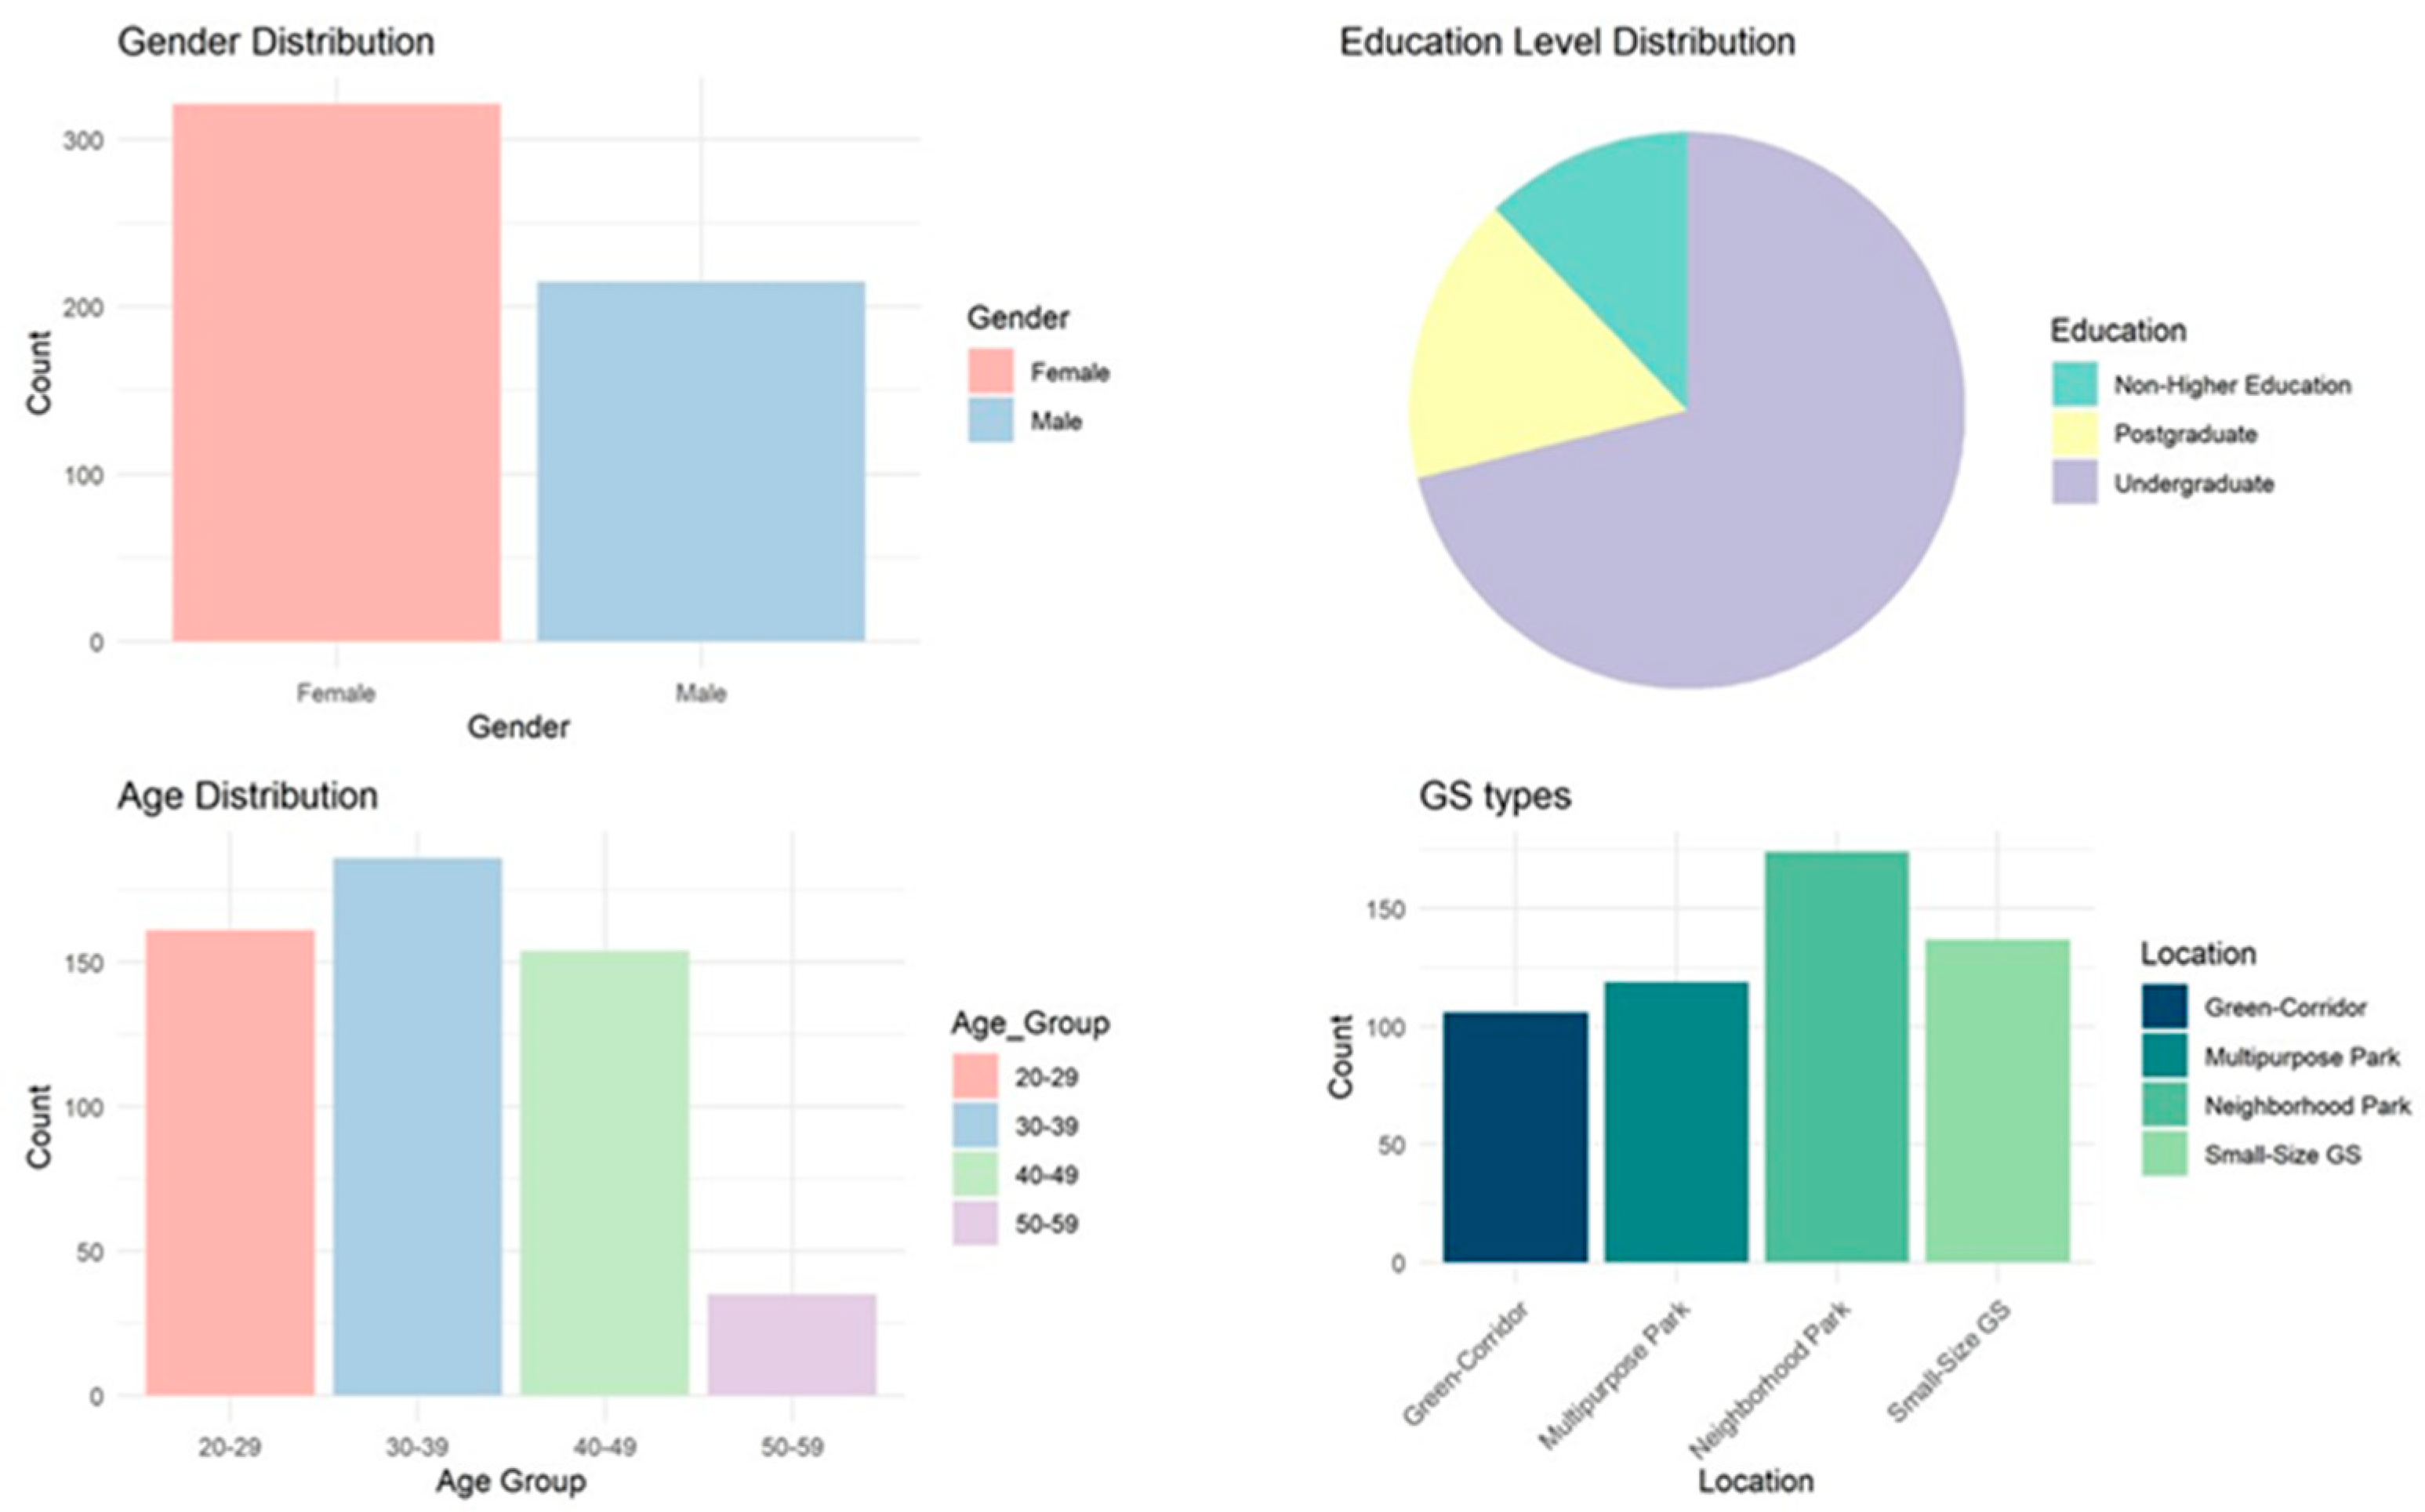
3. Methodology
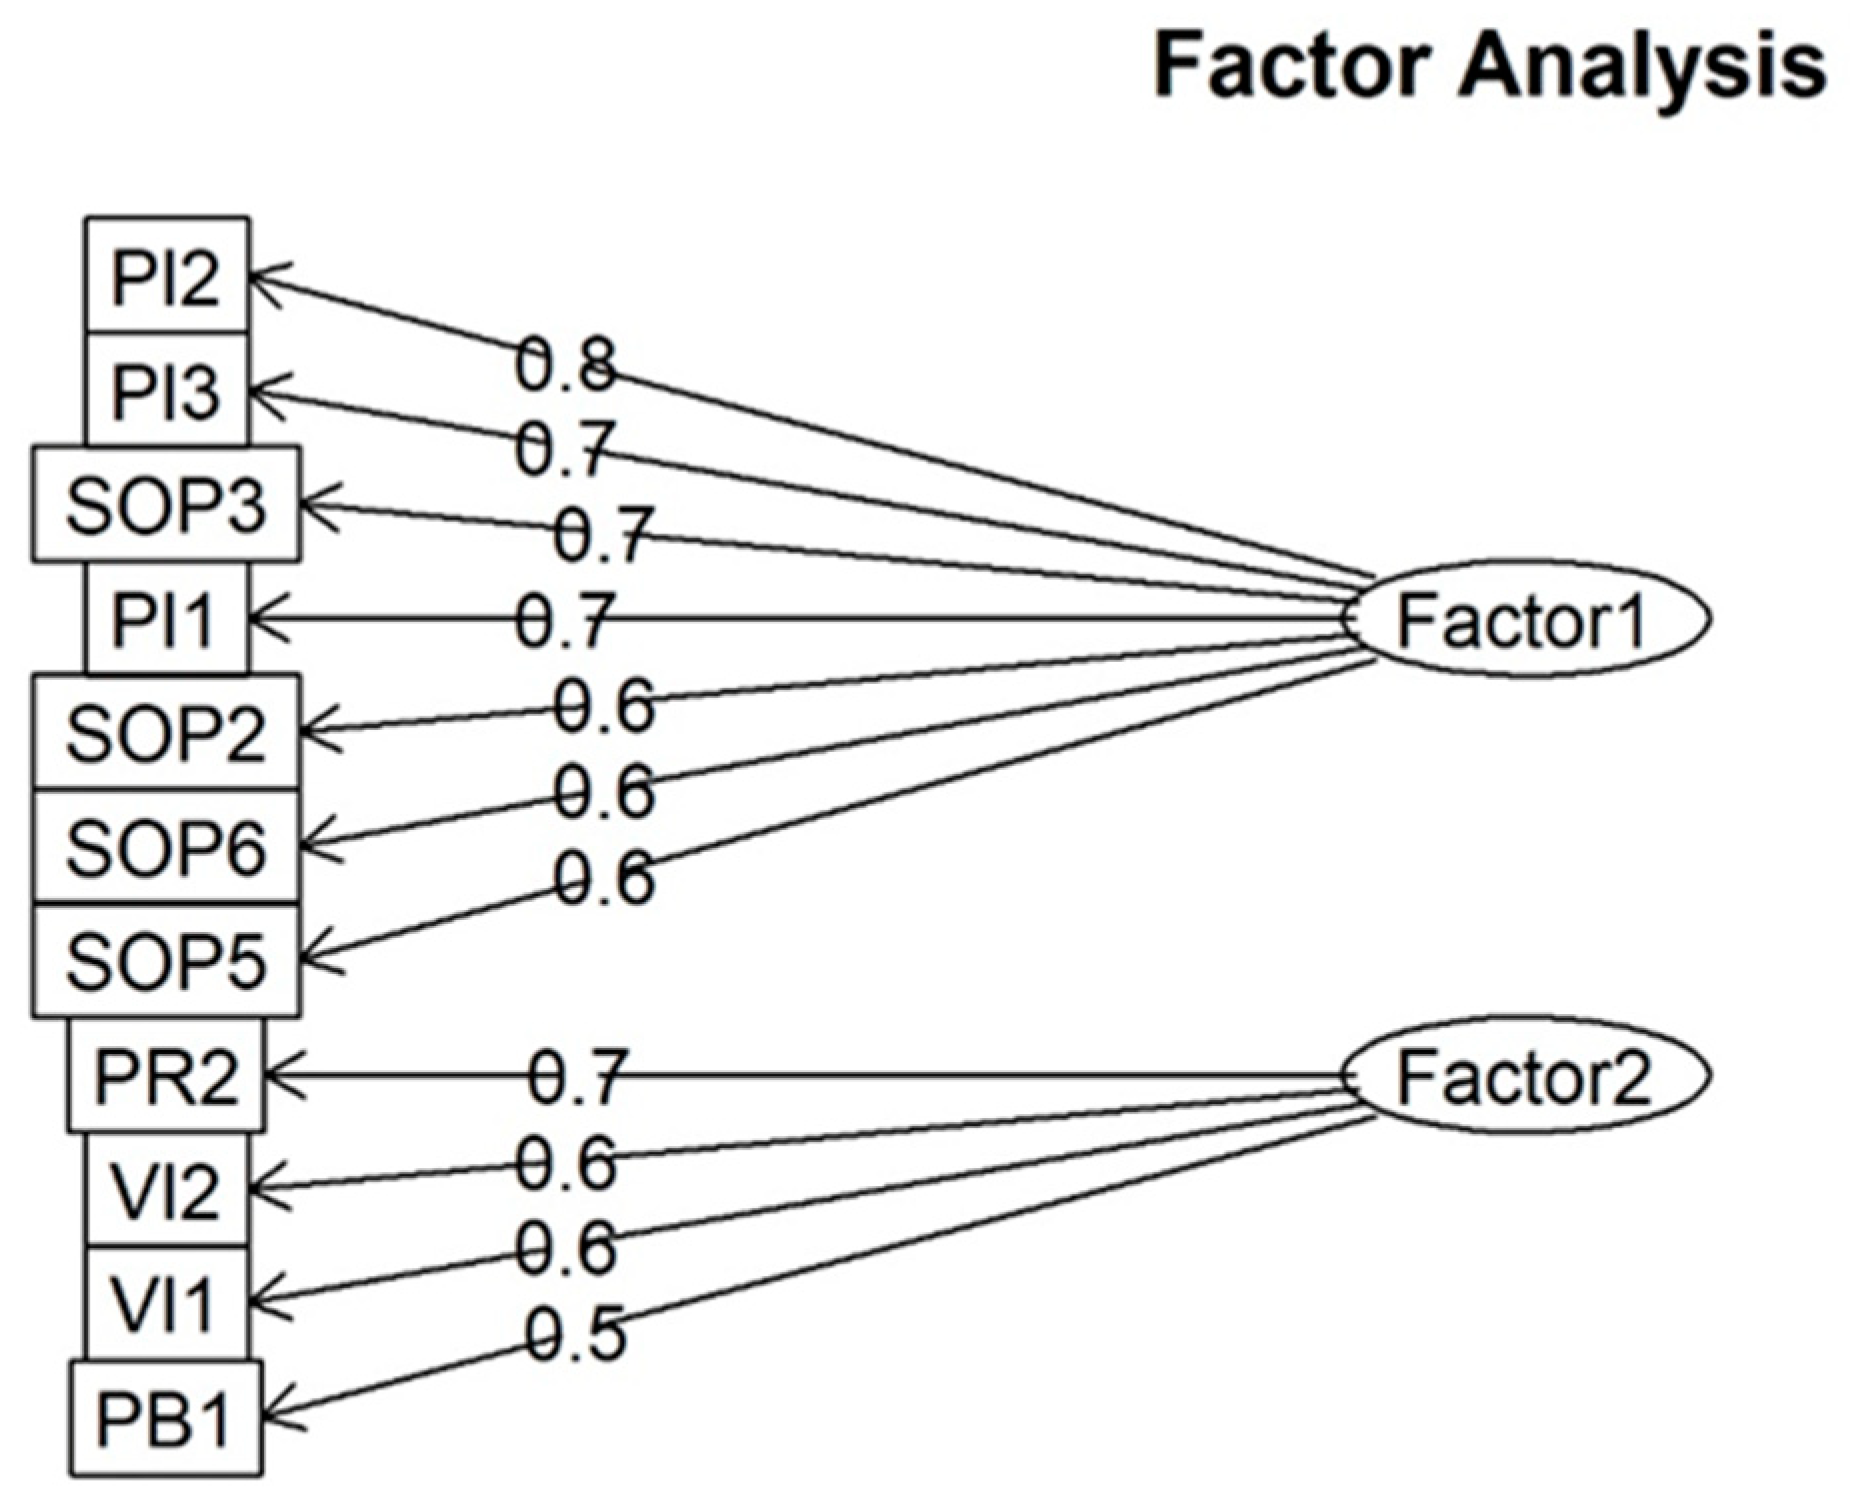
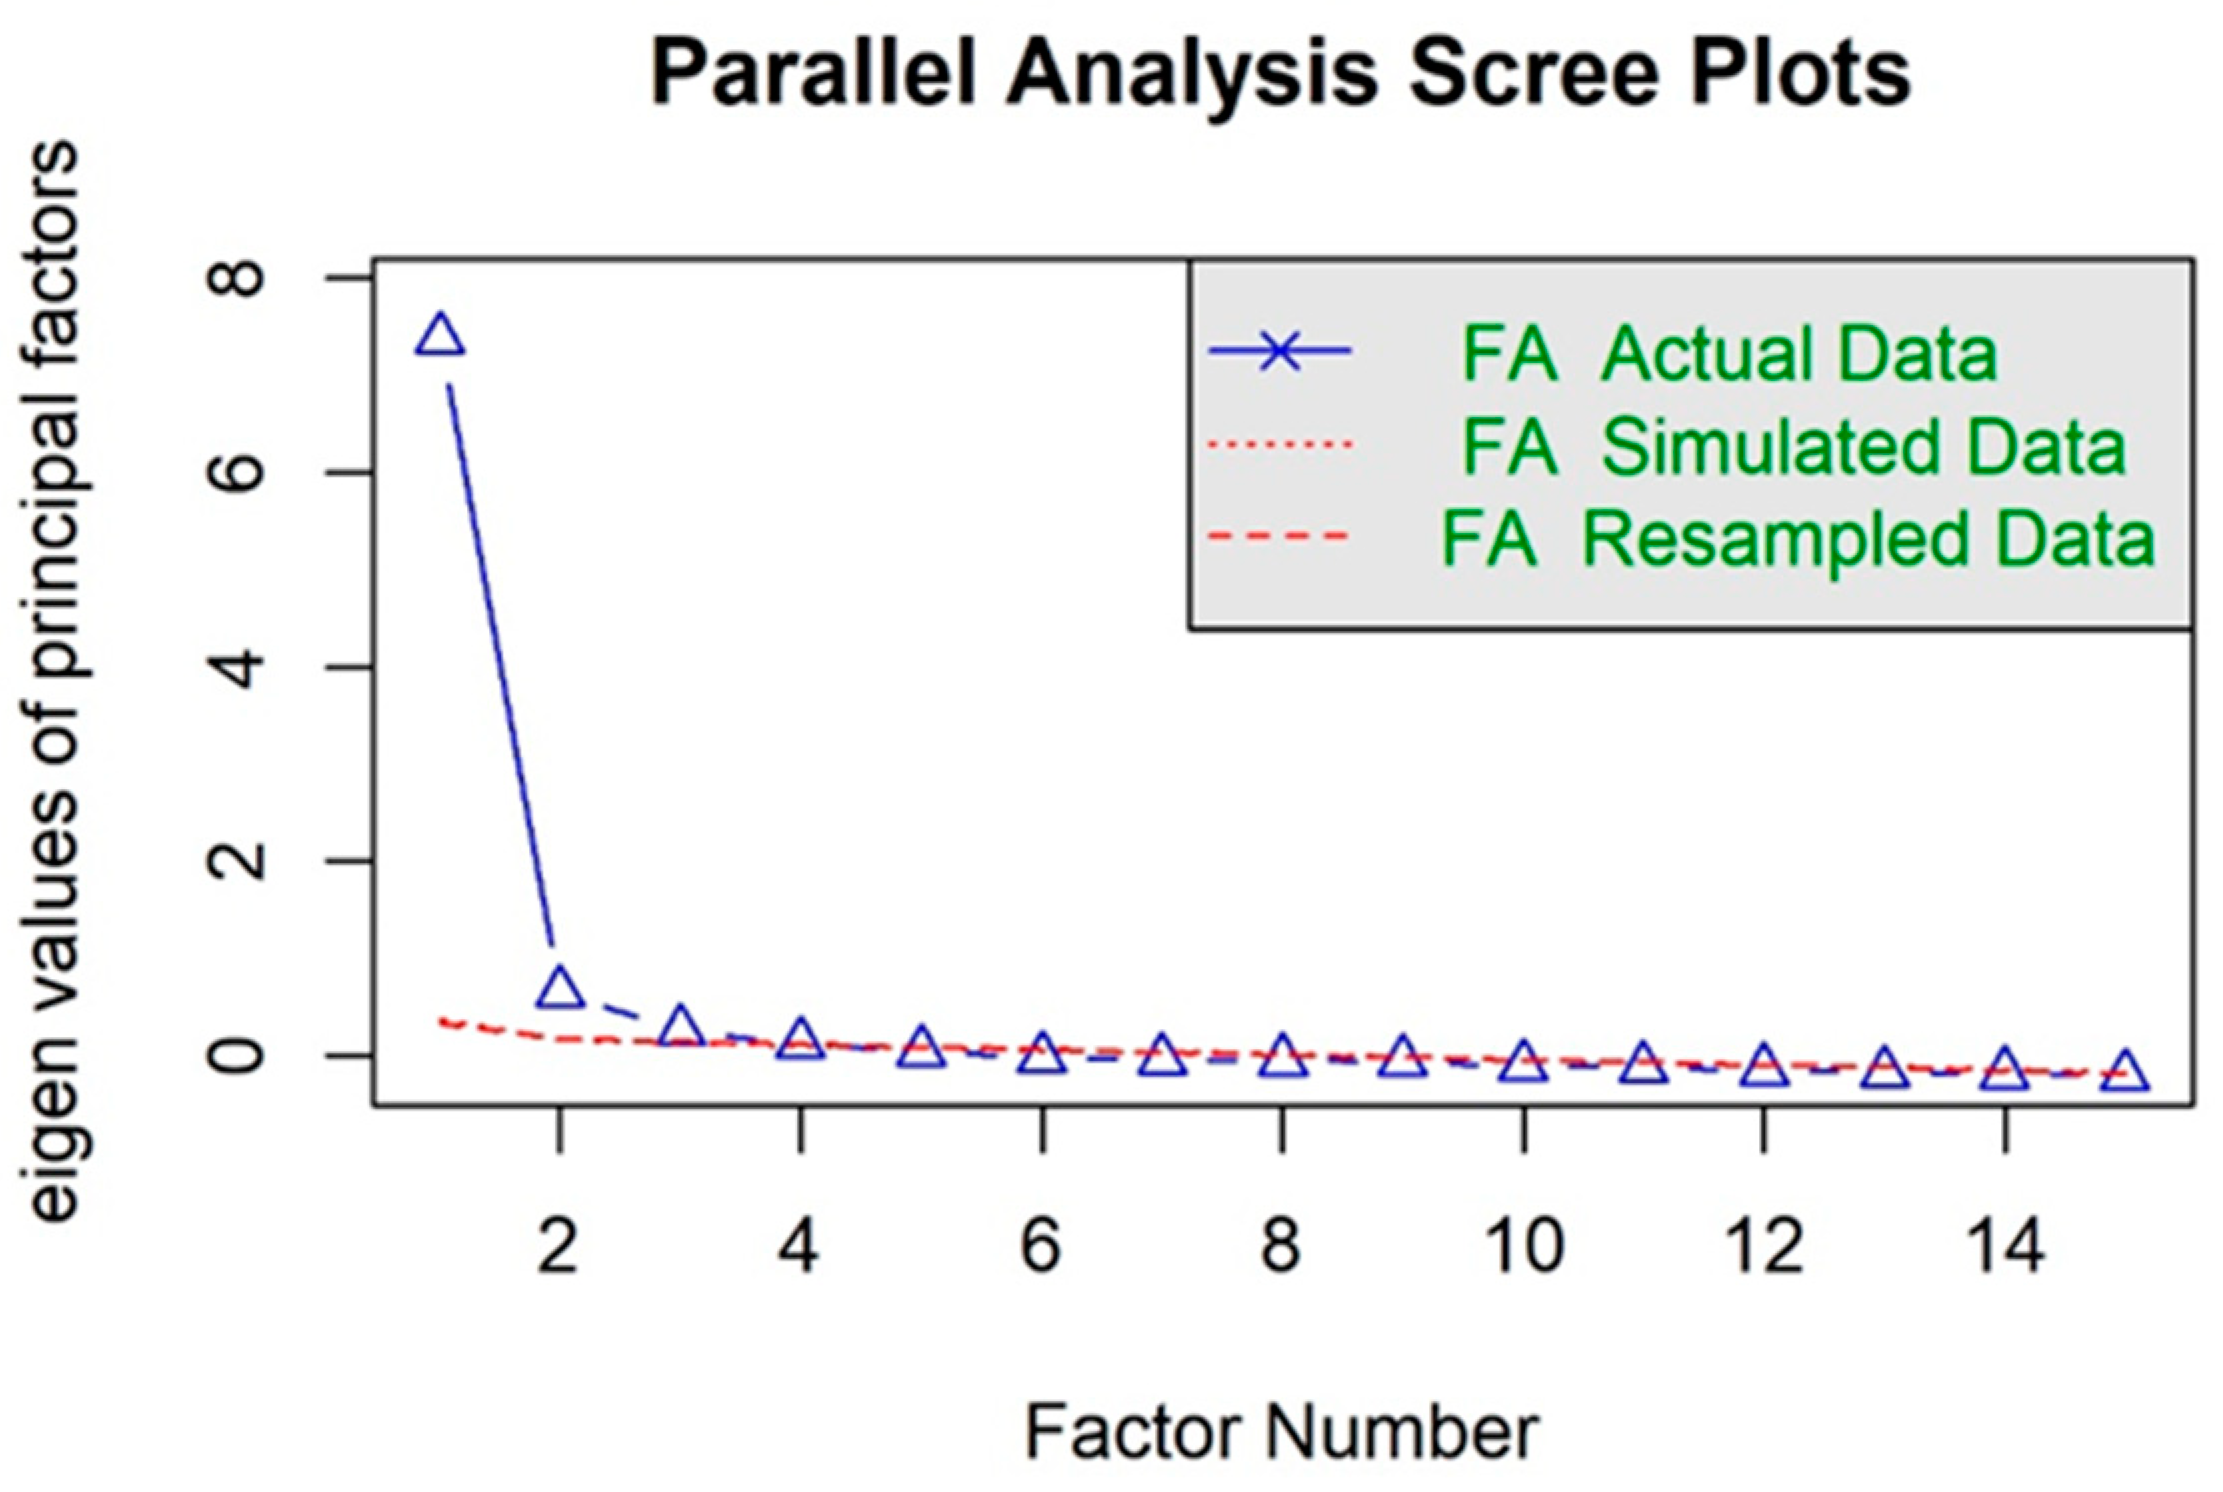
4. Results
5. Discussion
5.1. Attraction Green Place Images
5.2. Retention Green Place Images
5.3. The Importance of Multipurpose Parks in the City
5.4. Limitations and Further Study Recommendations
6. Conclusions
Author Contributions
Funding
Data Availability Statement
Conflicts of Interest
Appendix A

| X1 | X2 | X3 | X4 | X5 | X6 | X7 | X8 | X9 | X10 | X11 | X12 | X13 | X14 | X15 | Note | ||
|---|---|---|---|---|---|---|---|---|---|---|---|---|---|---|---|---|---|
| X1 | PB1 | 1.000 | 0.491 | 0.422 | 0.432 | 0.510 | 0.445 | 0.476 | 0.361 | 0.407 | 0.382 | 0.451 | 0.380 | 0.457 | 0.397 | 0.354 | 14 |
| X2 | PB2 | 1.000 | 0.427 | 0.380 | 0.457 | 0.439 | 0.358 | 0.385 | 0.396 | 0.404 | 0.427 | 0.330 | 0.395 | 0.378 | 0.389 | 14 | |
| X3 | VI1 | 1.000 | 0.507 | 0.472 | 0.468 | 0.473 | 0.417 | 0.393 | 0.447 | 0.444 | 0.394 | 0.370 | 0.362 | 0.414 | 14 | ||
| X4 | VI2 | 1.000 | 0.415 | 0.496 | 0.466 | 0.414 | 0.410 | 0.447 | 0.419 | 0.392 | 0.432 | 0.405 | 0.406 | 14 | |||
| X5 | PR1 | 1.000 | 0.413 | 0.455 | 0.508 | 0.545 | 0.384 | 0.497 | 0.447 | 0.524 | 0.515 | 0.573 | 14 | ||||
| X6 | PR2 | 1.000 | 0.430 | 0.329 | 0.316 | 0.400 | 0.374 | 0.326 | 0.416 | 0.335 | 0.392 | 14 | |||||
| X7 | SOP1 | 1.000 | 0.381 | 0.420 | 0.410 | 0.439 | 0.402 | 0.473 | 0.448 | 0.461 | 14 | ||||||
| X8 | SOP2 | 1.000 | 0.621 | 0.412 | 0.491 | 0.444 | 0.446 | 0.581 | 0.598 | 14 | |||||||
| X9 | SOP3 | 1.000 | 0.403 | 0.563 | 0.500 | 0.501 | 0.605 | 0.586 | 14 | ||||||||
| X10 | SOP4 | 1.000 | 0.487 | 0.423 | 0.395 | 0.369 | 0.490 | 14 | |||||||||
| X11 | SOP5 | 1.000 | 0.546 | 0.547 | 0.564 | 0.576 | 14 | ||||||||||
| X12 | SOP6 | 1.000 | 0.591 | 0.576 | 0.530 | 14 | |||||||||||
| X13 | PI1 | 1.000 | 0.648 | 0.591 | 14 | ||||||||||||
| X14 | PI2 | 1.000 | 0.650 | 14 | |||||||||||||
| X15 | PI3 | 1.000 | 14 |
Appendix B
| Eigenvalues | Cumulative % | ||
|---|---|---|---|
| Component | Total | % of Variance | |
| X1 | 7.345 | 48.9 | 48.9 |
| X2 | 1.218 | 8.1 | 57.0 |
| X3 | 0.744 | 4.9 | 62.0 |
| X4 | 0.725 | 4.8 | 66.8 |
| X5 | 0.652 | 4.3 | 71.2 |
| X6 | 0.584 | 3.8 | 75.1 |
| X7 | 0.532 | 3.5 | 78.6 |
| X8 | 0.520 | 3.4 | 82.1 |
| X9 | 0.474 | 3.1 | 85.3 |
| X10 | 0.445 | 2.9 | 88.2 |
| X11 | 0.422 | 2.8 | 91.1 |
| X12 | 0.386 | 2.5 | 93.6 |
| X13 | 0.345 | 2.3 | 95.9 |
| X14 | 0.311 | 2.0 | 98.0 |
| X15 | 0.291 | 1.9 | 100.0 |
Appendix C

Appendix D
| Unrotated Loading | ||||
|---|---|---|---|---|
| Factor | ||||
| Variables | 1 | 2 | Communality | |
| X1 | PB1 | 0.658 | 0.316 | 0.532 |
| X2 | PB2 | 0.626 | 0.294 | 0.478 |
| X3 | VI1 | 0.661 | 0.356 | 0.564 |
| X4 | VI2 | 0.663 | 0.323 | 0.543 |
| X5 | PR1 | 0.740 | 0.017 | 0.547 |
| X6 | PR2 | 0.616 | 0.464 | 0.594 |
| X7 | SOP1 | 0.673 | 0.203 | 0.494 |
| X8 | SOP2 | 0.711 | −0.261 | 0.572 |
| X9 | SOP3 | 0.740 | −0.301 | 0.637 |
| X10 | SOP4 | 0.648 | 0.167 | 0.447 |
| X11 | SOP5 | 0.753 | −0.145 | 0.587 |
| X12 | SOP6 | 0.700 | −0.257 | 0.556 |
| X13 | PI1 | 0.750 | −0.194 | 0.600 |
| X14 | PI2 | 0.758 | −0.383 | 0.721 |
| X15 | PI3 | 0.774 | −0.292 | 0.684 |
| Total | ||||
| Sum of squares | 7.345 | 1.218 | 8.563 | |
| Percentage of trace | 52.464 | 8.7 | 57.08 | |
References
- Budruk, M.; Thomas, H.; Tyrrell, T. Urban green spaces: A study of place attachment and environmental attitudes in India. Soc. Nat. Resour. 2013, 22, 824–839. [Google Scholar] [CrossRef]
- World Health Organization. Urban Green Spaces and Health; World Health Organization: Geneva, Switzerland, 2016; Available online: https://www.who.int/ (accessed on 1 March 2024).
- Kleyn, L.; Mumaw, L.; Corney, H. From green spaces to vital places: Connection and expression in urban greening. Aust. Geogr. 2020, 51, 205–219. [Google Scholar] [CrossRef]
- Tan, C.L.Y.; Chang, C.-C.; Nghiem, L.T.P.; Zhang, Y.; Oh, R.R.Y.; Shanahan, D.F.; Lin, B.B.; Gaston, K.J.; Fuller, R.A.; Carrasco, L.R. The right mix: Residential urban green-blue space combinations are correlated with physical exercise in a tropical city-state. Urban For. Urban Green. 2021, 57, 126947. [Google Scholar] [CrossRef]
- Tzoulas, K.; James, P. Peoples’ use of, and concerns about, green space networks: A case study of Birchwood, Warrington New Town, UK. Urban For. Urban Green. 2010, 9, 121–128. [Google Scholar] [CrossRef]
- Zhao, M.; Lu, H.; Liang, J.; Chan, C.S. Evaluating green resource branding using user-generated content data: The case study of a greenway in eastern Guangzhou, China. Urban For. Urban Green. 2021, 66, 127395. [Google Scholar] [CrossRef]
- Kotler, P.; Haider, D.; Rein, I. Marketing Places: Attracting Investment, Industry, and Tourism to Cities, States, and Nations; The Free Press: New York, NY, USA, 1993. [Google Scholar]
- Włodarczyk-Marciniak, R.; Sikorska, D.; Krauze, K. Residents’ awareness of the role of informal green spaces in a post-industrial city, with a focus on regulating services and urban adaptation potential. Sustain. Cities Soc. 2020, 59, 102236. [Google Scholar] [CrossRef]
- Kim, L.; Li, C. Urban greenspace: A review of place image approaches. Eur. Econ. Lett. 2023, 13, 942–950. [Google Scholar]
- Colley, K.; Craig, T. Natural places: Perceptions of wildness and attachment to local greenspace. J. Environ. Psychol. 2019, 61, 71–78. [Google Scholar] [CrossRef]
- Campagnaro, T.; Vecchiato, D.; Arnberger, A.; Celegato, R.; Da Re, R.; Rizzetto, R.; Semenzato, P.; Sitzia, T.; Tempesta, T.; Cattaneo, D. General, stress relief and perceived safety preferences for green spaces in the historic city of Padua (Italy). Urban For. Urban Green. 2020, 52, 126695. [Google Scholar] [CrossRef]
- Chan, C.S.; Marafa, L.M. The green branding of Hong Kong: Visitors’ and residents’ perceptions. J. Place Manag. Dev. 2016, 9, 289–312. [Google Scholar] [CrossRef]
- Dasgupta, R.; Basu, M.; Hashimoto, S.; Estoque, R.C.; Kumar, P.; Johnson, B.A.; Mitra, B.K.; Mitra, P. Residents’ place attachment to urban green spaces in Greater Tokyo region: An empirical assessment of dimensionality and influencing socio-demographic factors. Urban For. Urban Green. 2022, 67, 12743. [Google Scholar] [CrossRef]
- leBrasseur, R. Cultural greenspaces: Synthesizing knowledge and experience in Nova Scotia’s African-Canadian communities through participatory research and SoftGIS. Sustainability 2022, 11, 281. [Google Scholar] [CrossRef]
- Subiza-Pérez, M.; Hauru, K.; Korpela, K.; Haapala, A.; Lehvävirta, S. Perceived Environmental Aesthetic Qualities Scale (PEAQS): A self-report tool for the evaluation of green-blue spaces. Urban For. Urban Green. 2019, 43, 126383. [Google Scholar] [CrossRef]
- Braçe, O.; Garrido-Cumbrera, M.; Correa-Fernández, J. Gender differences in the perceptions of green spaces characteristics. Soc. Sci. Q. 2021, 102, 2640–2648. [Google Scholar] [CrossRef]
- Van Dinter, M.; Kools, M.; Dane, G.; Weijs-Perrée, M.; Chamilothori, K.; van Leeuwen, E.; Borgers, A.; van den Berg, P. Urban green parks for long-term subjective well-being: Empirical relationships between personal characteristics, park characteristics, park use, sense of place, and satisfaction with life in the Netherlands. Sustainability 2022, 14, 4911. [Google Scholar] [CrossRef]
- R Core Team. R: A Language and Environment for Statistical Computing; R Foundation for Statistical Computing: Vienna, Austria, 2022; Available online: https://www.R-project.org/ (accessed on 1 February 2024).
- Roberts, H.; Sadler, J.; Chapman, L. The value of Twitter data for determining the emotional responses of people to urban green spaces: A case study and critical evaluation. Urban Stud. 2018, 56, 818–835. [Google Scholar] [CrossRef]
- Chan, C.S. Health-related elements in green space branding in Hong Kong. Urban For. Urban Green. 2017, 21, 192–202. [Google Scholar] [CrossRef]
- Fok, K.W.K.; Law, W.W.Y. City re-imagined: Multi-stakeholder study on branding Hong Kong as a city of greenery. J. Environ. Manag. 2018, 206, 1039–1051. [Google Scholar] [CrossRef]
- Kozamernik, J.; Rakuša, M.; Nikšic, M. How green facades affect the perception of urban ambiences: Comparing Slovenia and the Netherlands. Urbani Izziv 2021, 31, 88–100. [Google Scholar] [CrossRef]
- Chen, N.; Dwyer, L.; Firth, T. Residents’ place attachment and word-of-mouth behaviors: A tale of two cities. J. Hosp. Tour. Manag. 2018, 36, 1–11. [Google Scholar] [CrossRef]
- Wilkie, S.; Thompson, E.; Cranner, P.; Ginty, K. Attention restoration theory as a framework for analysis of Tweets about urban green space: A case study. Landsc. Res. 2020, 45, 777–788. [Google Scholar] [CrossRef]
- Andersson-Sköld, Y.; Klingberg, J.; Gunnarsson, B.; Cullinane, K.; Gustafsson, I.; Hedblom, M.; Knez, I.; Lindberg, F.; Ode Sang, Å.; Pleijel, H.; et al. A framework for assessing urban greenery’s effects and valuing its ecosystem services. J. Environ. Manag. 2018, 205, 274–285. [Google Scholar] [CrossRef] [PubMed]
- Relph, E. Place and Placelessness; Pion: London, UK, 1976; pp. 10–12. [Google Scholar]
- Tuan, Y. Topophilia: A Study of Environmental Perception, Attitudes, and Values; Columbia University Press: New York, NY, USA, 1974. [Google Scholar]
- Žlender, V.; Gemin, S. Testing urban dwellers’ sense of place towards leisure and recreational peri-urban green open spaces in two European cities. Cities 2020, 98, 102579. [Google Scholar] [CrossRef]
- Lynch, K. The Image of the City; MIT Press: Cambridge, MA, USA, 1960; pp. 1–9. [Google Scholar]
- Altman, I.; Low, S.M. Place Attachment; Plenum Press: New York, NY, USA, 1992; pp. 1–12. [Google Scholar]
- Proshansky, H.M.; Fabian, A.; Kaminoff, R. Place-identity: Physical world socialization of the self. J. Environ. Psychol. 1983, 3, 57–83. [Google Scholar] [CrossRef]
- Irvine, K.N.; Warber, S.L.; Devine-Wright, P.; Gaston, K.J. Understanding urban green space as a health resource: A qualitative comparison of visit motivation and derived effects among park users in Sheffield, UK. Int. J. Environ. Res. Public Health 2013, 10, 417–442. [Google Scholar] [CrossRef] [PubMed]
- McCunn, L.J.; Gifford, R. Interrelations between sense of place, organizational commitment, and green neighborhoods. Cities 2014, 41, 20–29. [Google Scholar] [CrossRef]
- Pipitone, J.M.; Jović, S. Urban green equity and COVID-19: Effects on park use and sense of belonging in New York City. Urban For. Urban Green. 2021, 67, 127338. [Google Scholar] [CrossRef]
- Zhu, Y.; Ding, J.; Zhu, Q.; Cheng, Y.; Ma, Q.; Ji, X. The impact of green open space on community attachment: A case study of three communities in Beijing. Sustainability 2017, 9, 560. [Google Scholar] [CrossRef]
- Li, H.; Luo, W.; Hou, Y.; Xia, Y.; Yao, J.; Kang, N.; Deng, C.; Sun, H.; Chen, C. Factors affecting perceived health benefits and use behaviors in urban green spaces during the COVID-19 pandemic in Southern China megacities. Front. Public Health 2021, 9, 759444. [Google Scholar] [CrossRef]
- Chang, P.J.; Tsou, C.W.; Li, Y.S. Urban-greenway factors’ influence on older adults’ psychological well-being: A case study of Taichung, Taiwan. Urban For. Urban Green. 2020, 49, 126606. [Google Scholar] [CrossRef]
- Zhang, Y.; van Dijk, T.; Tang, J.; van den Berg, A.E. Green space attachment and health: A comparative study in two urban neighborhoods. Int. J. Environ. Res. Public Health 2015, 12, 14342–14363. [Google Scholar] [CrossRef] [PubMed]
- Kimpton, A.; Wickes, R.; Corcoran, J. Greenspace and place attachment: Do greener suburbs lead to greater residential place attachment? Urban Policy Res. 2015, 32, 477–497. [Google Scholar] [CrossRef]
- Jorgensen, B.S.; Stedman, R.C. Sense of place as an attitude: Lakeshore owners attitudes toward their properties. J. Environ. Psychol. 2001, 21, 233–248. [Google Scholar] [CrossRef]
- King, K.; Dickinson, J. Nearby nature in lockdown: Practices and affordances for leisure in urban green spaces. Leis. Stud. 2022, 42, 100–117. [Google Scholar] [CrossRef]
- Fisher, J.C.; Mistry, J.; Pierre, M.A.; Yang, H.; Harris, A.; Hunte, N.; Fernandes, D.; Bicknell, J.E.; Davies, Z.G. Using participatory video to share people’s experiences of neotropical urban green and blue spaces with decision-makers. Geogr. J. 2021, 187, 346–360. [Google Scholar] [CrossRef]
- Bell, S.L.; Westley, M.; Lovell, R.; Wheeler, B.W. Everyday green space and experienced well-being: The significance of wildlife encounters. Landsc. Res. 2018, 43, 8–19. [Google Scholar] [CrossRef]
- Dennis, M.; James, P. Site-specific factors in the production of local urban ecosystem services: A case study of community-managed green space. Ecosyst. Serv. 2016, 17, 208–216. [Google Scholar] [CrossRef]
- Taylor, L.; Hochuli, D.F. Defining greenspace: Multiple uses across multiple disciplines. Landsc. Urban Plan. 2017, 158, 25–38. [Google Scholar] [CrossRef]
- Grzyb, T.; Kulczyk, S.; Derek, M.; Woźniak, E. Using social media to assess recreation across urban green spaces in times of abrupt change. Ecosyst. Serv. 2021, 49, 101297. [Google Scholar] [CrossRef]
- Hoyle, H.; Jorgensen, A.; Hitchmough, J.D. What determines how we see nature? Perceptions of naturalness in designed urban green spaces. People Nat. 2019, 1, 167–180. [Google Scholar] [CrossRef]
- Ode Sang, Å.; Sang, N.; Hedblom, M.; Sevelin, G.; Knez, I.; Gunnarsson, B. Are path choices of people moving through urban green spaces explained by gender and age? Implications for planning and management. Urban For. Urban Green. 2020, 49, 126628. [Google Scholar] [CrossRef]
- Łaszkiewicz, E.; Kronenberg, J.; Marcińczak, S. Attached to or bound to a place? The impact of green space availability on residential duration: The environmental justice perspective. Ecosyst. Serv. 2017, 30, 309–317. [Google Scholar] [CrossRef]
- Tabachinick, B.G.; Fidell, L.S. Using Multivariate Statistics, 6th ed.; Pearson: Boston, MA, USA, 2013; pp. 15–50. [Google Scholar]
- Reise, S.P.; Waller, N.G.; Comrey, A.L. Factor analysis and scale revision. Psychol. Assess. 2000, 12, 287. [Google Scholar] [CrossRef] [PubMed]
- Fongar, C.; Aamodt, G.; Randrup, T.B.; Solfjeld, I. Does perceived green space quality matter? Linking Norwegian adult perspectives on perceived quality to motivation and frequency of visits. Int. J. Environ. Res. Public Health 2019, 16, 2327. [Google Scholar]


| Constructs of Greenspace Place Images | |
|---|---|
| Place Brand | |
| PB1 | This place has a peculiarity. |
| PB2 | This place is representative of the city (or the neighborhood or the community). |
| Place Visual Image | |
| VI1 | I feel pleasant when I see this place. |
| VI2 | I feel mentally restorative when I see this place. |
| Place Reputation | |
| PR1 | The beneficial effects of visiting this place are well-known. |
| PR2 | I will recommend this place to others. |
| Sense of Place | |
| SOP1 | I am very attached to this place. |
| SOP2 | I feel quite at home in this place. |
| SOP3 | I feel like I belong to this city (or this neighborhood). |
| SOP4 | I would like to be living in this city (or this neighborhood) for the next three years. |
| SOP5 | This place cannot be a substitute for the other place for doing what I intended to do here. |
| SOP6 | This place provides the optimal environment to make me achieve my goal. |
| Place Identity | |
| PI1 | Visiting this place says a lot about who I am. |
| PI2 | This place reflects what type of person I am. |
| PI3 | I feel this place is a part of me. |
| Small-Size Greenspace | Neighborhood Park | Multipurpose Park | Green Corridor |
|---|---|---|---|
| Shida Park | Yongkang Park | Daan Forest Park | Huazhong Riverside Park |
 |  |  |  |
| VARIMAX-Rotated Loadings | ||||
|---|---|---|---|---|
| Factor | ||||
| Reduced Set of Variables | 1 | 2 | Communality | |
| X14 | PI2 | 0.831 | 0.728 | |
| X15 | PI3 | 0.785 | 0.678 | |
| X9 | SOP3 | 0.765 | 0.639 | |
| X8 | SOP2 | 0.716 | 0.576 | |
| X12 | SOP6 | 0.702 | 0.564 | |
| X13 | PI1 | 0.701 | 0.607 | |
| X11 | SOP5 | 0.684 | 0.596 | |
| X6 | PR2 | 0.793 | 0.658 | |
| X4 | VI2 | 0.727 | 0.595 | |
| X3 | VI1 | 0.719 | 0.615 | |
| X1 | PB1 | 0.650 | 0.522 | |
| Total | ||||
| Sum of squares (eigenvalue) | 4.154 | 2.630 | 6.784 | |
| Percentage of trace | 37.7 | 23.9 | 61.6 | |
| Pairwise Comparison | Within Retention (Factor 1) | Within Attraction (Factor 2) | ||||||
|---|---|---|---|---|---|---|---|---|
| diff | lwr | upr | p-adj | diff | lwr | upr | p-adj | |
| Corridor-2 | −0.711 | −2.527 | 1.104 | 0.820 | 0.461 | −1.052 | 1.975 | 0.919 |
| Multipurpose-2 | −0.294 | −2.107 | 1.519 | 0.991 | 0.626 | −0.885 | 2.137 | 0.788 |
| Neighborhood-2 | −0.431 | −2.240 | 1.378 | 0.966 | 0.287 | −1.220 | 1.795 | 0.985 |
| Small-2 | −0.452 | −2.264 | 1.359 | 0.959 | 0.244 | −1.265 | 1.754 | 0.991 |
| Multipurpose- Corridor | 0.417 | 0.075 | 0.758 | 0.007 ** | 0.164 | −0.120 | 0.449 | 0.509 |
| Neighborhood- Corridor | 0.280 | −0.034 | 0.595 | 0.107 | −0.174 | −0.436 | 0.088 | 0.366 |
| Small-Corridor | 0.258 | −0.071 | 0.589 | 0.203 | −0.217 | −0.492 | 0.058 | 0.199 |
| Neighborhood- Multipurpose | −0.136 | −0.439 | 0.165 | 0.728 | −0.338 | −0.590 | −0.086 | 0.002 ** |
| Small- Multipurpose | −0.158 | −0.477 | 0.160 | 0.653 | −0.381 | −0.647 | −0.115 | 0.000 *** |
| Small-Neighborhood | −0.021 | −0.312 | 0.269 | 0.999 | −0.042 | −0.285 | 0.199 | 0.988 |
Disclaimer/Publisher’s Note: The statements, opinions and data contained in all publications are solely those of the individual author(s) and contributor(s) and not of MDPI and/or the editor(s). MDPI and/or the editor(s) disclaim responsibility for any injury to people or property resulting from any ideas, methods, instructions or products referred to in the content. |
© 2024 by the authors. Licensee MDPI, Basel, Switzerland. This article is an open access article distributed under the terms and conditions of the Creative Commons Attribution (CC BY) license (https://creativecommons.org/licenses/by/4.0/).
Share and Cite
Kim, L.; Li, C. Attraction and Retention Green Place Images of Taipei City. Forests 2024, 15, 710. https://doi.org/10.3390/f15040710
Kim L, Li C. Attraction and Retention Green Place Images of Taipei City. Forests. 2024; 15(4):710. https://doi.org/10.3390/f15040710
Chicago/Turabian StyleKim, Lankyung, and Ching Li. 2024. "Attraction and Retention Green Place Images of Taipei City" Forests 15, no. 4: 710. https://doi.org/10.3390/f15040710
APA StyleKim, L., & Li, C. (2024). Attraction and Retention Green Place Images of Taipei City. Forests, 15(4), 710. https://doi.org/10.3390/f15040710