Article

Non-Native Plants Influence Forest Vegetative Structure and the Activity of Eastern Temperate Insectivorous Bats

1
Department of Ecology, Evolution, and Natural Resources, Rutgers, The State University of New Jersey, New Brunswick, NJ 08901, USA
2
Department of Natural Sciences, Felician University, Rutherford, NJ 07070, USA
*
Author to whom correspondence should be addressed.
Forests 2024, 15(4), 711; https://doi.org/10.3390/f15040711
Submission received: 15 February 2024 / Revised: 2 April 2024 / Accepted: 14 April 2024 / Published: 17 April 2024
(This article belongs to the Special Issue Biodiversity and Ecology of Organisms Associated with Woody Plants)

Abstract

:
Temperate insectivorous bats value high prey abundance and appropriate vegetative structure when selecting foraging habitats. Forests, particularly in the eastern United States, provide prime foraging habitats for bats but can be heavily impacted by non-native plants, which may alter arthropod diversity and abundance, as well as vegetative structure. To investigate the associations between non-native plants and insect abundance, vegetative structure, and, consequently, bat activity, we performed vegetation surveys, insect trapping, and acoustic monitoring at 23 forested plots in northern New Jersey, USA. We predicted that non-native vegetation would either positively influence bat activity by increasing structural openness (thus, facilitating flight) or negatively influence bat activity by lowering the abundance of putative prey. We also hypothesized that vegetative characteristics, and therefore non-native vegetation, impact bats differently depending on their foraging habitat preferences. The percent of non-native cover of the ground and midstory vegetative layers of our study plots ranged from 0 to 92.92% ( x ¯ = 46.94 ± 5.77 SE) and was significantly correlated with structural vegetative characteristics, such as midstory clutter (β = 0.01 ± 0.006 SE), but not putative prey abundance (β = −0.81 ± 2.57 SE). Generalized linear models with only vegetative characteristics best predicted overall bat activity and foraging, which were greatest in areas with a high percent non-native vegetation and low midstory clutter. Although percent non-native vegetation and midstory clutter were also significant effects for bats that prefer to forage in open areas, neither vegetative characteristics nor prey abundance were significant effects for clutter-loving bats. Such findings suggest that vegetative structure is more important than prey availability for predicting overall insectivorous bat activity, but other factors, such as foraging strategy and life history traits, can impact how bat guilds respond to non-native vegetation. Therefore, more research is required to reveal additional mechanisms by which non-native plants impact bats.

1. Introduction

Non-native plants can profoundly impact ecological communities by reducing native biodiversity and altering ecosystem function [1,2,3]. By modifying the biotic (e.g., prey availability) and abiotic characteristics (e.g., structure, light availability, and soil chemistry) of a native species’ habitat, non-native plants may affect individual fitness and ultimately population or species persistence [4,5,6]. Because impacts on individual species can radiate through food webs, non-native plants can also alter the availability, distribution, and quality of resources for consumers at other trophic levels [7,8,9]. For example, non-native plants compete with and suppress the growth of native plants, altering the pre-existing vegetative community [10,11]. Such changes can directly and indirectly reduce the survival and reproductive success of some native herbivorous insects, which subsequently impact insectivores and their predators [12]. By potentially reducing native biodiversity, non-native plants can also diminish the ecosystem functions that native species perform, such as pollination and tree regeneration, which may consequently alter the succession dynamics of a landscape [13,14,15,16].
Forests, particularly those in the eastern temperate zone, are highly susceptible to invasions of non-native plants due to such human-induced stressors as forest fragmentation and soil disturbance [17,18]. Non-native shrubs typically increase understory clutter [17], which could affect how forest-dwelling wildlife use the landscape. Although non-native plants in some cases have been shown to have little impact on native fauna [19], non-native plants often force animals to adapt or suffer negative fitness consequences [16]. Indeed, native eastern North American butterflies, birds, and snakes have been shown to alter their habitat use in response to non-native plants, often resulting in increased mortality. The West Virginia white (Pieris virginiensis, Edwards), an imperiled native butterfly, preferentially oviposits on non-native garlic mustard (Alliaria petiolate, Cavara & Grande), despite the plant being toxic to its caterpillars [20,21]. Neotropical migrant birds, such as Kentucky Warblers (Geothlypis Formosa, Wilson) and Hooded Warblers (Setophaga citrina, Boddaert), will not nest in areas dominated by non-native plants [22], leading to decreased reproductive success. Further, nonmigratory birds that do build nests in non-native shrubs experience higher daily mortality and nest failure due to predation than birds using native shrubs [22,23]. Ectotherms also avoid non-native vegetation at multiple spatial scales, suggesting that non-native plants do not provide the required habitat components [24]. Consequently, non-native plants can negatively impact native fauna by increasing mortality, reducing reproductive success, and diminishing habitat quality. Thus, understanding how and to what extent non-native plants impact native fauna requires studying multiple animal taxa.
Despite the growing body of research on the effects of non-native plants on native wildlife, temperate insectivorous bats are understudied in the invasion literature [25]. This is problematic because North American bats rely heavily on forested landscapes and are experiencing significant population declines resulting from multiple threats (e.g., disease, wind energy production, etc.) [26,27]. All bat species native to eastern North America are insectivorous and require forests for roosting, reproduction, and/or foraging [28,29,30]. When selecting foraging habitats in forested landscapes, bats value both the high abundance of arthropod prey as well as the appropriate vegetative structure. However, studies show that neither of these factors alone can reliably predict bat presence or activity [31,32]. Non-native plants further obfuscate these dynamics by influencing both arthropod abundance and vegetative structure [5,12]. Although most of the literature suggests that non-native vegetation negatively affects habitat structure for bats by acting as clutter that obstructs flight and impedes echolocation, non-native plants often suppress native tree and shrub seedlings and create forest structures with open midstories and canopies. Such open habitats may facilitate flight and predator avoidance [25,33], ultimately increasing their use by bats.
Because many bats, including all temperate North American species, echolocate [34], passive acoustic monitoring has become a valuable tool for evaluating how bats are affected by factors such as non-native plants [35,36]. Bats produce echolocation pulses at a consistent rate to navigate and hunt [37,38]; thus, the number of pulses recorded can be a proxy for bat activity [39]. Moreover, when a bat detects a prey item, it deviates from its consistent echolocation pattern and produces a terminal buzz, whereby the bat directs pulses toward the target prey at an increasingly rapid rate until it is found and consumed [40]. Therefore, the number of terminal buzzes recorded can be a proxy for foraging activity [41]. Acoustic monitoring studies have implicated low prey abundance caused by non-native plants in reduced bat activity [42]. Acoustic monitoring has also revealed that non-native structural clutter impacts open-space foraging bats but not clutter-loving foragers [43]. Bat guilds or species may be impacted by non-native plants differently due to variations in foraging strategy, physiology, and prey preferences, which are all often correlated [37,40]. Insectivorous bats can be characterized into two foraging guilds based on their echolocation pulses. Species that produce low-frequency pulses (~16–33 kHz) typically forage in open habitats, such as above the forest canopy or in openings and corridors. Such low-frequency echolocation is ideal for long-range prey detection [44]. Oppositely, species that forage in cluttered habitats, such as in or below the forest canopy, generally produce high-frequency pulses (~34–50 kHz) that facilitate short-range object detection [44,45]. Thus, it is possible that non-native plants that mediate changes in overall vegetative structure, either by creating clutter or more open landscapes, may have opposite effects on bats based on their preferences in foraging habitats.
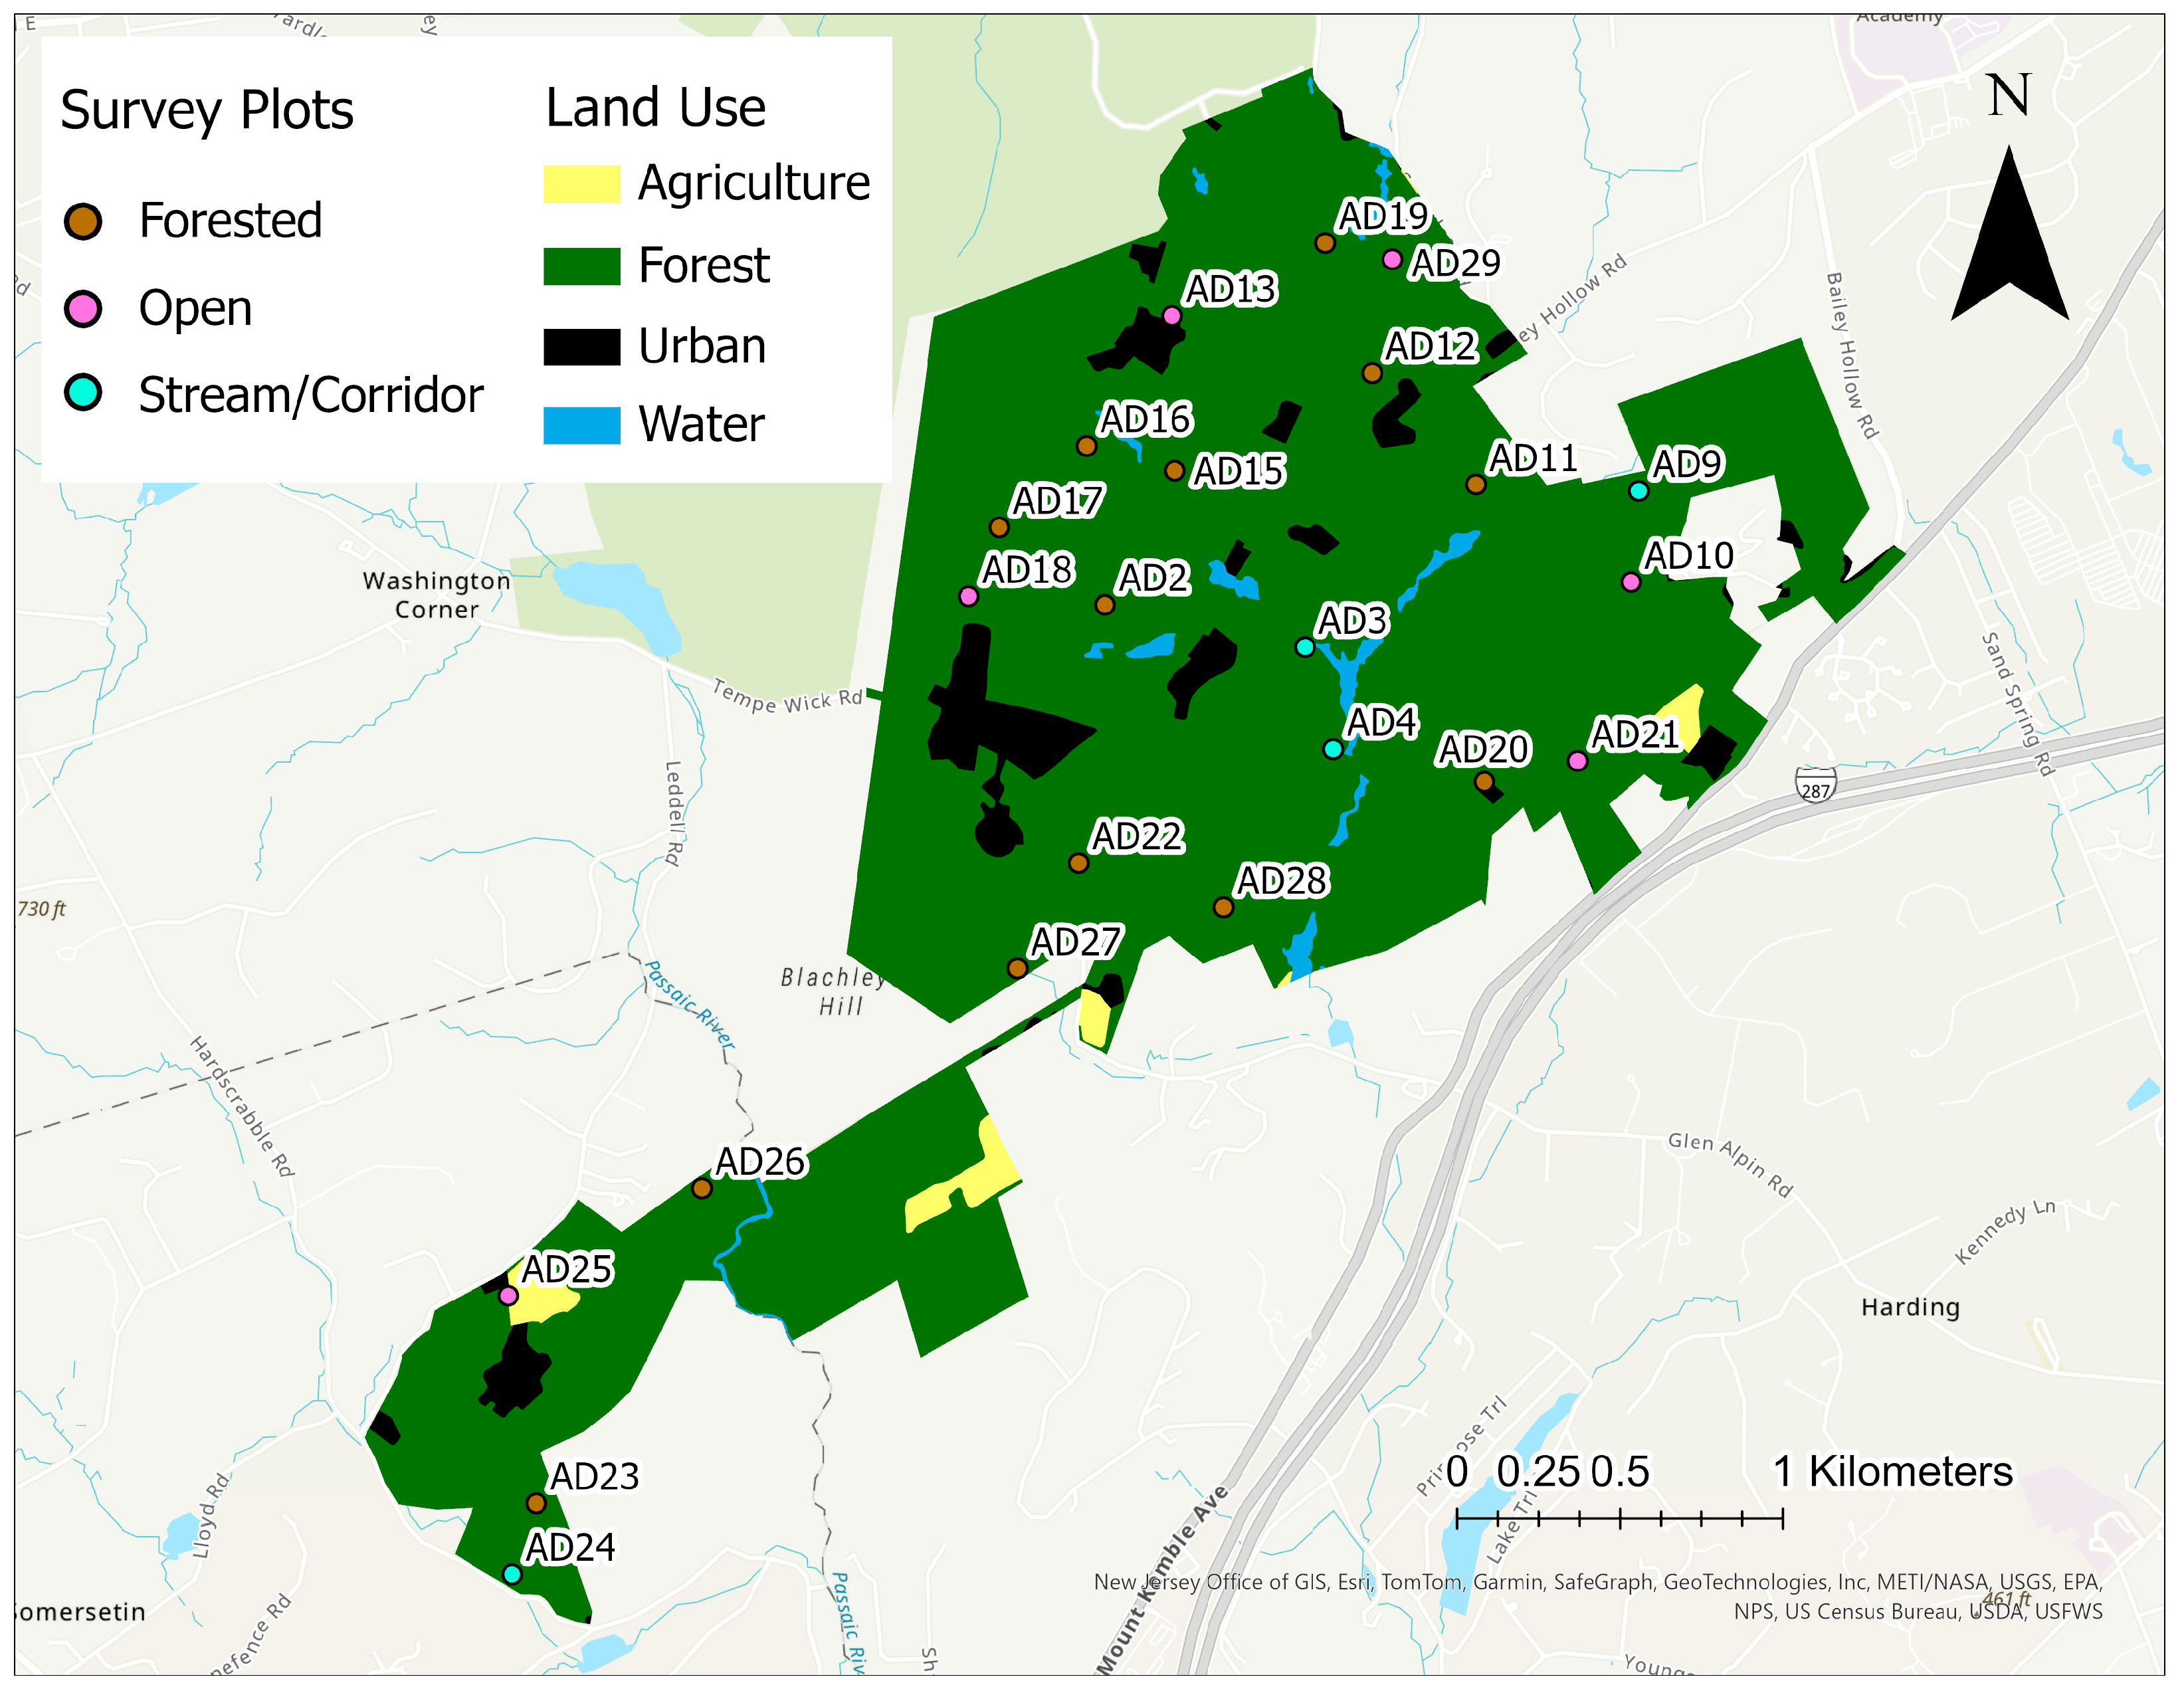
Here, we explored the relationship between non-native plants and habitat use by bats in eastern temperate forests. Using bat activity as an indicator of habitat suitability [46,47], we combined acoustic monitoring, conventional insect trapping, and vegetation surveys to investigate if bat activity is correlated with plot non-native percentage, which we defined as the average non-native cover of the ground and midstory vegetative layers. We predicted that survey plots with a high non-native percentage would also have open midstories and canopies, suggesting that non-native plants positively influence bat habitat by facilitating flight. Despite increased levels of overall bat activity, however, we also predicted that plots with high non-native percentages would exhibit reduced bat foraging activity relative to plots with low non-native percentages due to lower arthropod abundance and diversity. However, we hypothesized that non-native plants would affect bats differently depending on their foraging strategy: bats that prefer to forage in open areas (which produce low-frequency pulses) would likely be more active in survey plots with a high percent non-native, which we predicted would be more structurally open, while the opposite would be true for clutter-loving bats (which produce high-frequency pulses).

2. Materials and Methods

2.1. Study Area and Survey Locations

We conducted our study within the Morristown National Historical Park–Jockey Hollow Unit (hereafter, Jockey Hollow) in Morristown, New Jersey, USA, between June and August 2020. Jockey Hollow consists of 567 hectares of contiguous eastern temperate forest that is heavily influenced by past land uses [48]. Many of the lower-elevation areas in Jockey Hollow are dominated by early-to-mid successional species, such as tulip poplar (Liriodendron tulipifera, L.), that form an open midstory and partially open canopy. These areas often experience severe deer browse, which limits the regeneration of native vegetation and facilitates the invasion of non-native plants that deer often selectively avoid, such as multiflora rose (Rosa multiflora, Thunb.), Japanese barberry (Berberis thunbergii, DC.), and Japanese stilt grass (Microstegium vimineum, A. Camus) [49]. Such non-native plants form a dense thicket and are locally abundant in the shrub layer, outcompeting resident native shrubs such as northern spicebush (Lindera benzoin, Blume) and American witch hazel (Hamamelis virginiana, L.) [48]. Previous biodiversity surveys of Jockey Hollow confirmed the presence of four of the nine bat species in New Jersey, including big brown bat (Eptesicus fuscus, Palisot de Beauvois), eastern red bat (Lasiurus borealis, Müller), little brown bat (Myotis lucifugus, Le Conte), and northern long-eared bat (Myotis septentrionalis, Trouessart) [50].
Within the study area, we selected 23 circular plots, which we broadly classified into three habitat types, as follows: open habitats (N = 6) included locations within canopy gaps; forested habitats (N = 13) included locations with closed canopies; and stream/corridors (N = 4) included locations containing former access roads or water bodies, which are known to influence bat activity [51] (Figure 1). We delineated survey plots at a diameter of 30 m, corresponding to the presumed range of the acoustic detectors within forest habitats. We located survey plots at least 200 m apart [52] to ensure that acoustic detectors in adjacent plots were not sampling the same bat individuals. Because we wanted to explore the relationship between non-native vegetation and bat activity, we selected survey plots that ranged in percent non-native cover and other habitat characteristics that could influence bat locomotion and foraging, such as canopy cover, tree density, and shrub density.

2.2. Vegetation Surveys

To determine how plant structure and nativity (i.e., native or non-native) influence bat activity, we conducted a vegetation survey at each site within a 15 m radius of the bat detector. Because structurally cluttered environments can hinder flight and reduce bat activity [43], we quantified measures of clutter at multiple vertical strata. We measured midstory clutter by counting the number of midstory trees and shrubs, defined as woody species 2–10 m in height, in the entire plot. We measured ground layer clutter by averaging the percent ground cover of four 1 m2 quadrats placed 7.5 m from the detector in each of the four cardinal directions. We also documented what percentage of midstory trees and shrubs in the plot and the ground layer in the four quadrats were non-native.
To test the hypothesis that a closed canopy facilitates bat activity by reducing predation risk, we also measured canopy cover by averaging five spherical crown densiometer measurements recorded in each plot, one from the center of the plot and one from a random point in each cardinal direction. Finally, we calculated the overall plot percent non-native to investigate a possible relationship between plant composition and bat activity. Because every site had a fully native canopy (i.e., no non-native canopy trees), we only considered the ground and midstory layers in our calculation. Therefore, we averaged the percent midstory non-native and four non-native ground cover percentages, one from each quadrat, to obtain the plot percent non-native.

2.3. Acoustic Surveys and Bat Echolocation Analysis

From June to August 2020, we monitored survey plots for bats following the North American Bat (NABat) Monitoring Program protocols for stationary acoustic monitoring [39]. At the center of each survey plot, we placed a Pettersson D500X (Pettersson Elektronik AB, Uppsala, Sweden) acoustic detector equipped with a full-spectrum omni-directional ultrasonic microphone. We mounted the microphone approximately 3 m off the ground and angled it approximately 45° upward into the airspace [41]. At each survey plot, we recorded bat echolocation pulses for two consecutive nights that were forecasted to have little to no precipitation and wind speeds below 10 km/h [41]. The detectors were active from 30 min before sunset to 30 min after sunrise with a 500 kHz sampling frequency and medium trigger sensitivity to reduce nontarget noise recordings. Once triggered, detectors recorded for three seconds and stored recordings as .WAV files. Because we assumed that each recording was a succession of pulses, or a pass, produced by one individual as it flew near the detector, we quantified general bat activity and foraging activity by counting the total number of recorded passes and terminal buzzes, respectively, from a survey location over the two-night monitoring period.
We analyzed all recordings using the SonoBat 4.4.5 software and the northeastern North America regional library [53]. We first used the file-scrubbing function in SonoBat to eliminate recordings that did not meet the default medium-quality threshold. We then programmed the Batch Classification in SonoBat according to NABat guidelines to classify the remaining recordings that surpassed the acceptable quality threshold of 0.80. After this filtering process, recordings that were below the automatic classification threshold of 0.90, and therefore unidentifiable to species level, were labeled as high-frequency or low-frequency unknowns in SonoBat. Recordings that surpassed the automatic classification threshold of 0.90 and contained at most 16 consecutive echolocation pulses were then automatically classified by SonoBat as one of the nine bat species found in New Jersey. Three bat species in New Jersey produce low-frequency pulses, including big brown bat, hoary bat (Lasiurus cinereus, Palisot de Beauvois), and silver-haired bat (Lasiurus noctivagans, Le Conte) [54]. We summed the passes produced by these bats and the low-frequency unknown classification to calculate the total number of low-frequency passes. Six species in New Jersey produce high-frequency pulses, including little brown bat, Indiana bat, eastern red bat, northern long-eared bat, evening bat (Nycticeius humeralis, Rafinesque), and tricolored bat (Perimyotis subflavus, Cuvier). We summed the passes produced by these bats and the high-frequency unknown classifications to calculate the total number of high-frequency passes.
We used the sonogram viewing window in SonoBat to manually verify automatic classifications and to detect terminal buzzes. To minimize false-positive detections, we manually vetted every pass and corrected erroneous automatic classifications made by SonoBat. Because of their often indistinguishable pulse characteristics, we combined the little brown bat (Myotis LUcifugus) and Indiana bat (Myotis SOdalis, Miller & Allen) classifications into a single LUSO category, which we subsequently treated as a single sonotype [41,55]. A terminal buzz can be heard as a distinct pitch change when played at 10× reduced speed and visualized as a short burst of accelerating pulses in the sonogram viewing window [41]. Although terminal buzzes can be identified using the sonograms produced by SonoBat, they often cannot be reliably classified into species because they are accompanied by changes in typical pulse characteristics. Accordingly, we manually classified all files containing a terminal buzz as either low- or high-frequency unknowns.

2.4. Arthropod Surveys

Concurrent with each acoustic survey, we deployed a blacklight insect bucket trap (Leptraps, LLC, Georgetown, KY, USA) within 10 m of each survey plot. This distance is sufficiently close to the survey plot to appropriately characterize the arthropod community without influencing bat activity [56,57]. Traps consisted of 15 W T8 blacklight bulbs (PestWest, Sarasota, FL, USA), drawing arthropods into a catch bucket lined with Vaportape II insecticidal strips (Hercon, Emigsville, PA, USA) raised ~0.3 m above the ground. On the morning immediately following each two-day bat survey, we transferred the contents of the trap into an airtight plastic bag and stored them in a freezer at −20 °C until processing. We then soaked all arthropods in 95% ethanol before counting and sorting them by order. We calculated the Shannon diversity index of all arthropod orders at each site using the vegan package in R [58]. We also calculated the order richness of all arthropods at each site. We calculated the abundance of potential arthropod prey at each site by taking the sum of the orders typically eaten by insectivorous bats in New Jersey, i.e., Coleoptera, Diptera, Hemiptera, Hymenoptera, Lepidoptera, and Trichoptera [59].

2.5. Statistical Analysis

We performed all statistical analyses using R v3.3.0+ [60]. We manipulated data using the dplyr package [61] and created plots using the ggplot2 package [62]. To ensure that all measured variables exerted similar influences on the models, we scaled and centered all predictor variables to have a mean of 0 and a standard deviation of 1. To obtain standard error values, we calculated bootstrapped means using 1000 replicates in the boot package [63]. To test the hypothesis that non-native plants affect arthropod prey, we performed linear mixed-effects models (LMERs) in the lme4 package [64] using non-native vegetation percentage as the predictor and either prey abundance or total arthropod order diversity as the response. We included the month as a random effect to account for potential declines in arthropod abundance and diversity as the year progresses from spring to fall [65]. We also conducted a generalized linear model (GLM) in the stats package [60] using percent non-native as the predictor and total arthropod order richness as the response. We used ANOVA in the stats package to confirm that prey abundance and total arthropod order diversity differed significantly by survey month (June, July, August).
To elucidate the relationships between non-native plants and habitat structure, we performed LMERs using non-native percentage as the predictor and either canopy cover or ground cover as the response. We included habitat type as a random effect to account for differing vegetative communities and structures in open, forested, and stream/corridor habitats. We also conducted a GLM using a quasipoisson family to determine if percent non-native was correlated with midstory clutter. We used percent non-native as the predictor and midstory trees and shrubs as the response for this GLM.
We performed GLMs in the MASS package [66] using a negative binomial family to determine the relative effects of vegetative structure, vegetative nativity, and prey availability on bat activity and foraging. We generated fifteen candidate models to test biologically relevant hypotheses about bat behavior (Table 1). To determine which predictors were most strongly associated with bat activity, we used the MuMIn package [67] to conditionally average all candidate models within 2 ∆AICc scores of the top model [68]. This yielded model-averaged coefficients for each of the top predictors, calculated by averaging over the models where the predictor appeared, which we then compared to assess their magnitude and direction on bat activity. To determine the relative effects of the predictors on bats that use differing foraging strategies, we performed two GLMs as described above, one for total low-frequency bat passes and one for total high-frequency bat passes. We again averaged all candidate models within 2 ∆AICc scores of the top model.

3. Results

3.1. Vegetation and Arthropod Surveys

The percent of non-native vegetation in each plot ranged from 0 to 92.9% ( x ¯ = 46.94 ± 5.77 SE) and had a significant positive relationship with both midstory trees and shrubs (β = 0.01 ± 0.006 SE) and ground cover (β = 0.36 ± 0.14 SE; Figure 2).
Of the 20,474 total arthropods captured, we considered 19,825 (96.8%) to be potential prey for insectivorous bats (Appendix A). Putative prey abundance varied across survey plots, ranging between 96 and 1462 individuals ( x ¯ = 861 ± 85.5 SE). The arthropod community was dominated by lepidopterans (N = 8399), coleopterans (N = 4496), and trichopterans (N = 4318), but hemipterans (N = 734) and hymenopterans (N = 615) were also well represented at our plots. Coleopterans, dipterans, hymenopterans, and lepidopterans occurred at every survey location. Prey abundance (β = −0.81 ± 2.57 SE), total arthropod order diversity (β = −0.001 ± 0.001 SE), and total arthropod order richness (β = −0.001 ± 0.001 SE) were not significantly correlated with non-native percentage.

3.2. Acoustic Surveys

Over 46 recording nights, we collected 3614 usable bat passes, 303 of which contained terminal buzzes (Appendix B). Bat activity and foraging varied widely by survey plot, ranging from 5 to 684 total passes ( x ¯ = 157 ± 34.28 SE) and from 0 to 80 terminal buzzes ( x ¯ = 13 ± 3.75 SE) recorded over the two-night monitoring period. Because we treated LUSO as a single sonotype, we recorded all “eight” bat species found in New Jersey. Big brown bats were recorded most frequently (51.7%), followed by low-frequency unknowns (18.2%) and hoary bats (11.4%). We recorded 3074 total low-frequency passes (85.0%) and 540 total high-frequency passes (14.9%). We recorded only three northern long-eared bat passes and two tricolored bat passes, both of which produce high-frequency pulses.

3.3. Predictors of Bat Activity

The top models for total bat passes and terminal buzzes were midstory structure (number of midstory trees and shrubs and percent non-native) and non-native percentage, respectively. Percent non-native had a significant positive effect on both total passes (β = 0.92 ± 0.38 SE; Figure 3a) and terminal buzzes (β = 1.57 ± 0.46 SE; Figure 3b). Midstory trees and shrubs had a significant negative effect on total passes (β = −0.58 ± 0.27 SE), but not terminal buzzes (β = −0.37 ± 0.34 SE). Although canopy cover was a covariate in two of the top-ranked models for total passes, it was not a significant predictor. Prey abundance and ground cover were not included in any top-ranked models and were therefore not significant predictors of overall bat activity or foraging.
The trends for low-frequency passes were nearly identical to those for total passes. The top model for total low-frequency passes included the number of midstory trees and shrubs (β = −0.64 ± 0.29 SE) and non-native percentage (β = 1.12 ± 0.41 SE), both of which had a significant effect on low-frequency passes (Figure 3c). There were no significant predictors of total high-frequency bat passes (Figure 3d). Detailed GLM results are in Appendix C.

4. Discussion and Conclusions

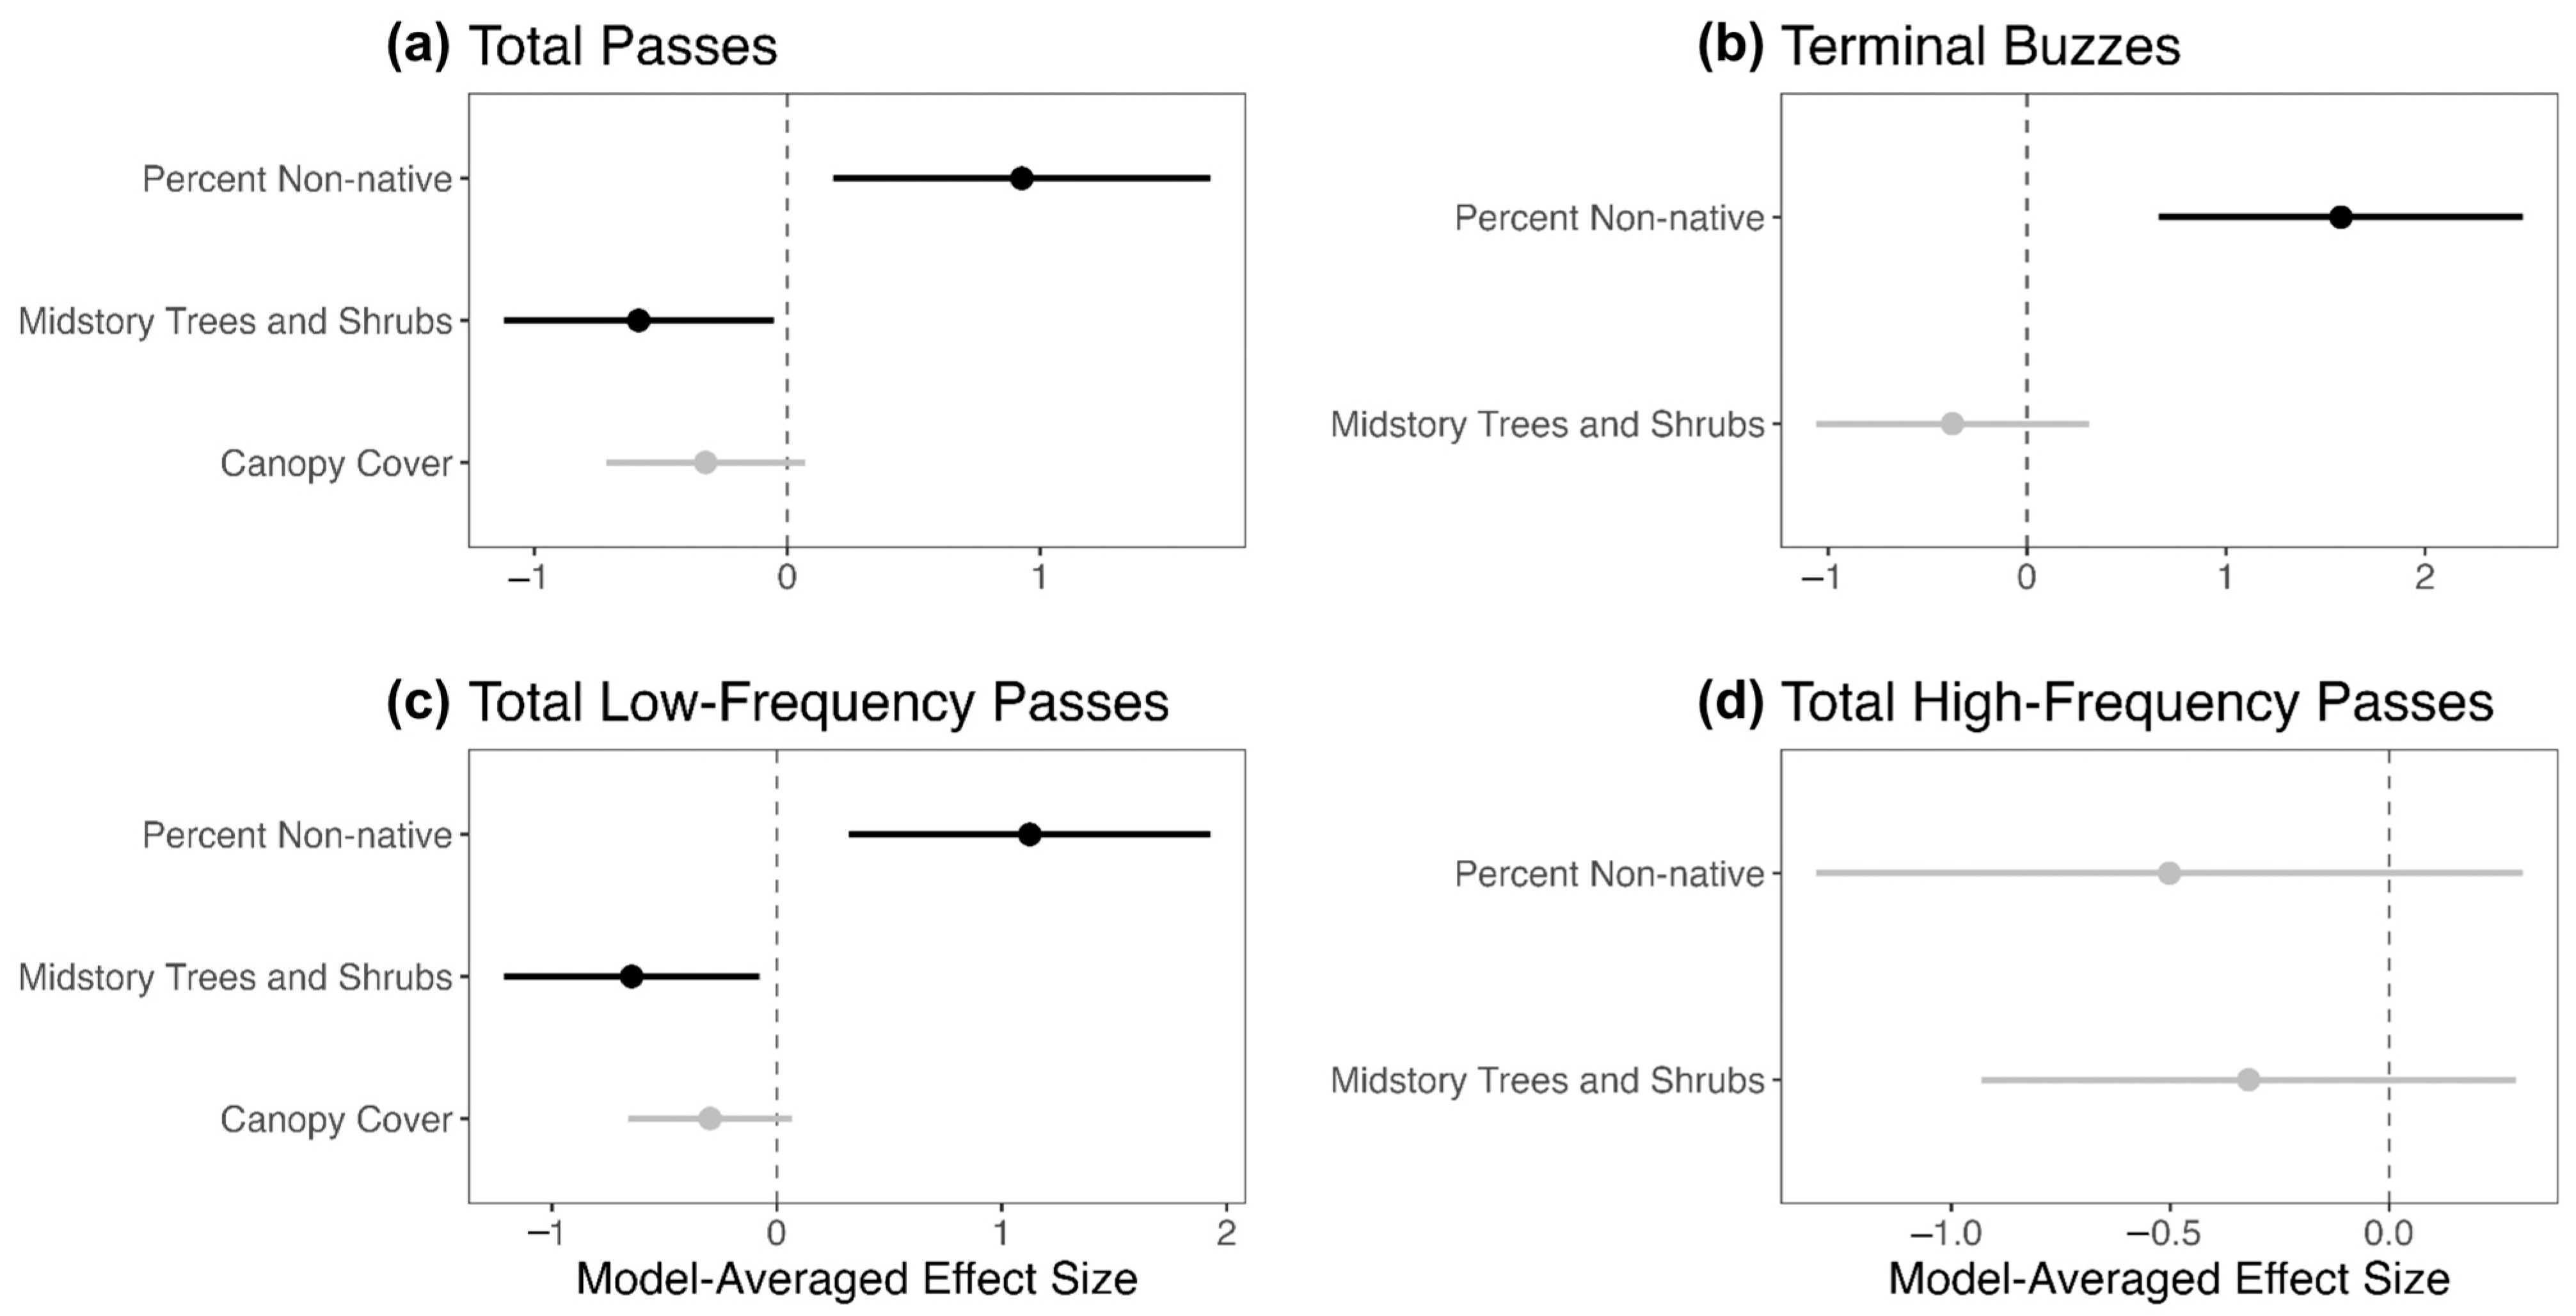
Overall, our research suggests that non-native vegetation does not have a completely negative impact on forest habitat use by bats. This conclusion is driven by two important findings. First, the percentage of non-native vegetation at a plot had the largest and most positive effect on both total passes, a proxy for overall bat activity, as well as terminal buzzes, a proxy for foraging activity, indicating that bats were more active in plots with higher percentages of non-native plants. Second, non-native percentage was not significantly correlated with putative prey abundance, which itself did not have a significant effect on overall bat activity or foraging activity. Together, such results suggest that bats value habitat structure more than prey availability when using foraging habitats and that non-native plants may benefit bats by creating habitat structures more conducive to foraging.
Contrary to our predictions and the findings of previous studies [69,70], putative prey abundance and total arthropod order diversity and richness were not correlated with plot percent non-native. This could suggest that either non-native plants altered arthropod species composition without changing diversity and richness, or that arthropod communities were similar amongst all plots regardless of percent non-native. The former could occur if a diverse and species-rich community of non-native arthropods replaced the pre-existing native community. It is well documented that non-native plants can be toxic to and reduce the abundance of native arthropod species [12,71]. Because most herbivorous insects are specialists that have coevolved with one or a few plant lineages, native arthropods are likely unequipped to combat the chemical and physical defenses of non-native plants [72,73]. Therefore, non-native insects, especially those that have coevolved with a specific non-native plant, may fill niches opened by the loss of native insects, leading to no net reductions in overall arthropod abundance.
Alternatively, it is possible that the introduction of non-native plants to our study area had little to no effect on the pre-existing arthropod community. Some native insects demonstrate plasticity in host plant preference and could prefer to use non-native vegetation [74,75]. Non-native plants can also be highly suitable for native insects and actually increase arthropod fitness [76]. In such cases, native insect abundance could even increase post-invasion, although this was not detected in our study. In addition, many plants introduced to North America are closely related to native species (e.g., the non-native Lonicera japonica is a congener of L. sempervirens, L., an eastern North American native), increasing the likelihood that an herbivore that specializes in a native plant can exploit a closely related plant that produces similar chemical compounds [73]. We did not classify arthropods into species; therefore, the mechanisms driving our results are not known.
A non-significant change in arthropod abundance, regardless of the insect community composition, logically results in few impacts on bat use of forest habitats. First, North American bats are generalist insectivores, feeding on a wide array of arthropods [59,77], suggesting that bats can tolerate small changes in arthropod availability. Thus, changes in insect diversity are likely inconsequential to bats, so long as there are ample numbers of prey items to make foraging activities beneficial. Furthermore, bats may not discriminate between native and non-native insects. Indeed, bats have been shown to consistently consume such non-native insects as brown marmorated stink bugs (Halyomorpha halys, Stål) [78], spotted lanternflies (Lycorma delicatula, White; McHale et al., unpublished data), and emerald ash borers (Agrilus planipennis, Waterhouse) [79]. Thus, bats may cope with decreased abundances of native prey by consuming non-native species, which often occur in high abundances [80,81]. It is important to note that we caught arthropods in every survey plot, indicating that even plots with the lowest recorded arthropod abundances may have had ample prey to sustain bat foraging.
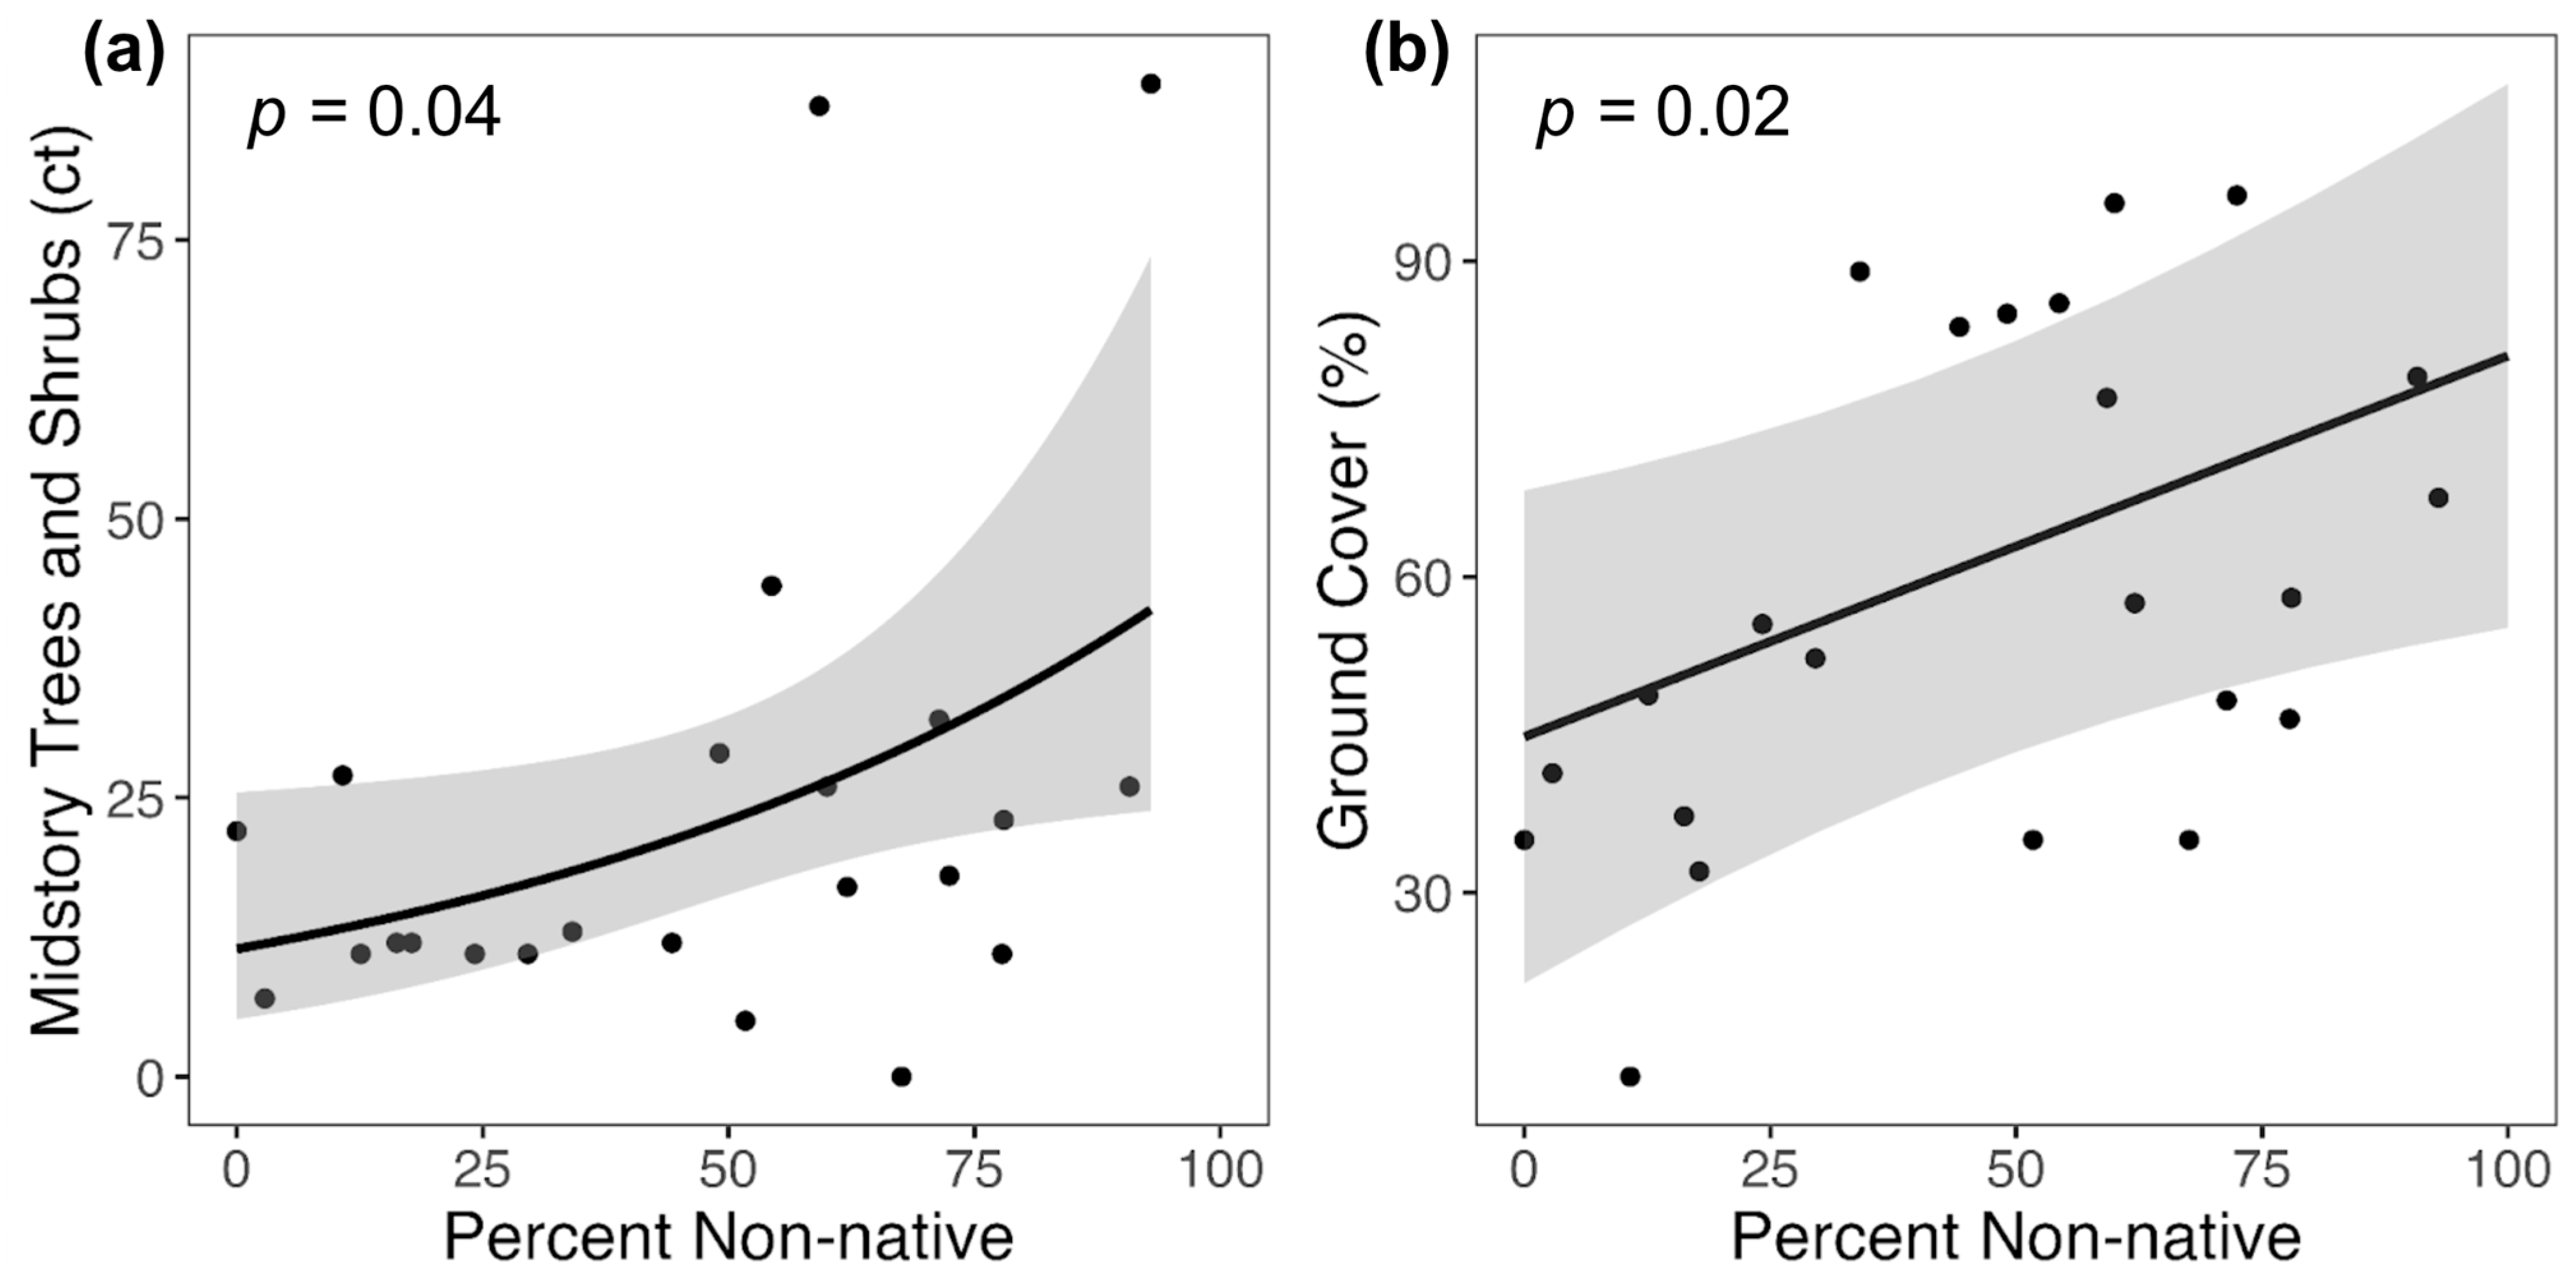
We found that the percent of non-native vegetation was also significantly and positively correlated with ground cover and the number of midstory trees and shrubs, but not correlated with canopy cover. Such findings suggest that non-native plants may proliferate in and alter the vegetative structure of the ground and midstory layers. Because North American insectivorous bats primarily use the midstory and canopy strata of forests, changes in ground-level structure likely have few direct impacts on bat activity. On the other hand, the increased number of midstory trees and shrubs, and therefore midstory clutter, associated with a higher degree of vegetative invasion, could impact bat maneuverability and foraging.
In addition to percent non-native, the number of midstory trees and shrubs also had a significant, albeit negative, effect on overall bat activity. Such results indicate that bats were more active in plots with higher percent non-native and lower midstory clutter, which is interesting given our finding that percent non-native was positively associated with midstory trees and shrubs. Logically, bats should be less active in plots with high percent non-native due to the association with increased midstory clutter. However, our model results may indicate that bats were either (1) partitioning their time between sites with only high percent non-native or only a few midstory trees and shrubs; or (2) using sites that had high percent non-native and low midstory clutter. Regarding the latter, we did survey heavily invaded plots that had fewer than 25 midstory trees and shrubs. In such plots, it is possible that non-native vegetation was concentrated at the ground layer, resulting in a high calculated plot percent non-native despite there being few, mostly native, midstory trees and shrubs. Additionally, midstory clutter did not have a significant effect on terminal buzzes, which could suggest that the habitat structure affects bat locomotion more so than foraging. While foraging bats likely compromise their own habitat preferences for the habitat preferences of their prey, commuting bats may have fewer tradeoffs to consider and more often travel down paths of least resistance [82]. The discrepancy in the relationships between percent non-native, number of midstory trees and shrubs, and bat activity may also suggest that non-native plants may facilitate bat activity in ways that do not alter habitat structure, such as by improving habitat quality (e.g., providing roost sites). Further research should be conducted to determine the mechanisms by which non-native plants affect bats.
Although none of our measured predictors significantly affected total high-frequency passes, both percent non-native and the number of midstory trees and shrubs significantly affected total low-frequency passes, much like the model for total passes. This similarity is likely explained by the dominance within our dataset of bats that produce low-frequency pulses. The low-frequency echolocating big brown bat, responsible for over half of our recorded passes, is the most common bat in New Jersey [83]. We attribute the model results for total low-frequency passes, which comprised less than 15% of all passes recorded, to an inadequate sample size. There are several explanations for why we recorded so few low-frequency passes. First, white-nose syndrome has significantly reduced populations of previously common species that produce high-frequency pulses, such as the little brown and northern long-eared bats [84,85]. Alternatively, many areas within Jockey Hollow are dominated by non-native vegetation and have low densities of midstory trees and shrubs, both of which seem to facilitate the activity of bats with low-frequency pulses. Therefore, the noticeably low number of high-frequency passes recorded is not surprising but does prevent us from concluding if non-native plants or habitat structure affect bats at Jockey Hollow differently depending on their foraging preferences.

Implications for Forest Management

Managers often recommend removing non-native plants in both forested and urban landscapes because it can significantly increase insectivorous bat activity [43,86,87]. However, our results suggest that in the short term, non-native plants might not be detrimental to bats and may even benefit them by maintaining open flight space beneath the forest canopy. However, we are uncertain about how bats are impacted in the long term by non-native shrubs, especially in conjunction with deer browse. In the United Kingdom, the presence of a non-native rhododendron and red deer (Cervus elaphus, L.) negatively affected insectivorous bats that prefer to forage in open spaces [43]. Both non-native plants and deer browse can hinder the survival of native seedlings, which could eventually decrease plant richness and woody species recruitment [88,89]. As native trees die, these habitats may transition to having cluttered midstories and little to no canopy, which could negatively impact bats.
Our findings demonstrate that there are complex relationships between native and non-native species that warrant further study. Because bats seem to highly value habitat structure when choosing where to travel and forage, management activities that remove non-native plants while maintaining structural attributes preferred by bats are likely to sustain bat activity. Therefore, reducing midstory clutter and removing non-native shrubs could create travel corridors that facilitate foraging for bats with low-frequency pulses, the most common species detected at Jockey Hollow. Unfortunately, we collected insufficient data to draw conclusions about what structural habitat attributes significantly influenced high-frequency bat activity. Such an evidence base is needed to facilitate habitat-based bat conservation, particularly for bats impacted by other threats such as white-nose syndrome and wind energy infrastructure [90,91]. Because our model results were largely driven by big brown bats, we cannot advocate for a single management solution for increasing the activity of all bats. It is likely that a variety of management techniques that promote or maintain structurally heterogeneous habitats will support the greatest bat diversity. Further studies targeting bats with high-frequency pulses can reduce the uncertainty surrounding the impacts of non-native plants on bats of the highest conservation concern.

Author Contributions

Conceptualization, B.M. and K.K.; Methodology, K.K.; Data curation, M.M., E.D. and K.K.; Formal analysis, M.M.; Writing, M.M., E.D. and B.M.; Project administration, B.M.; Funding acquisition, B.M. All authors have read and agreed to the published version of the manuscript.

Funding

This research was funded by the National Park Service Cooperative Research and Training Grant [number P20AC00480].

Data Availability Statement

Raw data associated with this paper are stored within the Rutgers Libraries Data Portal, which maintains all Rutgers-produced datasets. Data can be freely accessed through this portal.

Acknowledgments

Special thanks to Park Biologist Bob Masson, Park Law Enforcement, for facilitating field surveys, and to Justin Martinez and Kelly Faller for assisting with data collection. We also thank Mark Ford, Samantha Hoff, Joy O’Keefe, and Susan Loeb for their constructive feedback on previous drafts.

Conflicts of Interest

The authors declare that they have no known competing financial interests or personal relationships that could have appeared to influence the work reported in this paper.

Appendix A

Table A1. Counts of arthropods collected in blacklight traps deployed at 23 plots in northern New Jersey, USA, in summer 2020.
PlotTotal Arthropod AbundancePutative Prey AbundanceShannon Diversity IndexAraneaeBlattodeaColeopteraDipteraHemipteraHymenopteraLepidopteraMantodeaMegalopteraNeuropteraOdonataOpilionesOrthopteraPlecopteraSiphonapteraTrichoptera
AD27537391.3440915801837300304210199
AD3162014621.541080676152236500130000270304
AD47026941.33001041762829601000070243
AD9142213731.551141954613062688002000320252
AD10123312181.352458918652936501203030152
AD116105611.5943122172711278000032370106
AD12100961.5000109111500000400015
AD135075010.7620535108500000400393
AD15121811451.45003141028164930137000350284
AD162752751.04001643171850000000023
AD177897841.450027527442328500021200130
AD186416361.64401876759292020010000092
AD19146314521.0500654135552678001101440
AD20103510291.110015920115067400600000115
AD21118211741.020636141802690200000000
AD22104710391.280012436142436600400040475
AD23142313871.56110469555889528002143150188
AD248527041.63102921028917700230001240188
AD254534531.66005436704115000000000102
AD261741720.8000181111340000200017
AD27147514381.1700128191197010011001250570
AD288978931.390019117254238400100030234
AD296036001.2600582403025200000120236

Appendix B

Table A2. Counts of passes recorded by acoustic detectors deployed at 23 plots in northern New Jersey, USA, in summer 2020.
PlotTerminal BuzzesTotal PassesLow Freq. UnknownHigh Freq. UnknownE. fuscusL. borealisL. cinereusL. noctivagansM. lucifugus/sodalisM. septentrionalisN. humeralisP. subflavus
AD29140995168012000
AD3353220200920000
AD444667235000050
AD9354140391000000
AD101151157100000
AD11171001535127310000
AD12051110001100
AD1391906233251522292020
AD15615538304431030090
AD16040143212000000
AD171011424274516010010
AD188052560211521271551000
AD19362912612525420100
AD203029732622431400000
AD2145632465000000
AD221921523538002000
AD23992339353800040
AD245179116172331412102
AD25192475921051843200000
AD2602212161110000
AD2746075411510000
AD281615723129071840030
AD293768480205642990000
Total30336146611941871307412130103242

Appendix C

Table A3. Top models (<2 ∆AICc scores from top model) for total low-frequency passes recorded in northern New Jersey, USA, in summer 2020.
ModelAICc∆AICc from Top Model
1. Midstory Trees and Shrubs + Percent Non-native270.230.00
2. Percent Non-native270.940.71
3. Canopy Cover + Midstory Trees and Shrubs + Percent Non-native271.601.36
Table A4. Effect sizes for predictors in top models for total low-frequency passes recorded in northern New Jersey, USA, in summer 2020.
PredictorModel 1Model 2Model 3
Midstory Trees and Shrubs−0.66 ± 0.29 SE−0.61 ± 0.28 SE
Percent Non-native1.25 ± 0.39 SE1.05 ± 0.38 SE0.95 ± 0.39 SE
Canopy Cover−0.29 ± 0.18 SE
Table A5. Top models (<2 ∆AICc scores from top model) for total passes recorded in northern New Jersey, USA, in summer 2020.
ModelAICc∆AICc from Top Model
1. Midstory Trees and Shrubs + Percent Non-native279.580.00
2. Percent Non-native280.210.62
3. Canopy Cover + Midstory Trees and Shrubs + Percent Non-native281.451.87
4. Canopy Cover281.501.91
Table A6. Effect sizes for predictors in top models for total passes recorded in northern New Jersey, USA, in summer 2020.
PredictorModel 1Model 2Model 3Model 4
Midstory Trees and Shrubs−0.59 ± 0.36 SE−0.56 ± 0.26 SE
Percent Non-native1.03 ± 0.36 SE0.84 ± 0.35 SE0.79 ± 0.37 SE
Canopy Cover−0.23 ± 0.17 SE−0.41 ± 0.18 SE
Table A7. Top models (<2 ∆AICc scores from top model) for terminal buzzes recorded in northern New Jersey, USA, in summer 2020.
ModelAICc∆AICc from Top Model
1. Percent Non-native162.520.00
2. Midstory Trees and Shrubs + Percent Non-native164.351.83
Table A8. Effect sizes for predictors in top models for terminal buzzes recorded in northern New Jersey, USA, in summer 2020.
PredictorModel 1Model 2
Percent Non-native1.54 ± 0.45 SE1.65 ± 0.48 SE
Midstory Trees and Shrubs−0.37 ± 0.34 SE
Table A9. Top models (<2 ∆AICc scores from top model) for total high-frequency passes recorded in northern New Jersey, USA, in summer 2020.
ModelAICc∆AICc from Top Model
1. Null model196.730.00
2. Percent Non-native198.181.45
3. Midstory Trees and Shrubs198.321.58
Table A10. Effect sizes for predictors in top models for total high-frequency passes recorded in northern New Jersey, USA, in summer 2020.
PredictorModel 1Model 2Model 3
Percent Non-native−0.50 ± 0.41 SE
Midstory Trees and Shrubs−0.32 ± 0.31 SE

References

  1. Kettenring, K.M.; Adams, C.R. Lessons learned from invasive plant control experiments: A systematic review and meta-analysis. J. Appl. Ecol. 2011, 48, 970–979. [Google Scholar] [CrossRef]
  2. Mack, R.N.; Simberloff, D.; Mark Lonsdale, W.; Evans, H.; Clout, M.; Bazzaz, F.A. Biotic invasions: Causes, epidemiology, global consequences, and control. Ecol. Appl. 2000, 10, 689–710. [Google Scholar] [CrossRef]
  3. Fletcher, R.A.; Brooks, R.K.; Lakoba, V.T.; Sharma, G.; Heminger, A.R.; Dickinson, C.C.; Barney, J.N. Invasive plants negatively impact native, but not exotic, animals. Glob. Change Biol. 2019, 25, 3694–3705. [Google Scholar] [CrossRef] [PubMed]
  4. Hall, L.S.; PKrausman, R.; Morrison, M.L. The habitat concept and a plea for standard terminology. Wildl. Soc. Bull. 1997, 25, 173–182. [Google Scholar]
  5. Asner, G.P.; Hughes, R.F.; Vitousek, P.M.; Knapp, D.E.; Kennedy-Bowdoin, T.; Boardman, J.; Martin, R.E.; Eastwood, M.; Green, R.O. Invasive plants transform the three-dimensional structure of rain forests. Proc. Natl. Acad. Sci. USA 2008, 105, 4519–4523. [Google Scholar] [CrossRef]
  6. Vitousek, P.M.; Walker, L.R.; Whiteaker, L.D.; Mueller-Dombois, D.; Matson, P.A. Biological invasion by Myrica faya alters ecosystem development in Hawaii. Science 1987, 238, 802–804. [Google Scholar] [CrossRef]
  7. Drake, K.K.; Bowen, L.; Nussear, K.E.; Esque, T.C.; Berger, A.J.; Custer, N.A.; Waters, S.C.; Johnson, J.D.; Miles, A.K.; Lewison, R.L. Negative impacts of invasive plants on conservation of sensitive desert wildlife. Ecosphere 2016, 7, e01531. [Google Scholar] [CrossRef]
  8. Dutra, H.P.; Barnett, K.; Reinhardt, J.R.; Marquis, R.J.; Orrock, J.L. Invasive plant species alters consumer behavior by providing refuge from predation. Oecologia 2011, 166, 649–657. [Google Scholar] [CrossRef]
  9. McCary, M.A.; Mores, R.; Farfan, M.A.; Wise, D.H. Invasive plants have different effects on trophic structure of green and brown food webs in terrestrial ecosystems: A meta-analysis. Ecol. Lett. 2016, 19, 328–335. [Google Scholar] [CrossRef]
  10. Manchester, S.J.; Bullock, J.M. The impacts of non-native species on UK biodiversity and the effectiveness of control. J. Appl. Ecol. 2000, 37, 845–864. [Google Scholar] [CrossRef]
  11. Mangla, S.; Inderjit; Callaway, R.M. Exotic invasive plant accumulates native soil pathogens which inhibit native plants. J. Ecol. 2008, 96, 58–67. [Google Scholar] [CrossRef]
  12. Bezemer, T.M.; Harvey, J.A.; Cronin, J.T. Response of native insect communities to invasive plants. Annu. Rev. Entomol. 2014, 59, 119–141. [Google Scholar] [CrossRef] [PubMed]
  13. Collier, M.H.; Vankat, J.L.; Hughes, M.R. Diminished plant richness and abundance below Lonicera maackii, an invasive shrub. Am. Midl. Nat. 2002, 147, 60–71. [Google Scholar] [CrossRef]
  14. Crooks, J.A. Characterizing ecosystem-level consequences of biological invasions: The role of ecosystem engineers. Oikos 2002, 97, 153–166. [Google Scholar] [CrossRef]
  15. McKinney, A.M.; Goodell, K. Shading by invasive shrub reduces seed production and pollinator services in a native herb. Biol. Invasions 2010, 12, 2751–2763. [Google Scholar] [CrossRef]
  16. Stewart, P.S.; Hill, R.A.; Stephens, P.A.; Whittingham, M.J.; Dawson, W. Impacts of invasive plants on animal behaviour. Ecol. Lett. 2021, 24, 891–907. [Google Scholar] [CrossRef] [PubMed]
  17. Maynard-Bean, E.; Kaye, M. Invasive shrub removal benefits native plants in an eastern deciduous forest of North America. Invasive Plant Sci. Manag. 2019, 12, 3–10. [Google Scholar] [CrossRef]
  18. Trammell, T.L.; D’Amico, V., III; Avolio, M.L.; Mitchell, J.C.; Moore, E. Temperate deciduous forests embedded across developed landscapes: Younger forests harbour invasive plants and urban forests maintain native plants. J. Ecol. 2020, 108, 2366–2375. [Google Scholar] [CrossRef]
  19. Silaeva, T.; Andreychev, A.; Kiyaykina, O.; Balčiauskas, L. Taxonomic and ecological composition of forest stands inhabited by forest dormouse Dryomys nitedula (Rodentia: Gliridae) in the Middle Volga. Biologia 2021, 76, 1475–1482. [Google Scholar] [CrossRef]
  20. Augustine, K.E.; Kingsolver, J.G. Biogeography and phenology of oviposition preference and larval performance of Pieris virginiensis butterflies on native and invasive host plants. Biol. Invasions 2018, 20, 413–422. [Google Scholar] [CrossRef]
  21. Davis, S.L.; Cipollini, D. Do mothers always know best? Oviposition mistakes and resulting larval failure of Pieris virginiensis on Alliaria petiolata, a novel, toxic host. Biol. Invasions 2014, 16, 1941–1950. [Google Scholar] [CrossRef]
  22. Magee, C.S.; Van Clef, M. Plant structure of hooded and Kentucky warbler breeding sites in New Jersey. Cassinia 2016, 76, 30–35. [Google Scholar]
  23. Borgmann, K.L.; Rodewald, A.D. Nest predation in an urbanizing landscape: The role of exotic shrubs. Ecol. Appl. 2004, 14, 1757–1765. [Google Scholar] [CrossRef]
  24. Carter, E.T.; Eads, B.C.; Ravesi, M.J.; Kingsbury, B.A. Exotic invasive plants alter thermal regimes: Implications for management using a case study of a native ectotherm. Funct. Ecol. 2015, 29, 683–693. [Google Scholar] [CrossRef]
  25. Welch, J.N.; Leppanen, C. The threat of invasive species to bats: A review. Mammal Rev. 2017, 47, 277–290. [Google Scholar] [CrossRef]
  26. Arnett, E.B.; Baerwald, E.F.; Mathews, F.; Rodrigues, L.; Rodríguez-Durán, A.; Rydell, J.; Villegas-Patraca, R.; Voigt, C.C. Impacts of wind energy development on bats: A global perspective. In Bats in the Anthropocene: Conservation of Bats in a Changing World; Springer: Berlin/Heidelberg, Germany, 2016; pp. 295–323. [Google Scholar]
  27. Cheng, T.L.; Reichard, J.D.; Coleman, J.T.; Weller, T.J.; Thogmartin, W.E.; Reichert, B.E.; Bennett, A.B.; Broders, H.G.; Campbell, J.; Etchison, K. The scope and severity of white-nose syndrome on hibernating bats in North America. Conserv. Biol. 2021, 35, 1586–1597. [Google Scholar] [CrossRef]
  28. Brigham, R.M. Bats in Forests: What We Know and What We Need to Learn. Bats in Forests: Conservation and Management; Johns Hopkins University Press: Baltimore, MD, USA, 2007; pp. 1–15. [Google Scholar]
  29. Harvey, M.J.; Altenbach, J.S.; Best, T.L. Bats of the United States and Canada; JHU Press: Baltimore, MD, USA, 2011. [Google Scholar]
  30. Wunder, L.; Carey, A.B. Use of the forest canopy by bats. Northwest Sci. 1996, 70, 79–85. [Google Scholar]
  31. Bender, M.J.; Perea, S.; Castleberry, S.B.; Miller, D.A.; Wigley, T.B. Influence of insect abundance and vegetation structure on site-occupancy of bats in managed pine forests. For. Ecol. Manag. 2021, 482, 118839. [Google Scholar] [CrossRef]
  32. Froidevaux, J.S.; Barbaro, L.; Vinet, O.; Larrieu, L.; Bas, Y.; Molina, J.; Calatayud, F.; Brin, A. Bat responses to changes in forest composition and prey abundance depend on landscape matrix and stand structure. Sci. Rep. 2021, 11, 10586. [Google Scholar] [CrossRef]
  33. Brigham, R.; Grindal, S.; Firman, M.; Morissette, J. The influence of structural clutter on activity patterns of insectivorous bats. Can. J. Zool. 1997, 75, 131–136. [Google Scholar] [CrossRef]
  34. Hutson, A.M.; Hutson, A.M.; Mickleburgh, S.P.; Racey, P. Microchiropteran Bats: Global Status Survey and Conservation Action Plan; IUCN: Gland, Switzerland, 2001; Volume 56. [Google Scholar]
  35. Frick, W.F. Acoustic monitoring of bats, considerations of options for long-term monitoring. Therya 2013, 4, 69–70. [Google Scholar] [CrossRef]
  36. Russo, D.; Voigt, C.C. The use of automated identification of bat echolocation calls in acoustic monitoring: A cautionary note for a sound analysis. Ecol. Indic. 2016, 66, 598–602. [Google Scholar] [CrossRef]
  37. Denzinger, A.; Schnitzler, H.-U. Bat guilds, a concept to classify the highly diverse foraging and echolocation behaviors of microchiropteran bats. Front. Physiol. 2013, 4, 164. [Google Scholar] [CrossRef] [PubMed]
  38. Jones, G.; Teeling, E.C. The evolution of echolocation in bats. Trends Ecol. Evol. 2006, 21, 149–156. [Google Scholar] [CrossRef] [PubMed]
  39. Loeb, S.C.; Rodhouse, T.J.; Ellison, L.E.; Lausen, C.L.; Reichard, J.D.; Irvine, K.M.; Ingersoll, T.E.; Coleman, J.T.; Thogmartin, W.E.; Sauer, J.R. A Plan for the North American Bat Monitoring Program (NABat); General Technical Report SRS-208; US Department of Agriculture Forest Service, Southern Research Station: Asheville, NC, USA, 2015; Volume 208, pp. 1–100.
  40. Schnitzler, H.-U.; Kalko, E.K. Echolocation by insect-eating bats: We define four distinct functional groups of bats and find differences in signal structure that correlate with the typical echolocation tasks faced by each group. Bioscience 2001, 51, 557–569. [Google Scholar] [CrossRef]
  41. Drake, E.; Vonhof, M.; Maslo, B. Bat use of golf courses depends on surrounding landscape context. Urban Ecosyst. 2023, 26, 1469–1482. [Google Scholar] [CrossRef]
  42. Welch, J.N.; Fordyce, J.A.; Simberloff, D.S. Indirect impacts of invaders: A case study of the Pacific sheath-tailed bat (Emballonura semicaudata rotensis). Biol. Conserv. 2016, 201, 146–151. [Google Scholar] [CrossRef]
  43. Beason, R.D.; Riesch, R.; Koricheva, J. Tidying up the cluttered understorey: Foraging strategy mediates bat activity responses to invasive rhododendron. For. Ecol. Manag. 2020, 475, 118392. [Google Scholar] [CrossRef]
  44. Aldridge, H.; Rautenbach, I. Morphology, echolocation and resource partitioning in insectivorous bats. J. Anim. Ecol. 1987, 56, 763–778. [Google Scholar] [CrossRef]
  45. Wund, M.A. Variation in the echolocation calls of little brown bats (Myotis lucifugus) in response to different habitats. Am. Midl. Nat. 2006, 156, 99–108. [Google Scholar] [CrossRef]
  46. Bellamy, C.; Scott, C.; Altringham, J. Multiscale, presence-only habitat suitability models: Fine-resolution maps for eight bat species. J. Appl. Ecol. 2013, 50, 892–901. [Google Scholar] [CrossRef]
  47. Wordley, C.F.; Sankaran, M.; Mudappa, D.; Altringham, J.D. Landscape scale habitat suitability modelling of bats in the Western Ghats of India: Bats like something in their tea. Biol. Conserv. 2015, 191, 529–536. [Google Scholar] [CrossRef]
  48. Sneddon, L.; Zaremba, R.; Largay, E.; Podniesinski, G.; Perles, S.; Thompson, J. Vegetation Classification and Mapping of Morristown National Historical Park: New Jersey; Technical Report NPS/NER/NRTR—2008/116; National Park Service: Philadelphia, PA, USA, 2008.
  49. Wagner, R.; Cole, C.A.; Gorenflo, L.; Orland, B.; Tamminga, K. Morristown National Historical Park Natural Resource Condition Assessment: New Jersey; Natural Resource Report NPS/NETN/NRR—2014/869; National Park Service: Philadelphia, PA, USA, 2014.
  50. Gilbert, A.T.; O’Connell, A.F.; Annand, E.M.; Talancy, N.W.; Sauer, J.R.; Nichols, J.D. An Inventory of Terrestrial Mammals at National Parks in the Northeast Temperate Network and Sagamore Hill National Historic Site; 2007-5245; U.S. Geological Survey: Reston, VA, USA, 2008. Available online: https://irma.nps.gov/DataStore/Reference/Profile/660794 (accessed on 27 January 2023).
  51. Rogers, D.S.; Belk, M.C.; González, M.W.; Coleman, B.L. Patterns of habitat use by bats along a riparian corridor in northern Utah. Southwest. Nat. 2006, 51, 52–58. [Google Scholar] [CrossRef]
  52. Ketzler, L.P.; Comer, C.E.; Twedt, D.J. Nocturnal insect availability in bottomland hardwood forests managed for wildlife in the Mississippi Alluvial Valley. For. Ecol. Manag. 2017, 391, 127–134. [Google Scholar] [CrossRef]
  53. Szewczak, J.; Szewczak, N. SonoBat. 2017. Available online: https://sonobat.com/ (accessed on 29 November 2023).
  54. Szewczak, J.M.; Corcoran, A.; Kennedy, J.-P.; Weller, T.J.; Ormsbee, P.C. Echolocation Call Characteristics of Eastern US Bats—SonoBat v.4x; Humboldt State University Bat Lab: Arcata, CA, USA, 2017. [Google Scholar]
  55. Szewczak, J.M.; Harris, L.S. A Field Test of Two Acoustic Classification Systems to Discriminate Indiana Bats; Northeast Bat Working Group: Albany, NY, USA, 2013. [Google Scholar]
  56. Dodd, L.E.; Lacki, M.J.; Britzke, E.R.; Buehler, D.A.; Keyser, P.D.; Larkin, J.L.; Rodewald, A.D.; Wigley, T.B.; Wood, P.B.; Rieske, L.K. Forest structure affects trophic linkages: How silvicultural disturbance impacts bats and their insect prey. For. Ecol. Manag. 2012, 267, 262–270. [Google Scholar] [CrossRef]
  57. Froidevaux, J.S.; Fialas, P.C.; Jones, G. Catching insects while recording bats: Impacts of light trapping on acoustic sampling. Remote Sens. Ecol. Conserv. 2018, 4, 240–247. [Google Scholar] [CrossRef]
  58. Oksanen, J.; Simpson, G.L.; Blanchet, F.G.; Kindt, R.; Legendre, P.; Minchin, P.R.; O’Hara, R.B.; Solymos, P.; Stevens, M.H.H.; Szoecs, E.; et al. _vegan: Community Ecology Package_, R Package Version 2.6-4. 2022. Available online: https://www.researchgate.net/publication/360782912_vegan_community_ecology_package_version_26-2_April_2022 (accessed on 14 December 2023).
  59. Maslo, B.; Mau, R.L.; Kerwin, K.; McDonough, R.; McHale, E.; Foster, J.T. Bats provide a critical ecosystem service by consuming a large diversity of agricultural pest insects. Agric. Ecosyst. Environ. 2022, 324, 107722. [Google Scholar] [CrossRef]
  60. R Core Team. R: A Language and Environment for Statistical Computing; R Core Team: Vienna, Austria, 2022. [Google Scholar]
  61. Wickham, H.; François, R.; Henry, L.; Müller, K.; Vaughan, D. _dplyr: A Grammar of Data Manipulation_, R Package Version 1.1.0. 2023. Available online: https://www.researchgate.net/publication/275646200_dplyr_A_Grammar_of_Data_Manipulation (accessed on 14 December 2023).
  62. Wickham, H. ggplot2: Elegant Graphics for Data Analysis; Springer: New York, NY, USA, 2016. [Google Scholar]
  63. Canty, A.; Ripley, B. Boot: Bootstrap R (S-Plus) Functions, R Package Version 1.3-18; Computer Software. 2016. Available online: https://www.researchgate.net/publication/311467889_boot_Bootstrap_R_S-Plus_Functions (accessed on 27 November 2023).
  64. Bates, D.; Mächler, M.; Bolker, B.; Walker, S. Fitting linear mixed-effects models using lme4. arXiv 2014, arXiv:1406.5823. [Google Scholar]
  65. Wang, C.; Abbar, S.; Pan, X.; Ranabhat, S.; Cooper, R. Diversity and prevalence of nuisance arthropods detected by sticky traps in apartments in New Jersey. J. Econ. Entomol. 2023, 116, 1317–1320. [Google Scholar] [CrossRef]
  66. Venables, W.N.; Ripley, B.D. Modern Applied Statistics with S-PLUS; Springer Science & Business Media: Berlin/Heidelberg, Germany, 2013. [Google Scholar]
  67. Barton, K. _MuMIn: Multi-Model Inference_, R Package Version 1.47.1. 2022. Available online: https://www.researchgate.net/publication/305346822_MuMIn_Multi-model_inference (accessed on 27 November 2023).
  68. Burnham, K.; Anderson, D. Model Selection and Multimodel Inference: A Practical Information-Theoretic Approach, 2nd ed.; Springer: New York, NY, USA, 2002. [Google Scholar]
  69. Olckers, T.; Hulley, P. Impoverished insect herbivore faunas on the exotic bugweed Solanum mauritianum Scop. relative to indigenous Solanum species in Natal/KwaZulu and the Transkei. J. Entomol. Soc. S. Afr. 1991, 54, 39–50. [Google Scholar]
  70. Samways, M.J.; Caldwell, P.; Osborn, R. Ground-living invertebrate assemblages in native, planted and invasive vegetation in South Africa. Agric. Ecosyst. Environ. 1996, 59, 19–32. [Google Scholar] [CrossRef]
  71. Sunny, A.; Diwakar, S.; Sharma, G.P. Native insects and invasive plants encounters. Arthropod-Plant Interact. 2015, 9, 323–331. [Google Scholar] [CrossRef]
  72. Bernays, E.; Graham, M. On the evolution of host specificity in phytophagous arthropods. Ecology 1988, 69, 886–892. [Google Scholar] [CrossRef]
  73. Tallamy, D.W. Do alien plants reduce insect biomass? Conserv. Biol. 2004, 18, 1689–1692. [Google Scholar] [CrossRef]
  74. Fielding, D.J.; Conn, J.S. Feeding preference for and impact on an invasive weed (Crepis tectorum) by a native, generalist insect herbivore, Melanoplus borealis (Orthoptera: Acrididae). Ann. Entomol. Soc. Am. 2011, 104, 1303–1308. [Google Scholar] [CrossRef]
  75. Parker, J.D.; Hay, M.E. Biotic resistance to plant invasions? Native herbivores prefer non-native plants. Ecol. Lett. 2005, 8, 959–967. [Google Scholar] [CrossRef]
  76. Harvey, J.A.; Biere, A.; Fortuna, T.; Vet, L.E.; Engelkes, T.; Morriën, E.; Gols, R.; Verhoeven, K.; Vogel, H.; Macel, M. Ecological fits, mis-fits and lotteries involving insect herbivores on the invasive plant, Bunias orientalis. Biol. Invasions 2010, 12, 3045–3059. [Google Scholar] [CrossRef]
  77. Clare, E.L.; Fraser, E.E.; Braid, H.E.; Fenton, M.B.; Hebert, P.D. Species on the menu of a generalist predator, the eastern red bat (Lasiurus borealis): Using a molecular approach to detect arthropod prey. Mol. Ecol. 2009, 18, 2532–2542. [Google Scholar] [CrossRef] [PubMed]
  78. Maslo, B.; Valentin, R.; Leu, K.; Kerwin, K.; Hamilton, G.C.; Bevan, A.; Fefferman, N.H.; Fonseca, D.M. Chirosurveillance: The use of native bats to detect invasive agricultural pests. PLoS ONE 2017, 12, e0173321. [Google Scholar] [CrossRef]
  79. Münzer, O.M.; Schaetz, B.; Kurta, A. Consumption of insect pests by the evening bat (Nycticeius humeralis) in southeastern Michigan. Mich. Entomol. Soc. 2016, 49, 36. [Google Scholar]
  80. Brockerhoff, E.; Liebhold, A. Ecology of forest insect invasions. Biol. Invasions 2017, 19, 3141–3159. [Google Scholar] [CrossRef]
  81. Murman, K.; Setliff, G.P.; Pugh, C.V.; Toolan, M.J.; Canlas, I.; Cannon, S.; Abreu, L.; Fetchen, M.; Zhang, L.; Warden, M.L. Distribution, survival, and development of spotted lanternfly on host plants found in North America. Environ. Entomol. 2020, 49, 1270–1281. [Google Scholar] [CrossRef] [PubMed]
  82. Verboom, B. The Use of Edge Habitats by Commuting and Foraging Bats; Wageningen University and Research: Wageningen, The Netherlands, 1998. [Google Scholar]
  83. NJ Department of Health. What You Should Know About Bats...; NJ Department of Health: Trenton, NJ, USA, 2014.
  84. Maslo, B.; Valent, M.; Gumbs, J.F.; Frick, W.F. Conservation implications of ameliorating survival of little brown bats with white-nose syndrome. Ecol. Appl. 2015, 25, 1832–1840. [Google Scholar] [CrossRef] [PubMed]
  85. O’Keefe, J.M.; Pettit, J.L.; Loeb, S.C.; Stiver, W.H. White-nose syndrome dramatically altered the summer bat assemblage in a temperate Southern Appalachian forest. Mamm. Biol. 2019, 98, 146–153. [Google Scholar] [CrossRef]
  86. Lintott, P.R.; Bunnefeld, N.; Park, K.J. Opportunities for improving the foraging potential of urban waterways for bats. Biol. Conserv. 2015, 191, 224–233. [Google Scholar] [CrossRef]
  87. Smith, D.A.; Gehrt, S.D. Bat response to woodland restoration within urban forest fragments. Restor. Ecol. 2010, 18, 914–923. [Google Scholar] [CrossRef]
  88. DiTommaso, A.; Morris, S.H.; Parker, J.D.; Cone, C.L.; Agrawal, A.A. Deer browsing delays succession by altering aboveground vegetation and belowground seed banks. PLoS ONE 2014, 9, e91155. [Google Scholar] [CrossRef]
  89. Stinson, K.A.; Campbell, S.A.; Powell, J.R.; Wolfe, B.E.; Callaway, R.M.; Thelen, G.C.; Hallett, S.G.; Prati, D.; Klironomos, J.N. Invasive plant suppresses the growth of native tree seedlings by disrupting belowground mutualisms. PLoS Biol. 2006, 4, e140. [Google Scholar] [CrossRef]
  90. Frick, W.F.; Baerwald, E.F.; Pollock, J.F.; Barclay, R.M.; Szymanski, J.; Weller, T.; Russell, A.; Loeb, S.; Medellin, R.; McGuire, L. Fatalities at wind turbines may threaten population viability of a migratory bat. Biol. Conserv. 2017, 209, 172–177. [Google Scholar] [CrossRef]
  91. Hoyt, J.R.; Kilpatrick, A.M.; Langwig, K.E. Ecology and impacts of white-nose syndrome on bats. Nat. Rev. Microbiol. 2021, 19, 196–210. [Google Scholar] [CrossRef]
Figure 1. We conducted acoustic monitoring, conventional insect trapping, and vegetation surveys in 23 survey plots (30 m in diameter) in the Morristown National Historical Park–Jockey Hollow Unit, NJ, USA, in summer 2020. Brown markers indicate forested sites, pink markers indicate open sites, and blue markers indicate stream/corridor sites.
Forests 15 00711 g001
Figure 2. The percentage of a plot (average of the ground and midstory layers occupied by non-native vegetation) was significantly and positively correlated with the (a) number of midstory trees and shrubs (β = 0.01 ± 0.006 SE) in the entire plot and (b) percentage of the ground covered by vegetation (β = 0.36 ± 0.14 SE) in four quadrats within the plot in northern New Jersey, USA, in summer 2020 (number of plots = 23). Points depict the original data, solid lines depict the fitted model, and shaded areas depict 95% confidence intervals.
Forests 15 00711 g002
Figure 3. The percentage of a plot (average of the ground and midstory layers) occupied by non-native vegetation had a significant positive effect on the number of (a) total bat passes; (b) terminal buzzes; and (c) total low-frequency passes recorded in northern New Jersey, USA, in summer 2020, as revealed by model-averaging the effect sizes of predictors from top-ranked generalized linear models (<2 ∆AICc scores from the top model). No measured predictor had a significant effect on (d) total high-frequency passes. Lines depict 95% confidence intervals. Black points and black lines indicate significant effects (the model-averaged effect size did not cross 0). Gray points and gray lines indicate effects that were not significant (the model-averaged effect size crossed 0).
Forests 15 00711 g003
Table 1. Candidate model set to test competing hypotheses about predictors of bat activity in northern New Jersey.
Predictors
Bat Activity Depends On:Canopy CoverMidstory Trees
and Shrubs
Ground CoverPercent Non-NativePrey Abundance
All predictors (global model)XXXXX
Habitat structure and compositionXXXX
Habitat structureXXX
Flight clearance (impacted by non-native plants) and predator avoidanceXX X
Flight clearance, prey availability, and predator avoidanceXX X
Flight clearance and predator avoidanceXX
Midstory structure X X
Ground structure XX
Prey availability (impacted by non-native plants) XX
Canopy structureX
Flight clearance (dictated by midstory clutter) X
Ground cover X
Non-native percentage X
Prey availability X
No predictors (null model)
Disclaimer/Publisher’s Note: The statements, opinions and data contained in all publications are solely those of the individual author(s) and contributor(s) and not of MDPI and/or the editor(s). MDPI and/or the editor(s) disclaim responsibility for any injury to people or property resulting from any ideas, methods, instructions or products referred to in the content.

