Article

Climate Change Responses of High-Elevation Polylepis Forests

by
Larry E. Bedoya-Canas
1,2,†,
Felipe López-Hernández
3,† and
Andrés J. Cortés
2,3,4,*
1
Reforestadora Integral de Antioquia, Medellín 050012, Colombia
2
Facultad de Ciencias Agrarias—Departamento de Ciencias Forestales, Universidad Nacional de Colombia—Sede Medellín, Medellín 050034, Colombia
3
Corporación Colombiana de Investigación Agropecuaria (AGROSAVIA)—C.I. La Selva, Rionegro 054048, Colombia
4
Department of Plant Breeding, Swedish University of Agricultural Sciences, 23053 Alnarp, Sweden
*
Author to whom correspondence should be addressed.
These two authors contributed equally to this work and share first authorship.
Forests 2024, 15(5), 811; https://doi.org/10.3390/f15050811
Submission received: 11 March 2024 / Revised: 24 April 2024 / Accepted: 28 April 2024 / Published: 4 May 2024

Abstract

:
The high mountain forests on Earth are characterized by sharp environmental heterogeneity, high species endemism, and unique phenotypic adaptations. Yet, global warming is jeopardizing this ecosystem as no other as some forests may have nowhere to go beyond the mountain’s summits. One of the most human-endangered high-elevation ecosystems is the Polylepis forest. Despite its vulnerability, forecasting climate reactions in this distinctive high mountain forest type remains a formidable challenge. Therefore, in this study, we modeled climate change responses of high-elevation allopatric Polylepis sericea and P. quadrijuga (Rosaceae) in the northern Andes. The analysis took into account VIF-prioritized bioclimatic variables for near-to-present and future (2081–2100 MPI-ESM1-2-HR) conditions. Model selection was carried out following the AUC scores of 12 MaxEnt and six machine learning algorithms. Predictive power reached 0.97 for MaxEnt’s model fc.H_rm.1 (H-1). Results indicate a moderate vulnerability of P. sericea, with a 29% loss of area in the trailing edge, due to climate change for the period 2081–2100. On the other hand, P. quadrijuga is likely to experience even larger distribution losses, up to 99%, for the same period. The findings of this study suggest that P. quadrijuga, as compared to P. sericea, exhibits a restricted ability to maintain the corresponding habitat requirements in the face of climatic change. Higher niche specialization of P. quadrijuga in the environmentally heterogeneous Eastern Cordillera contrasts with the more generalist nature of P. sericea in the topographically less complex Central Cordillera. In addition to climate change, this trend may be exacerbated by the detrimental effects of agriculture, mining, and an expanding rural population, which represent significant human-driven pressures yet to be modeled in the northern Andean highlands. Yet, based on previous studies, the historical population dynamics during the past glacial cycles suggests that range shifts could play a more significant role at deeper time scales than previously forecasted in the species’ reaction to climate change. Additionally, Polylepis forests may be able to endure at the current locations via local adaptation and plasticity, major drivers of the phenotypic variation in long-lived trees, counteracting the vulnerability scenario under a niche conservatism hypothesis. Ultimately, the modeling procedure employed in this study provides insights into the potential effects of climate change on Polylepis forests 70 years from now. Oncoming studies may consider alternative responses inherent to the gene pool of the species and the interaction with edaphic and biotic agents. We advocate for the application of comparable estimations in other high-elevation tree communities found at the tree line.

1. Introduction

One of the most pressing inquiries in recent biological conservation studies is to assess the impact of climate change on tree communities [1] and their subsequent cascade response on multiple ecosystem services [2]. The majority of research concerning reactions in alpine ecosystems to shifting climatic patterns presupposes that populations would migrate to higher elevations in order to match their ideal habitat conditions [3,4]. In certain instances, there may also be migration to lower elevations as a result of competitive release [5]. When range shifts capacity is limited due to biological, dispersal, or geographical constraints [6], adaptation could facilitate the persistence of populations in the face of new environmental conditions. The significance of plasticity and local standing adaptation in long-lived tree species is likely due to the fitness advantage of genotypes that exhibit multiple, even antagonistic, phenotypic responses during their lifespan [7,8]. Anyhow, it is possible that species may lack sufficient intrinsic adaptive potential, especially in secluded and endemic populations, as to effectively respond to the rapid rate of climatic change [9]. Consequently, forecasting climate change’s impact in tree species requires examining future gaps in the distribution of the species [10].
High-elevation (as per [11]) forests at the tree line and the sub-Páramo grasslands [12,13] in the American tropics (i.e., Neotropics) are vulnerable to climate change [14,15,16] given its restricted area [17]. This ecosystem, situated at elevations ranging from around 3000 to 4000 m, is characterized by a waving tree line that mingles grasslands with embedded forest patches. Notably, a significant proportion of these species are endemic [18,19]. Such endemics have emerged over the past five million years, since the Andean uplift, as distinctive adaptations to the challenging conditions found in the region [20], which include low temperature [21], frost damage [22,23], osmotic stress (e.g., drought and flooding), depleted carbon dioxide levels, impoverished soil layers, and extreme UV radiation [24]. Exceptional specialization among plant groups in these high-elevation habitats, known as “sky islands” [25], has been attributed [26,27] to the Pleistocene glacial cycling that occurred over the past 2.4 million years [28]. Glacial cycles resulted in what is known as the “species pump hypothesis” [29], recurrent periods of both spatial isolation (i.e., allopatry) and connectivity (i.e., sympatry) among high-elevation populations that reiteratively enhanced allopatric divergence and reinforced the reproductive barriers that originally arose from ecological divergence across habitats [30]. Varying population distributions in concert with historical glacial cycles suggests limited in situ persistence and significantly constrained habitat preferences, favoring range changes through migration [31,32,33]. Yet, there is still a need to further investigate if the high-elevation Neotropical forests can effectively persist or migrate upwards at the fast pace of climate change [34].
Tree diversity in high-mountain Andean forests is limited to around 11 families, the Rosaceae and Asteraceae being dominant [35], and the Polylepis forest (Rosaceae) one of the few arboreal communities above the tree line [36]. This makes the genus Polylepis the most dominant and iconic in the high-elevation Neotropical forests. It consists of approximately 28 to 33 species, which have not yet been defined accurately [37]. They comprise of small trees and shrubs, distributed along the Andean mountains, from northern Venezuela to the north of Chile and northeast Argentina. In Colombia, there are three allopatric species: P. sericea Wedd., P. quadrijuga Bitter, and P. incana Kunth. Polylepis sericea is the species with the largest distribution range in the northern Andes, exhibiting notorious morphological heterogeneity. This species can be found in the southern part of Colombia, on the borders with Ecuador, as well as in the northern part of the Central and Western Cordilleras, at elevations that are above 2800 m, reaching up to 4000 m above sea level. On the other hand, P. quadrijuga is a species endemic to Colombia [37] and is found mainly in the Eastern Cordillera, with smaller populations in the Central and Western Cordilleras. Discouragingly, previous research targeting the latter species predicted a significant loss of suitable habitat due to climate change [38]. Finally, P. incana is rarely mentioned in Colombia, as it is represented by small populations in the southern Colombian Andes [39], and therefore will not be discussed further as part of this study.
Two main drivers may explain the persistence of Polylepis forests in environments with extreme conditions [40]. First, isolated populations could be preferably associated with creeks that allow the entry of hot air, acting as a damper to low temperatures. Alternatively, anthropic pressures may have exerted a strong pressure on the species, generating the current distribution in secluded areas. Regardless of the ultimate cause of the species distribution, a common denominator is that the Polylepis forests tend to be in environments that exhibit a high degree of heterogeneity [40]. For instance, some populations are adapted to damp depressions in high valleys, dry exposed slopes, and even outside forested areas near the Páramo grassland [37]. As a result, these populations are exposed to a diverse array of micro-climatic variables across different elevations and regions [41]. The presence of diverse local habitats [42] could potentially offer favorable sites for species to migrate in close proximity to their existing patches [43]. In parallel, ecological specialization evolved to a narrow range of environmental variables and may, in turn, limit populations’ responses to novel challenges. Thus, the impacts of microhabitat variability on the species’ reactions to climate change are not straightforward, mostly in long-lived high-elevation trees with restricted areas for seed establishment.
Unveiling possible outcomes for the species would then contribute to a better understanding of the climate effects in the endangered high mountain forests. As part of this task, it is paramount to assess the vulnerability of Polylepis spp. by contrasting their present and future distributions. Based on this, the goal of this study was to quantify the responses to climate change of P. sericea and P. quadrijuga by comparing their current distribution with the projected coverage in the decades 2081–2100, assuming niche conservatism and range shifts. This work will help in forecasting the long-term reactions to environmental change of high-elevation forests in the Neotropics, precisely where the largest impacts of climate pressures have been theorized [44,45].

2. Materials and Methods

2.1. Study Area and Data Compilation

Two different platforms were used to comparatively compile data for P. sericea and P. quadrijuga species: (1) Global Biodiversity Information Facility or GBIF, an international organization and, in turn, a data network with the aim of providing free information on any type of existing biological data (https://www.gbif.org/ accessed on 1 May 2024), and (2) BIEN or Botanical Information and Ecology Network (https://bien.nceas.ucsb.edu/bien/ accessed on 1 May 2024). The latter is a computer-based technology that seeks to understand the impact of climate change on plant diversity, through a collaborative network that has been shaped by disaggregated teams of botanical researchers [46]. GBIF initially provided 837 observations, of which 527 belonged to P. sericea and 310 to P. quadrijuga. A total of 176 observations were obtained from the BIEN database, out of which 134 were for P. sericea and the remaining 42 for P. quadrijuga. A data management process was carried out, in which duplicate or identical data were initially removed from both acquired databases, followed up by the exclusion of data without georeferencing. Finally, a filter was created for P. sericea to only retain observations made in Colombia. This step was not carried out for P. quadrijuga because it has only been recorded in Colombia, leaving unique observations for the Eastern Cordillera in the Colombian Andes (Figure 1). The final number of records per species was 33 for P. sericea and 72 for P. quadrijuga (Table S1), after respectively depurating nine and ten multiple occurrences within the same 1 km2 pixels (the original distance classes before this sieving step ranged from 0.0002 to 704.1 km for P. sericea, and from 0.0013 to 462.9 km for P. quadrijuga). The above sampling intensity mitigated potential biases arising from distributions characterized by a limited number of input points [47], particularly for taxa that are presumed to be uncommon [48] (like P. incana), that is, those species that possess less than 10 original records [49]. In addition, modeling algorithms such as MaxEnt advise utilizing a minimum of 30 occurrence points for forecasting robust species distribution models [50].
Meanwhile, near-to-present bioclimatic data were obtained from the WorldClim repository [51], from a 30-year historical archive. The space resolution chosen was 30 s, which is approximately equivalent to pixels of 1 km2. A total of 19 bioclimatic variables were retrieved (enlisted here https://www.worldclim.org/data/bioclim.html accessed on 1 May 2024), all of which are exclusively estimated from precipitation and temperature. Additionally, mean precipitation (mm), and mean, maximum, and minimum temperature (°C) were retrieved from the same platform as boundary bioclimatic conditions. Subsequently, future values of bioclimatic variables were gathered with environmental projections for the period 2081–2100, also at a resolution of 30 s. We focused on the period 2081–2100 because we were interested in long-term effects, besides the fact that the long generation time of Polylepis spp. would obscure interpretations at shorter time frames. The obtained projected data belonged to the German-developed model MPI-ESM1-2-HR [52]. This scenario simulates climate change using historical data [53], and has been recommended for the northern Andes [54] because it exhibits reasonable forecasts of the seasonality in the region [55].

2.2. Prioritization of Bioclimatic Variables

The prioritization of environmental factors controls the complexity of models used for climate sensitivity evaluations [56]. Therefore, the minimization of collinearity [57], sample bias [58], and the improvement of variable selection [59] are desirable. Collinearity denotes a strong association between two or more predictor variables, which can lead to instability in the estimate of parameters [60]. A proxy to determine collinearity is the Variance Inflation Factor (VIF), which is the square of the multiple correlation coefficient resulting from regressing a predictor variable against all other predictor variables [61].
Thus, variable selection was conducted by retaining those with VIF < 10, as per the usdm package [62] in R v.3.3.1 (R Core Team). Pairwise Pearson correlation scores (r) across all variables were drawn using the same software. This way, an optimum set of climatic variables was selected to minimize collinearity. Additionally, the absolute correlation coefficients (r) among these variables were inspected. As a result, a subset of the original 19 variables was considered to be non-collinear and was included in subsequent modeling analyses for each species (P. sericea and P. quadrijuga). Ad hoc addition of other variables (e.g., Thornthwaite aridity index) was solely based on technical criteria.

2.3. Potential Niche Distribution Modeling

The climate sensitivity of P. sericea and P. quadrijuga was modelled independently by comparing the current and projected future datasets gathered in the previous step. This analysis was conducted under the assumption of niche conservatism, which implies that range shifts would occur via selection, extinction, and migration. The modeling effort was further enhanced by incorporating modern advancements in artificial intelligence, specifically through machine learning methods such as Maximum Entropy (MaxEnt) and other sophisticated algorithms. These tools allow for a deeper comparative understanding of species distribution changes, enabling the prediction of habitat suitability under varying climate scenarios with greater accuracy and detail.
Potential niche distribution modeling was first carried out by the Maximum Entropy algorithm [50,63,64] that employs maximum entropy and Bayesian inference techniques to estimate probability distributions of occurrences [63]. This approach was executed by the R-function MaxNet (https://github.com/mrmaxent/maxnet accessed on 1 May 2024) from the R-package ENMeval [65], and included the optimization of transformations (L = linear, Q = quadratic, H = hinge, P = product, and T = threshold) of the original predictor variables (“feature classes”). Each taxon was subjected to an average of 10,000 pseudo-absences in a 500 km buffer zone, following [65]. Fourfold cross-validation was used for each duplicated run, with a total of 500 iterations, according to previous standardizations [66], entailing a testing of 25%. Model validation used Area Under the Curve (AUC), an inclusive metric for evaluating relative performance across 12 models built with the same data [65]. We computed and evaluated AUC as a potential source of deception, an approach already demonstrated by other authors [67,68].
On the other hand, six supervised machine learning approaches were explored to model the potential niche distribution. They included Random Forest (RF) [69], Gradient Boosting Modeling (GBM) [70], Logistic Model (Log) [71], Naïve Bayes (NB) [72], Linear Discriminant Analysis (LDA) [73], and the K-Nearest Neighbors algorithm (KNN) [74,75]. All machine learning approaches were carried out using the R-package Caret [76]. Each machine learning algorithm was optimized in the main hyperparameters from 500 iterations using repeated cross-validation with a testing of 20%.
The best forecast among all MaxEnt and machine learning models was independently selected for P. sericea and P. quadrijuga following AUC scores. For each case, ten split-sample models were executed following previous calibrations [77]. The binary reclassification of presence, with a threshold of >90%, was performed, as advised [78], and the average value over several repeats was then recorded for each individual instance. The analytical technique was executed on the historical dataset spanning the years 1970 to 2000. However, in order to forecast alterations in the distribution of P. sericea and P. quadrijuga, we utilized the trained models to project onto existing locations where the species is now found, taking into account the prevailing climate conditions. These projections were carried out for the years 2081–2100, as retrieved from the previous section, using the predict function of the R-package raster [79]. The projection maps were retrieved and summarized using a personalized R-script with the ggplot R-package [80].
The maps were subsequently aggregated to recreate the likelihood of present and future existence of P. sericea and P. quadrijuga across the geographical space. Maps of each climate change scenario (current vs. future) were faced per species in order to assess the climate sensitivity of Polylepis forests. Alterations in the projected distribution areas of Polylepis spp. were suggestive of regions where the likelihood of presence was either reduced or enhanced as a result of climate change.

3. Results

3.1. Prioritization of Bioclimatic Variables

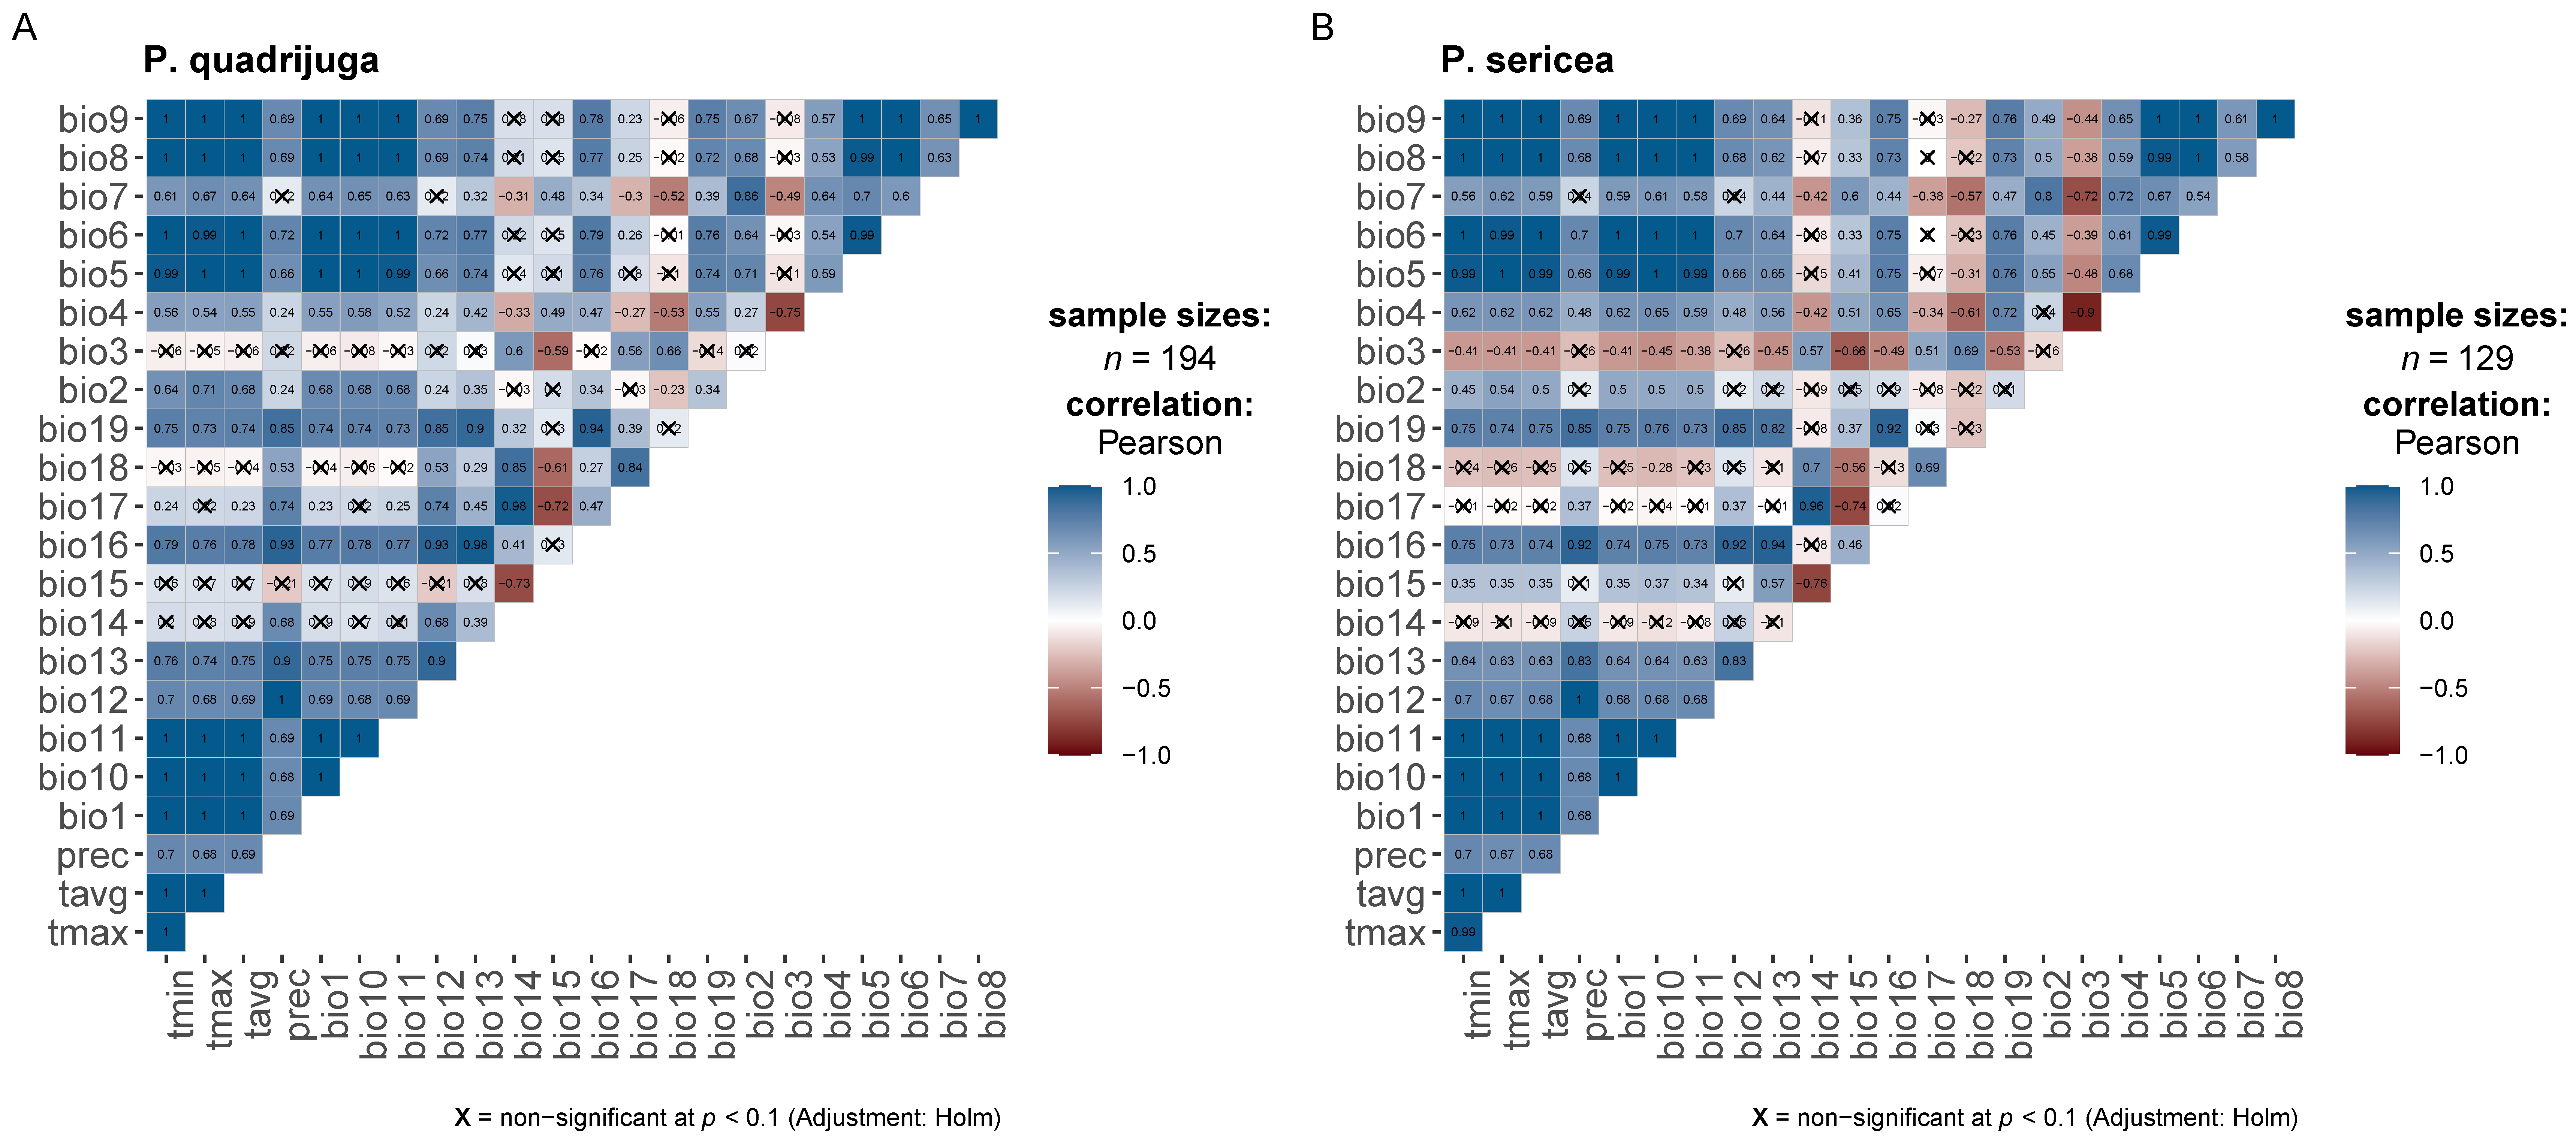
Only variables that presented a VIF score below 10 were retained to minimize multi-collinearity due to variables highly correlated with many others. The optimization left seven informative bioclimatic variables, non-correlated among them (Figure 2), for P. sericea: Bio3, Bio4, Bio8, Bio14, Bio15, Bio18, and Bio19 (as named in the original WorldClim platform), and eight for P. quadrijuga: Bio3, Bio4, Bio7, Bio8, Bio14, Bio15, Bio18, and Bio19, besides the boundary bioclimatic conditions [i.e., mean precipitation (mm), and mean, maximum and minimum temperature (°C)] (Figure S1).

3.2. Model Accuracy

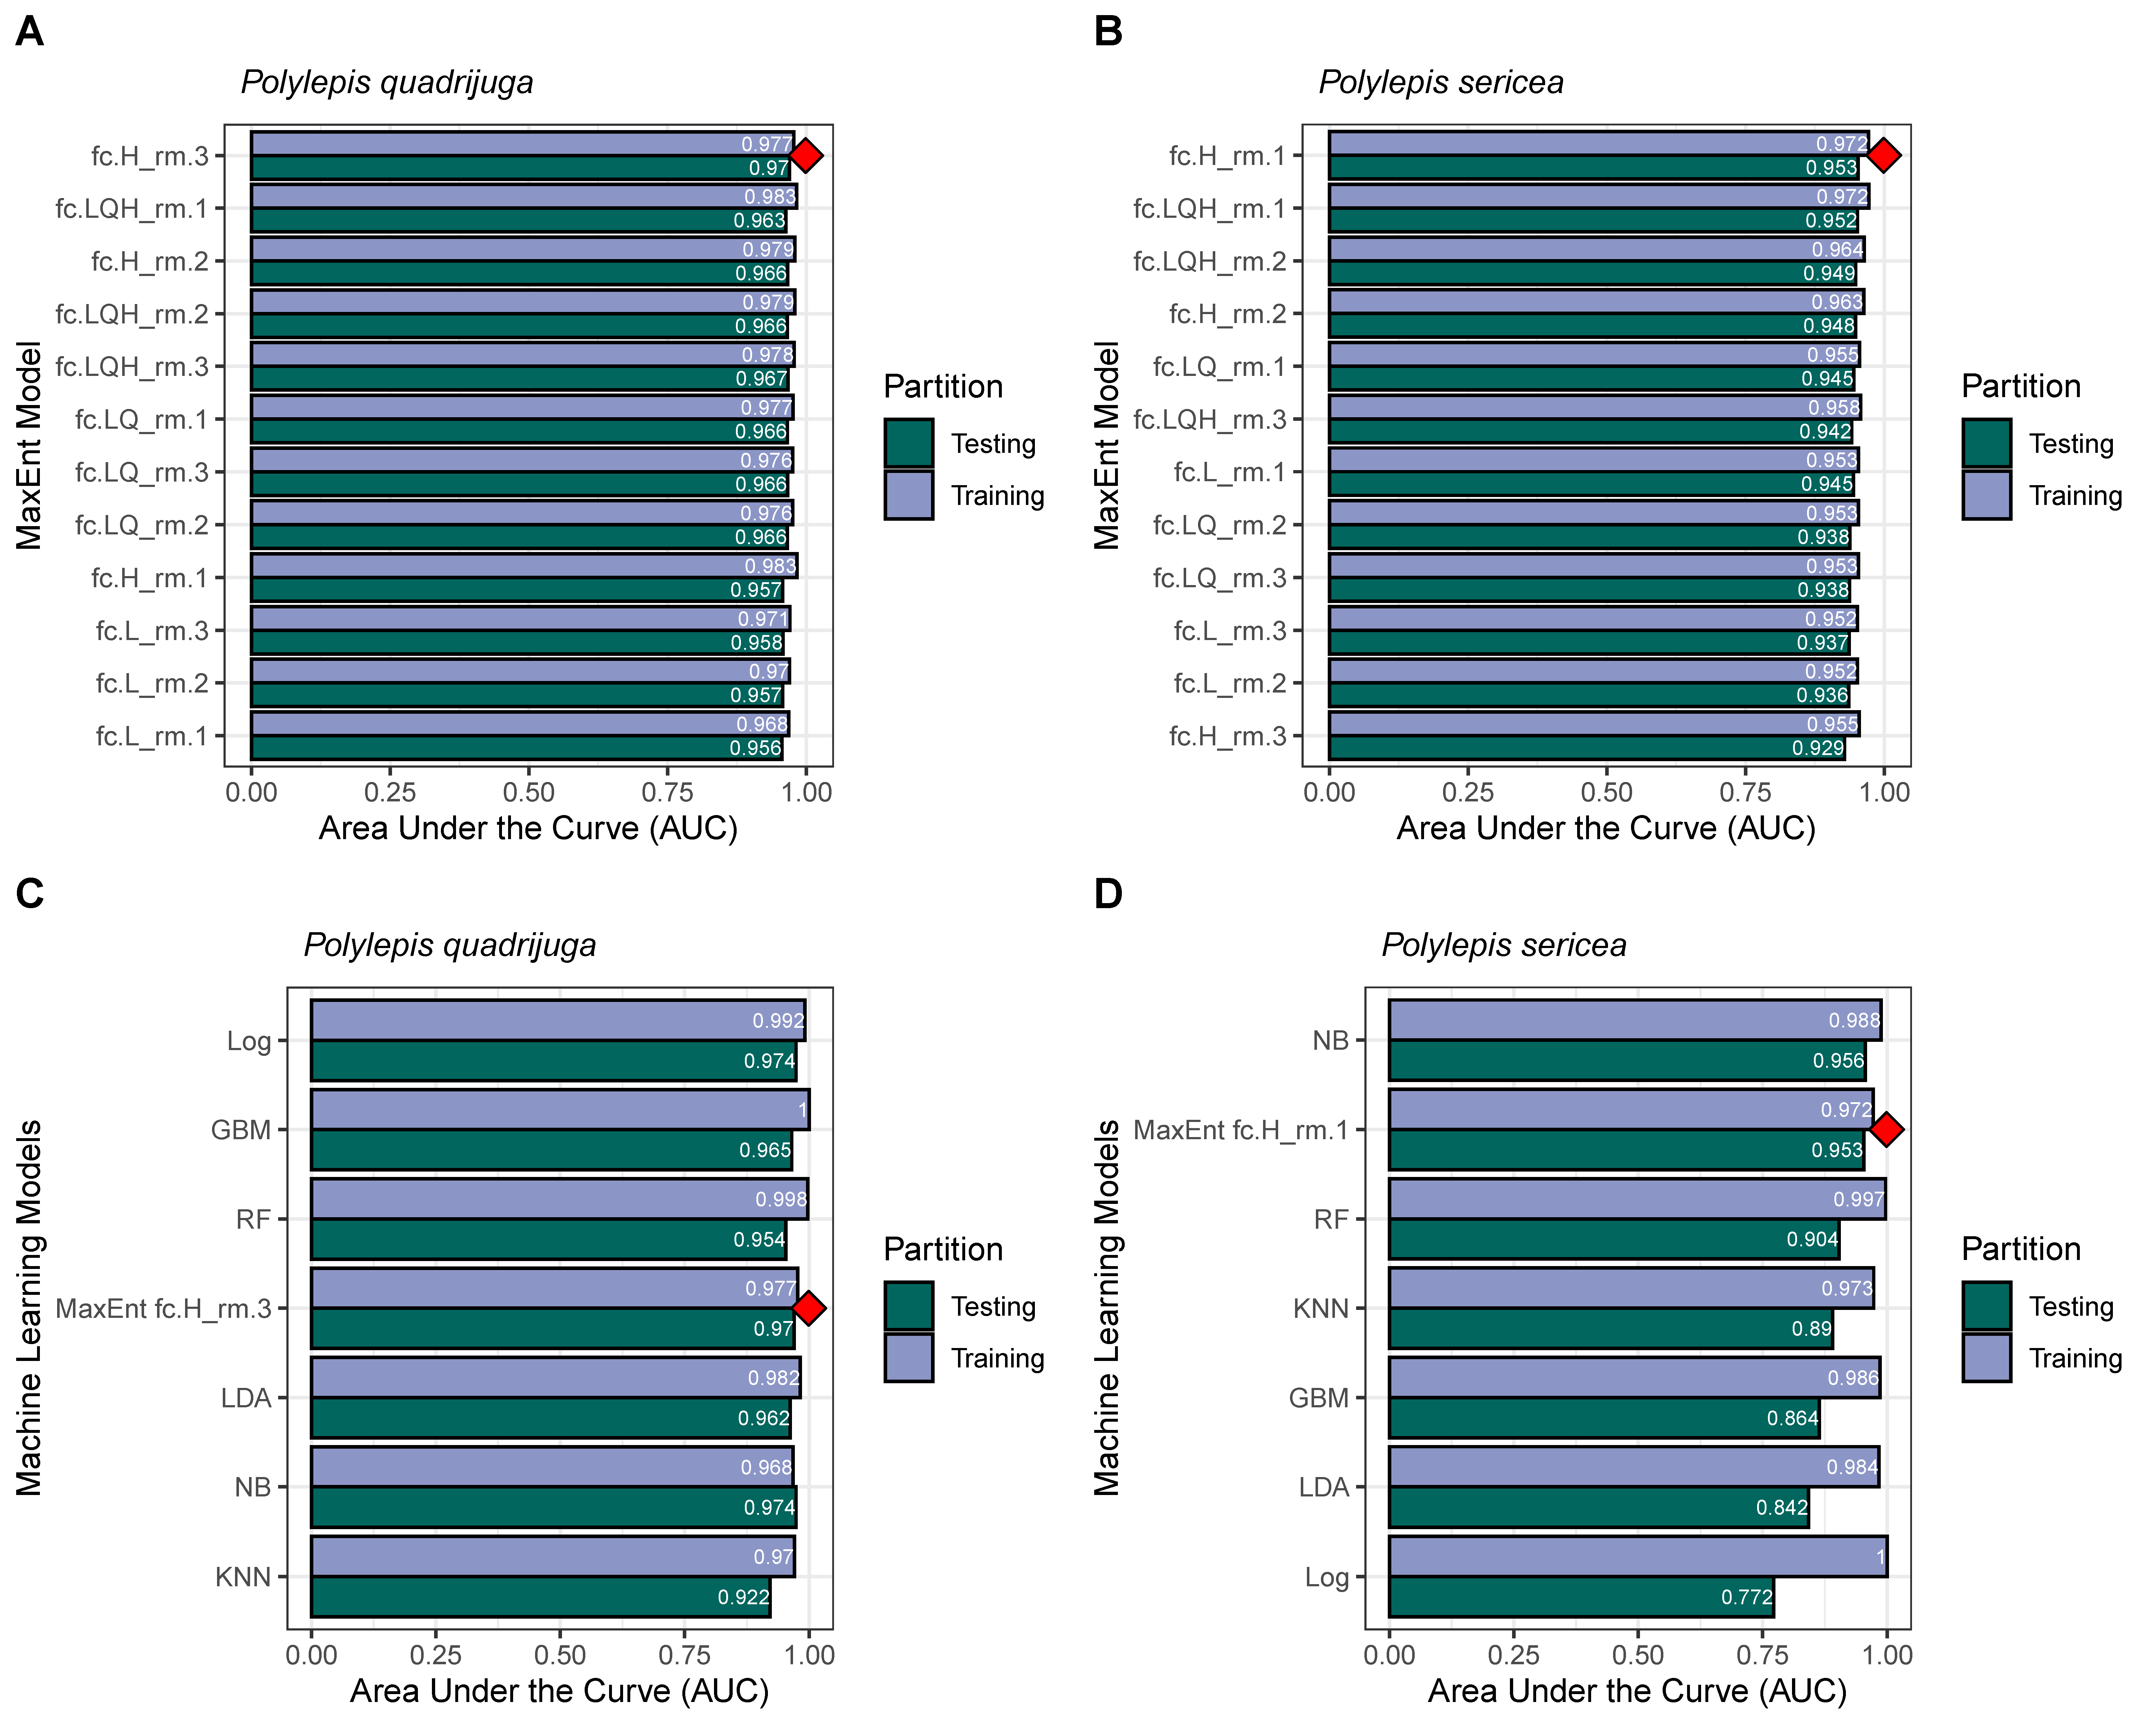
Traditional MaxEnt software conceded a satisfactory inspection of the 12 models’ accuracy, including prediction area and omission rate as per AUC scores (Figure 3A,B, Table S2), even when contrasted with machine learning models (Figure 3C,D). In each case, the blue bar shows the model match to the training data, and the green one indicates the model fit to the test dataset. For the case of P. quadrijuga, all MaxEnt models presented a fairly high predictive power (up to 0.97 for model fc.H_rm.3, abbreviated as H-3). For P. sericea, the tendency was slightly shifted but still showed good predictive power (up to 0.953 for model fc.H_rm.1, abbreviated as H-1). In both cases, the MaxEnt preferred alternative exceeded AUC scores in the machine learning testing, indicating an adequate signal in terms of information content. Thus, these modeling approaches were consistently implemented in the following downstream pipeline for P. sericea and P. quadrijuga.

3.3. Presence Probability

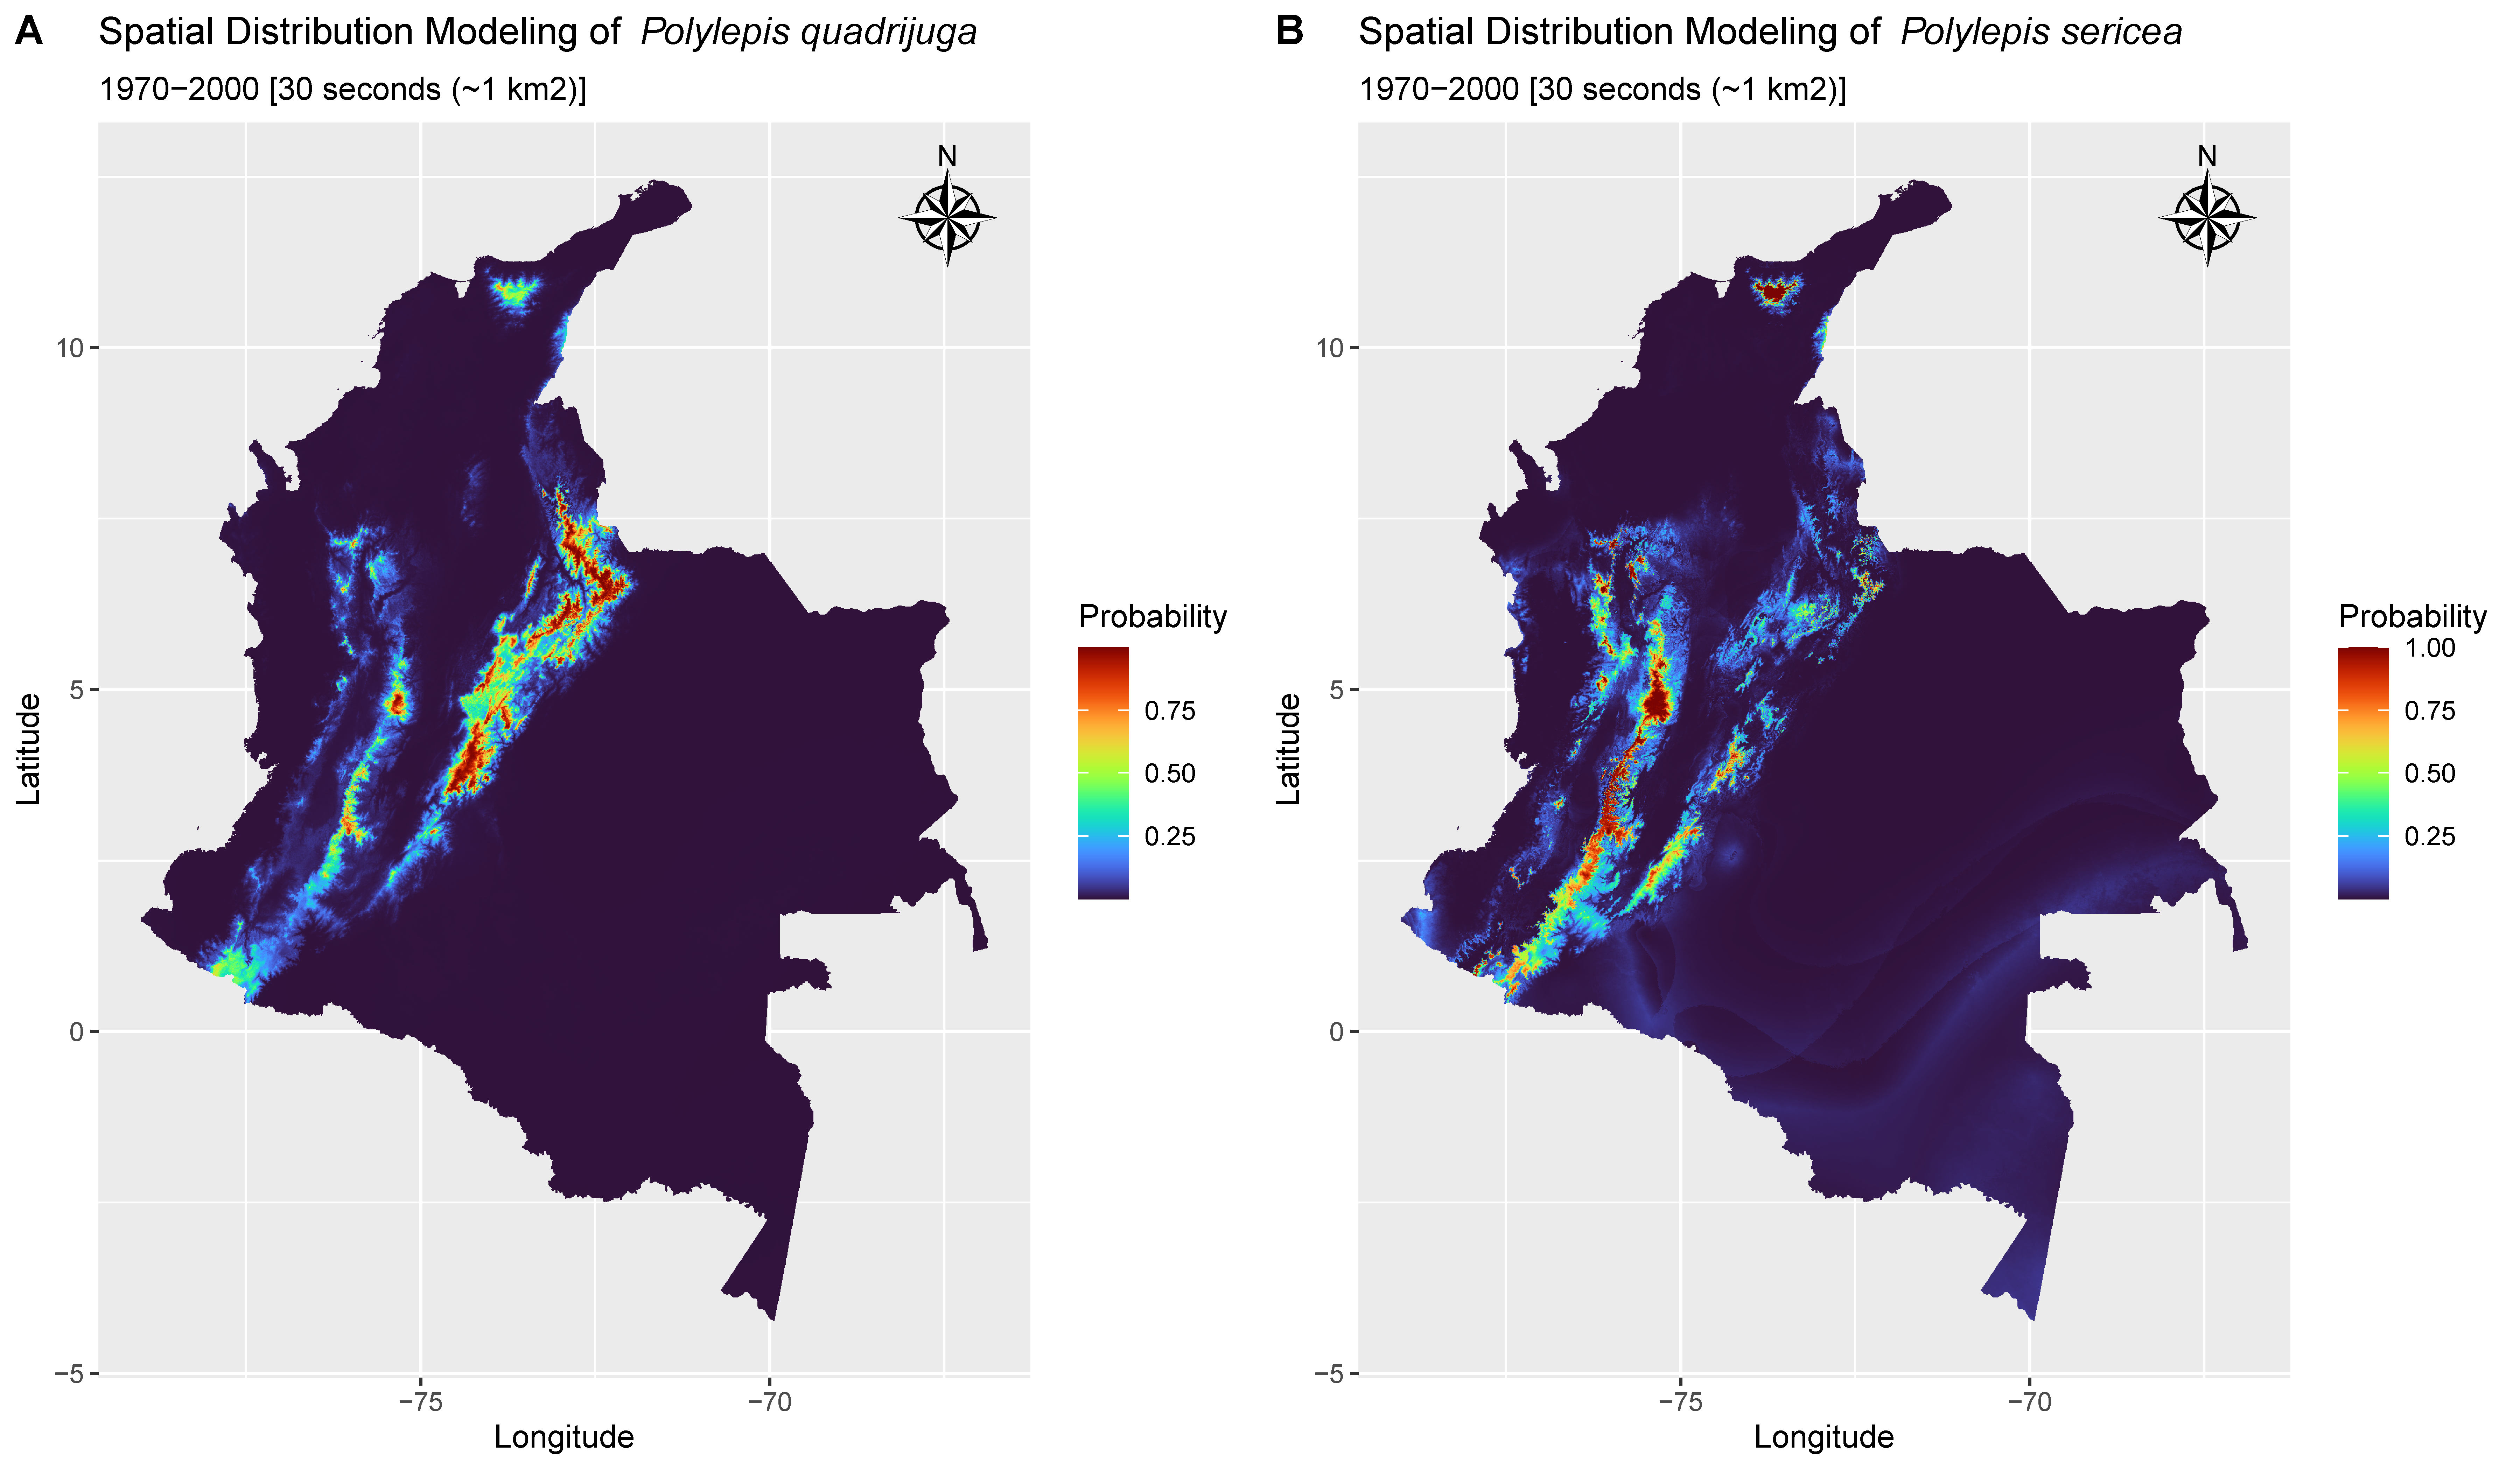
The estimated presence probabilities matched expected present-day areas (Figure 4).
Presence probability maps show that both P. sericea and P. quadrijuga, given the current bioclimatic data, exhibit high probability (>0.9) of suitable conditions for their establishment in the expected areas (Figure 4A,C). However, suitable areas dramatically change for the predictions of the 2081–2100 period. While for P. sericea the probable area reduced by 29% (current distribution totalizing 12,062 km2, Figure 4C vs. predicted future distribution of 8558 km2, Figure 4D), the absolute probability decreased radically for P. quadrijuga, so much that it was difficult to find probability scores greater than 0.1 in future projections (current distribution totalizing 5624 km2, Figure 4A, vanished in the future scenario, Figure 4B). Area loss for the latter was estimated to be 99%, as expected for species in the Andes due to a decrease in the optimal area for their establishment and growth.
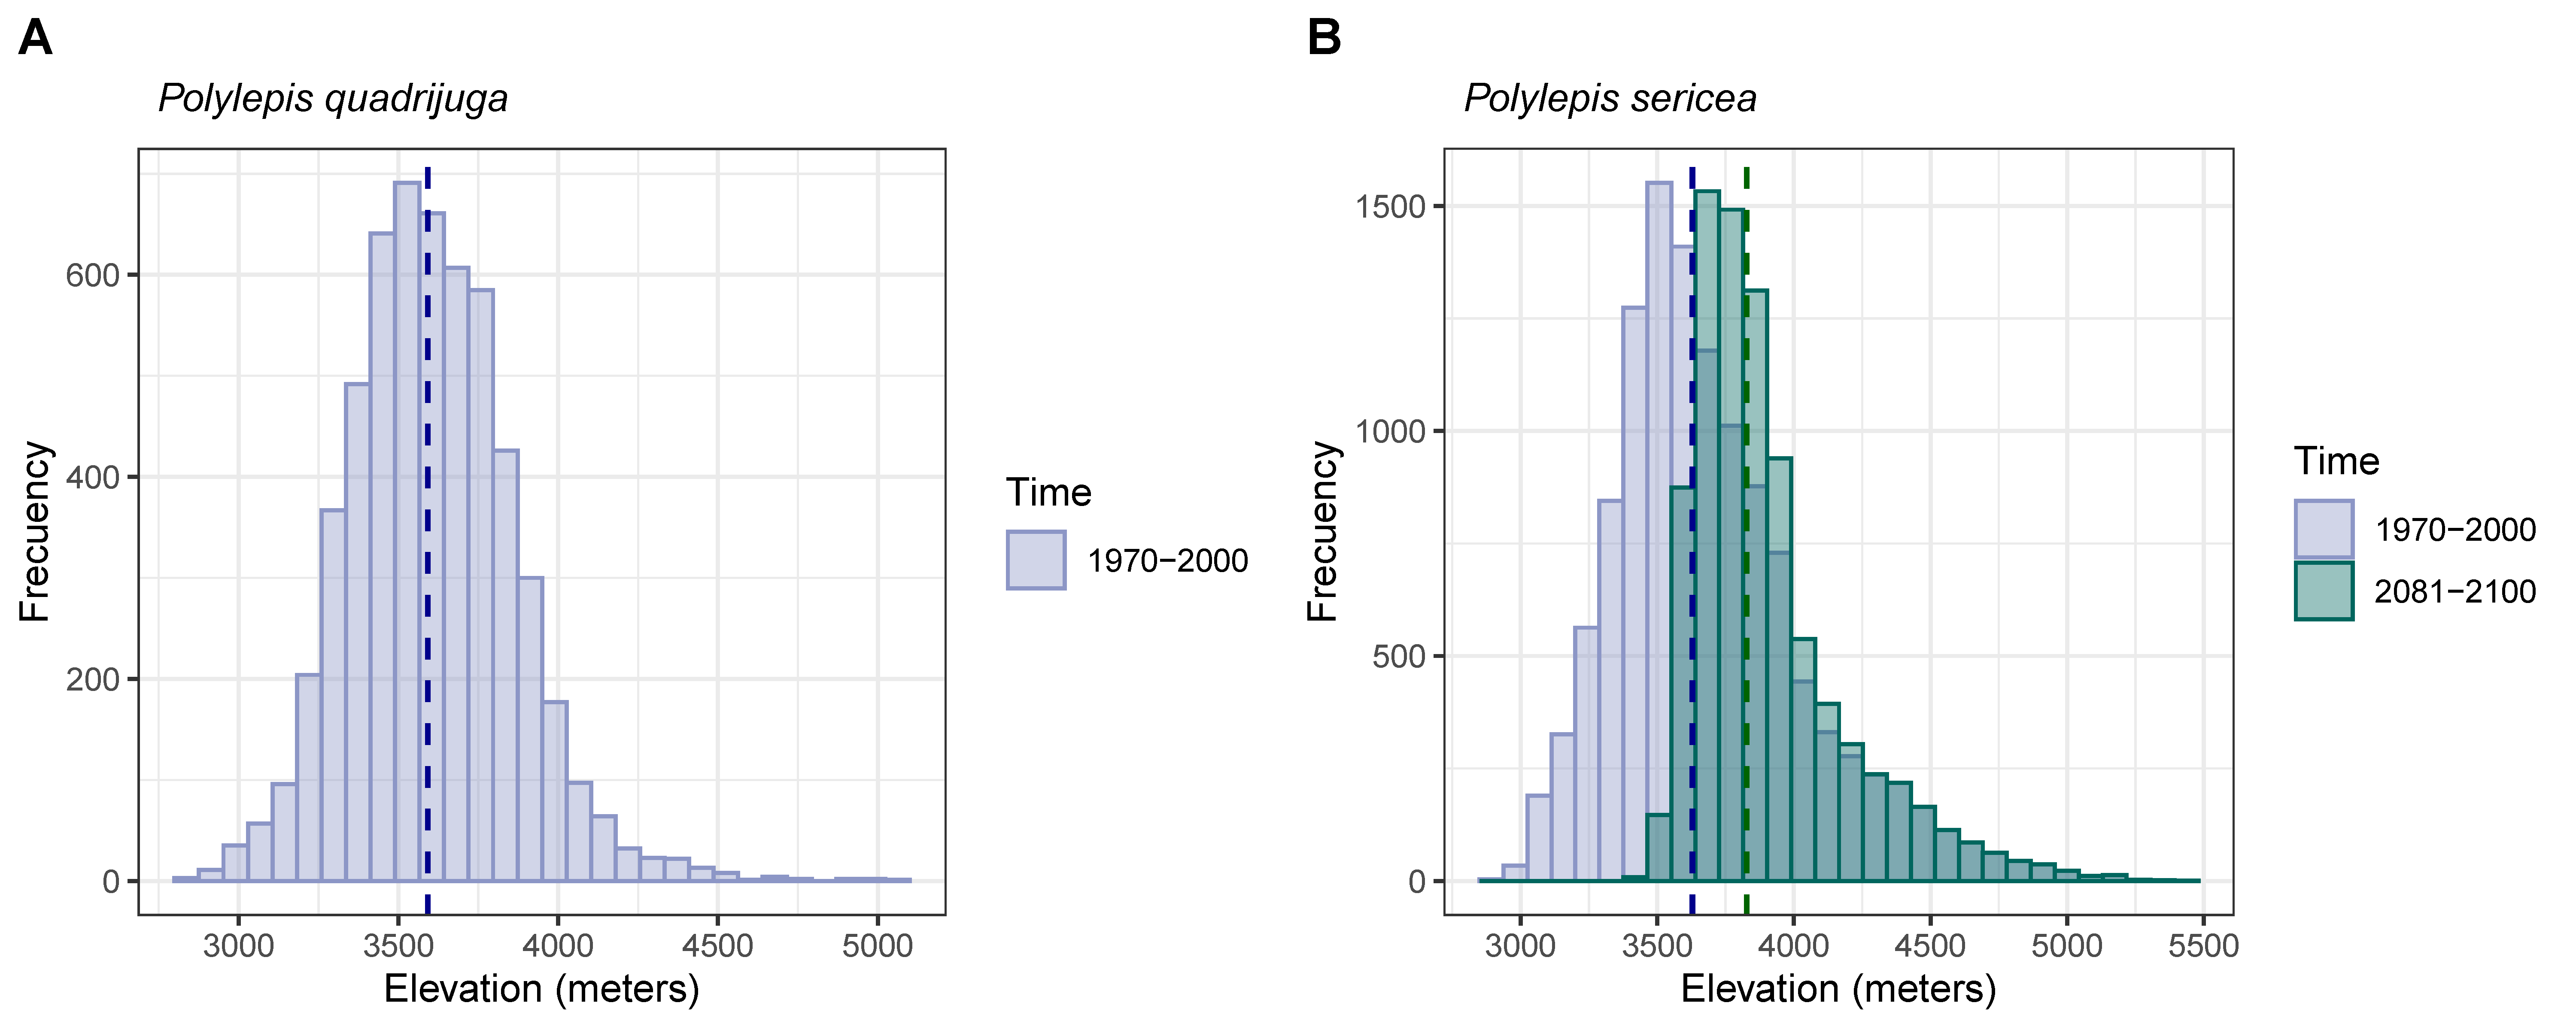
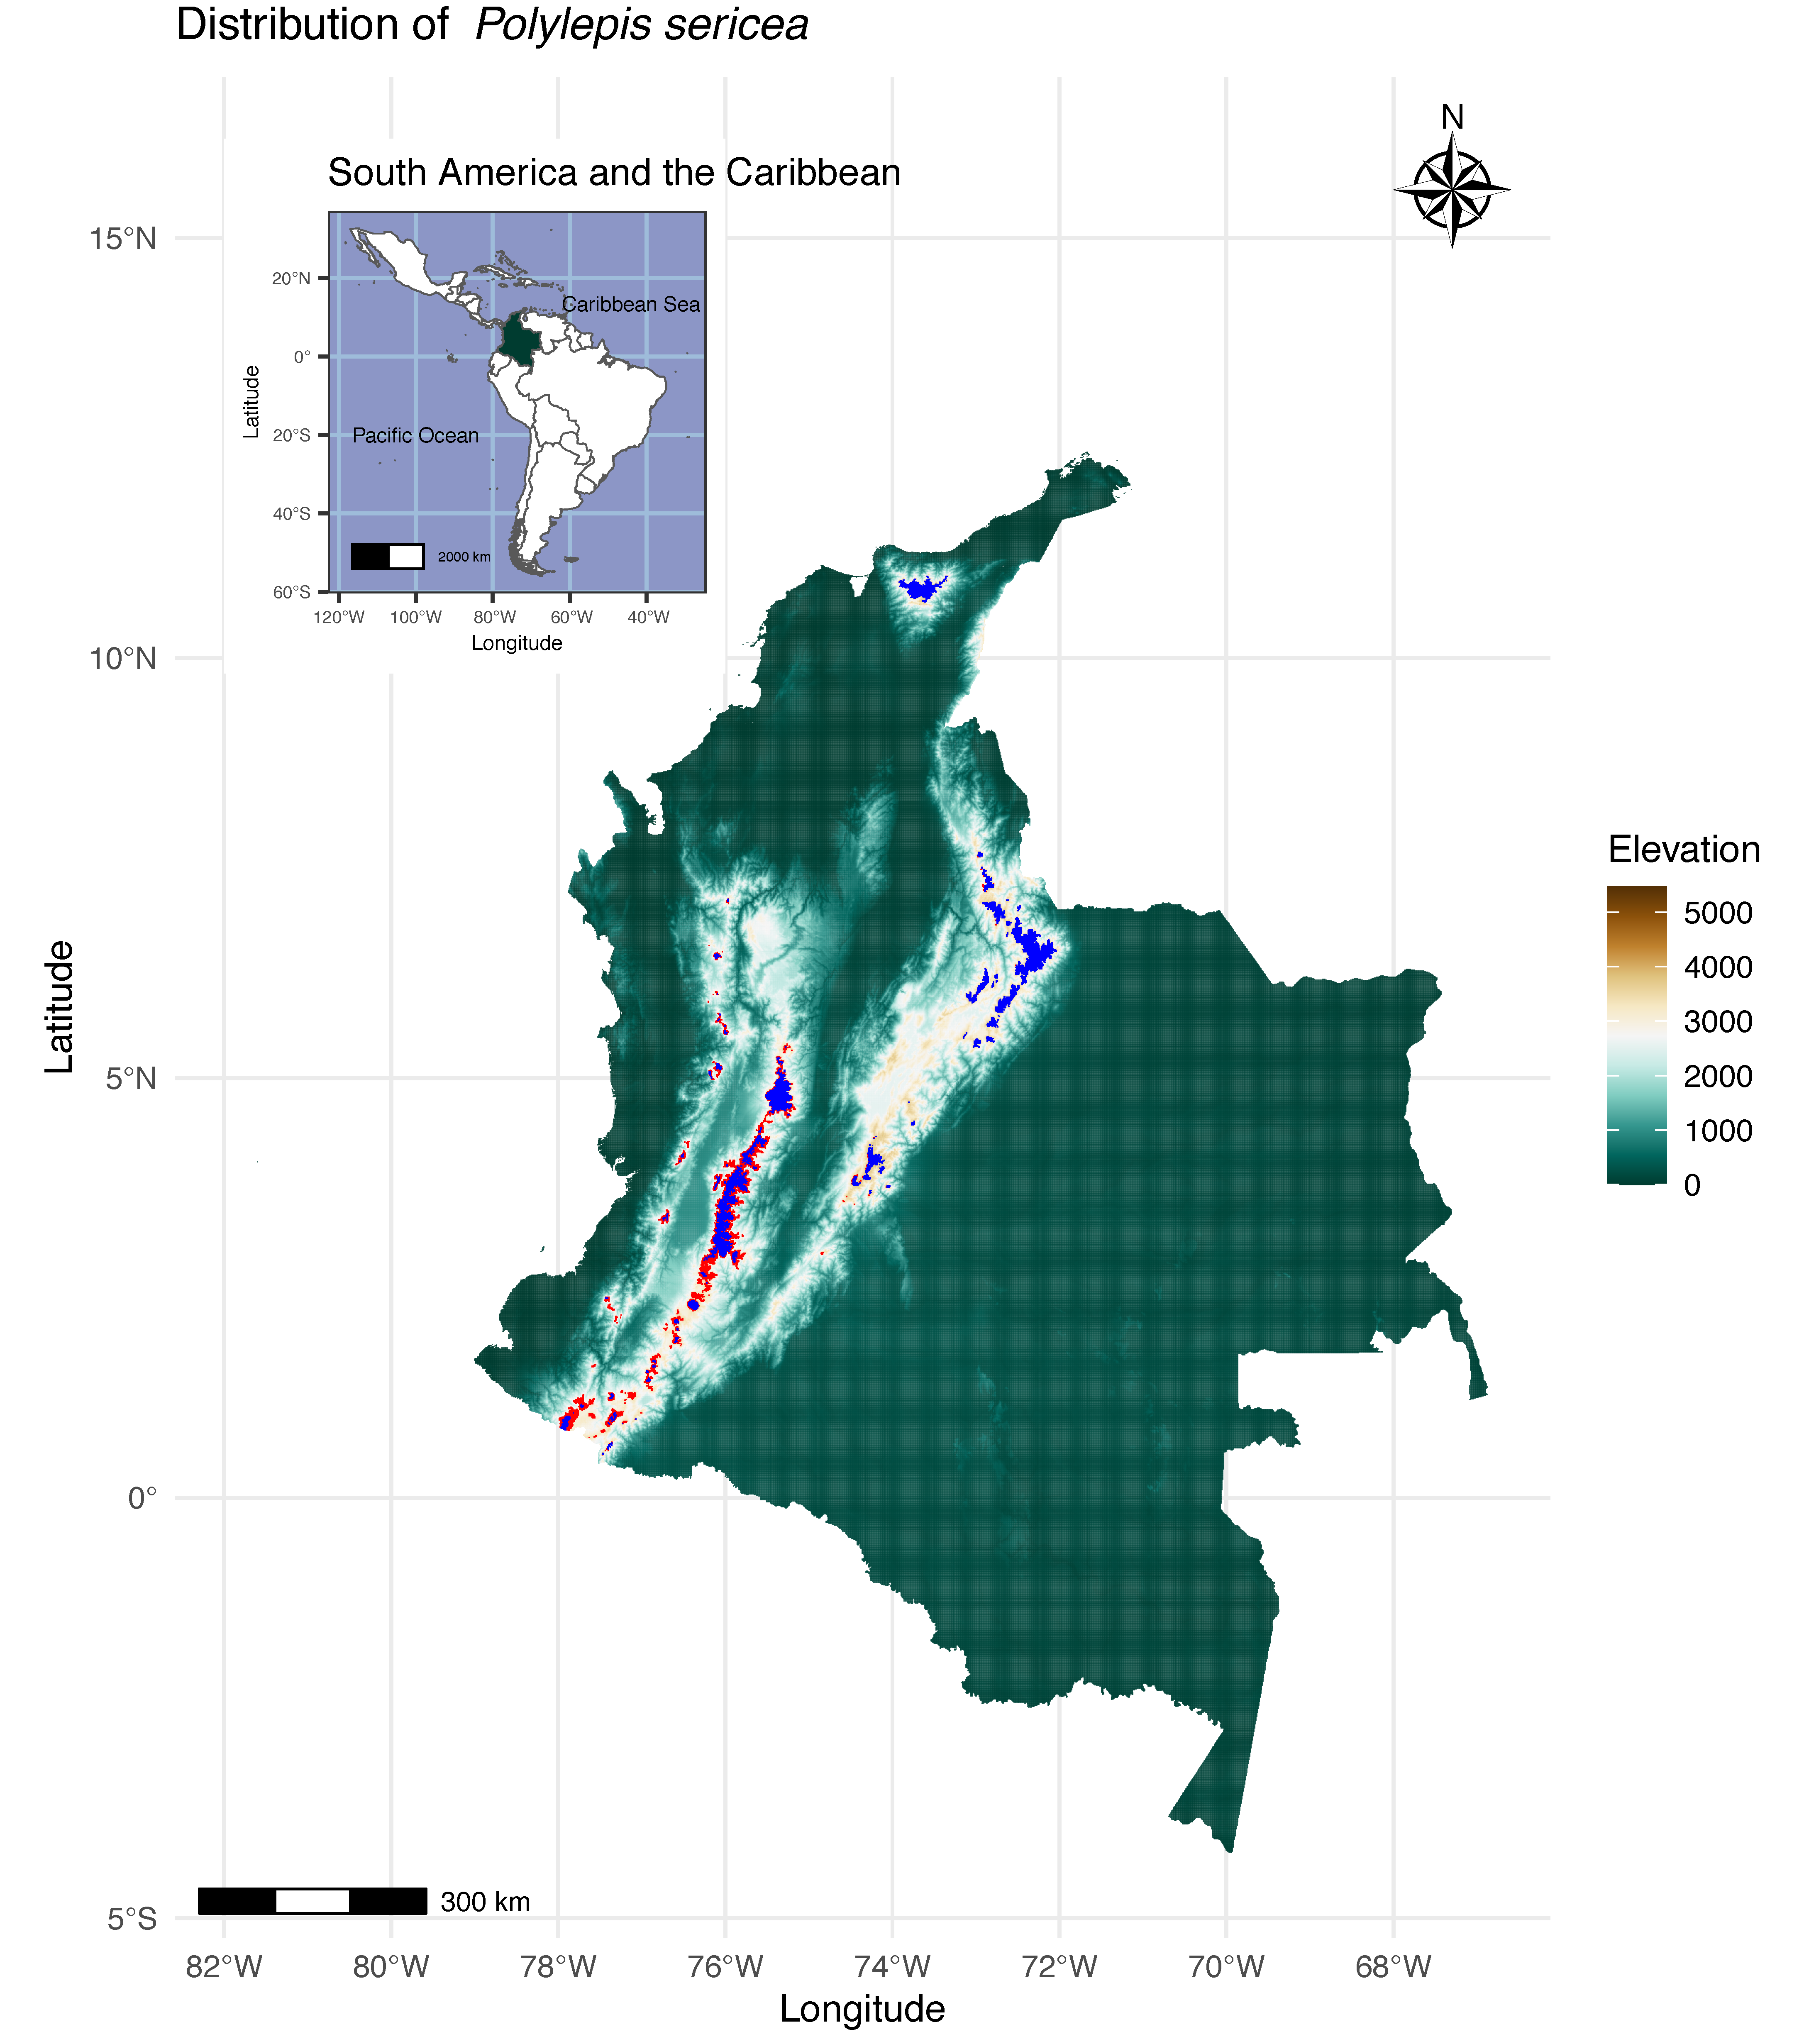
In order to interpret more thoroughly the species range shifts, we summarized the presence probabilities > 0.9 across the altitudinal gradient (Figure 5). The current distribution for P. quadrijuga using near-to-present bioclimatic variables was centered at a median of 3592 m a.s.l. (Figure 5A) without any shifts due to its disappearance (99% lost area). On the other hand, the current distribution for P. sericea based on near-to-present bioclimatic variables was centered at a median of 3629 m a.s.l. with a progressive shift of ca. 200 m towards 3828 m a.s.l. according to the predicted bioclimatic variables for the years 2081–2100 (Figure 5B). Interestingly, the latter range shift did not imply the colonization of novel habitats at higher elevations, but rather the disappearance of populations at the lowest edge of the current species distribution. In other words, this pattern was consistent with extinction at the trailing edge as supposed to colonization of the leading edge. Such trend was also observable when the near-to-present and predicted future distributions were overlapped within the same map (Figure 6). The latter graphical depiction also suggested abundance of novel suitable habitats for P. sericea in the northeast corner of the Eastern Cordillera (i.e., the highlands of Almorzadero, El Cocuy, and Pisba), and to a lesser extent in the southerner Sumapaz complex, both of which are currently major hotspots for P. quadrijuga (Figure 1 and Figure 4A). Another apparently suitable area for P. sericea, yet still non-colonized, is located in Sierra Nevada, an isolated sea-level massif in northern coastal Colombia with no connection to the Andean range.
Water deficit in the creeks and microhabitats where the water-sensitive Polylepis forests establish could imply a reduction in the distribution range of the species. In this case, a decrease in the presence and density of trees could negatively affect even more the availability of water, i.e., the snowball effect. This dependency is suggested in Figure 7, in which the Thornthwaite aridity index taken from the ENVIREM (Environmental Raster for Ecological Modeling) repository was included ad hoc in the estimation of the current probability of distribution for both P. sericea and P. quadrijuga. The inclusion of a baseline with the Thornthwaite aridity index reinforced the previous predictions, with a loss of suitable microhabitats for the species development due to an imminent temperature increase, which would raise evapotranspiration and decline the system’s water stock.

4. Discussion

4.1. Range Losses Are Expected Mostly for P. quadrijuga Forests

At the biological level, P. quadrijuga appears to be more vulnerable to climate change than P. sericea. A significant reduction is predicted in the distribution area of P. quadrijuga, namely a decrease in the likelihood of finding suitable areas. Under controlled conditions, studies have shown a loss of diversity with increasing scores for climatic variables such as temperature, which proves to be a determining factor in this type of predictions [81]. For the particular case of Polylepis ssp., several biovariables retained in the analysis were related to temperature. Raised temperature can create conditions like a warmer atmosphere, which could in turn cause greater evapotranspiration, and thus more severe droughts and heat episodes [82]. Yet, warmer temperatures, along with improved edaphic conditions and soil water availability, could also boost diversity [4] and tree growth in a temperature-limited ecosystem [83,84]. Each of these scenarios causes distinct effects on the trees’ development (phenology) and growth (resource acquisition) [85,86].
Increased temperature will also cause habitat shifts in an elevational gradient, more dramatically for P. quadrijuga than for P. sericea. Habitat shifts will in turn cause a movement of microclimates [87,88], generating a displacement of species and a decrease in areas available for their establishment [89]. This would result in a reduction in the area of microhabitats that currently provide shelter to P. quadrijuga, a more specialized species locally adapted to the intrinsic climate heterogeneity and topographic complexity (as per ruggedness and connectivity [28]) of the Eastern Cordillera. These losses have already been observed since the last glacial episode to the present, during which approximately 62% of the original Polylepis forest area was lost in the northern Andes [40]. Meanwhile, P. sericea seems more resilient to variations, a likely byproduct of its generalist adaptation to the less climate-variable, and perhaps more recently colonized, Central Cordillera.
It is anticipated that there will be significant declines in the distribution of P. quadrijuga forests by the year 2100, which aligns with previous modeling studies that estimated a loss of suitable area for the species between 76.4% and 98.5% [38]. This phenomenon, commonly referred to as thermophilization, involves the gradual reduction of cold mountain habitats and their associated organisms [90]. Similar trends have been reported for other high-elevation tropical species [14], for which it is projected that by 2070, there will be significant decreases in the suitable area and notable upward changes [16]. Despite our projection being conducted over a longer time frame and in a different, larger research region, the overall findings indicate a consistent trend for specialized Neotropical high-elevation ecosystems, and therefore are mutually supportive. Furthermore, our work advanced these findings by including the responses of the related species P. sericea, which in contrast will exhibit range shifts by extinction only at the trailing edge (lowest range of the current species), while persisting at the leading edge without further colonizing it.
The exclusion by this study of comparable climate sensitivity predictions at the Polylepis forests of the Ecuadorian Cordilleras was due to the challenges associated with gathering and comparing data from different national territories, given contrasting underlying rural pressures and conservation measures. Still, it is crucial to examine similar methods in the Ecuadorian high-elevation forests [15] in order to obtain a more thorough understanding of the impacts of climate change on high Andean Polylepis forests located north of the Huancabamba depression, which serves as a major biogeographical barrier for plant species adapted to high elevations [91].
The occurrence of range shifts is contingent upon the underlying principle of niche conservatism, while also being influenced by the inherent dispersion and establishment capacity of the taxonomic groups. In species characterized by restricted seed dispersal, such as Polylepis spp., alternative plant recruitment mechanisms for migration could play a crucial role [92]. For example, the sporadic movement of pollen would likely be less restricted compared to the distribution of seeds. Alternatively, transgressive ecotypes with niche requirements within the trailing and leading edges could act as bridges for migration [17,93]. In the context of long-lived tree species like Polylepis spp., novel ecotypes [94] and intermediate instances of habitat connectivity [28] may offer opportunities for migration beyond contemporary geographic and ecological barriers.
Certain exogenous drivers have the potential to challenge the assumption of niche conservatism by providing organisms with the capacity to successfully inhabit and establish themselves in novel environments. For example, previous studies [95,96] have examined the interactions between high-elevation shrub species and soil types across mountain microhabitats. These findings suggest that underground plant–soil interactions and physiological adaptations may potentially serve as pre-adaptations for facilitating a broader range expansion of high-elevation plants [97]. Environmentally driven plastic responses can also keep [84] and expand the range of suitable climates [98]. Thus, complementing this modeling effort with biotic masks, increasing CO2 effects [85], eco-physiological estimations, and edaphic factors [83,99] is a crucial avenue of study for more accurate monitoring and prediction of climate change sensitivity in mountainous ecosystems [83,100].

4.2. Alternative Responses of Polylepis Forests to Climate Change

Despite the pessimistic scenario from the previous section, unforeseen alternative responses of P. quadrijuga forests to climate change may prove beneficial, as already predicted for P. sericea. For instance, species diversity within and around the Polylepis forests could offer a mechanism to mitigate the negative impacts of climate change through the enhancement of positive biotic interactions [101,102]. These interactions include ecological facilitation [103,104] and adaptive introgression [105,106,107]. Anyhow, the aforementioned positive impacts may also be counteracted by the occurrence of equally unforeseen distribution losses in the Polylepis forests due to the so-far-unaccounted-for incidence of mining [108], agriculture, and rural population density [109], all regarded as the main post-conflict anthropogenic hazards in the northern Andean highlands [110], especially in the Eastern Cordillera where the specialized P. quadrijuga sits, to a lesser extent in the Central Cordillera where the more plastic P. sericea settles [14].
A more suitable scenario for the dynamically evolving Polylepis forests would involve ecotypes within the same geographic area. Despite displaying divergence in microhabitat preferences, dissimilar ecotypes could be capable of exchanging adaptive genetic variations through gene flow and introgression [107,111]. The phenomenon of gene swapping resulting from porosities in taxa/ecotypes boundaries has two implications: (1) taxa that are considered uncommon due to their limited number of records may exhibit a larger effective size in terms of standing adaptive variation, and (2) it is possible for sympatric lineages to exhibit coordinated responses to climatic changes.
Another strategy for the in situ persistence of Polylepis spp. populations is the leveraging of standing local-scale adaptive variation, identified as a key factor contributing to the remarkable ecological diversity observed in the Neotropical high-elevation ecosystems [12,20]. Populations may possess inherent standing genetic diversity naturally selected for adaptation to current variations in the environment at a microhabitat scale. In mountainous regions characterized by significant heterogeneity, the impact of local-scale environmental factors on genetic diversity and morphological variation has been well documented [19]. The underlying ad hoc hypothesis in this regard for further testing by oncoming studies is that the diverse range of climatic conditions, such as those found in the Eastern Cordillera where P. quadrijuga is located, could result in sufficient heritable polygenic phenotypic variation [112], which may in turn serve as pre-adaptation [113] to the novel selection pressures brought by climate change [114].
Finally, Assisted Gene Flow (AGF) [115,116], assisted forest migration, and provenance-guided restoration [117,118] may help in matching standing species and ecotypes to predicted future environments [119]. For instance, our models suggest an unexplored yet suitable habitat for P. sericea in the northeast corner of the Eastern Cordillera (i.e., Almorzadero, El Cocuy, and Pisba), now a major hotspot of P. quadrijuga characterized by high-elevation summits (up to 5410 m) flanking the deep (1100 m) and topographically intricate Chichamocha inter-Andean canyon. Based on this, optimized seed sourcing [120] of P. sericea may sustain an ecological replacement strategy [121] trying to equalize the ecosystem function jeopardized by the disappearance of P. quadrijuga [122].
A possible limitation of our study is that these ad hoc scenarios are contingent upon the availability of data at the micro-scale level. The lack of accessibility and usability of bioclimatic data at a spatial resolution below 1 km2 fails to account for the influence of micro-environmental factors on local-scale genetic adaptation [123]. The significance of this phenomenon is particularly pronounced in forested mountain ecosystems, where microhabitats can function as refugia [124,125], like those found near the tree line as a result of ongoing landform processes [17,93,126]. The establishment success of Polylepis spp. provenances may depend on certain habitat characteristics at a local scale (as demonstrated in European Beech [127]), which are often not accounted for in SDMs [128], an additional reason to try incorporating biotic masks, dispersal dynamics [129], and germination rates [130].
As a closing caution note, SDMs, as the one implemented here in MaxEnt, may be limited in terms of model complexity, performance and selection [131], data availability and sampling bias [58] (e.g., survivorship bias due to the extensive use of Polylepis forests as rural cooking fuelwood during the Colonial and Early Republic periods), mechanistic lag responses [132,133], and the accuracy of the MPI-ESM1-2-HR forecast (despite that it reasonably predicts seasonality across the northern Andes [45]). They may also fall short in accurately modeling local-scale properties including water availability, and micro-topographic, geomorphic, and edaphic features [99], as well as the presence and distribution of other organisms, such as competitors and facilitators [134]. For instance, microsite variables can modify soil conditions that affect successful tree recruitment at the tree line. As a consequence of these phenomena, SDMs may demonstrate a significant degree of uncertainty [135] and a lack of validation when applied at smaller scales within the environmentally complex high-elevation forests. Nonetheless, we are still able to prospect below possible avenues to bridge these caveats as part of future studies.

4.3. Perspectives

The different models show a good ability to estimate the probability of occurrence of Polylepis spp. Still, these models may present improvements by inserting variables that can determine the current and future distribution of the species. One of these may be the current land use, specifically with regard to the pressures on high mountain ecosystems [108,109]. Others could be edaphic features [99], dispersal dynamics [129], germination probabilities [130], biotic masks, and eco-physiological variables, such as evapotranspiration indexes [114], which can further describe the characteristics of the species’ ecological niche as shown by the ad hoc inclusion of the Thornthwaite evapotranspiration aridity index. The latter has proven to be a promising index to model how the temperature rise would increase evapotranspiration, and thus decrease the amount of water balance in the system [136,137], matching previous predictions of microhabitat suitability for water-intensive species such as Polylepis. Other repositories could in turn be explored (e.g., edaphic databases [99]), specially targeting additional Polylepis species across the Andes.
Furthermore, future modeling efforts must try to accommodate the alternative responses described in the previous section. Specifically, the ability of forests in high mountain settings to endure in the face of climate change is mostly influenced by variations at the local scale, namely in microhabitats. As an illustration, the presence of environmental gradients has the potential to provide migrants from favorable habitats in close proximity to the existing places [43]. Consequently, this phenomenon might significantly influence the adaptive responses of high-elevation tree species to the effects of warming [124]. Further collection of localized environmental data is necessary [138], since existing climate databases do not provide the necessary level of detail to accurately depict the variability of forest microhabitats. The influence of topographic and soil characteristics on the differentiation of microhabitats within Polylepis forests, and the impact of diversity patterns and biotic interactions with other endemic and sympatric tree and shrub species, as well as herbivores, pests, and pathogens, has been largely overlooked by climatic models [139]. In addition to high-resolution climate data, it is paramount to systematically consider eco-physiological and ecological adaptive traits at local scales in natural surveys and controlled trials (e.g., common gardens) as field validation of the predictive models.
Overall, this study has predicted that P. quadrijuga forests are likely to face large distribution losses, an opposing trend to the one forecasted for P. sericea. In other words, P. quadrijuga has a limited ability to maintain its current habitat requirements in the face of climate change, while P. sericea may be able to partially persist in its current areas with a modest extinction in the trailing edge. A causal constraint for the persistence and migration potential of P. quadrijuga may be its higher niche specialization, likely evolved as a response to the topographic and microhabitat complexity found at the Eastern Cordillera. Meanwhile, the more generalist P. sericea, found at the less environmentally heterogenous Central Cordillera, may respond more plastically to changing conditions.
Despite the vulnerable forecast for P. quadrijuga given niche conservatism and range shifts, in situ standing adaptation, plasticity, and trans-generational epigenetic inheritance [140,141] could still counteract detrimental effects. Anyhow, these results inform on the vulnerability status of the species, their local conservation priorities, and potential seed sourcing for provenance-assisted restoration. Yet, whether P. quadrijuga will manage to effectively withstand by its own unfavorable changing climatic conditions, or be ecologically replaced by P. sericea, must remain untold for the time being.

5. Conclusions

  • Polylepis quadrijuga depicts a restricted ability to maintain its current distribution in the face of short-term climate change, with a limited potential for range shifts.
  • On the other hand, P. sericea forests could persist in their current ranges despite moderate vulnerability in the trailing edge.
  • Contrasting species responses via range shifts to climate change may be due to higher niche specialization of P. quadrijuga, a strategy likely favored by divergent selection in the environmentally and topographically complex Eastern Cordillera, while a generalist response of P. sericea is expected from a species that faced less heterogenous landscape as the one found in the Central Cordillera of the northern Andes.
  • The current analytical pipeline is applicable to other montane forest tree species in the tropics, and would benefit by the inclusion of additional variables concerning dispersal dynamics, germination probabilities, explicit eco-physiological indices, as well as high-resolution environmental, edaphic, and biotic masks.

Supplementary Materials

The following supporting information can be downloaded at https://www.mdpi.com/article/10.3390/f15050811/s1. Table S1. Georeferencing for the occurrences of P. quadrijuga and P. sericea; the final number of records per species being 33 for P. sericea and 72 for P. quadrijuga, after respectively depurating nine and ten multiple occurrences within the same 1 km2 pixels; Table S2. Summary performance statistics for P. sericea and P. quadrijuga distribution models implemented in MaxEnt with 12 parametric combinations each, as depicted in Figure 3A,B; Figure S1. Marginal response curves of the bioclimatic variables utilized to build the training datasets of the species distribution models for (A) P. quadrijuga and (B) P. sericea.

Author Contributions

L.E.B.-C. and A.J.C. conceived and drafted a proposal for this study. L.E.B.-C. and F.L.-H. gathered and depurated all data. L.E.B.-C. and F.L.-H. carried out analysis with conceptual advice from A.J.C. All authors contributed to the overall interpretation and discussion of the results. L.E.B.-C. and A.J.C. wrote the first version of this manuscript, with substantial suggestions from F.L.-H. All authors have read and agreed to the published version of the manuscript.

Funding

A.J.C. extends thanks for support during the conceptualizaztion and execution of this research from the British Council’s Newton Fund through grant 527023146, Vetenskapsrådet through grants 2016-00418/2022-04411, and Kungliga Vetenskapsakademien through grant BS2017-0036.

Data Availability Statement

Raw georeferencing data is available under the “Supplementary Materials”. The analytical pipeline designed and utilized in this study is available upon request to the authors.

Acknowledgments

L.E.B.-C. acknowledges the Departamento de Ciencias Forestales at Universidad Nacional de Colombia for supporting his PAE research initiative. We thank the pioneering support offered non-for-profit by A. Elbakyan to access non-Open-Access (non-OA) publications referenced by this work.

Conflicts of Interest

The authors declare no conflicts of interest.

References

  1. Cortés, A.J.; Restrepo-Montoya, M.; Bedoya-Canas, L.E. Modern Strategies to Assess and Breed Forest Tree Adaptation to Changing Climate. Front. Plant Sci. 2020, 11, 583323. [Google Scholar] [CrossRef] [PubMed]
  2. Mina, M.; Bugmann, H.; Cordonnier, T.; Irauschek, F.; Klopcic, M.; Pardos, M.; Cailleret, M.; Brando, P. Future ecosystem services from European mountain forests under climate change. J. Appl. Ecol. 2016, 54, 389–401. [Google Scholar] [CrossRef]
  3. Lenoir, J.; Gegout, J.C.; Marquet, P.A.; de Ruffray, P.; Brisse, H. A significant upward shift in plant species optimum elevation during the 20th century. Science 2008, 320, 1768–1771. [Google Scholar] [CrossRef] [PubMed]
  4. Steinbauer, M.J.; Grytnes, J.A.; Jurasinski, G.; Kulonen, A.; Lenoir, J.; Pauli, H.; Rixen, C.; Winkler, M.; Bardy-Durchhalter, M.; Barni, E.; et al. Accelerated increase in plant species richness on mountain summits is linked to warming. Nature 2018, 556, 231–234. [Google Scholar] [CrossRef] [PubMed]
  5. Lenoir, J.; Gégout, J.-C.; Guisan, A.; Vittoz, P.; Wohlgemuth, T.; Zimmermann, N.E.; Dullinger, S.; Pauli, H.; Willner, W.; Svenning, J.-C. Going against the flow: Potential mechanisms for unexpected downslope range shifts in a warming climate. Ecography 2010, 33, 295–303. [Google Scholar] [CrossRef]
  6. Jump, A.S.; Penuelas, J. Running to stand still: Adaptation and the response of plants to rapid climate change. Ecol. Lett. 2005, 8, 1010–1020. [Google Scholar] [CrossRef] [PubMed]
  7. Nicotra, A.B.; Segal, D.L.; Hoyle, G.L.; Schrey, A.W.; Verhoeven, K.J.; Richards, C.L. Adaptive plasticity and epigenetic variation in response to warming in an Alpine plant. Ecol. Evol. 2015, 5, 634–647. [Google Scholar] [CrossRef] [PubMed]
  8. Nicotra, A.B.; Atkin, O.K.; Bonser, S.P.; Davidson, A.M.; Finnegan, E.J.; Mathesius, U.; Poot, P.; Purugganan, M.D.; Richards, C.L.; Valladares, F.; et al. Plant phenotypic plasticity in a changing climate. Trends Plant Sci. 2010, 15, 684–692. [Google Scholar] [CrossRef] [PubMed]
  9. Hoffmann, A.A.; Sgro, C.M. Climate change and evolutionary adaptation. Nature 2011, 470, 479–485. [Google Scholar] [CrossRef]
  10. Berry, P.M.; Dawson, T.P.; Harrison, P.A.; Pearson, R.; Butt, N. The sensitivity and vulnerability of terrestrial habitats and species in Britain and Ireland to climate change. J. Nat. Conserv. 2003, 11, 15–23. [Google Scholar] [CrossRef]
  11. McVicar, T.R.; Körner, C. On the use of elevation, altitude, and height in the ecological and climatological literature. Oecologia 2013, 171, 335–337. [Google Scholar] [CrossRef] [PubMed]
  12. Madriñán, S.; Cortés, A.J.; Richardson, J.E. Páramo is the world’s fastest evolving and coolest biodiversity hotspot. Front. Genet. 2013, 4, 192. [Google Scholar] [CrossRef] [PubMed]
  13. Pouchon, C.; Fernández, A.; Nassar, J.M.; Boyer, F.d.r.; Aubert, S.; Lavergne, S.b.; Mavárez, J.S. Phylogenomic Analysis of the Explosive Adaptive Radiation of the Espeletia complex (Asteraceae) in the Tropical Andes. Syst. Biol. 2018, 67, 1041–1060. [Google Scholar] [CrossRef]
  14. Valencia, J.B.; Mesa, J.; León, J.G.; Madriñán, S.; Cortés, A.J. Climate Vulnerability Assessment of the Espeletia Complex on Páramo Sky Islands in the Northern Andes. Front. Ecol. Evol. 2020, 8, 565708. [Google Scholar] [CrossRef]
  15. Peyre, G.; Lenoir, J.; Karger, D.N.; Gomez, M.; Gonzalez, A.; Broennimann, O.; Guisan, A.; Jiménez-Alfaro, B. The fate of páramo plant assemblages in the sky islands of the northern Andes. J. Veg. Sci. 2020, 31, 967–980. [Google Scholar] [CrossRef]
  16. Mavárez, J.; Bézy, S.; Goeury, T.; Fernández, A.; Aubert, S. Current and future distributions of Espeletiinae (Asteraceae) in the Venezuelan Andes based on statistical downscaling of climatic variables and niche modelling. Plant Ecol. Divers. 2018, 12, 633–647. [Google Scholar] [CrossRef]
  17. Anthelme, F.; Carrasquer, I.; Ceballos, J.L.; Peyre, G. Novel plant communities after glacial retreat in Colombia: (many) losses and (few) gains. Alp. Bot. 2022, 132, 211–222. [Google Scholar] [CrossRef]
  18. Luteyn, J.L. Páramos: A Checklist of Plant Diversity, Geographic Distribution and Botanical Literature; The New York Botanical Garden Press: New York, NY, USA, 1999. [Google Scholar]
  19. Hughes, C.E.; Atchison, G.W. The ubiquity of alpine plant radiations: From the Andes to the Hengduan Mountains. New Phytol. 2015, 207, 275–282. [Google Scholar] [CrossRef]
  20. Cortés, A.J.; Garzón, L.N.; Valencia, J.B.; Madriñán, S. On the Causes of Rapid Diversification in the Páramos: Isolation by Ecology and Genomic Divergence in Espeletia. Front. Plant Sci. 2018, 9, 408949. [Google Scholar] [CrossRef]
  21. Sklenář, P.; Kučerová, A.; Macková, J.; Romoleroux, K. Temperature Microclimates of Plants in a Tropical Alpine Environment: How Much does Growth Form Matter? Arct. Antarct. Alp. Res. 2016, 48, 61–78. [Google Scholar] [CrossRef]
  22. Sklenář, P.; Kučerová, A.; Macek, P.; Macková, J. The frost-resistance mechanism in páramo plants is related to geographic origin. N. Z. J. Bot. 2012, 50, 391–400. [Google Scholar] [CrossRef]
  23. Sklenář, P.; KucErová, A.; Macek, P.; Macková, J. Does plant height determine the freezing resistance in the páramo plants? Austral Ecol. 2010, 35, 929–934. [Google Scholar] [CrossRef]
  24. Monasterio, M.; Sarmiento, L. Adaptive radiation of Espeletia in the cold andean tropics. Trends Ecol. Evol. 1991, 6, 387–391. [Google Scholar] [CrossRef] [PubMed]
  25. Flantua, S.G.A.; Payne, D.; Borregaard, M.K.; Beierkuhnlein, C.; Steinbauer, M.J.; Dullinger, S.; Essl, F.; Irl, S.D.H.; Kienle, D.; Kreft, H.; et al. Snapshot isolation and isolation history challenge the analogy between mountains and islands used to understand endemism. Glob. Ecol. Biogeogr. 2020, 29, 1651–1673. [Google Scholar] [CrossRef]
  26. Sklenář, P.; Hedberg, I.; Cleef, A.M. Island biogeography of tropical alpine floras. J. Biogeogr. 2014, 41, 287–297. [Google Scholar] [CrossRef]
  27. Vargas, O.M.; Ortiz, E.M.; Simpson, B.B. Conflicting phylogenomic signals reveal a pattern of reticulate evolution in a recent high-Andean diversification (Asteraceae: Astereae: Diplostephium). New Phytol. 2017, 214, 1736–1750. [Google Scholar] [CrossRef] [PubMed]
  28. Flantua, S.G.A.; O’Dea, A.; Onstein, R.E.; Giraldo, C.; Hooghiemstra, H. The flickering connectivity system of the north Andean páramos. J. Biogeogr. 2019, 46, 1808–1825. [Google Scholar] [CrossRef]
  29. Papadopoulou, A.; Knowles, L.L. Genomic tests of the species-pump hypothesis: Recent island connectivity cycles drive population divergence but not speciation in Caribbean crickets across the Virgin Islands. Evolution 2015, 69, 1501–1517. [Google Scholar] [CrossRef] [PubMed]
  30. Vargas, O.M.; Madriñán, S.; Simpson, B.B. Allopatric speciation is more prevalent than parapatric ecological divergence in tropical montane system. PeerJ 2019, 11, e15479. [Google Scholar] [CrossRef]
  31. Muellner-Riehl, A.N. Mountains as Evolutionary Arenas: Patterns, Emerging Approaches, Paradigm Shifts, and Their Implications for Plant Phylogeographic Research in the Tibeto-Himalayan Region. Front. Plant Sci. 2019, 10, 195. [Google Scholar] [CrossRef]
  32. Ronikier, M. Biogeography of high-mountain plants in the Carpathians: An emerging phylogeographical perspective. Taxon. 2011, 6, 373–389. [Google Scholar] [CrossRef]
  33. Hazzi, N.A.; Moreno, J.S.; Ortiz-Movliav, C.; Palacio, R.D. Biogeographic regions and events of isolation and diversification of the endemic biota of the tropical Andes. Proc. Natl. Acad. Sci. USA 2018, 115, 7985–7990. [Google Scholar] [CrossRef] [PubMed]
  34. Chen, H.Y.H.; Delzon, S.; Urli, M.; Samalens, J.-C.; Lamy, J.-B.; Lischke, H.; Sin, F.; Zimmermann, N.E.; Porté, A.J. Field Evidence of Colonisation by Holm Oak, at the Northern Margin of Its Distribution Range, during the Anthropocene Period. PLoS ONE 2013, 8, e80443. [Google Scholar] [CrossRef] [PubMed]
  35. Castillo, D.D.; Carrasco, J.C.; Quevedo, L.A.; Ricaurte, C.B.; Gavilanes, A.V.; Borz, S.A. Diversity, composition and structure of Andean high forest in Ecuador, South America. Bull. Transilv. Univ. Bras.-Ser. II For. 2017, 10, 1–16. [Google Scholar]
  36. Rangel-Churio, O.; Arellano-Peña, H. Bosques de Polylepis: Un tipo de vegetación condenado a la extinción. In Colombia Diversidad Biotica X: Cambio Global (Natural) y Climático (Antrópico) en el Páramo Colombiano; Rangel-Churio, O., Ed.; Instituto de Ciencias Naturales: Bogotá Colombia, 2010; pp. 443–478. [Google Scholar]
  37. Segoia-Salcedo, M.C.; Domic, A.; Boza, T.E.; Kessler, M. Taxonomic review of the genus Polylepis: Implications for ecological studies, conservation and restoration. Ecol. Austral 2018, 18, 1. [Google Scholar]
  38. Caballero-Villalobos, L.; Fajardo-Gutiérrez, F.; Calbi, M.; Silva-Arias, G.A. Climate Change Can Drive a Significant Loss of Suitable Habitat for Polylepis quadrijuga, a Treeline Species in the Sky Islands of the Northern Andes. Front. Ecol. Evol. 2021, 9, 661550. [Google Scholar] [CrossRef]
  39. Gradstein, S.R.; León-Yánez, S. Liverwort diversity in Polylepis pauta forests of Ecuador under different climatic conditions. Neotrop. Biodivers. 2020, 6, 138–146. [Google Scholar] [CrossRef]
  40. Zutta, B.R.; Rundel, P.W. Modeled shifts in Polylepis species ranges in the Andes from the last glacial maximum to the present. Forests 2017, 8, 232. [Google Scholar] [CrossRef]
  41. Peyre, G.; Balslev, H.; Font, X. Phytoregionalisation of the Andean paramo. PeerJ 2018, 6, e4786. [Google Scholar] [CrossRef]
  42. Escudero, A.; Giménez-Benavides, L.; Iriondo, J.M.; Rubio, A. Patch Dynamics and Islands of Fertility in a High Mountain Mediterranean Community. Arct. Antarct. Alp. Res. 2004, 36, 518–527. [Google Scholar] [CrossRef]
  43. Scherrer, D.; Körner, C. Topogaphically controlled thermal-habitat differentiation buffers alpine plant diversity against climate warming. J. Biogeogr. 2011, 38, 406–416. [Google Scholar] [CrossRef]
  44. Körner, C. Alpine Plant Life: Functional Plant Ecology of High Mountain Ecosystems; Springer: Berlin/Heidelberg, Germany, 2003. [Google Scholar]
  45. Rumpf, S.B.; Hulber, K.; Klonner, G.; Moser, D.; Schutz, M.; Wessely, J.; Willner, W.; Zimmermann, N.E.; Dullinger, S. Range dynamics of mountain plants decrease with elevation. Proc. Natl. Acad. Sci. USA 2018, 115, 1848–1853. [Google Scholar] [CrossRef] [PubMed]
  46. Enquist, B.; Condit, R.; Peet, R.; Schildhauer, M.; Thiers, B. Cyberinfrastructure for an integrated botanical information network to investigate the ecological impacts of global climate change on plant biodiversity. PeerJ Prepr. 2016, 4, e2615v2. [Google Scholar] [CrossRef]
  47. Wisz, M.S.; Hijmans, R.J.; Li, J.; Peterson, A.T.; Graham, C.H.; Guisan, A. Effects of sample size on the performance of species distribution models. Divers. Distrib. 2008, 14, 763–773. [Google Scholar] [CrossRef]
  48. Fois, M.; Cuena-Lombraña, A.; Fenu, G.; Bacchetta, G. Using species distribution models at local scale to guide the search of poorly known species: Review, methodological issues and future directions. Ecol. Model. 2018, 385, 124–132. [Google Scholar] [CrossRef]
  49. van Proosdij, A.S.J.; Sosef, M.S.M.; Wieringa, J.J.; Raes, N. Minimum required number of specimen records to develop accurate species distribution models. Ecography 2016, 39, 542–552. [Google Scholar] [CrossRef]
  50. Phillips, S.; Anderson, R.; Schapire, R. Maximum entropy modeling of species geographic distributions. Ecol. Model. 2006, 190, 231–259. [Google Scholar] [CrossRef]
  51. Fick, S.E.; Hijmans, R.J. WorldClim 2: New 1km spatial resolution climate surfaces for global land areas. Int. J. Climatol. 2017, 37, 4302–4315. [Google Scholar] [CrossRef]
  52. Müller, W.A.; Jungclaus, J.H.; Mauritsen, T.; Baehr, J.; Bittner, M.; Budich, R.; Bunzel, F.; Esch, M.; Ghosh, R.; Haak, H.; et al. A Higher-resolution Version of the Max Planck Institute Earth System Model (MPI-ESM1.2-HR). J. Adv. Model. Earth Syst. 2018, 10, 1383–1413. [Google Scholar] [CrossRef]
  53. Xin, X. Performance of BCC-CSM2-MR in simulating summer climate changes in East Asia. Geophys. Res. Abstr. 2019, 21, 4711. [Google Scholar]
  54. Arias, P.A.; Ortega, G.; Villegas, L.D.; Martínez, J.A. Colombian climatology in CMIP5/CMIP6 models: Persistent biases and improvements. Rev. Fac. Ing. Univ. Antioq. 2021, 100, 75–96. [Google Scholar] [CrossRef]
  55. Crandall, K.A.; Tovar, C.; Arnillas, C.A.; Cuesta, F.; Buytaert, W. Diverging Responses of Tropical Andean Biomes under Future Climate Conditions. PLoS ONE 2013, 8, e63634. [Google Scholar] [CrossRef] [PubMed]
  56. Zeng, Y.; Low, B.W.; Yeo, D.C.J. Novel methods to select environmental variables in MaxEnt: A case study using invasive crayfish. Ecol. Model. 2016, 341, 5–13. [Google Scholar] [CrossRef]
  57. Feng, X.; Park, D.S.; Liang, Y.; Pandey, R.; Papes, M. Collinearity in ecological niche modeling: Confusions and challenges. Ecol. Evol. 2019, 9, 10365–10376. [Google Scholar] [CrossRef] [PubMed]
  58. Syfert, M.M.; Smith, M.J.; Coomes, D.A. The effects of sampling bias and model complexity on the predictive performance of MaxEnt species distribution models. PLoS ONE 2013, 8, e55158. [Google Scholar] [CrossRef]
  59. Cobos, M.E.; Peterson, A.T.; Osorio-Olvera, L.; Jiménez-García, D. An exhaustive analysis of heuristic methods for variable selection in ecological niche modeling and species distribution modeling. Ecol. Inform. 2019, 53, 100983. [Google Scholar] [CrossRef]
  60. Dormann, C.F.; Elith, J.; Bacher, S.; Buchmann, C.; Carl, G.; Carré, G.; Marquéz, J.R.G.; Gruber, B.; Lafourcade, B.; Leitão, P.J.; et al. Collinearity: A review of methods to deal with it and a simulation study evaluating their performance. Ecography 2013, 36, 27–46. [Google Scholar] [CrossRef]
  61. Chatterjee, S.; Hadi, A.S. Regression Analysis by Example; Wiley: Hoboken, NJ, USA, 2006. [Google Scholar]
  62. Naimi, B.; Hamm, N.A.S.; Groen, T.A.; Skidmore, A.K.; Toxopeus, A.G. Where is positional uncertainty a problem for species distribution modelling? Ecography 2014, 37, 191–203. [Google Scholar] [CrossRef]
  63. Phillips, S.J.; Anderson, R.P.; Dudík, M.; Schapire, R.E.; Blair, M.E. Opening the black box: An open-source release of Maxent. Ecography 2017, 40, 887–893. [Google Scholar] [CrossRef]
  64. Phillips, S.; Dudík, M.; Schapire, R. A maximum entropy approach to species distribution modeling. In Proceedings of the Twenty-First International Conference on Machine Learning, Banff, AB, Canada, 4–8 July 2004; pp. 655–662. [Google Scholar]
  65. Kass, J.M.; Muscarella, R.; Galante, P.J.; Bohl, C.L.; Pinilla-Buitrago, G.E.; Boria, R.A.; Soley-Guardia, M.; Anderson, R.P. ENMeval 2.0: Redesigned for customizable and reproducible modeling of species’ niches and distributions. Methods Ecol. Evol. 2021, 12, 1602–1608. [Google Scholar] [CrossRef]
  66. Buffum, B.; McGreevy, T.J., Jr.; Gottfried, A.E.; Sullivan, M.E.; Husband, T.P. An Analysis of Overstory Tree Canopy Cover in Sites Occupied by Native and Introduced Cottontails in the Northeastern United States with Recommendations for Habitat Management for New England Cottontail. PLoS ONE 2015, 10, e0135067. [Google Scholar] [CrossRef] [PubMed]
  67. Lobo, J.M.; Jiménez-Valverde, A.; Real, R. AUC: A misleading measure of the performance of predictive distribution models. Glob. Ecol. Biogeogr. 2008, 17, 145–151. [Google Scholar] [CrossRef]
  68. West, A.M.; Kumar, S.; Brown, C.S.; Stohlgren, T.J.; Bromberg, J. Field validation of an invasive species Maxent model. Ecol. Inform. 2016, 36, 126–134. [Google Scholar] [CrossRef]
  69. Breiman, L. Random Forests. Mach. Learn. 2001, 45, 5–32. [Google Scholar] [CrossRef]
  70. Friedman, J.H. Greedy Function Approximation: A Gradient Boosting Machine. Ann. Stat. 2001, 29, 1189–1232. [Google Scholar] [CrossRef]
  71. Cox, D.R. The regression analysis of binary sequences. J. R. Stat. Soc. Ser. B 1958, 20, 215–232. [Google Scholar] [CrossRef]
  72. Webb, G.I. Naïve Bayes. In Encyclopedia of Machine Learning; Sammut, C., Webb, G.I., Eds.; Springer: Boston, MA, USA, 2011. [Google Scholar]
  73. Liu, Z. Linear Discriminant Analysis. In Encyclopedia of Systems Biology; Dubitzky, W., Wolkenhauer, O., Cho, K., Yokota, H., Eds.; Springer: New York, NY, USA, 2013. [Google Scholar]
  74. Fix, E.; Hodges, J.L. Discriminatory Analysis, Nonparametric Discrimination: Consistency Properties. Technol. Rep. 1951, 4, 238–247. [Google Scholar] [CrossRef]
  75. Cover, T.M.; Hart, P.E. Nearest neighbor pattern classification. IEEE Trans. Inf. Theory 1967, 13, 21–27. [Google Scholar] [CrossRef]
  76. Kuhn, M. Building predictive models in R using the caret package. J. Stat. Softw. 2008, 28, 1–26. [Google Scholar] [CrossRef]
  77. Spiers, J.A.; Oatham, M.P.; Rostant, L.V.; Farrell, A.D. Applying species distribution modelling to improving conservation based decisions: A gap analysis of Trinidad and Tobago’s endemic vascular plants. Biodivers. Conserv. 2018, 27, 2931–2949. [Google Scholar] [CrossRef]
  78. Liu, C.; Berry, P.M.; Dawson, T.P.; Pearso, R.G. Selecting thresholds of occurrence in the prediction of species distributions. Ecography 2005, 28, 385–393. [Google Scholar] [CrossRef]
  79. Hijmans, R.; Van Etten, J.; Cheng, J.; Mattiuzzi, M.; Sumner, M.; Greenberg, J.; Hijmans, M. Package ‘raster’. R Package 2015, 734, 473. [Google Scholar]
  80. Wickham, H.; Chang, W.; Wickham, M.H. Package ‘ggplot2’—Create elegant data visualisations using the grammar of graphics. R Package 2016, 2, 1–189. [Google Scholar]
  81. Duchicela, S.A.; Cuesta, F.; Pinto, E.; Gosling, W.D.; Young, K.R. Indicators for assessing tropical alpine rehabilitation practices. Ecosphere 2019, 10, e02595. [Google Scholar] [CrossRef]
  82. Leon-Garcia, I.V.; Lasso, E. High heat tolerance in plants from the Andean highlands: Implications for paramos in a warmer world. PLoS ONE 2019, 14, e0224218. [Google Scholar] [CrossRef] [PubMed]
  83. Silva, L.C.R.; Sun, G.; Zhu-Barker, X.; Liang, Q.; Wu, N.; Horwath, W.R. Tree growth acceleration and expansion of alpine forests: The synergistic effect of atmospheric and edaphic change. Sci. Adv. 2016, 2, e1501302. [Google Scholar] [CrossRef] [PubMed]
  84. Lasso, E.; Matheus-Arbeláez, P.; Gallery, R.E.; Garzón-López, C.; Cruz, M.; Leon-Garcia, I.V.; Aragón, L.; Ayarza-Páez, A.; Curiel Yuste, J. Homeostatic Response to Three Years of Experimental Warming Suggests High Intrinsic Natural Resistance in the Páramos to Warming in the Short Term. Front. Ecol. Evol. 2021, 9, 615006. [Google Scholar] [CrossRef]
  85. Zhu, Z.; Piao, S.; Myneni, R.B.; Huang, M.; Zeng, Z.; Canadell, J.G.; Ciais, P.; Sitch, S.; Friedlingstein, P.; Arneth, A.; et al. Greening of the Earth and its drivers. Nat. Clim. Chang. 2016, 6, 791–795. [Google Scholar] [CrossRef]
  86. Correa-Díaz, A.; Romero-Sánchez, M.E.; Villanueva-Díaz, J. The greening effect characterized by the Normalized Difference Vegetation Index was not coupled with phenological trends and tree growth rates in eight protected mountains of central Mexico. For. Ecol. Manag. 2021, 496, 119402. [Google Scholar] [CrossRef]
  87. Scherrer, D.; Schmid, S.; Körner, C. Elevational species shifts in a warmer climate are overestimated when based on weather station data. Int. J. Biometeorol. 2010, 55, 645–654. [Google Scholar] [CrossRef]
  88. Körner, C.; Hiltbrunner, E. Why Is the Alpine Flora Comparatively Robust against Climatic Warming? Diversity 2021, 13, 383. [Google Scholar] [CrossRef]
  89. Chacón-Moreno, E.; Rodríguez-Morales, M.; Paredes, D.; Suárez del Moral, P.; Albarrán, A. Impacts of Global Change on the Spatial Dynamics of Treeline in Venezuelan Andes. Front. Ecol. Evol. 2021, 9, 615223. [Google Scholar] [CrossRef]
  90. Gottfried, M.; Pauli, H.; Futschik, A.; Akhalkatsi, M.; Barančok, P.; Benito Alonso, J.L.; Coldea, G.; Dick, J.; Erschbamer, B.; Fernández Calzado, M.a.R.; et al. Continent-wide response of mountain vegetation to climate change. Nat. Clim. Chang. 2012, 2, 111–115. [Google Scholar] [CrossRef]
  91. Weigend, M. Observations on the Biogeography of the Amotape-Huancabamba Zone in Northern Peru. Bot. Rev. 2002, 68, 38–54. [Google Scholar] [CrossRef]
  92. Cochrane, A.; Nicotra, A.; Ooi, M. Climate change: Alters plant recruitment from seed. Austral Ecol. 2019, 44, 931–934. [Google Scholar] [CrossRef]
  93. Harsch, M.A.; Bader, M.Y. Treeline form—A potential key to understanding treeline dynamics. Glob. Ecol. Biogeogr. 2011, 20, 582–596. [Google Scholar] [CrossRef]
  94. Rieseberg, L.H. Major Ecological Transitions in Wild Sunflowers Facilitated by Hybridization. Science 2003, 301, 1211–1216. [Google Scholar] [CrossRef]
  95. Little, C.J.; Wheeler, J.A.; Sedlacek, J.; Cortés, A.J.; Rixen, C. Small-scale drivers: The importance of nutrient availability and snowmelt timing on performance of the alpine shrub Salix herbacea. Oecologia 2016, 180, 1015–1024. [Google Scholar] [CrossRef]
  96. Sedlacek, J.; Bossdorf, O.; Cortés, A.J.; Wheeler, J.A.; van-Kleunen, M. What role do plant-soil interactions play in the habitat suitability and potential range expansion of the alpine dwarf shrub Salix herbacea? Basic. Appl. Ecol. 2014, 15, 305–315. [Google Scholar] [CrossRef]
  97. Cuesta, F.; Muriel, P.; Llambí, L.D.; Halloy, S.; Aguirre, N.; Beck, S.; Carilla, J.; Meneses, R.I.; Cuello, S.; Grau, A.; et al. Latitudinal and altitudinal patterns of plant community diversity on mountain summits across the tropical Andes. Ecography 2017, 40, 1381–1394. [Google Scholar] [CrossRef]
  98. Arnold, P.A.; Kruuk, L.E.B.; Nicotra, A.B. How to analyse plant phenotypic plasticity in response to a changing climate. New Phytol. 2019, 222, 1235–1241. [Google Scholar] [CrossRef] [PubMed]
  99. Velazco, S.J.E.; Galvão, F.; Villalobos, F.; De Marco Júnior, P. Using worldwide edaphic data to model plant species niches: An assessment at a continental extent. PLoS ONE 2017, 12, e0186025. [Google Scholar] [CrossRef] [PubMed]
  100. Llambí, L.D.; Rada, F. Ecological research in the tropical alpine ecosystems of the Venezuelan páramo: Past, present and future. Plant Ecol. Divers. 2019, 12, 519–538. [Google Scholar] [CrossRef]
  101. Cáceres, Y.; Llambí, L.D.; Rada, F. Shrubs as foundation species in a high tropical alpine ecosystem: A multi-scale analysis of plant spatial interactions. Plant Ecol. Divers. 2014, 8, 147–161. [Google Scholar] [CrossRef]
  102. Cuesta, F.; Llambí, L.D.; Huggel, C.; Drenkhan, F.; Gosling, W.D.; Muriel, P.; Jaramillo, R.; Tovar, C. New land in the Neotropics: A review of biotic community, ecosystem, and landscape transformations in the face of climate and glacier change. Reg. Environ. Chang. 2019, 19, 1623–1642. [Google Scholar] [CrossRef]
  103. Wheeler, J.A.; Schnider, F.; Sedlacek, J.; Cortés, A.J.; Wipf, S.; Hoch, G.; Rixen, C. With a little help from my friends: Community facilitation increases performance in the dwarf shrub Salix herbacea. Basic. Appl. Ecol. 2015, 16, 202–209. [Google Scholar] [CrossRef]
  104. Llambí, L.D.; Hupp, N.; Saez, A.; Callaway, R. Reciprocal interactions between a facilitator, natives, and exotics in tropical alpine plant communities. Perspect. Plant Ecol. Evol. Syst. 2018, 30, 82–88. [Google Scholar] [CrossRef]
  105. Seehausen, O. Hybridization and adaptive radiation. Trends Ecol. Evol. 2004, 19, 198–207. [Google Scholar] [CrossRef] [PubMed]
  106. Payseur, B.A.; Rieseberg, L.H. A genomic perspective on hybridization and speciation. Mol. Ecol. 2016, 25, 2337–2360. [Google Scholar] [CrossRef]
  107. Pineda, Y.M.; Cortés, A.J.; Madriñán, S.; Jiménez, I. The Nature of Espeletia Species. bioRxiv 2020, 9, 318865. [Google Scholar] [CrossRef]
  108. Pérez-Escobar, O.A.; Cámara-Leret, R.; Antonelli, A.; Bateman, R.; Bellot, S.; Chomicki, G.; Cleef, A.; Diazgranados, M.; Dodsworth, S.; Jaramillo, C.; et al. Mining threatens Colombian ecosystems. Science 2018, 359, 1475. [Google Scholar] [CrossRef]
  109. Vásquez, D.L.A.; Balslev, H.; Sklenář, P. Human impact on tropical-alpine plant diversity in the northern Andes. Biodivers. Conserv. 2015, 24, 2673–2683. [Google Scholar] [CrossRef]
  110. Baptiste, B.; Pinedo-Vasquez, M.; Gutierrez-Velez, V.H.; Andrade, G.I.; Vieira, P.; Estupiñán-Suárez, L.M.; Londoño, M.C.; Laurance, W.; Lee, T.M. Greening peace in Colombia. Nat. Ecol. Evol. 2017, 1, 102. [Google Scholar] [CrossRef] [PubMed]
  111. Cortés, A.J.; Wheeler, J.A. The Environmental Heterogeneity of Mountains at a Fine Scale in a Changing World. In Mountains, Climate, and Biodiversity; Hoorn, C., Perrigo, A., Antonelli, A., Eds.; Wiley: Hoboken, NJ, USA, 2018. [Google Scholar]
  112. Toivonen, J.M.; Horna, V.; Kessler, M.; Ruokolainen, K.; Hertel, D. Interspecific variation in functional traits in relation to species climatic niche optima in Andean Polylepis (Rosaceae) tree species: Evidence for climatic adaptations. Funct. Plant Biol. 2014, 41, 301–312. [Google Scholar] [CrossRef] [PubMed]
  113. Barghi, N.; Hermisson, J.; Schlötterer, C. Polygenic adaptation: A unifying framework to understand positive selection. Nat. Rev. Genet. 2020, 21, 769–781. [Google Scholar] [CrossRef]
  114. Cortés, A.J.; López-Hernández, F.; Blair, M.W. Genome–Environment Associations, an Innovative Tool for Studying Heritable Evolutionary Adaptation in Orphan Crops and Wild Relatives. Front. Genet. 2022, 13, 910386. [Google Scholar] [CrossRef] [PubMed]
  115. Aitken, S.N.; Bemmels, J.B. Time to get moving: Assisted gene flow of forest trees. Evol. Appl. 2016, 9, 271–290. [Google Scholar] [CrossRef]
  116. Aitken, S.N.; Whitlock, M.C. Assisted Gene Flow to Facilitate Local Adaptation to Climate Change. Annu. Rev. Ecol. Evol. Syst. 2013, 44, 367–388. [Google Scholar] [CrossRef]
  117. Breed, M.F.; Harrison, P.A.; Blyth, C.; Byrne, M.; Gaget, V.; Gellie, N.J.C.; Groom, S.V.C.; Hodgson, R.; Mills, J.G.; Prowse, T.A.A.; et al. The potential of genomics for restoring ecosystems and biodiversity. Nat. Rev. Genet. 2019, 20, 615–628. [Google Scholar] [CrossRef]
  118. Arenas, S.; Cortés, A.J.; Mastretta-Yanes, A.; Jaramillo-Correa, J.P. Evaluating the accuracy of genomic prediction for the management and conservation of relictual natural tree populations. Tree Genet. Genomes 2021, 17, 12. [Google Scholar] [CrossRef]
  119. Cortés, A.J.; López-Hernández, F.; Osorio-Rodriguez, D. Predicting thermal adaptation by looking into populations’ genomic past. Front. Genet. 2020, 11, 564515. [Google Scholar] [CrossRef] [PubMed]
  120. Walters, S.J.; Robinson, T.P.; Byrne, M.; Nevill, P. Seed sourcing in the genomics era: Multispecies provenance delineation for current and future climates. Restor. Ecol. 2022, 30, e13718. [Google Scholar] [CrossRef]
  121. Parker, K.A.; Seabrook-Davison, M.; Ewen, J.G. Opportunities for Nonnative Ecological Replacements in Ecosystem Restoration. Restor. Ecol. 2008, 18, 269–273. [Google Scholar] [CrossRef]
  122. Ramirez-Villegas, J.; Cuesta, F.; Devenish, C.; Peralvo, M.; Jarvis, A.; Arnillas, C.A. Using species distributions models for designing conservation strategies of Tropical Andean biodiversity under climate change. J. Nat. Conserv. 2014, 22, 391–404. [Google Scholar] [CrossRef]
  123. Leroy, T.; Louvet, J.M.; Lalanne, C.; Le Provost, G.; Labadie, K.; Aury, J.M.; Delzon, S.; Plomion, C.; Kremer, A. Adaptive introgression as a driver of local adaptation to climate in European white oaks. New Phytol. 2020, 226, 1171–1182. [Google Scholar] [CrossRef] [PubMed]
  124. Zellweger, F.; De Frenne, P.; Lenoir, J.; Vangansbeke, P.; Verheyen, K.; Bernhardt-Römermann, M.; Baeten, L.; Hédl, R.; Berki, I.; Brunet, J.; et al. Forest microclimate dynamics drive plant responses to warming. Science 2020, 368, 772–775. [Google Scholar] [CrossRef] [PubMed]
  125. Peyre, G.; Lopez, C.; Diaz, M.D.; Lenoir, J. Climatic refugia in the coldest neotropical hotspot, the Andean páramo. bioRxiv 2022, 11, 517325. [Google Scholar] [CrossRef]
  126. Gentili, R.; Baroni, C.; Panigada, C.; Rossini, M.; Tagliabue, G.; Armiraglio, S.; Citterio, S.; Carton, A.; Salvatore, M.C. Glacier shrinkage and slope processes create habitat at high elevation and microrefugia across treeline for alpine plants during warm stages. Catena 2020, 193, 104626. [Google Scholar] [CrossRef]
  127. Petrík, P.; Grote, R.; Gömöry, D.; Kurjak, D.; Petek-Petrik, A.; Lamarque, L.J.; Sliacka Konôpková, A.; Mukarram, M.; Debta, H.; Fleischer, P. The Role of Provenance for the Projected Growth of Juvenile European Beech under Climate Change. Forests 2022, 14, 26. [Google Scholar] [CrossRef]
  128. Sinclair, S.J.; White, M.D.; Newell, G.R. How useful are species distribution models for managing biodiversity under future climates? Ecol. Soc. 2010, 15, 8. [Google Scholar] [CrossRef]
  129. Tovar, C.; Melcher, I.; Kusumoto, B.; Cuesta, F.; Cleef, A.; Meneses, R.I.; Halloy, S.; Llambí, L.D.; Beck, S.; Muriel, P.; et al. Plant dispersal strategies of high tropical alpine communities across the Andes. J. Ecol. 2020, 108, 1910–1922. [Google Scholar] [CrossRef]
  130. Peyre, G. What Does the Future Hold for Páramo Plants? A Modelling Approach. Front. Ecol. Evol. 2022, 10, 896387. [Google Scholar] [CrossRef]
  131. Warren, D.L.; Seifert, S.N. Ecological niche modeling in Maxent: The importance of model complexity and the performance of model selection criteria. Ecol. Appl. 2011, 21, 335–342. [Google Scholar] [CrossRef] [PubMed]
  132. Alexander, J.M.; Chalmandrier, L.; Lenoir, J.; Burgess, T.I.; Essl, F.; Haider, S.; Kueffer, C.; McDougall, K.; Milbau, A.; Nuñez, M.A.; et al. Lags in the response of mountain plant communities to climate change. Glob. Chang. Biol. 2017, 24, 563–579. [Google Scholar] [CrossRef] [PubMed]
  133. Zimmer, A.; Meneses, R.I.; Rabatel, A.; Soruco, A.; Dangles, O.; Anthelme, F. Time lag between glacial retreat and upward migration alters tropical alpine communities. Perspect. Plant Ecol. Evol. Syst. 2018, 30, 89–102. [Google Scholar] [CrossRef]
  134. Yackulc, C.B.; Nichols, J.D.; Reid, J.; Der, R. To predict the niche, model colonization and extinction. Ecology 2015, 96, 16–23. [Google Scholar] [CrossRef] [PubMed]
  135. Buisson, L.; Thuiller, W.; Casajus, N.; Lek, S.; Grenouillet, G. Uncertainty in ensemble forecasting of species distribution. Glob. Chang. Biol. 2010, 16, 1145–1157. [Google Scholar] [CrossRef]
  136. Thornthwaite, C.W.; Mather, J.R. The Water Balance. Climatology 1955, 8, 1–104. [Google Scholar]
  137. Thornthwaite, C.W.; Mather, J.R. Instructions and Tables for Computing Potential Evapotranspiration and the Water Balance. Climatology 1957, 10, 185–311. [Google Scholar]
  138. Zellweger, F.; De Frenne, P.; Lenoir, J.; Rocchini, D.; Coomes, D. Advances in Microclimate Ecology Arising from Remote Sensing. Trends Ecol. Evol. 2019, 34, 327–341. [Google Scholar] [CrossRef]
  139. Guevara-Escudero, M.; Osorio, A.N.; Cortés, A.J. Integrative Pre-Breeding for Biotic Resistance in Forest Trees. Plants 2021, 10, 2022. [Google Scholar] [CrossRef] [PubMed]
  140. Hu, L.; Xiao, P.; Jiang, Y.; Dong, M.; Chen, Z.; Li, H.; Hu, Z.; Lei, A.; Wang, J. Transgenerational Epigenetic Inheritance under Environmental Stress by Genome-Wide DNA Methylation Profiling in Cyanobacterium. Front. Microbiol. 2018, 9, 1479. [Google Scholar] [CrossRef] [PubMed]
  141. Boskovic, A.; Rando, O.J. Transgenerational Epigenetic Inheritance. Annu. Rev. Genet. 2018, 52, 21–41. [Google Scholar] [CrossRef] [PubMed]
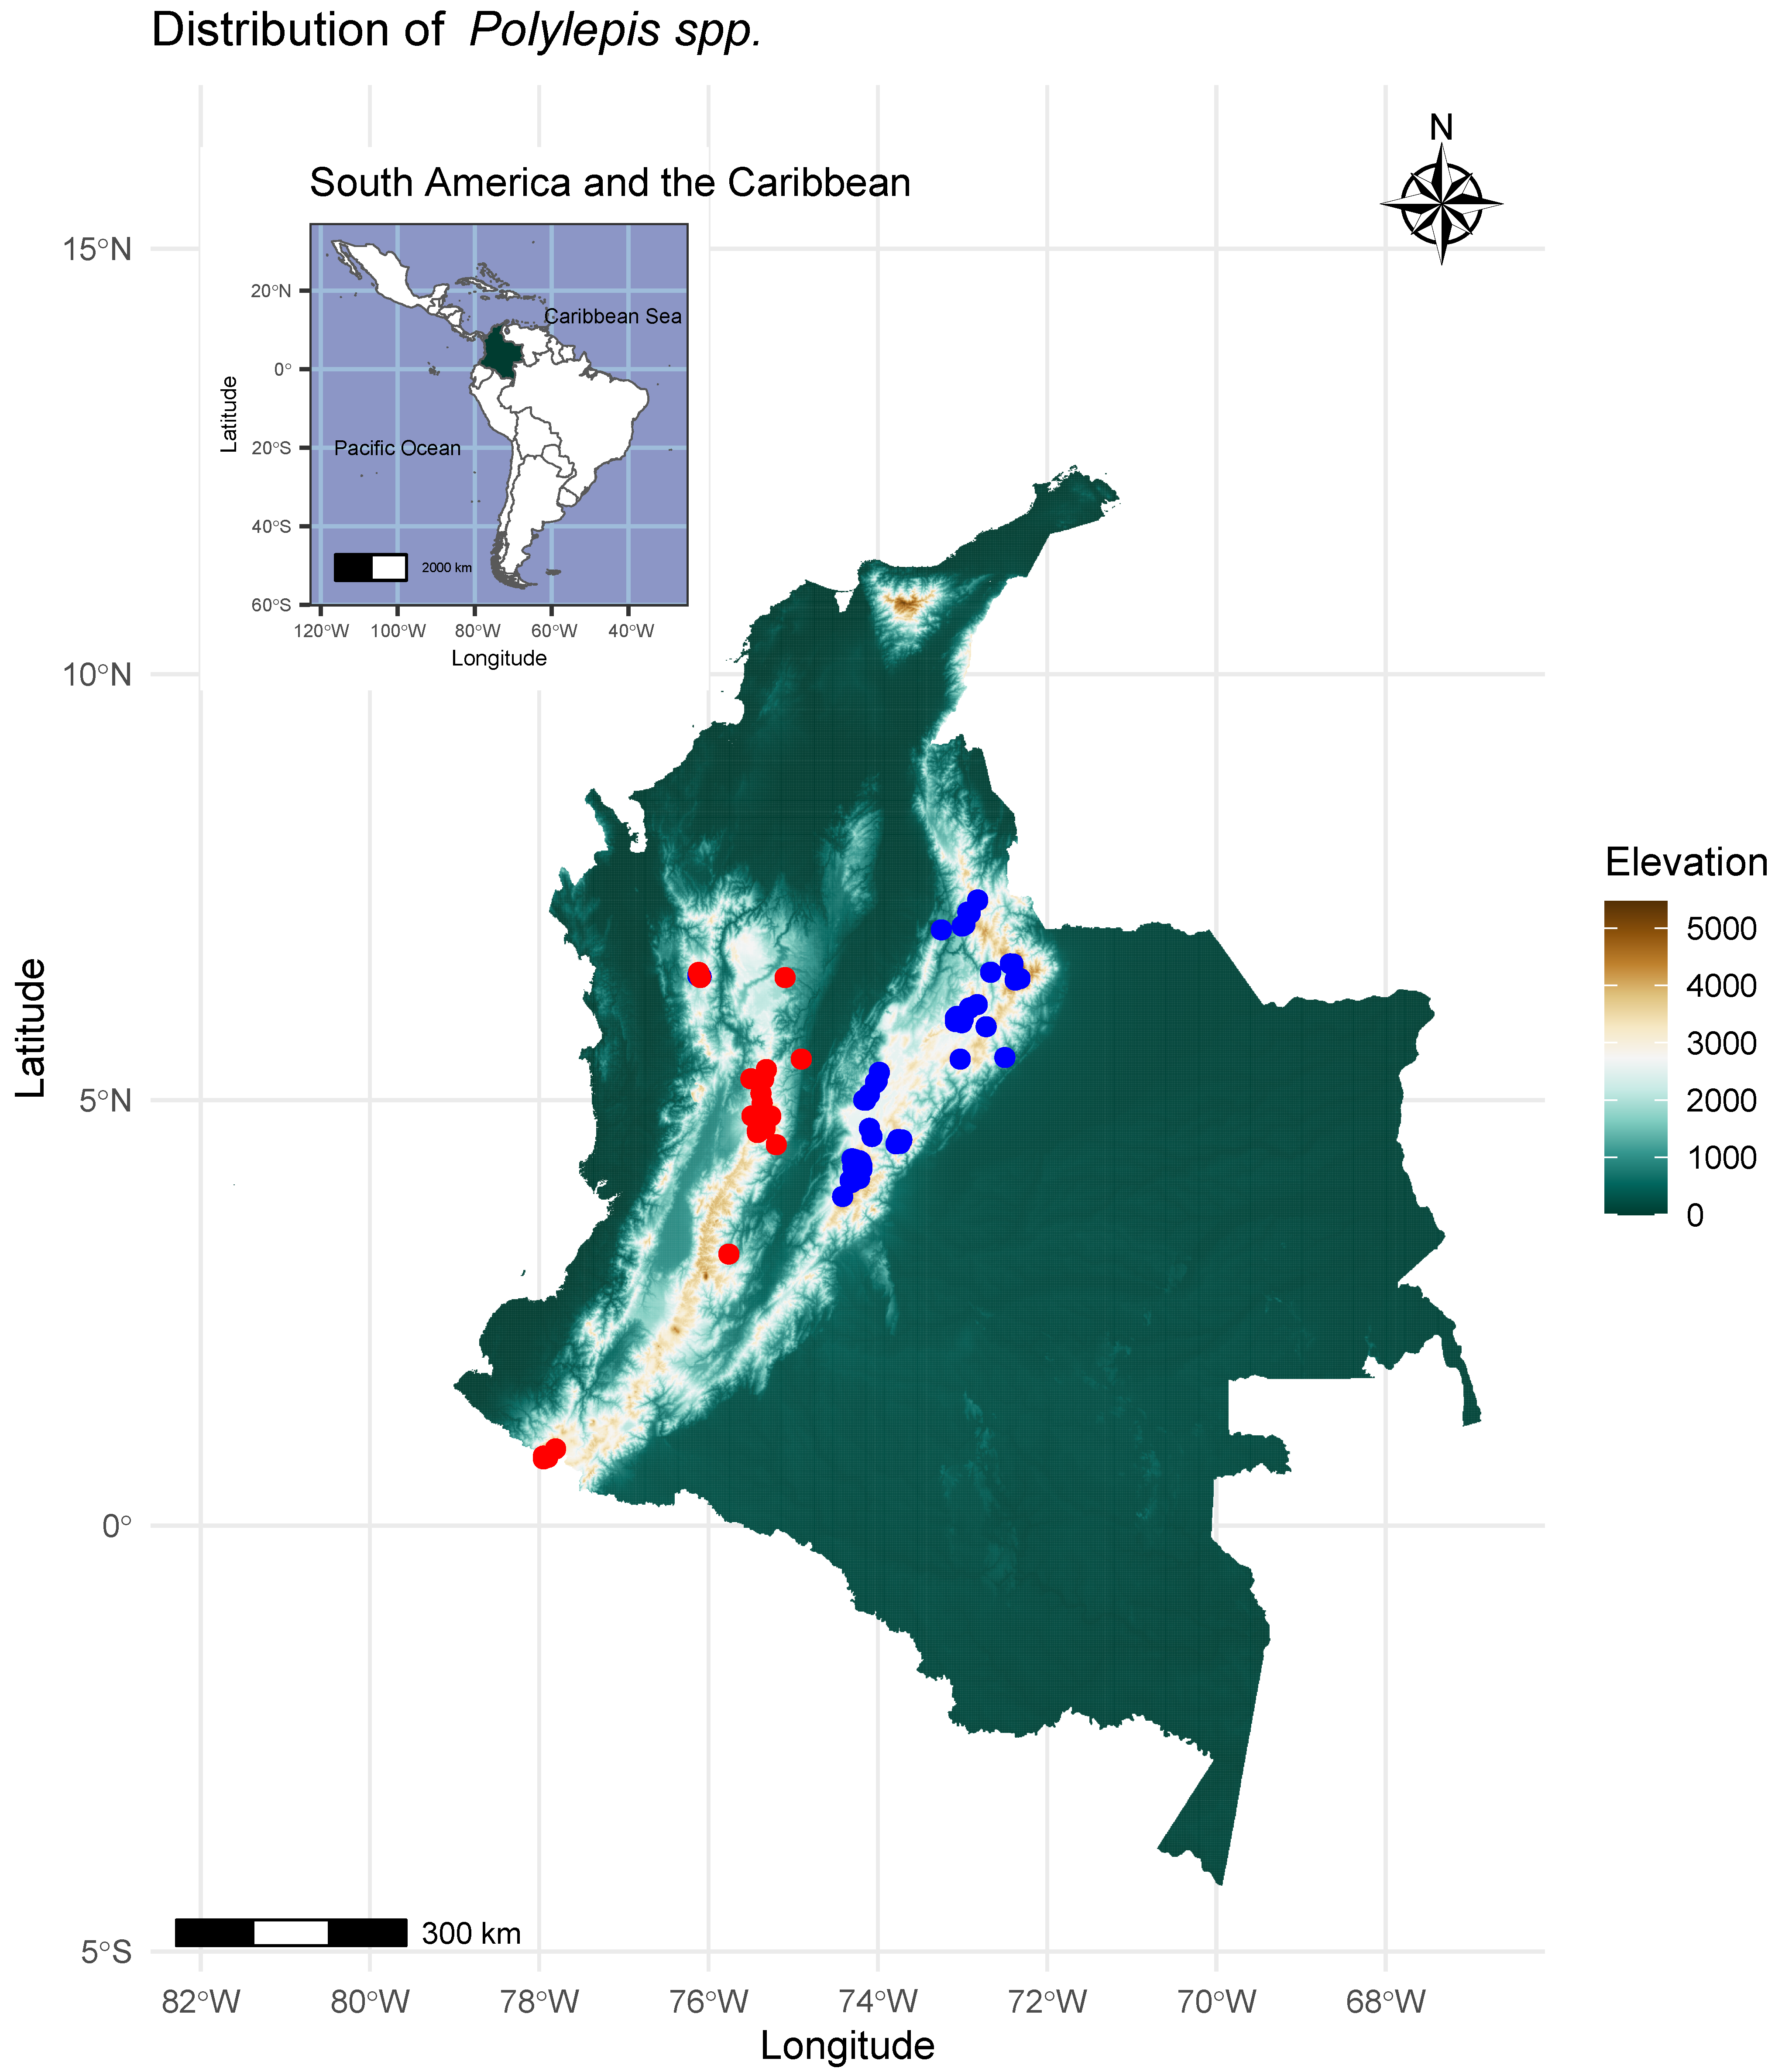
Figure 1. Geographical representation of the sampling area. Distribution map of P. sericea and P. quadrijuga in Colombia. Red and blue dots respectively denote P. sericea and P. quadrijuga.
Forests 15 00811 g001
Figure 2. Correlograms of bioclimatic variables for the current distributions of (A) P. quadrijuga and (B) P. sericea. Cells are colored according to the absolute Pearson’s correlation score, as mark in the gradient to the right of each subpanel. Non-significant correlations under Holm’s test appear as strikethrough, yet still depicted for the reader’s traceability. Variables are sorted according to the hclust function from R in order to maximize groupings and visualize more straightforward concerted tendencies in the among-variables correlations. Variables’ names are according to WorldClim (https://www.worldclim.org/data/bioclim.html accessed on 1 May 2024) as follows: Bio1: annual mean temperature, Bio2: mean diurnal range (mean of monthly (max temp—min temp)), Bio3: isothermality (bio2/bio7) (×100), Bio4: temperature seasonality (standard deviation × 100), Bio5: max temperature of warmest month, Bio6: min temperature of coldest month, Bio7: temperature annual range (Bio5–Bio6), Bio8: mean temperature of wettest quarter, Bio9: mean temperature of driest quarter, Bio10: mean temperature of warmest quarter, Bio11: mean temperature of coldest quarter, Bio12: annual precipitation, Bio13: precipitation of wettest month, Bio14: precipitation of driest month, Bio15: precipitation seasonality (coefficient of variation), Bio16: precipitation of wettest quarter, Bio17: precipitation of driest quarter, Bio18: precipitation of warmest quarter, and Bio19: precipitation of coldest quarter. Additionally, prec: mean precipitation (mm), tavg: mean temperature (°C), tmax: maximum temperature (°C), and tmin: minimum temperature (°C) are also depicted as boundary bioclimatic conditions.
Forests 15 00811 g002
Figure 3. Summary runaway plots (i.e., horizontal bar plots) of omission rate charts as synthetized by the AUC score for different modeling approaches with near-to-present bioclimatic variables. Graphs for (A) P. quadrijuga and (B) P. sericea using various parametric combinations of the MaxEnt algorithm, and graphs for (C) P. quadrijuga and (D) P. sericea using machine learning alternatives. Parametric combinations of the MaxEnt algorithm relied on the optimization of transformations (L: linear, Q: quadratic, H: hinge, P: product, and T: threshold) of the original predictor variables (“feature classes”) using the R package ENMeval [65]. The six supervised machine learning approaches include: RF: Random Forest [69], GBM: Gradient Boosting Modeling [70], Log: Logistic Model [71], BY: Naïve Bayes [72], LDA: Linear Discriminant Analysis [73], and KNN: K-Nearest Neighbors algorithm [74,75]. Red diamonds mark the preferred alternatives according to the AUC in the testing (green horizontal bars).
Forests 15 00811 g003
Figure 4. Presence probability of suitable conditions for the establishment of Polylepis spp. Presence probability (>90%) for: (A) P. quadrijuga with near-to-present bioclimatic variables, (B) P. quadrijuga given predicted bioclimatic scores for the years 2081–2100, (C) P. sericea with near-to-present bioclimatic variables, and (D) P. sericea given predicted bioclimatic scores for the years 2081–2100.
Forests 15 00811 g004
Figure 5. Summarized range shifts of suitable conditions for the establishment of Polylepis spp. across the altitudinal gradient. Presence probability (>90%) for: (A) P. quadrijuga and (B) P. sericea given near-to-present bioclimatic variables (purple distribution) and predicted bioclimatic scores for the years 2081–2100 (green distribution). Dotted lines mark means in each case. While P. quadrijuga may go extinct, the range shift for P. sericea (in (B)) does not indicate the colonization of the leading edge, which is a higher elevation; instead, the lost areas at the lowest edge of the current species distribution are consistent with extinction at the trailing edge (i.e., only purple bars in (B) without overlap with the green bars).
Forests 15 00811 g005
Figure 6. Summarized range shifts of suitable conditions for the establishment of P. sericea. Dark blue shaded areas indicate the potential presence probability (>90%, 8558 km2) of P. sericea given predicted bioclimatic variables for the years 2081–2100, while the surrounding red zone corresponds to lost areas (3504 km2, 29%) from the current distribution (12,062 km2, Figure 4C) as modeled with near-to-present bioclimatic variables. The red areas also correspond to extinction at the trailing edge. The northeast corner of the Eastern Cordillera is currently inhabited by P. quadrijuga (Figure 1 and Figure 4A), and therefore corresponds to a novel suitable habitat for P. sericea.
Forests 15 00811 g006
Figure 7. Presence probability maps including the Thornthwaite aridity index of suitable conditions for the establishment of Polylepis forests. Presence probability (>90%) for (A) P. quadrijuga and (B) P. sericea using near-to-present bioclimatic variables after including Thornthwaite’s aridity index as an ad hoc variable targeting explicit eco-physiological constraints.
Forests 15 00811 g007
Disclaimer/Publisher’s Note: The statements, opinions and data contained in all publications are solely those of the individual author(s) and contributor(s) and not of MDPI and/or the editor(s). MDPI and/or the editor(s) disclaim responsibility for any injury to people or property resulting from any ideas, methods, instructions or products referred to in the content.