Article

Abundance and Species Richness of Lianas in a Karst Seasonal Rainforest: The Influence of Abiotic and Biotic Factors

1
Guangxi Key Laboratory of Plant Conservation and Restoration Ecology in Karst Terrain, Guangxi Institute of Botany, Guangxi Zhuang Autonomous Region and Chinese Academy of Sciences, Guilin 541006, China
2
Nonggang Karst Ecosystem Observation and Research Station of Guangxi, Chongzuo 532499, China
3
Guangxi Youyiguan Forest Ecosystem National Research Station, Pingxiang 532600, China
*
Author to whom correspondence should be addressed.
Forests 2024, 15(6), 1011; https://doi.org/10.3390/f15061011
Submission received: 3 May 2024 / Revised: 31 May 2024 / Accepted: 31 May 2024 / Published: 10 June 2024
(This article belongs to the Special Issue Biodiversity in Forests: Management, Monitoring for Conservation)

Abstract

:
Lianas are a crucial component of karst seasonal rainforests, yet research on them has predominantly focused on non-karst regions. Consequently, their abundance and species richness remain relatively understudied within karst ecosystems. We aimed to document the abundance and species richness of lianas and investigate their relationships with abiotic and biotic factors, based on data from a fully mapped 15 ha plot in a karst seasonal rainforest of Nonggang (SW China). Structural equation models (SEMs) were employed to estimate the path coefficients and variation of dependent variables, enabling a comprehensive analysis of the factors affecting the abundance and species richness of liana. Within the 15 ha plot, a total of 23,819 lianas were identified, encompassing 113 species from 34 families. These lianas constituted 24.16% of the total woody plant density and 33.44% of the species present, but only 4.32% of the total woody plant basal area. Lianas are primarily influenced by abiotic factors, especially elevation and phosphorus (P), with less impact from biotic factors. Our findings reveal that lianas, despite constituting a relatively small percentage of the total woody plant basal area, significantly contribute to the density and diversity of the forest. Notably, abiotic factors such as elevation and phosphorus availability predominantly shape the distribution and richness of lianas, highlighting the importance of these environmental variables. The findings offer valuable insights for future liana studies and the preservation of karst forests’ biodiversity.

1. Introduction

Lianas (woody plants) are an abundant and diverse polyphyletic group in tropical forests [1,2,3]. They typically account for 25% of rooted woody stems and up to 35% of woody plant species in tropical ecosystems [3,4], enhancing forest canopy connectivity and providing essential resources for tropical fauna [5]. However, lianas also engage in fierce competition with trees for resources, potentially affecting vital ecological processes such as regeneration, tree reproduction, and carbon sequestration [6,7,8,9,10,11,12].
In recent decades, the expansion of lianas has emerged as a prominent change in tropical forests [7]; moreover, under future climate change, prolonged dry seasons are believed to be even more favorable for the growth and expansion of lianas. Therefore, an in-depth comprehension investigation of lianas is crucial for accurate forecasting of their impact on forest areas and ecological processes. This knowledge also contributes to evaluating the ecology of liana communities and elucidating the factors driving their abundance and species richness within the forest.
The species richness and abundance of woody lianas are intricately linked to abiotic factors, including rainfall, seasonal patterns, soil types, topographic conditions, and disturbance regimes [2]. Topography, in particular, plays a pivotal role in determining resource availability, including water, soil nutrients, and light. This, coupled with natural disturbances that create gaps in the forest canopy, can significantly influence the species richness and regeneration of lianas [13]. For instance, in the Okinawa (SW Japan) forest, the distribution and abundance of lianas are strongly affected by topographic variations, and lianas tend to be distributed in sites with more water and nutrients [14]. Elevation, in particular, has been shown to explain liana species composition in tropical forests [15,16] and is negatively correlated with liana species richness and abundance in other forests [17,18,19]. Gerolamo et al. [20] further demonstrated that the taxonomic species richness of lianas in the Brazilian Amazon increases along hydro-edaphic gradients.
Studies conducted in Barro Colorado Island and the Penang Hill Forest Reserve in Malaysia reveal significant differences in liana densities and species richness across topographic habitats [18,19,20,21]. In Barro Colorado Island, for instance, liana densities were notably higher in the seasonally drier lower plateau habitat compared to the moister slope habitat. Similarly, the Penang Hill Forest Reserve exhibited the highest liana species richness in slope habitats, suggesting a negative association. These findings underscore the potential of topography as a predictor of local variations in liana abundance and composition, albeit with underlying mechanisms that remain elusive. Soil nutrients are particularly crucial for lianas, as they support their inherently rapid growth rates. A study conducted in Argentina discovered a significant increase in both liana diversity and abundance with higher soil phosphorus (P) concentrations [22]. Liu et al. [23] found soil pH and P were strongly correlated and were drivers of liana species distributions, yet most liana species prefer soils that were fertile for N and K in Xishuangbanna (SW China).
Besides abiotic factors, biotic factors also affect the species richness and abundance of lianas in forests [24,25,26]. Since lianas rely on external support from trees for climbing, the size (diameter at breast height or DBH), species richness, and abundance of potential host trees play a role in determining which trees are colonized by lianas [24]. Research indicates that lianas are more abundant on larger host trees and less prevalent in areas with high tree densities [27].
Karst landscapes, encompassing approximately 15%–20% of the Earth’s ice-free land surface, are particularly significant in southwest China, boasting the world’s largest concentrated karst area, intense karst development, and complex landscape types. Tropical karst seasonal rainforests, unique globally, represent one of the most remarkable forest types [28,29]. However, fundamental research on this ecosystem lags behind that of other ecosystems. Guo et al. [30] revealed that topographic and neutral processes jointly contribute to species composition maintenance in the Nonggang tropical karst seasonal rainforest, with their relative importance varying across spatial scales.
In this study, we conducted a census of lianas in a 15 ha plot in southwest China’s Nonggang region, a topographically heterogeneous area and one of the world’s 36 key biodiversity hotspots [31]. We quantified the abundance, species richness, and distribution of all lianas (≥1 cm diameter) rooted in the Nonggang 15 ha forest dynamics plot. This dataset allows us to address the following questions: (a) What is the contribution of lianas to the overall forest diversity in the Nonggang 15 ha plot? (b) How do abiotic factors, particularly topography and soil, influence the species richness and abundance of lianas in the Nonggang 15 ha plot? (c) How do biotic factors, particularly trees, affect the species richness and abundance of lianas in the Nonggang 15 ha plot?

2. Materials and Methods

2.1. Study Site

The research was conducted in the Nonggang National Natural Reserve, spanning an area of approximately 10,077.5 ha in the Guangxi Zhuang Autonomous Region, southwest China (22°13′56″–22°33′09″ N, 106°42′28″–107°04′54″ E). Characterized by a tropical monsoon climate, the region has a mean annual temperature of 22 °C and an annual precipitation ranging from 1150 to 1550 mm, with 76% concentrated between May and September [32,33]. This is virgin forest and has not been subjected to human interference over ca. hundred years. Topographically, this forest is characterized by a typical karst Fengcong depression (“tower” and “cockpit”), which is composed of a plurality of mountain peaks and depressions (valleys) with altitudes ranging from 150 to 600 m [34]. The vegetation type of the Nonggang reserve is northern tropical karst seasonal rainforest, preserving abundant karst endemic tree species, such as Excentrodendron tonkinense (A. Chev.) H. T. Chang & R. H. Miao, Cephalomappa sinensis (Chun & F. C. How) Kosterm., Horsfieldia kingii (Hook. f.) Warb., Parashorea chinensis H. Wang, Deutzianthus tonkinensis Gagnep., Sinosideroxylon pedunculatum (Hemsl.) H. Chuang, and Pistacia weinmanniifolia J. Poiss. ex Franch., among others [34,35].

2.2. Plot Establishment and Data Collection

Between May 2010 and October 2011, a 15 ha (500 m × 300 m) plot was established as a node of the CForBio (Chinese Forest Biodiversity Monitoring Network), aimed at monitoring long-term ecological dynamics in a northern tropical karst seasonal rainforest [30]. This plot, characterized by rugged terrain, boasts altitudes ranging from 180 to 370 m above sea level, with 10-m cell slopes varying from 3.7 to 78.9 degrees. Following standard field procedures of the Center for Tropical Forest Science [36], all woody stems with a diameter at breast height (DBH) of ≥1 cm were mapped, measured, identified to species level, and tagged.
In August 2020 and January 2021, a comprehensive census of all lianas with a diameter of ≥1 cm was conducted, utilizing census methods described by Schnitzer [37,38] and Gerwing [39]. Liana stem diameters were measured 1.3 m from the rooting point, and the rooting point of each liana was mapped using the existing 375 grid markers (20 m × 20 m) for precise location recording. Each separately rooted liana, not connected above ground to others, was considered a genetically distinct individual. Root positioning refers to the last grounding point before ascending to the canopy, as lianas can root in multiple locations. The census included all liana species with woody or fibrous perennial stems, such as Smilax and Dioscorea [37,39]. With reference to the geographical coordinates of nearby trees, the liana location was expedited and enhanced in accuracy. Field identification, relying on stem and leaf characteristics, enabled species-level identification for 99.11% (23,609 individuals). The remaining 0.89% (210 individuals) remained unidentified due to leaf unavailability for confirmation.
Following Harms et al. [40] and Valencia et al. [41], four topographical covariates were obtained: elevation, slope, convexity, and aspect. These variables were derived from professional survey data estimated at each 10 m × 10 m grid point. Soil cover was surveyed in 2014, with each 10 m × 10 m quadrat divided into four 5 m × 5 m sub-quadrats for detailed analysis. Two observers, familiar with the terrain from previous censuses, visually assessed soil cover in 6000 sub-quadrats, and their averages were taken as the representative value for each sub-quadrat. The four sub-quadrats were then averaged to represent the soil cover of each 10 m × 10 m quadrat. Additionally, two hydrological covariates, topographical wetness index (TWI) and altitude above channel (ACHAN), were selected to quantify topographical control on hydrological processes. In 2022, soil samples were collected from 375 points across the 15 ha plot, following a regular 20 m × 20 m grid. Soil moisture content, bulk density, and various physical and chemical properties were analyzed.
All woody stems with a DBH of ≥1 cm were initially mapped, measured, identified, and tagged in 2011, with subsequent reassessments every five years. The most recent survey was completed in 2021. Abundance (Ab_tree), species richness (SR_tree), and the coefficient of variation of DBH (cvdbh_tree) were calculated for all trees within a 20 m × 20 m grid across the 15 ha plot.

2.3. Data Analysis

We thoroughly summarized the data pertaining to trees and lianas, encompassing the number of families, genera, stems, basal diameter area, and the average diameter at breast height (DBH). We further calculated metrics such as species richness, Fisher’s alpha, Shannon diversity index, dominance, and evenness for both lianas and trees across all stems.
We calculated the density of all rooted stems (stem density), the total liana basal area (total BA), the mean liana basal area (mean dbh), relative density (rel.den), relative dominance (rel.dom), relative frequency (rel.fre), and the importance value index (IV) for each species in the liana community within the 15 ha plot. The importance value index (IV) is a comprehensive measure that combines three key ecological metrics: relative dominance, relative frequency, and relative density. It is calculated using the formula:
IV = (relative dominance + relative frequency + relative density)/3 × 100%.
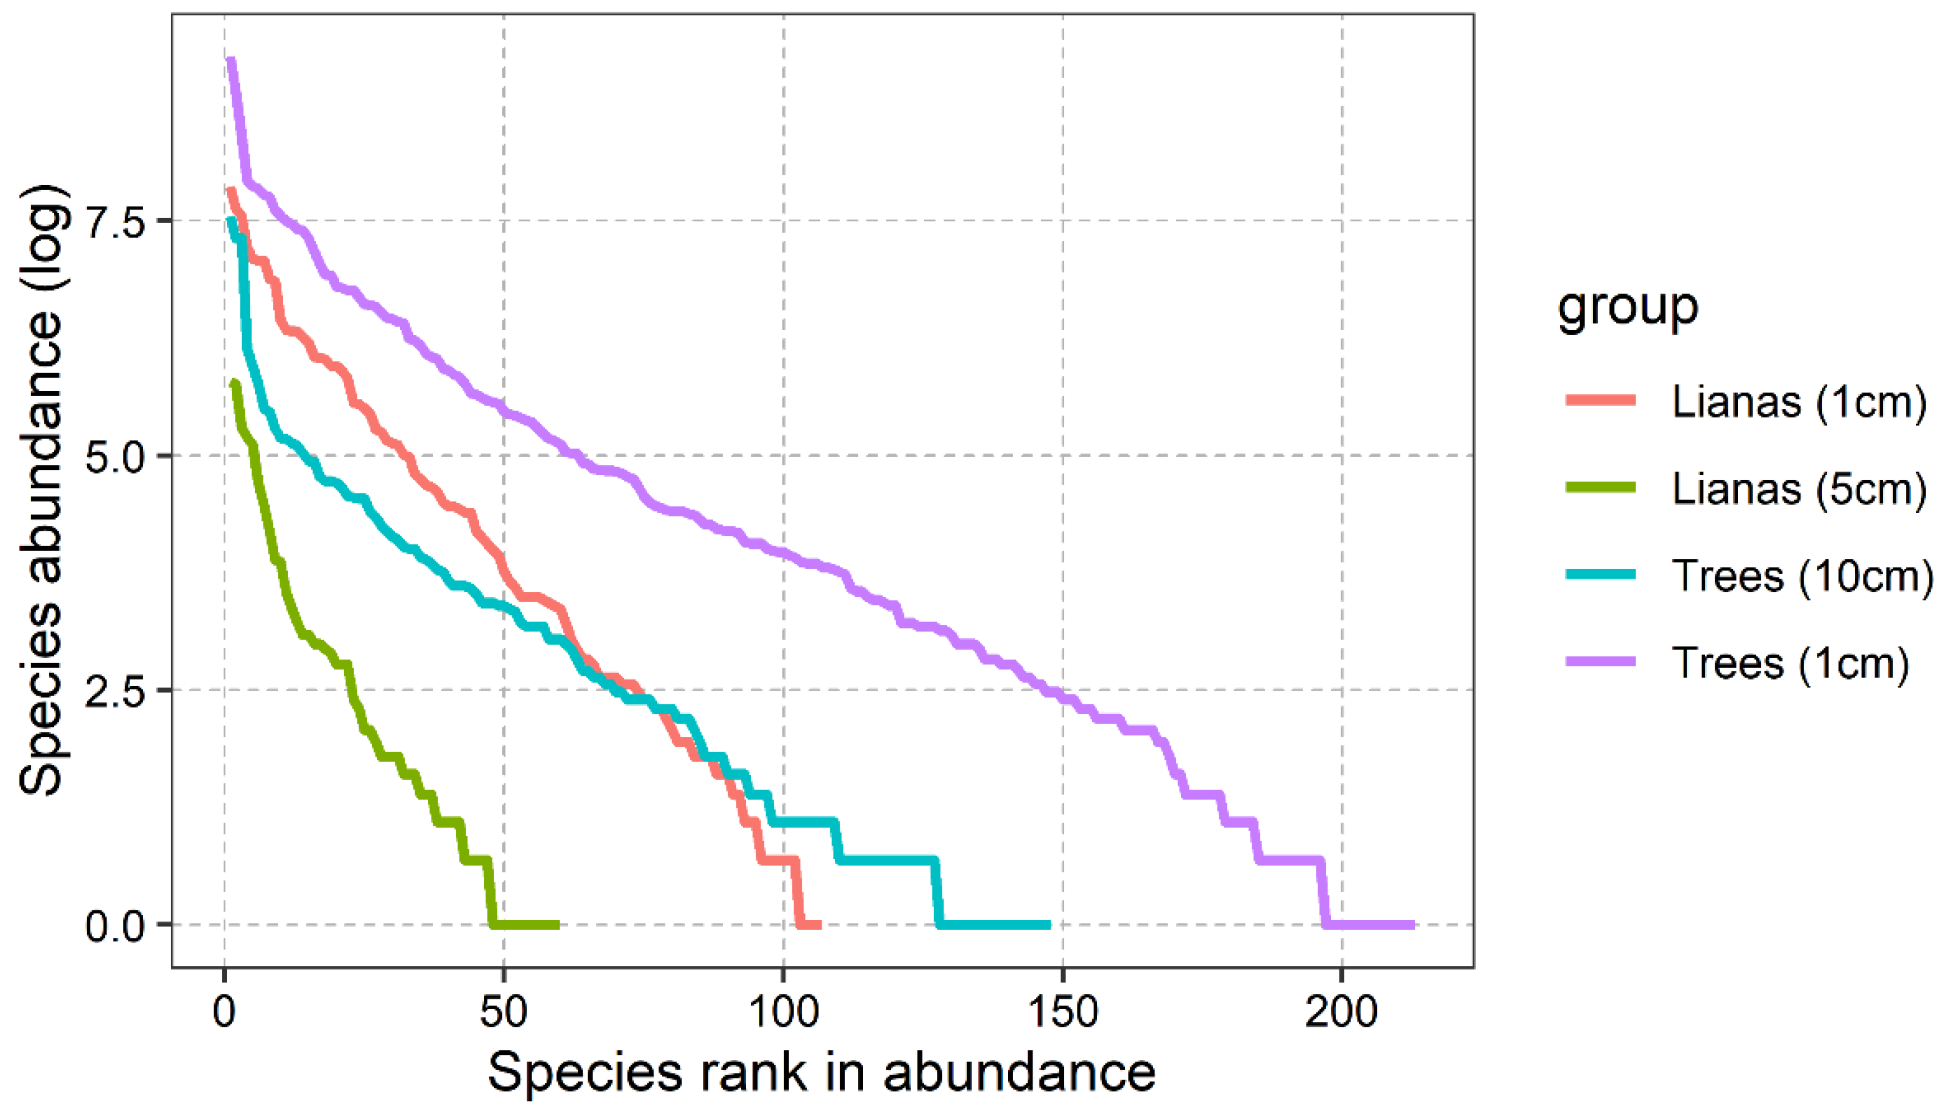
To compare the relative abundance patterns, we initially crafted frequency distributions of the log-transformed species counts within varying abundance classes for both lianas and trees. Subsequently, we plotted rank abundance curves, utilizing the log relative abundance of species on the y-axis and species rank abundance on the x-axis.
To gain insights into liana species–area relationships, we analyzed the entire 500 m × 300 m plot by calculating the mean liana species richness within 100 randomly selected rectangular quadrats, each with a length-to-width ratio of 5:3 and sizes ranging from 375 m2 to 135,375 m2. We utilized 20 distinct quadrat size classes and calculated the mean species richness for each replicate quadrat within each size class. We also investigated liana accumulation patterns for two distinct minimum diameter size classes (≥1 cm, ≥5 cm). By comparing the species–area curves for these two size classes in both lianas and trees, we were able to assess species accumulation patterns in relation to the sampled area across different growth forms.
To analyze the distribution of lianas in relation to abiotic and biotic factors, we employed a generalized linear model (GLM). Specifically, we quantified the number of lianas or species richness in each 20 m × 20 m quadrat, using this as the response variable in our model. The explanatory variables encompassed the interactions between various abiotic factors—including mean elevation, slope, aspect, convexity, soil cover, TWI, ACH, and a comprehensive index for soil physical and chemical properties—and biotic factors, such as the abundance of trees (Ab_tree), species richness of trees (SR_tree), and the coefficient of variation of diameter at breast height of trees (cvdbh_tree). We considered both linear and quadratic terms for these factors to capture potential non-linear relationships. We fit the model using a Poisson distribution, which is suitable for count data, and a log link function to linearize the relationship between the predictors and the response variable. This methodology allowed us to comprehensively assess the effects of abiotic and biotic factors on the distribution of lianas, using principal component analysis (PCA) to evaluate the relationships between abiotic factors and their contributions to the first two principal components.
One of the primary objectives of this study was to explore the causal relationships between abiotic environmental factors, the neighborhood composition of trees, and lianas. To this end, we leveraged structural equation models (SEMs) to estimate the path coefficients and variations in dependent variables; when characterizing abiotic factors, the first two axes of PCA are utilized. Our hypothesis was that abiotic environmental factors initially influence biotic factors, subsequently affecting the abundance and diversity of lianas. However, we also tested the direct impact of abiotic environmental factors on lianas by incorporating direct pathways into the SEMs. The model was implemented using the R piecewiseSEM package, version 2.3.0 [42]. All of these analyses were implemented in R version 4.0.3 [43].

3. Results

3.1. Diversity Estimates and Liana Species–Area Accumulation Curves

The NG 15 ha plot encompassed a total of 23,819 separately rooted liana stems with diameters ≥1 cm, corresponding to a density of 1587.93 lianas per hectare (Figure 1). Among these, only 88 were principal stems with diameters ≥10 cm, representing less than 0.5% of the total and a density of 5.87 large lianas per hectare. The three largest liana stems, identified as Tetrastigma planicaule (Hook.) Gagnep. (Vitaceae), Phanera championii Benth. (Fabaceae), and Artabotrys hongkongensis Hance (Annonaceae), measured 19.2 cm, 17.4 cm, and 16.0 cm in diameter, respectively. The total basal area of liana principal stems with diameters ≥1 cm amounted to 16.48 m2 (1.10 m2 per hectare). As expected, the density of liana principal stems decreased with increasing diameter size classes, with the smaller size classes comprising the majority of all stems (Table 1).
Within the NG 15 ha plot, a total of 113 liana species from 34 families were recorded (Table 2). In comparison, the 2011 census identified 223 tree species belonging to 56 families. The four most dominant liana families were Annonaceae, Apocynaceae, Fabaceae, and Vitaceae. Fifteen plant families had only one liana species represented, while six plant families had only two (Table 2). The most abundant liana species was Uvaria tonkinensis Finet & Gagnep. (Annonaceae), accounting for 10.97% of all stems. A. hongkongensis (Annonaceae) and Rhaphidophora hongkongensis Schott (Araceae) followed closely, comprising 8.69% and 7.96% of all stems, respectively. However, based on the importance value index, A. hongkongensis, U. tonkinensis, and P. championii ranked highest, with values of 8.92, 7.69, and 7.11, respectively. Nine abundant species collectively contributed to nearly half (56.54%) of the total stem density and 63.30% of the total stem basal area. Conversely, seven species, representing 48.43% of the total stem density, had fewer than 1000 individuals, while 76 species (7.88% of all species) were represented by less than 100 individuals across the entire 15 ha area. Liana dominance hierarchies changed slightly in the larger size classes, with U. tonkinensis (Annonaceae) being the most abundant species in the ≥2 cm and <5 cm diameter size classes, while A. hongkongensis (Annonaceae) and Tetrastigma kwangsiense C. L. Li (Vitaceae) being the second most abundant liana species in these larger size classes, respectively.
In the context of all woody plants (lianas and trees ≥1 cm diameter), lianas contributed significantly to the overall diversity and structure of the NG 15 ha plot. Specifically, lianas accounted for 24.16% of total woody plant density and 34.66% of the species, but only 4.32% of the total woody plant basal area (Table 3). Compared to trees, liana stems were generally smaller, and their frequency declined more rapidly with increasing diameter. The Shannon diversity index indicated that liana species richness was slightly lower than that of trees, likely due to the lower species richness balanced by higher evenness among liana species (Table 3). When we disregard the beginning of the curve, which is influenced by a few very abundant tree species, the remaining portion of the abundance distribution curve for trees has a lower slope compared to that of lianas. This indicates that lianas, on average, have a higher abundance in the lower ranks compared to trees (Figure 2).

3.2. Liana Species–Area Patterns

Across the 15 ha plot, the mean liana richness was 7.53 species per hectare based on 100 m × 100 m plots. Liana species richness increased rapidly, reaching approximately 85 species at 5 ha, and then gradually increased up to 15 ha (Figure 3). Notably, around 80% of the species were captured within the first 5 ha; however, species accumulation continued even at the maximum plot size of 15 ha, suggesting that rarer species would likely continue to be discovered with larger sampling areas. The pattern of liana species accumulation was similar for both size classes (≥1 cm and ≥5 cm diameter), although the species richness of the larger size class (≥5 cm) was approximately half that of the smaller size class (≥1 cm). Species accumulation curves for trees and lianas followed comparable trajectories (Figure 3).

3.3. Abiotic and Biotic Drivers of Liana Diversity across the NG 15 ha Plot

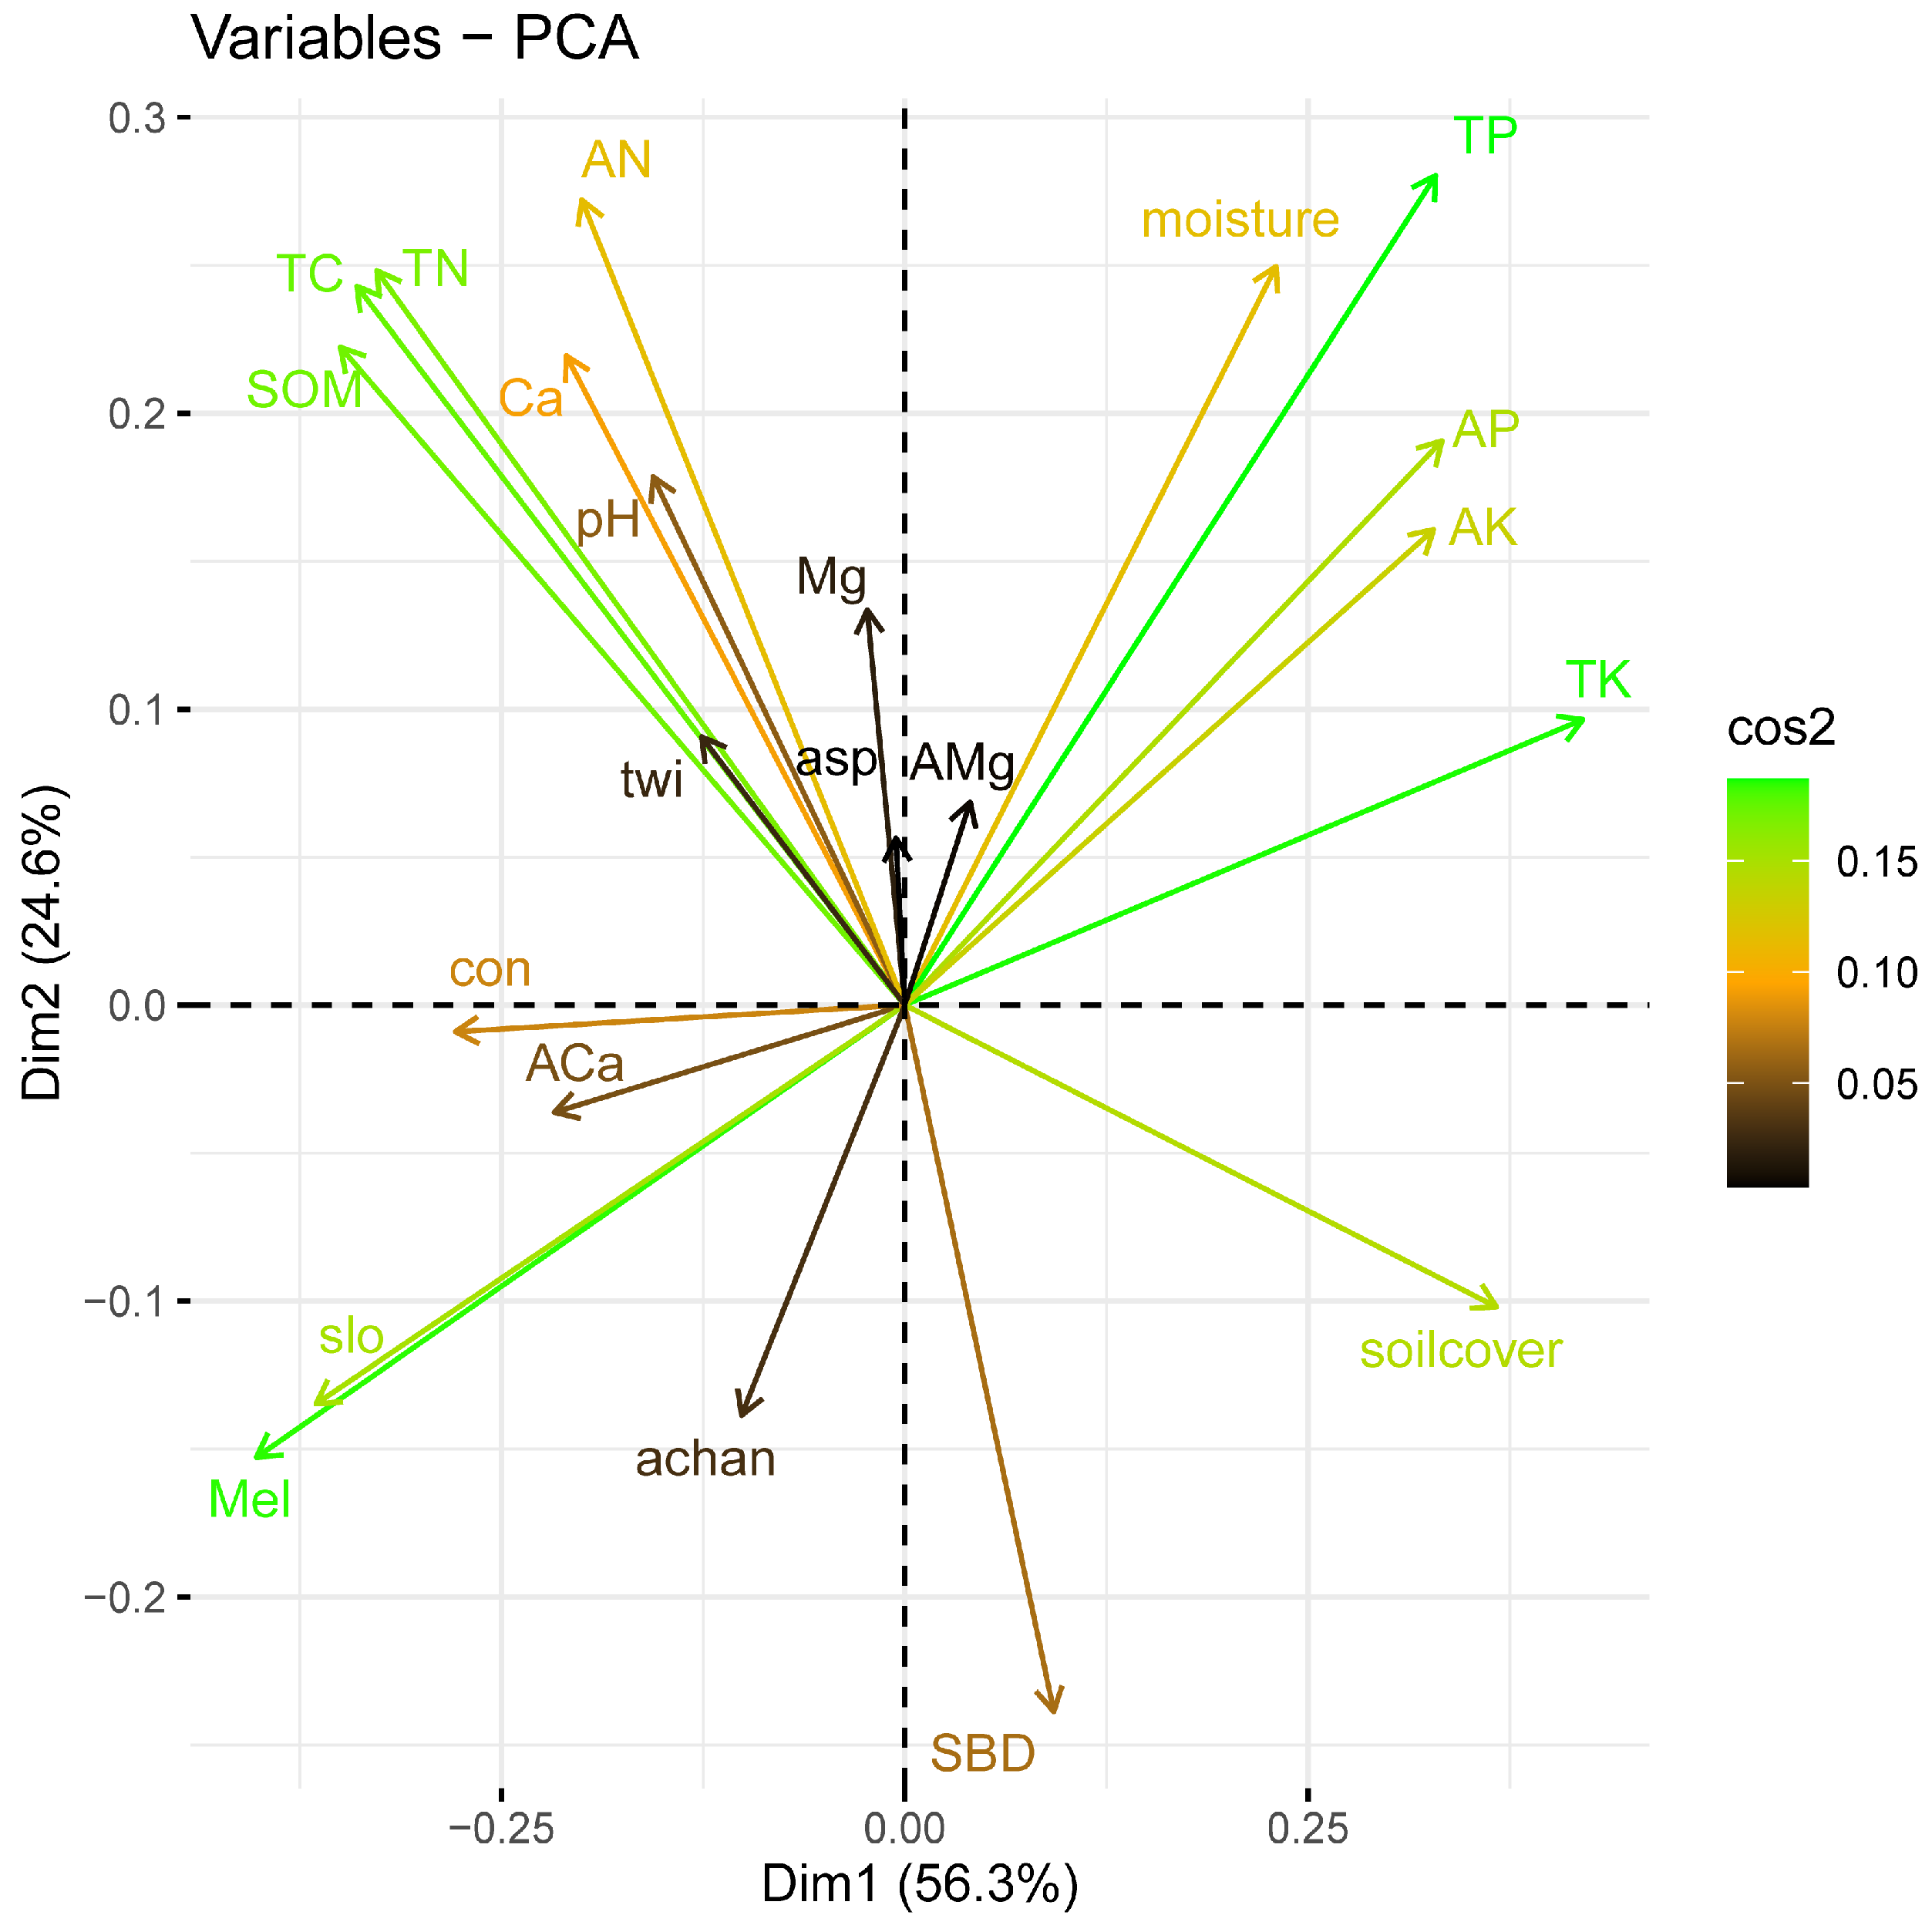
Principal component analysis (PCA) revealed strong collinearity among the various abiotic factors (Figure A1 in Appendix A), The first principal component was closely associated with elevation, total potassium, soil cover, and slope, while the second principal component was closely associated with total phosphorus, total carbon, and total nitrogen. In terms of contribution, abiotic factors accounted for 56.30% and 24.60% of the variance in the first and second principal components, respectively, resulting in a cumulative contribution of 80.90%. Based on the PCA results, only three topographic factors (elevation, slope, and soil cover) and four soil factors (total carbon (TC), total nitrogen (TN), total phosphorus (TP), and total potassium (TK)) were included in subsequent analyses.
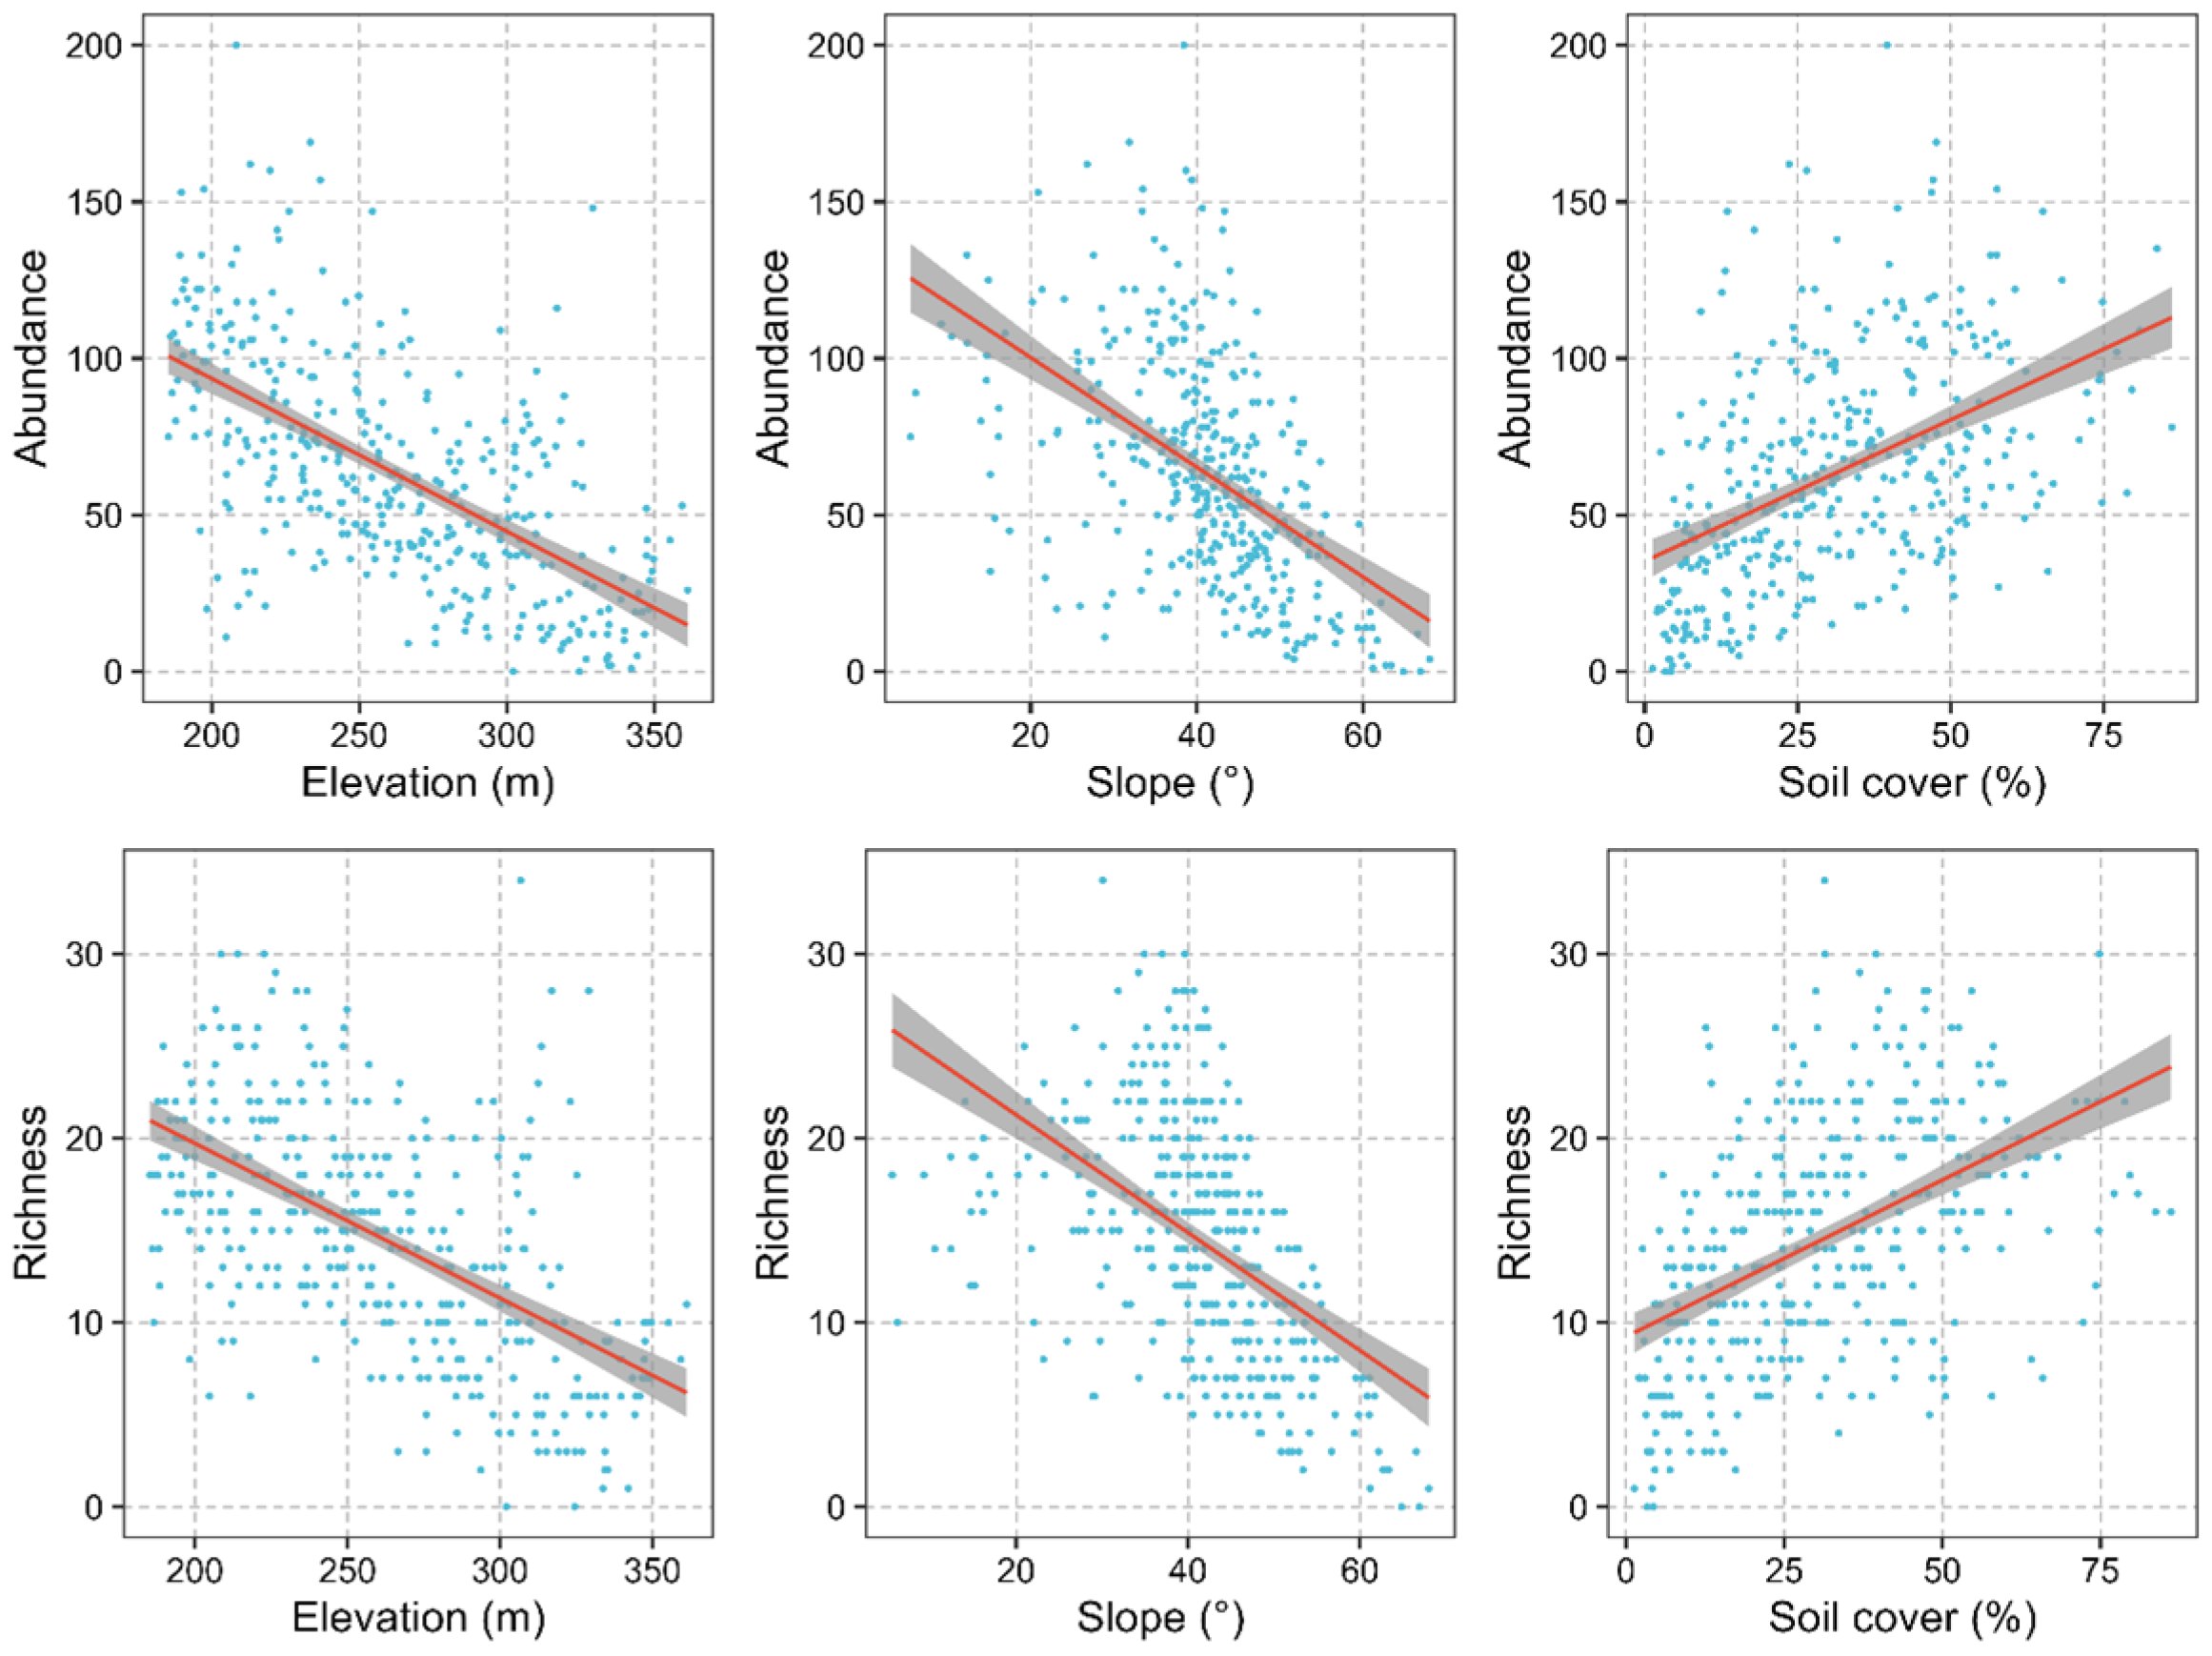
Regression analysis revealed that both the richness and abundance of lianas varied significantly with abiotic factors. Specifically, liana abundance and richness were negatively correlated with elevation and slope. As elevation and slope increased, the abundance and richness of lianas decreased. Lianas were primarily distributed on slopes of around 40 degrees (Figure 4). In contrast, liana species richness and abundance were positively correlated with soil cover (Figure 4).
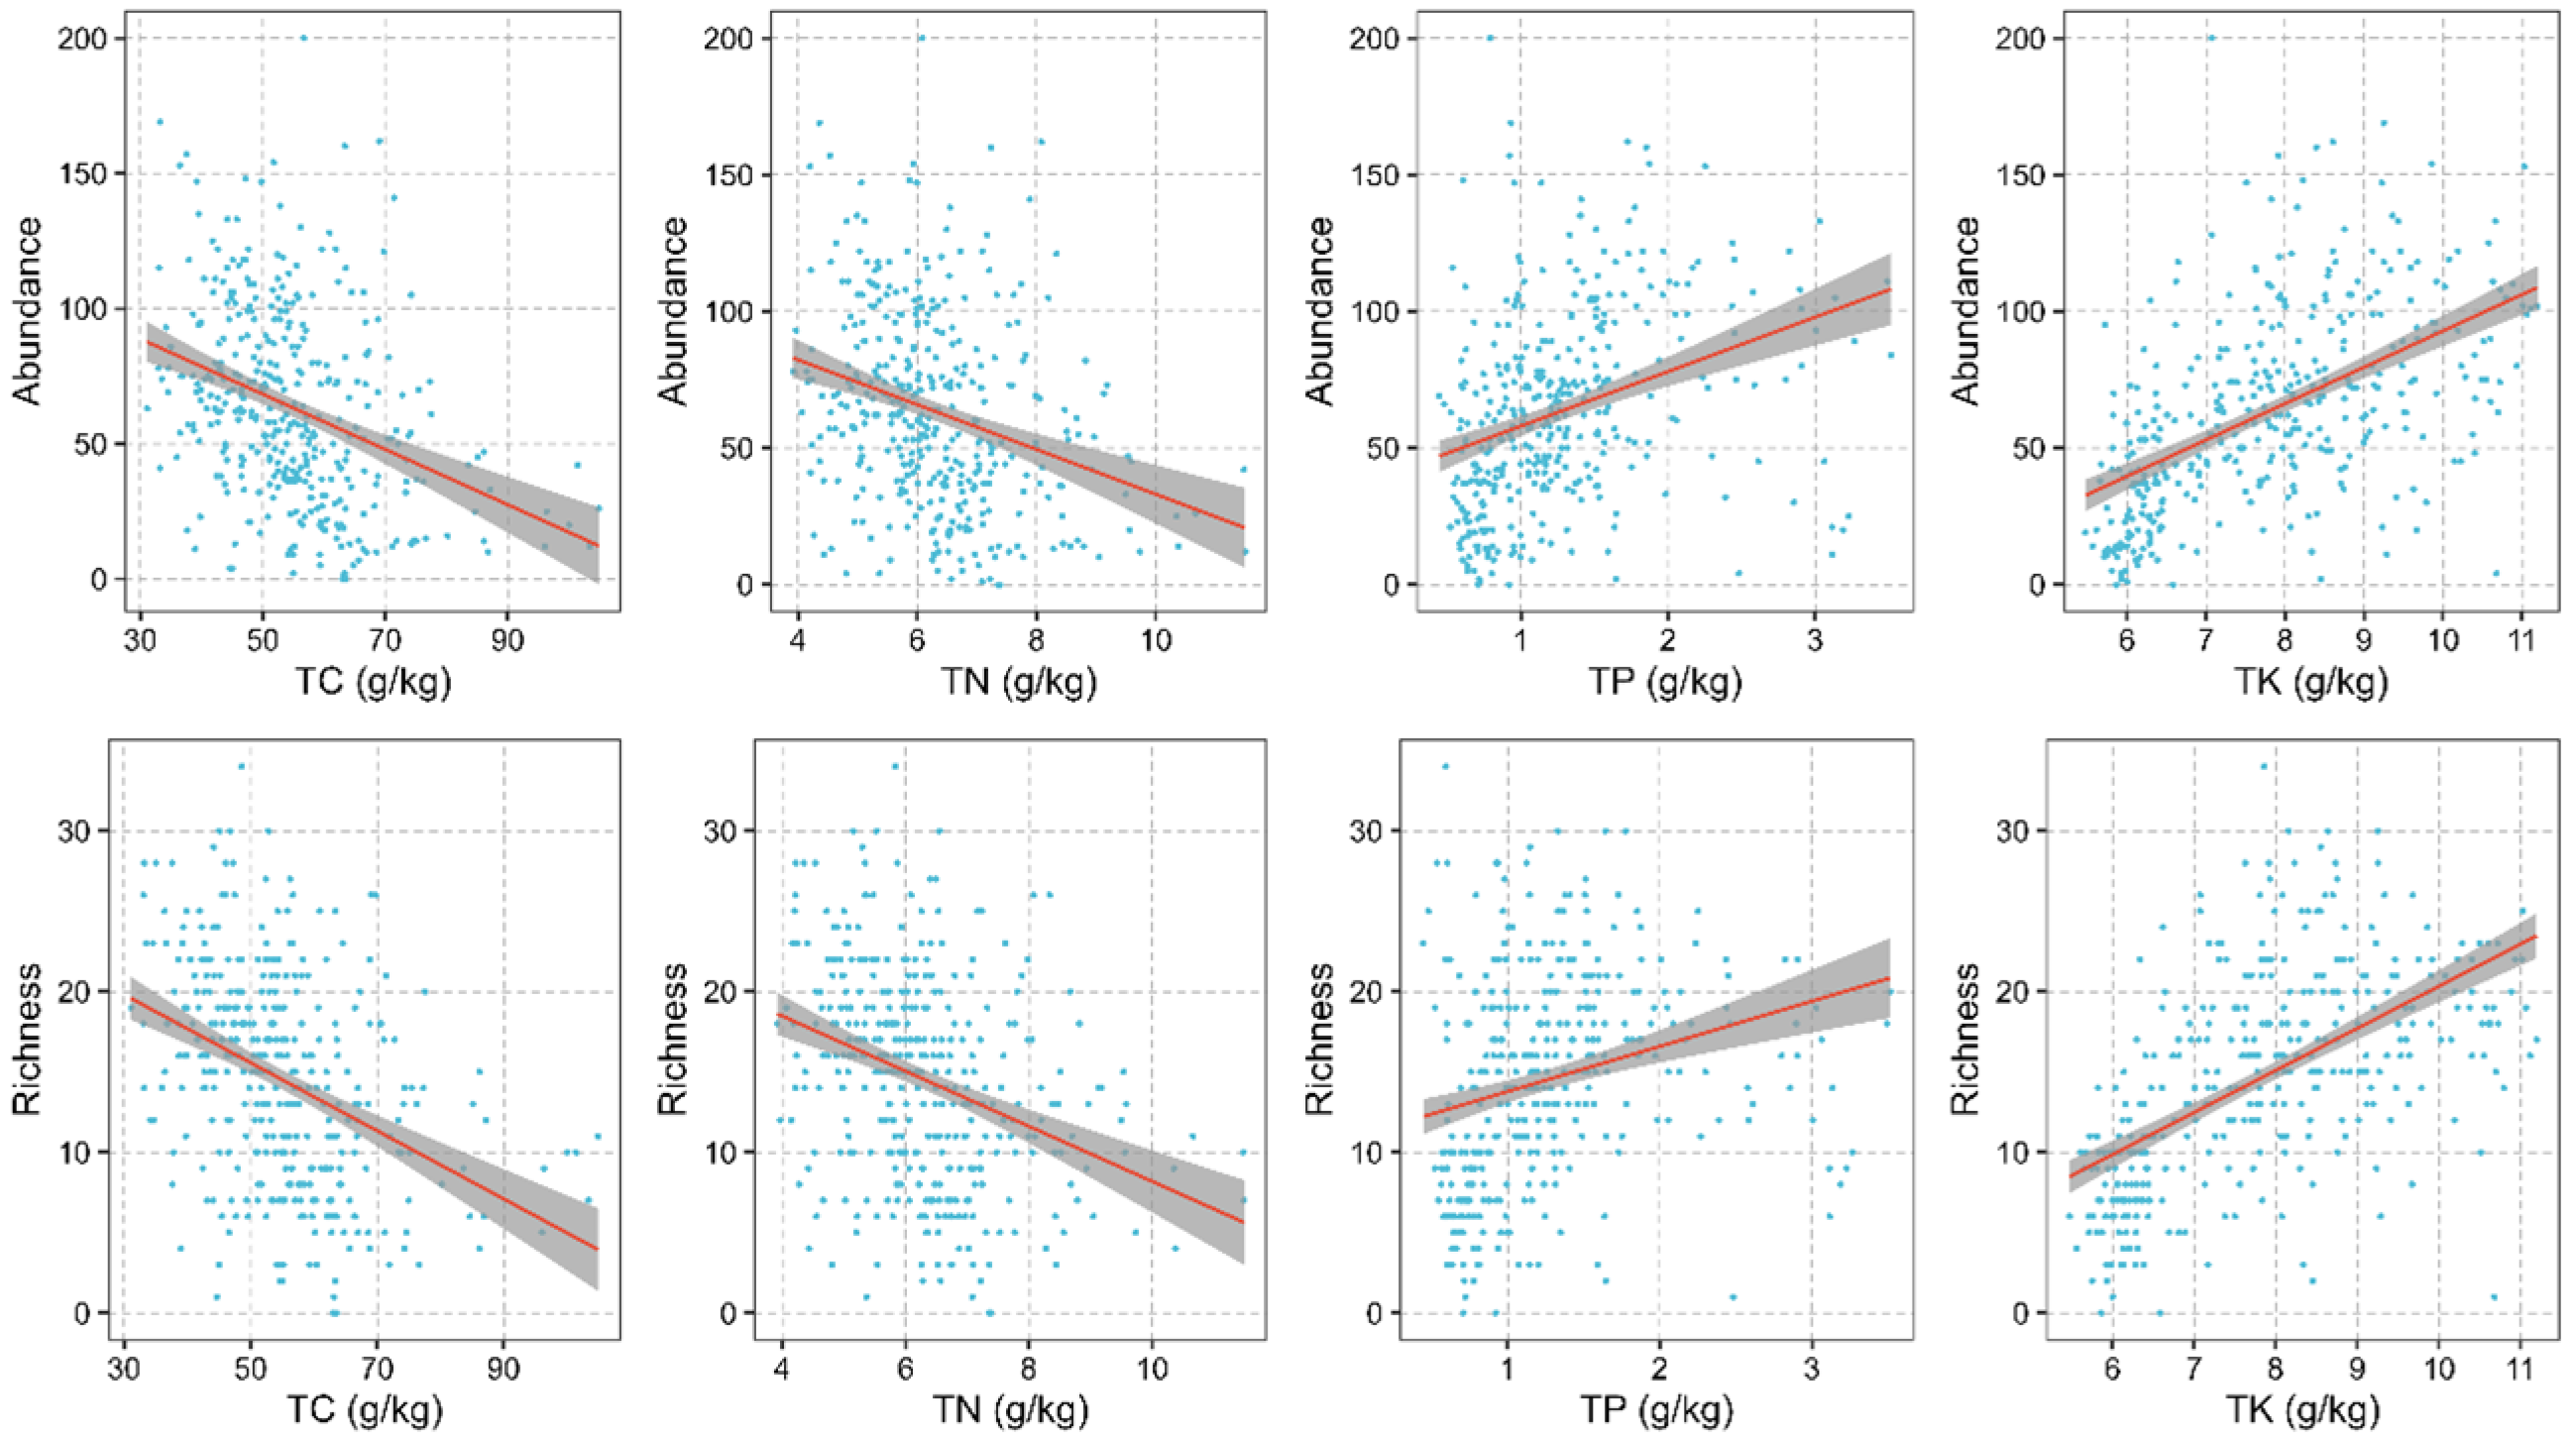
Additionally, liana abundance and richness were negatively associated with TC and TN (Figure 5). As the concentrations of TC and TN increased, the abundance and richness of lianas declined. Conversely, liana species richness and abundance were positively correlated with TP and TK.
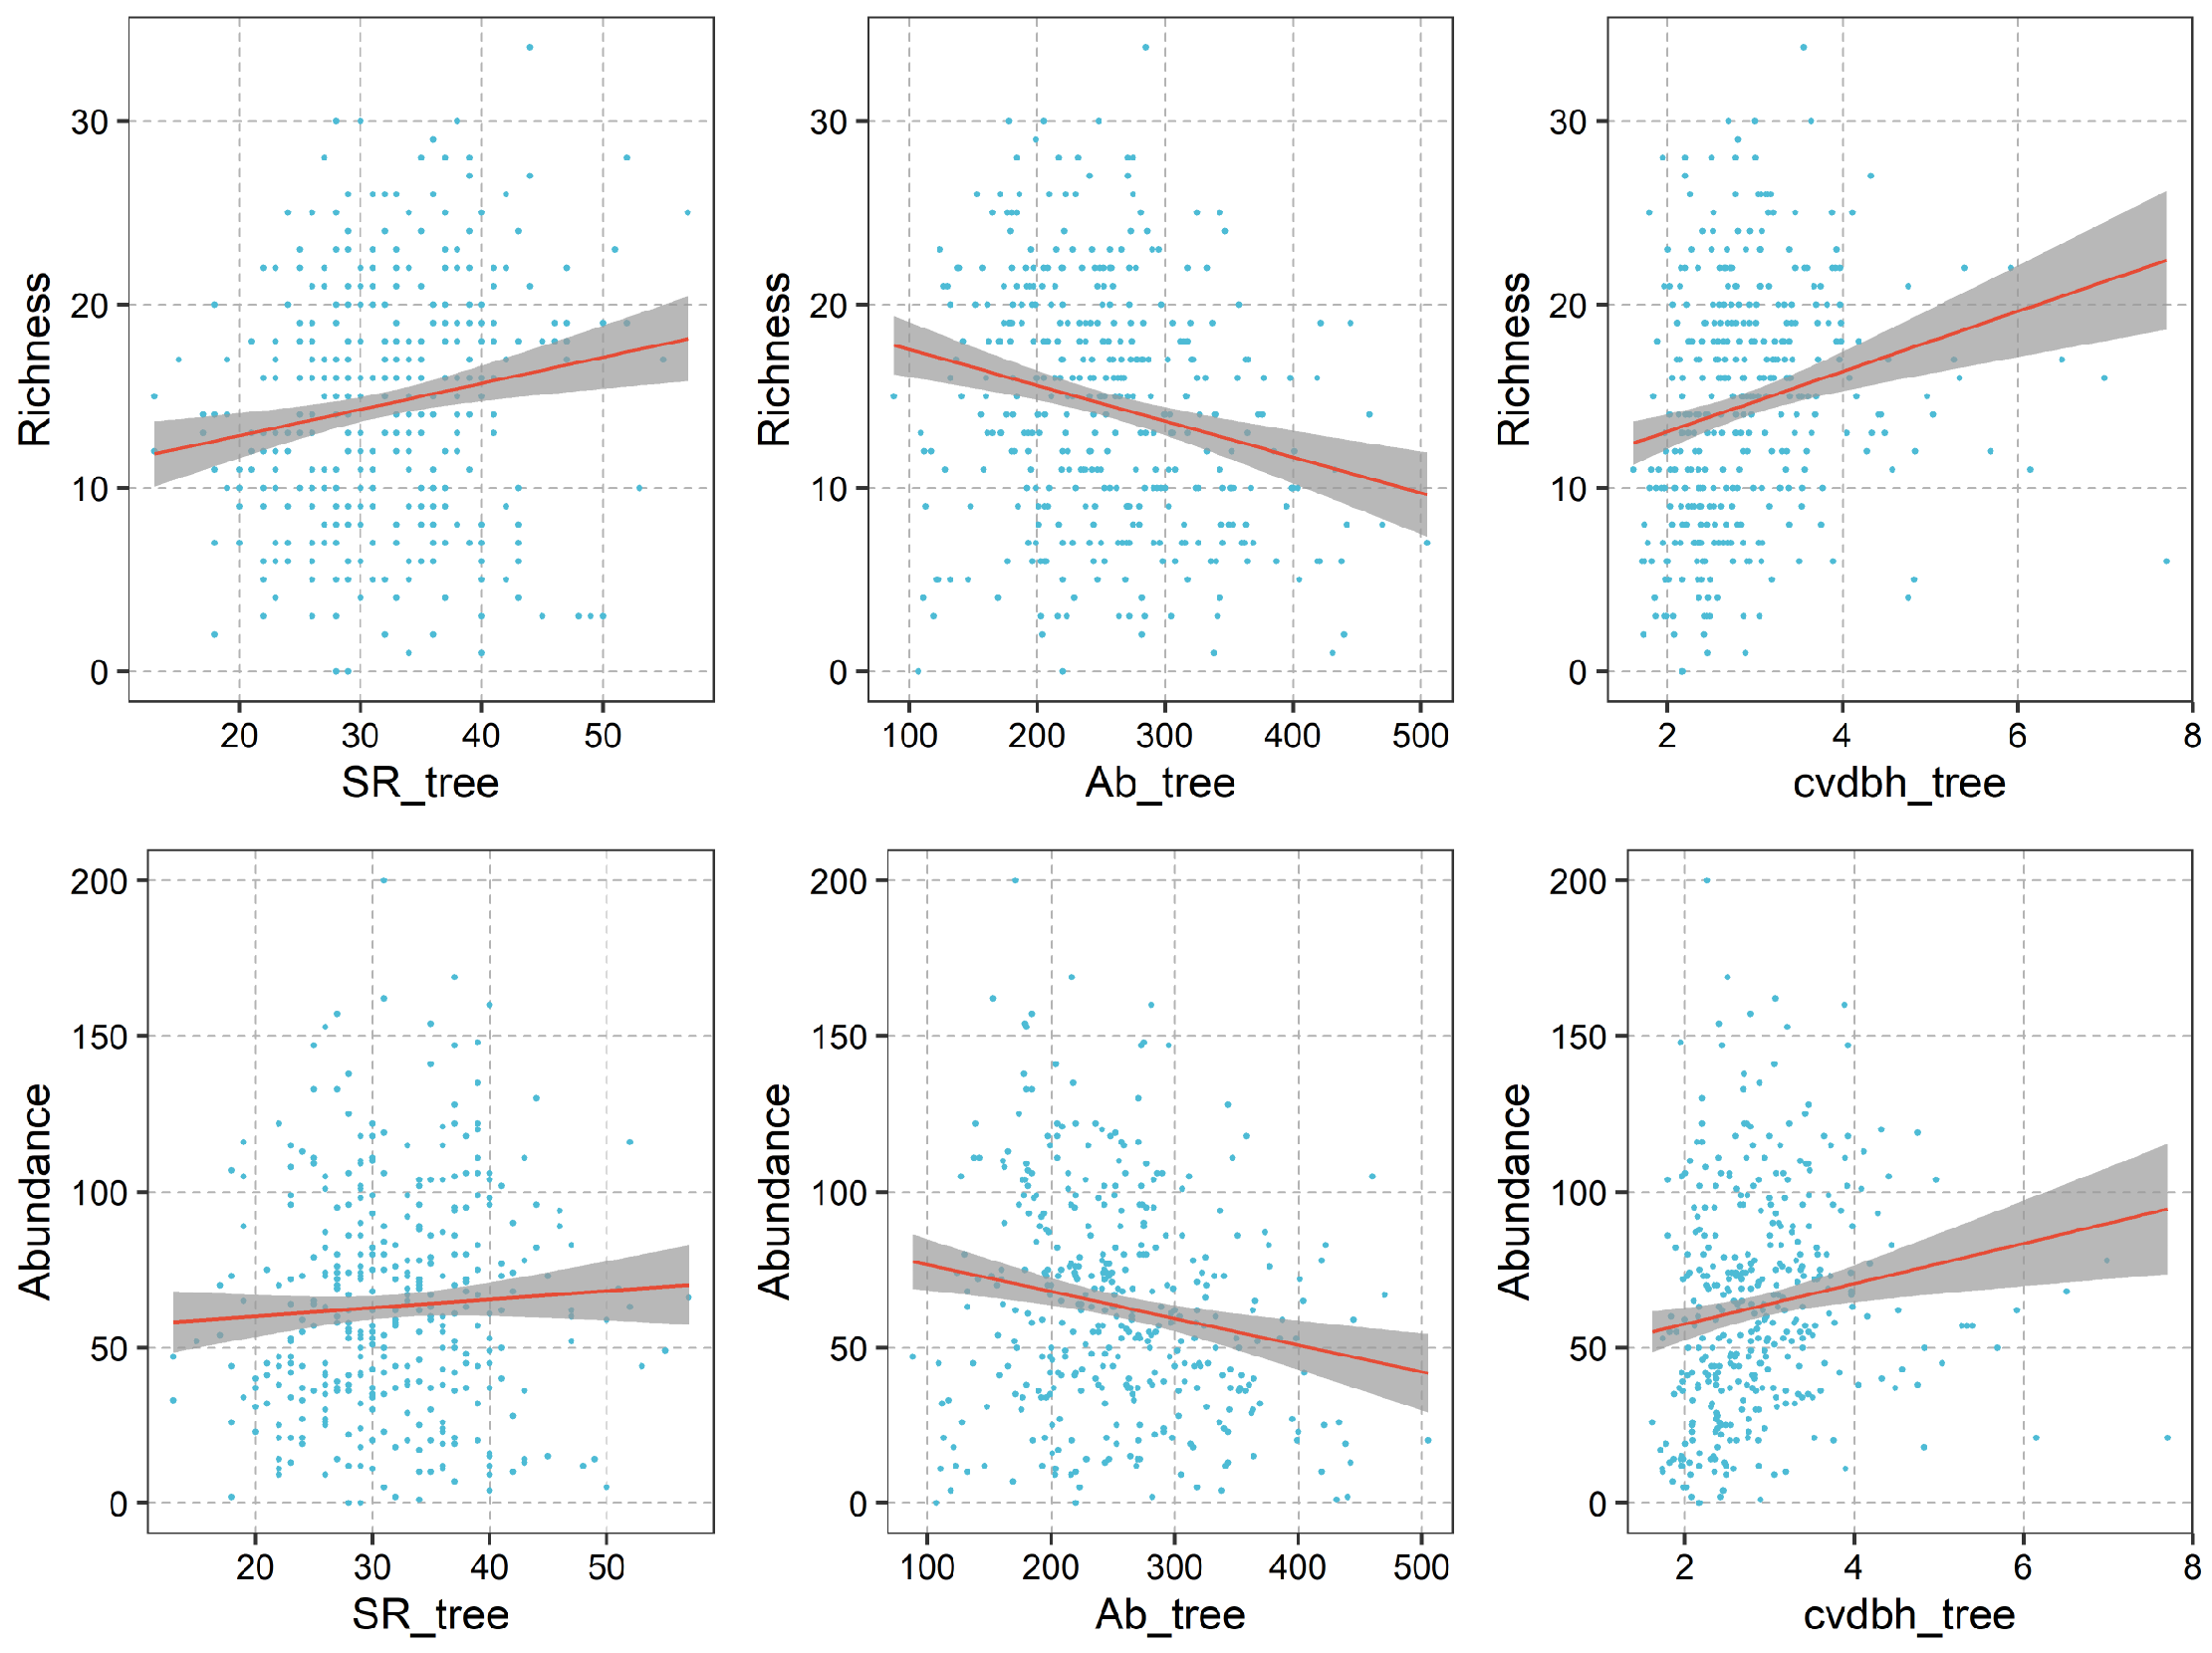
The abundance and richness of lianas in the NG 15 ha plot exhibited complex relationships with both abiotic and biotic factors. Both liana abundance and richness curves were negatively correlated with tree abundance, indicating that areas with a higher density of trees tend to have fewer and less diverse lianas (Figure 6). In contrast, liana species richness and abundance were positively associated with tree species richness, suggesting that a more diverse tree community may support a more diverse liana community. Furthermore, liana abundance and richness were positively correlated with the coefficient of variation of diameter at breast height (DBH) among trees, indicating that forests with a greater variation in tree size may harbor more abundant and diverse lianas (Figure 6).
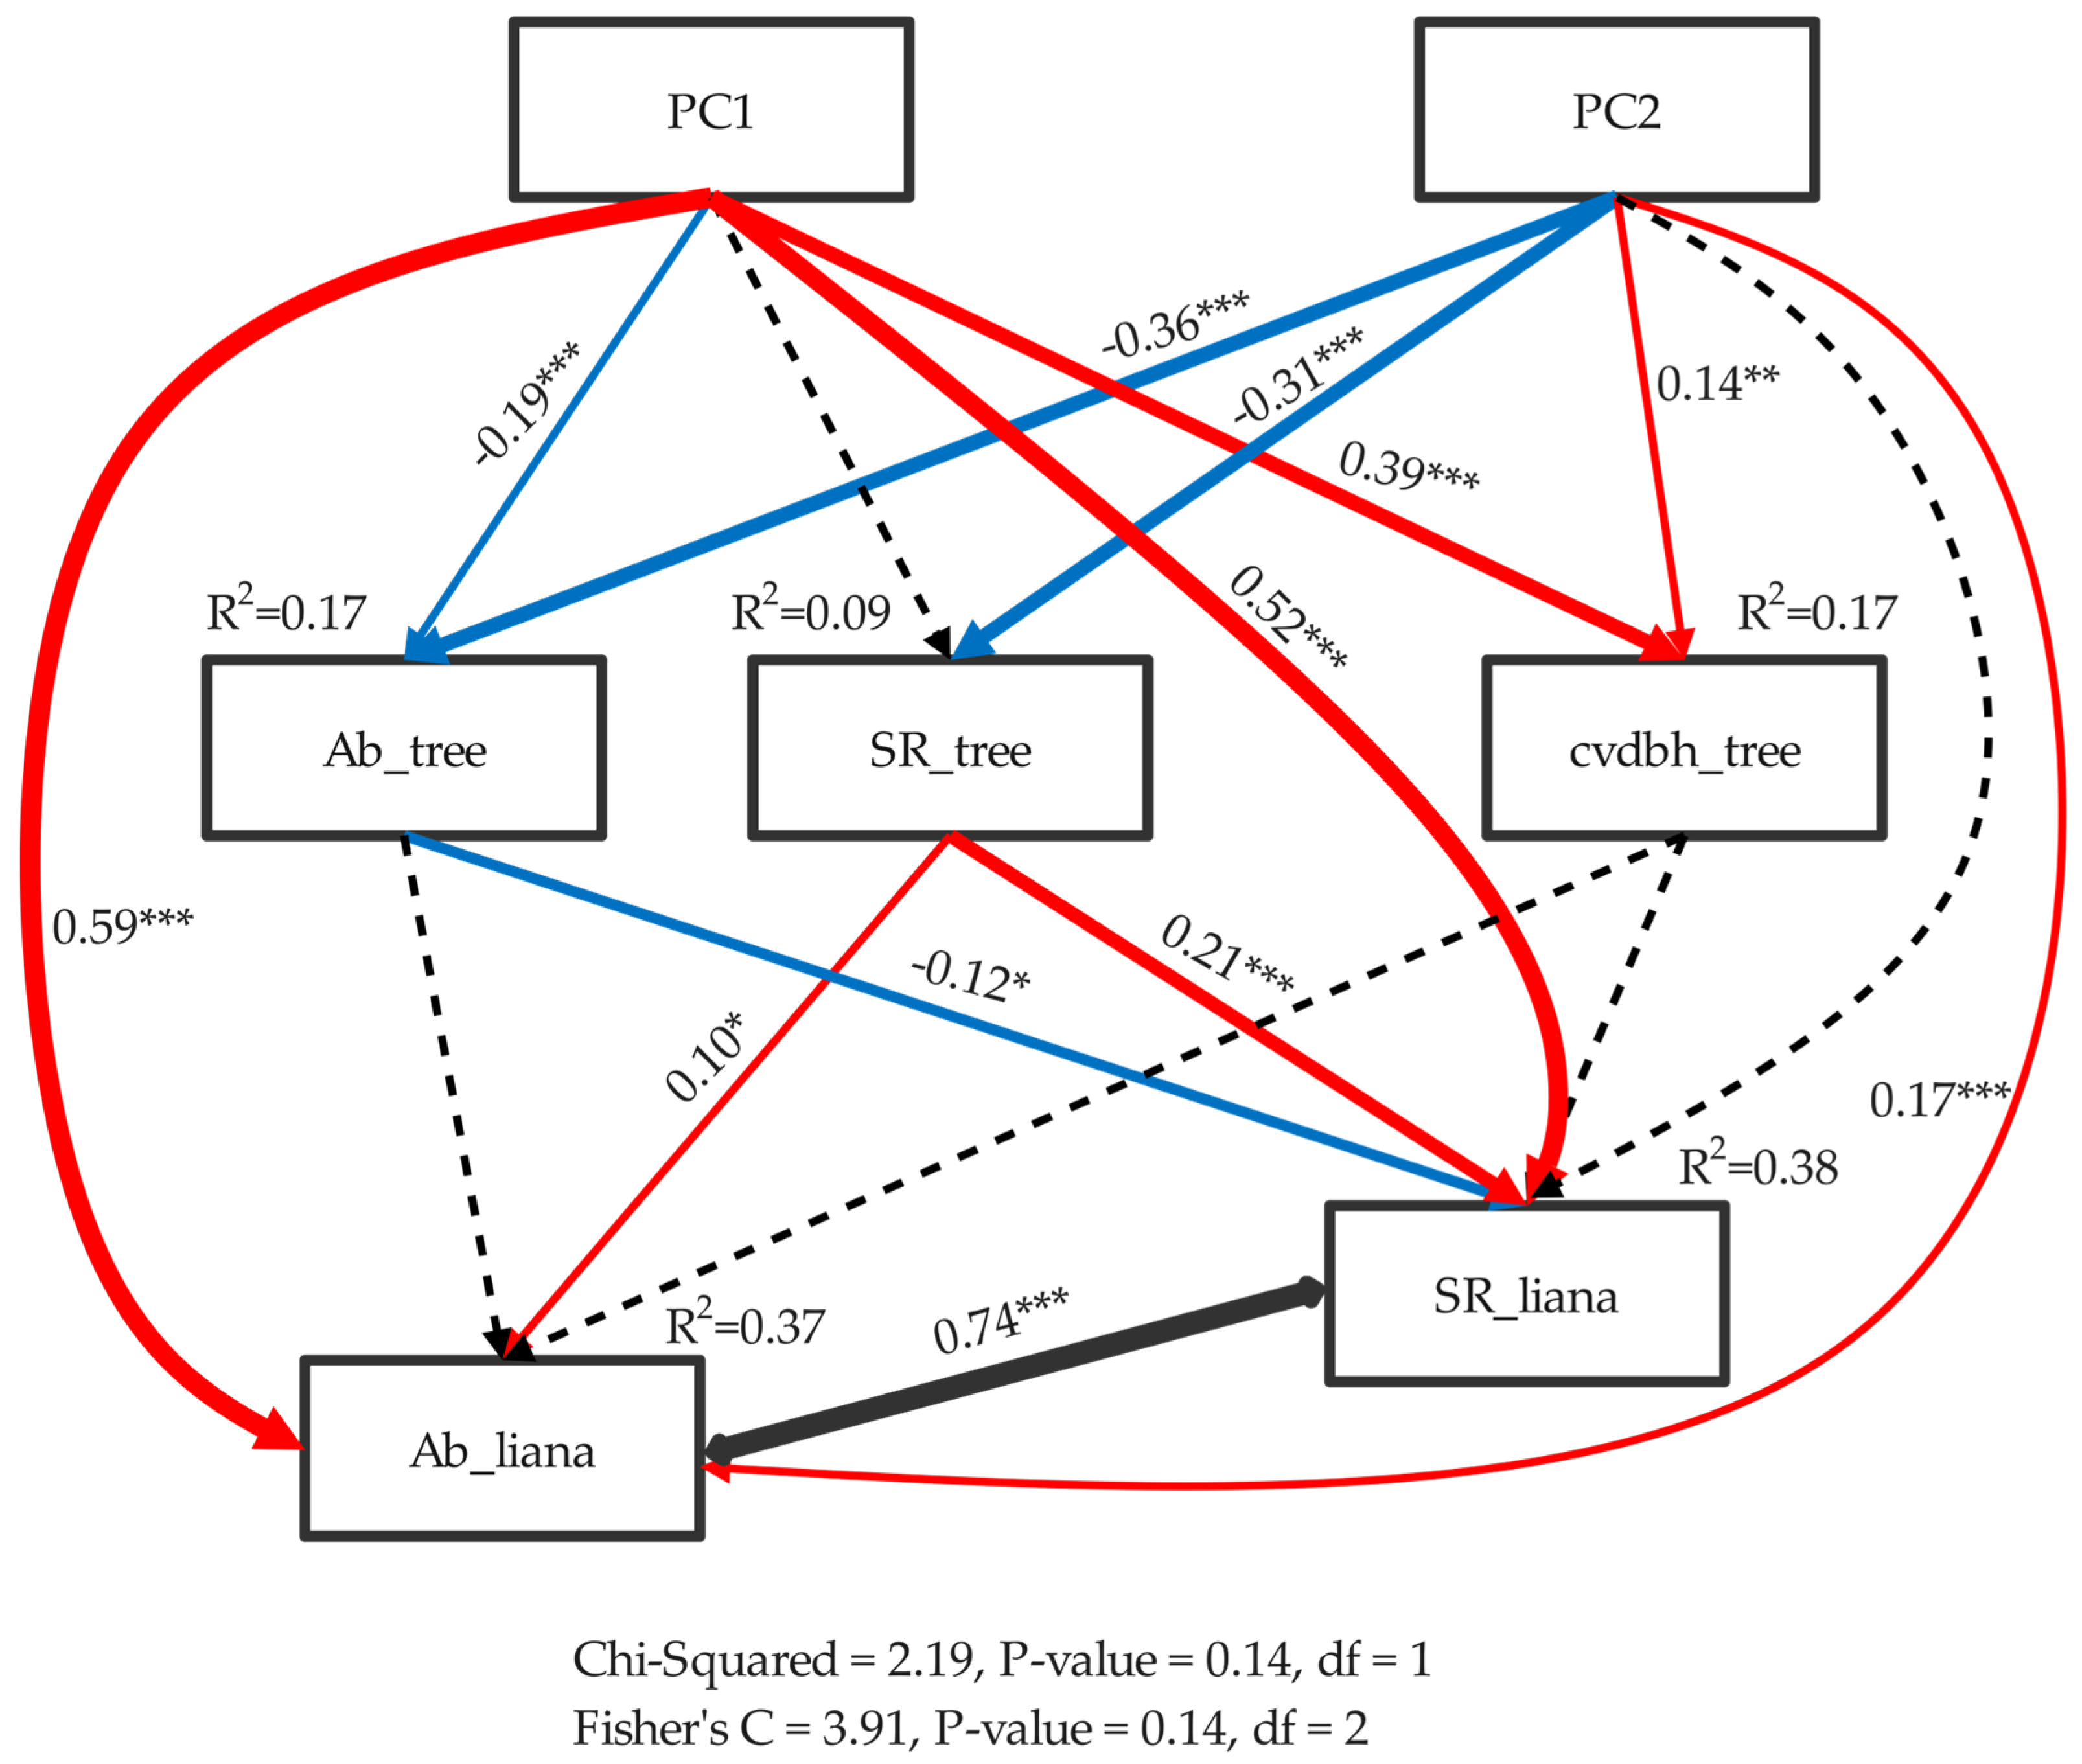
The structural equation model (SEM) results provide further insights into the relationships between abiotic environmental factors, biotic factors, and lianas. The abundance of lianas was primarily influenced by PC1, which represents a combination of altitude-related factors (Figure 7). The strong positive correlation between lianas and PC1, with correlation coefficients of 0.59 and 0.52, suggests that altitude and associated environmental gradients play a crucial role in determining liana abundance. In contrast, liana species richness was influenced by PC2, which is primarily associated with total phosphorus (TP), with a correlation coefficient of 0.17. Overall, the SEM results indicate that lianas are primarily influenced by abiotic factors, with a lesser impact from biotic factors. While tree abundance had a significant but relatively weak direct negative relationship with liana richness, tree species richness exhibited a significant but weaker direct positive relationship with liana richness. Collectively, abiotic and biotic factors explained 38% of the variance in liana species richness and 37% of the variance in liana abundance. Notably, liana species richness and abundance exhibited a strong positive correlation, indicating that areas with higher liana abundance tend to have higher liana diversity.

4. Discussion

Our study offers the first comprehensive survey of liana density, diversity, and distribution in the northern tropical karst seasonal rainforest of China. The results reveal that lianas in the NG 15 ha plot are both abundant and diverse, comprising 113 species. Lianas account for 24.16% of the total number of individuals and 33.44% of the species among woody plants in the plot but only 4.32% of the total woody plant basal area. From a global perspective, tropical forest liana richness varies greatly among regions [3,44]. The species richness in the NG 15 ha plot is lower than that in typical tropical rainforests such as Panama and the Congo Basin [3,45].
This difference in liana diversity between Nonggang and typical tropical rainforests can be attributed to the latitudinal position and air temperature. Nonggang is located at the northern edge of the tropics, experiencing cooler temperatures compared to typical rainforests [46]. However, the distinct dry and wet seasons in Nonggang are conducive to maintaining liana diversity [47], explaining why its species richness is higher than that of other non-tropical forests but lower than that of tropical rainforests such as the Xishuangbanna 20 ha Forest Dynamics Plot in Southwest China. The dominant liana families in the NG 15 ha plot are Annonaceae, Apocynaceae, Fabaceae, and Vitaceae, similar to those in Xishuangbanna and other tropical and Asian rainforests [3,48,49].
Small-diameter lianas prevail in the NG 15 ha plot, with relatively few individuals having larger diameters. In this study, the number of individuals with a DBH greater than 10 cm is 88, with an average of 5.87 plants per hectare, which is lower than that of the study of Xishuangbanna’s 20 ha plot [49]. The DBH of the largest liana in this survey is 19.2 cm, while it can reach 24.5 cm in Xishuangbanna. In BCI’s 50 ha plot, the maximum DBH reached 55.1 cm. Nonggang is located on the northern edge of the tropics and the temperature is lower than that of a typical tropical rainforest. The total basal area of trees per hectare in the Nonggang plot is lower compared to other plots, such as Kenting in Taiwan and Xishuangbanna in Yunnan, China. This discrepancy is likely due to the harsh environmental conditions in the Nonggang plot, which result in a relatively lower proportion of large-diameter tree species [46]. Although the relative altitude of karst mountain is not high (300–600 m), extreme environmental conditions such as steepness, aridity, barrenness, lack of soil, high temperatures, and high rock exposure rates are formed on the ridge due to long-term direct sunlight and rain erosion. We speculate that these conditions physiologically restrict the growth of lianas. Further studies are needed to quantify the extent of these limitations and understand the specific adaptations of lianas in such environments.
The abundance and species richness of lianas within the NG 15 ha plot are closely associated with elevation, slope, and soil cover, with elevation playing a particularly significant role. Our findings are consistent with research in other tropical forests, demonstrating notable variations in liana abundance and species richness across different topographic habitats [18]. The topography of our site exhibited considerable diversity, with elevations ranging from 180 to 370 m above sea level, featuring one peak cluster and one depression in the west and east, respectively [30]. Elevation encompasses a complex interplay of temperature, light, moisture, and other factors, with increasing elevation correlating with decreased abundance and species richness of lianas. We observed a significant positive correlation between elevation and three topographic factors, including slope and convexity [50]. Similarly, in a moist old-growth forest in Panama, 44% of all liana species displayed habitat preferences, with 26 species showing notable affinities towards slopes and drier soil conditions [21].
Soil emerges as a crucial limiting factor for liana growth in karst seasonal rainforests. Within the unique geological and geomorphological context of karst landscapes, soil cover is scarce on ridges but enriched in depressions, exhibiting a negative correlation with elevation. Soil nutrients, particularly nitrogen (N), phosphorus (P), and potassium (K)—the three primary macronutrients—are crucial for lianas to sustain their inherently rapid growth rates [23]. The species richness and abundance of lianas exhibit negative correlations with total carbon (TC) and total nitrogen (TN), while TC and TN distributions show a positive correlation with elevation in the NG plot. This implies that higher elevations feature higher TC and TN contents, while lower elevations have lower TC and TN contents. Conversely, the species richness and abundance of lianas show positive correlations with total phosphorus (TP) and total potassium (TK), with TP and TK distributions exhibiting negative correlations with elevation in the NG plot. The interplay between elevation and soil nutrient distribution in our study provides new insights into the ecological strategies of lianas in karst landscapes, suggesting that elevation not only directly influences liana growth through environmental conditions but also indirectly through its effect on soil nutrient availability. Principal component 2 (PC2), mainly representing TP, significantly influences liana abundance. Furthermore, soil phosphorus (P) has been found to positively correlate with liana abundance in tropical forests in Malaysia [18], Ghana [15], and southwestern China [23]. Most liana species are adapted to high soil nutrient levels, which support the inherently fast growth rates characteristic of the liana growth form [23,51].
The results of the structural equation model (SEM) suggest that lianas are primarily influenced by abiotic factors, with a lesser influence from biotic factors. Tree species richness (SR_tree) exhibits a significant but relatively weak positive relationship with liana species richness (SR_liana), likely due to the greater habitat heterogeneity provided by diverse tree communities, offering more niches for lianas.

5. Conclusions

This study provides the first large-scale assessment of liana abundance, species richness, and their drivers in the seasonal rainforests of southwestern China. Lianas in the NG 15 ha plot exhibit high abundance and species richness, with their distribution strongly linked to elevation. Soil nutrient elements, especially phosphorus, also influence liana species richness and abundance. Habitat heterogeneity, particularly in terms of topography, likely contributes to the maintenance of liana diversity. Our findings highlight the importance of abiotic factors in shaping liana communities, with biotic factors playing a subordinate role. This study offers valuable insights into liana diversity and distribution in karst seasonal rainforests, contributing to future research and conservation efforts.

Author Contributions

Conceptualization, J.L., W.X. and X.L.; methodology, W.X.; software, W.X. and B.W.; formal analysis, W.X.; investigation, J.L., W.X., F.L., D.L., B.W., S.W. and F.H.; data collation, W.T. and N.T.; writing—original draft preparation, J.L.; writing—review and editing, J.L., Y.G. and W.X. All authors have read and agreed to the published version of the manuscript.

Funding

This research was supported by the scientific research capacity-building project for the Nonggang Karst Ecosystem Observation and Research Station of Guangxi under Grant No. Guike 23-026-273. Additional support was provided by “Guangxi Natural Science Foundation 2022GXNSFBA035552, 2021GXNSFAA220015, 2022GXNSFDA035076” and “National Natural Science Foundation of China, grant number 32360281, 32271599, 32260286, 32260276”. Basic operating expenses of Guangxi Institute of Botany (Guizhiye 21006). Supported by the Fund of Guangxi Key Laboratory of Plant Conservation and Restoration Ecology in Karst Terrain (No.22-035-26).

Institutional Review Board Statement

Not applicable.

Data Availability Statement

Data are available for research upon request.

Acknowledgments

We thank the field crews who conducted the censuses, including the volunteers from Guangxi Normal University and the graduate students from our research team. We gratefully acknowledge the support of the Administration Bureau of the Nonggang National Nature Reserve.

Conflicts of Interest

The authors declare that they have no conflicts of interest.

Appendix A

Figure A1. Principal component analysis (PCA) of the abiotic factor in NG 15 ha plot. Dim1 and Dim2 are presented, and the arrow represents explanatory variables used in the analysis. Combination of biplot and cos2 score, where attributes with similar cos2 scores will have similar colors. The higher cos2 value means that the variable is perfectly represented by that component. Synonymous names: soil moisture (moisture), soil bulk density (SBD), total carbon (TC), total nitrogen (TN), total phosphorus (TP), total potassium (TK), soil organic matter (SOM), calcium (Ca), magnesium (Mg), pH value (pH), available nitrogen (AN), available phosphorus (AP), available potassium (AK), exchangeable calcium (ACa), exchangeable magnesium (AMg), mean elevation (Mel), slope (slo), convexity (con), and aspect (asp), soil cover (soilcover), topographical wetness index (twi), and altitude above channel (achan).
Forests 15 01011 g0a1
Table A1. Each abiotic factor contributed to the first two principal components.
Abiotic FactorComp. 1Comp. 2
TK0.310.12
TP0.260.34
TN−0.260.30
TC−0.270.29
SOM−0.280.27
Mel−0.32−0.18
soilcover0.29−0.12
AP0.260.23
AK0.260.19
moisture0.180.30
SBD0.07−0.29
AMg0.030.08
asp0.000.07
Mg−0.020.16
achan−0.08−0.17
twi−0.100.11
pH−0.120.21
AN−0.160.33
Ca−0.170.26
ACa−0.17−0.04
con−0.22−0.01
slo−0.29−0.16
For the abbreviations of the phrases, see Figure A1. Using cos2 (squared cosine values) to measure the contribution of abiotic factors to the principal components; higher values indicate a greater contribution of the abiotic factor to the principal components.

References

  1. Gentry, A. The distribution and evolution of climbing plants. In The Biology of Vines; Mooney, H.A., Putz, F.E., Eds.; Cambridge University Press: Cambridge, UK, 1992; pp. 3–50. [Google Scholar]
  2. Schnitzer, S.; Bongers, F. The ecology of lianas and their role in forests. Trends Ecol. Evol. 2002, 17, 223–230. [Google Scholar] [CrossRef]
  3. Schnitzer, S.; Mangan, S.; Dalling, J.; Baldeck, C.; Hubbell, S.; Ledo, A.; Muller-Landau, H.; Tobin, M.; Aguilar, S.; Brassfield, D.; et al. Liana Abundance, Diversity, and Distribution on Barro Colorado Island, Panama. PLoS ONE 2012, 7, e52114. [Google Scholar] [CrossRef] [PubMed]
  4. Schnitzer, S. The Contribution of Lianas to Forest Ecology, Diversity, and Dynamics. In Biodiversity of Lianas; Parthasarathy, N., Ed.; Springer: Cham, Switerland, 2015; Volume 5, pp. 149–160. [Google Scholar]
  5. Schnitzer, S. Testing ecological theory with lianas. New Phytol. 2018, 220, 366–380. [Google Scholar] [CrossRef] [PubMed]
  6. Álvarez-Cansino, L.; Schnitzer, S.A.; Reid, J.P.; Powers, J.S.J.E. Liana competition with tropical trees varies seasonally but not with tree species identity. Ecology 2015, 96, 39–45. [Google Scholar] [CrossRef] [PubMed]
  7. Schnitzer, S.A.; Bongers, F. Increasing liana abundance and biomass in tropical forests: Emerging patterns and putative mechanisms. Ecol. Lett. 2011, 14, 397–406. [Google Scholar] [CrossRef] [PubMed]
  8. García León, M.M.; Martínez Izquierdo, L.; Mello, F.N.A.; Powers, J.S.; Schnitzer, S.A. Lianas reduce community-level canopy tree reproduction in a Panamanian forest. J. Ecol. 2018, 106, 737–745. [Google Scholar] [CrossRef]
  9. van der Heijden, G.M.F.; Schnitzer, S.A.; Meunier, F. Editorial: Lianas, ecosystems, and global change. Front. For. Glob. Chang. 2023, 6, 1079620. [Google Scholar] [CrossRef]
  10. Estrada-Villegas, S.; Narvaez, S.; Sanchez, A.; Schnitzer, S. Lianas Significantly Reduce Tree Performance and Biomass Accumulation across Tropical Forests: A Global Meta-Analysis. Front. For. Glob. Chang. 2022, 4, 812066. [Google Scholar] [CrossRef]
  11. Schnitzer, S.A.; van der Heijden, G.; Mascaro, J.; Carson, W.P. Lianas in gaps reduce carbon accumulation in a tropical forest. Ecology 2014, 95, 3008–3017. [Google Scholar] [CrossRef]
  12. Muller-Landau, H.C.; Visser, M.D. How do lianas and vines influence competitive differences and niche differences among tree species? Concepts and a case study in a tropical forest. J. Ecol. 2019, 107, 1469–1481. [Google Scholar] [CrossRef]
  13. Letcher, S.G.; Chazdon, R.L. Lianas and self-supporting plants during tropical forest succession. For. Ecol. Manag. 2009, 257, 2150–2156. [Google Scholar] [CrossRef]
  14. Kusumoto, B.; Enoki, T.; Watanabe, Y. Community structure and topographic distribution of lianas in a watershed on Okinawa, south-western Japan. J. Trop. Ecol. 2008, 24, 675–683. [Google Scholar] [CrossRef]
  15. Addo-Fordjour, P.; Zakaria, R. Environmental factors associated with liana community assemblages in a tropical forest reserve, Ghana. J. Trop. Ecol. 2015, 31, 69–79. [Google Scholar] [CrossRef]
  16. Rahmad, Z.; Johari, M.; Addo-Fordjour, P. Local environmental factors shape liana community structure along an elevation gradient in a tropical rainforest. Écoscience 2021, 29, 1–13. [Google Scholar] [CrossRef]
  17. Fadrique, B.; Homeier, J. Elevation and topography influence community structure, biomass and host tree interactions of lianas in tropical montane forests of southern Ecuador. J. Veg. Sci. 2016, 27, 958–968. [Google Scholar] [CrossRef]
  18. Addo-Fordjour, P.; Zakaria, R.; Anuar, S. Environmental factors influencing liana community diversity, structure and habitat associations in a tropical hill forest, Malaysia. Plant Ecol. Divers. 2014, 7, 485–496. [Google Scholar] [CrossRef]
  19. Bruy, D.; Ibanez, T.; Munzinger, J.; Isnard, S. Abundance, richness and composition of lianas in forest communities along an elevation gradient in New Caledonia. Plant Ecol. Divers. 2018, 10, 469–481. [Google Scholar] [CrossRef]
  20. Gerolamo, C.S.; Nogueira, A.; Capellotto Costa, F.R.; de Castilho, C.V.; Angyalossy, V. Local dynamic variation of lianas along topography maintains unchanging abundance at the landscape scale in central Amazonia. J. Veg. Sci. 2018, 29, 651–661. [Google Scholar] [CrossRef]
  21. Dalling, J.; Schnitzer, S.; Baldeck, C.; Harms, K.; John Chandran, R.; Mangan, S.; Lobo, E.; Yavitt, J.; Hubbell, S. Resource-based habitat associations in a neotropical liana community. J. Ecol. 2012, 100, 1174–1182. [Google Scholar] [CrossRef]
  22. Malizia, A.; Grau, H.R.; Lichstein, J.W. Soil phosphorus and disturbance influence liana communities in a subtropical montane forest. J. Veg. Sci. 2010, 21, 551–560. [Google Scholar] [CrossRef]
  23. Liu, Q.; Sterck, F.J.; Medina-Vega, J.A.; Sha, L.-Q.; Cao, M.; Bongers, F.; Zhang, J.-L.; Poorter, L. Soil nutrients, canopy gaps and topography affect liana distribution in a tropical seasonal rain forest in southwestern China. J. Veg. Sci. 2021, 32, e12951. [Google Scholar] [CrossRef]
  24. Leicht-Young, S.A.; Pavlovic, N.B.; Frohnapple, K.J.; Grundel, R. Liana habitat and host preferences in northern temperate forests. For. Ecol. Manag. 2010, 260, 1467–1477. [Google Scholar] [CrossRef]
  25. Li, B.; Zhang, Y.; Luan, F.; Yuan, Z.; Ali, A.; Chu, C.; Bin, Y. Habitat Conditions and Tree Species Shape Liana Distribution in a Subtropical Forest. Forests 2022, 13, 1358. [Google Scholar] [CrossRef]
  26. Bai, X.L.; Liu, Q.; Mohandass, D.; Cao, M.; Wen, H.D.; Chen, Y.J.; Gupta, S.K.; Lin, L.X.; Zhang, J.L. Spatial autocorrelation shapes liana distribution better than topography and host tree properties in a subtropical evergreen broadleaved forest in SW China. Biotropica 2022, 54, 301–308. [Google Scholar] [CrossRef]
  27. Nakada, I.; Uehara, I.; Mori, H. More lianas on larger host trees on steep slopes in a secondary temperate forest, Japan. Plant Ecol. 2024, 19, 1–15. [Google Scholar] [CrossRef]
  28. Anderson-Teixeira, K.J.; Davies, S.J.; Bennett, A.C.; Gonzalez-Akre, E.B.; Muller-Landau, H.C.; Wright, S.J.; Abu Salim, K.; Almeyda Zambrano, A.M.; Alonso, A.; Baltzer, J.L.; et al. CTFS-ForestGEO: A worldwide network monitoring forests in an era of global change. Glob. Chang. Biol. 2015, 21, 528–549. [Google Scholar] [CrossRef] [PubMed]
  29. Su, Z.M.; Li, X.K. The types of natural vegetation in karst region of Guangxi and its classified system. Guihaia 2003, 23, 289–293. [Google Scholar]
  30. Guo, Y.; Wang, B.; Li, D.; Mallik, A.; Xiang, W.; Ding, T.; Wen, S.; Lu, S.; Huang, F.; He, Y.; et al. Effects of topography and spatial processes on structuring tree species composition in a diverse heterogeneous tropical karst seasonal rainforest. Flora 2017, 231, 21–28. [Google Scholar] [CrossRef]
  31. Mittermeier, R.A.; Turner, W.R.; Larsen, F.W.; Brooks, T.M.; Gascon, C. Global biodiversity conservation: The critical role of hotspots. In Biodiversity Hotspots: Distribution and Protection of Conservation Priority Areas; Frank, E., Zachos, J.C.H., Eds.; Springer: Berlin/Heidelberg, Germany, 2011; pp. 3–22. [Google Scholar]
  32. Wang, B.; Ding, T.; Liu, S.; Peng, D.; Li, D.; Lu, M.; Nong, Z.; Nong, Z.; Nong, S.; Guo, Y.; et al. Layer structure and species composition of primeval habitat forest communities that include the tallest tree in karst areas of China. Chin. Sci. Bull. 2024, 69, 912–924. [Google Scholar] [CrossRef]
  33. Guo, Y.; Wang, B.; Xiang, W.; Ding, T.; Lu, S.; Huang, F.; Li, D.; Wen, S.; He, Y.; Li, X. Density-dependent effects of tree species in a 15 ha seasonal rain forest plot in northern tropical karst in Nonggang, Guangxi, southern China. Chin. Sci. Bull. 2015, 60, 1602–1611. [Google Scholar]
  34. Su, Z.M.; Zhao, T.L.; Huang, Q.C. Vegetation survey report of Nonggang Nature Reserve. Guihaia S1 1988, 12, 185–214. (In Chinese) [Google Scholar]
  35. Su, Z.M.; Li, X.K.; Ding, T.; Ning, S.J.; Chen, W.L.; Mo, X.L. The Vegetation of Guangxi; China Forestry Publishing House: Beiing, China, 2014. (In Chinese) [Google Scholar]
  36. Condit, R.S. Tropical Forest Census Plots: Methods and Results from Barro Colorado Island, Panama and a Comparison with Other Plots; Springer: Berlin/Heidelberg, Germany, 1998. [Google Scholar]
  37. Schnitzer, S.A.; Rutishauser, S.; Aguilar, S. Supplemental protocol for liana censuses. For. Ecol. Manag. 2008, 255, 1044–1049. [Google Scholar] [CrossRef]
  38. Schnitzer, S.A.; Carson, W.P. Lianas suppress tree regeneration and diversity in treefall gaps. Ecol. Lett. 2010, 13, 849–857. [Google Scholar] [CrossRef] [PubMed]
  39. Gerwing, J.J.; Schnitzer, S.A.; Burnham, R.J.; Bongers, F.; Chave, J.; DeWalt, S.J.; Ewango, C.E.N.; Foster, R.; Kenfack, D.; Martínez-Ramos, M.; et al. A Standard Protocol for Liana Censuses. Biotropica 2006, 38, 256–261. [Google Scholar] [CrossRef]
  40. Harms, K.; Condit, R.; Hubbell, S.; Foster, R. Habitat associations of trees and shrubs in a 50-ha Neotropical forest plot. J. Ecol. 2001, 89, 947–959. [Google Scholar] [CrossRef]
  41. Valencia, R.; Foster, R.; Gorky, V.; Condit, R.; Svenning, J.-C.; Hernandez, C.; Romoleroux, K.; Losos, E.; Magard, E.; Balslev, H. Tree Species Distributions and Local Habitat Variation in the Amazon: Large Forest Plot in Eastern Ecuador. J. Ecol. 2004, 92, 214–229. [Google Scholar] [CrossRef]
  42. Lefcheck, J.S. piecewiseSEM: Piecewise structural equation modelling in r for ecology, evolution, and systematics. Methods Ecol. Evol. 2016, 7, 573–579. [Google Scholar] [CrossRef]
  43. Team, R.C. R: A Language and Environment for Statistical Computing; R Foundation for Statistical Computing: Vienna, Austria, 2020. [Google Scholar]
  44. Parthasarathy, N.; Sankaralingam, M.; Reddy, M. Patterns of liana diversity in tropical evergreen forests of peninsular India. For. Ecol. Manag. 2004, 190, 15–31. [Google Scholar] [CrossRef]
  45. Ewango, C.; Bongers, F.; Makana, J.-R.; Poorter, L.; Sosef, M. Structure and composition of the liana assemblage of a mixed rain forest in the Congo Basin. Plant Ecol. Evol. 2015, 148, 29–42. [Google Scholar] [CrossRef]
  46. Wang, B.; Huang, Y.; Li, X.; Xiang, W.; Ding, T.; Huang, F.; Lu, S.; Han, W.; Wen, S.; He, L. Species composition and spatial distribution of a 15 ha northern tropical karst seasonal rain forest dynamics study plot in Nonggang, Guangxi, southern China. Biodivers. Sci. 2014, 22, 141–156. [Google Scholar]
  47. Schnitzer, S. A Mechanistic Explanation for Global Patterns of Liana Abundance and Distribution. Am. Nat. 2005, 166, 262–276. [Google Scholar] [CrossRef] [PubMed]
  48. Chen, Y.; Wen, B. Liana diversity and abundance of a tropical montane rainforest in Mengsong, Southern Yunnan, China. Guihaia 2008, 28, 67–72. [Google Scholar]
  49. Liu, Q.; Huaidong, W.; Yunhong, T.; Jiaolin, Z. Liana Diversity and its Climbing Situation on Trees in Xishuangbanna Tropical Seasonal Rainforest. Sci. Silvae Sin. 2017, 53, 1–8. [Google Scholar]
  50. Guo, Y.; Wang, B.; Xiang, W.; Ding, T.; Lu, S.; Huang, F.; Wen, S.; Li, D.; He, Y.; Li, X. Responses of spatial pattern of woody plants’ basal area to topographic factors in a tropical karst seasonal rainforest in Nonggang, Guangxi, southern China. Biodivers. Sci. 2016, 24, 30–39. [Google Scholar] [CrossRef]
  51. Schnitzer, S.; Bongers, F.; Burnham, R.J.; Putz, F.E. Ecology of Lianas; John Wiley & Sons: Hoboken, NJ, USA, 2014. [Google Scholar]
Figure 1. The liana stems (≥1 cm diameter) in the NG 15 ha plot. Blue dots denote diameter <5 cm stems and red circles indicate diameter ≥ 5 cm stems. The basal area is indicated by the size of the dot or circle. Black curves with numbers denote elevation.
Forests 15 01011 g001
Figure 2. Liana and tree rank abundance curves over a 15 ha area in the NG plot.
Forests 15 01011 g002
Figure 3. Liana and tree species–area curves for two size classes over 15 ha on NG plot.
Forests 15 01011 g003
Figure 4. The relationship between lianas (abundance and richness) and environmental factors (elevation, slope, soil cover). The blue dots represent the abundance or species richness of lianas in each 20 m × 20 m grid. The red line shows the linear regression trend line. The gray area represents the 95% confidence interval.
Forests 15 01011 g004
Figure 5. The relationship between lianas (abundance and richness) and soil factors (including total carbon (TC), total nitrogen (TN), total phosphorus (TP), and total potassium (TK)). The blue dots represent the abundance or species richness of lianas in each 20 m × 20 m grid. The red line shows the linear regression trend line. The gray area represents the 95% confidence interval.
Forests 15 01011 g005
Figure 6. The regression relationship between lianas (abundance and species richness) and biotic factors, including the species richness, abundance, and coefficient of variation of diameter at breast height of tree. The blue dots represent the abundance or species richness of lianas in each 20 m × 20 m grid. The red line shows the linear regression trend line. The gray area represents the 95% confidence interval.
Forests 15 01011 g006
Figure 7. The structural equation model of the effects of abiotic and biotic factors on liana abundance and species richness. Arrows represent the hypothesized causal relationships between variables, and double-headed arrows represent correlated relationships. Red indicates positive relationships. Blue indicates negative relationships. The black dashed lines represent non-significant relationships. The arrow width represents the strength of the relationship. Values next to the arrows are path coefficients (standardized partial regression coefficients) with associated statistical significance (*** p < 0.001; ** p < 0.01; * p < 0.05). Values at the upper right corner of variables represent the percentage of variance explained by the model.
Forests 15 01011 g007
Table 1. Size distributions of lianas and trees for individuals ≥1 cm in the NG 15 ha plot.
Diameter Class (cm)LianasTrees
Size Class.
Freq
Mean dbhTotal Basal
Area (m2)
Size Class.
Freq
Mean dbhTotal Basal
Area (m2)
123,8192.5516.4874,7585.37365.11
214,1653.3615.0155,8006.67361.6
519506.276.4224,55711.24336.54
108811.540.9510,67916.79281.34
2000.000.00243527.48156.33
Liana data and tree data are presented as diameter size class (≥1 cm, ≥2 cm, ≥5 cm, ≥10 cm, ≥20 cm), freq., principal stems, and total basal area. Lianas were censused in 2019 and the trees in 2011.
Table 2. Summary data for the lianas of the Nonggang 15 ha plot in south China.
No.FamilyGenusSpeciesStem DensityTotal BA (cm2 15 ha−1)Mean dbh (cm)rel.den (%)rel.dom (%)rel.fre (%)IV (%)
1AnnonaceaeArtabotryshongkongensis206922,090.433.338.6913.414.668.92
2AnnonaceaeUvariatonkinensis261211,780.142.1610.977.154.947.69
3FabaceaeBauhiniachampionii119018,925.143.895.0011.494.857.11
4VitaceaeTetrastigmakwangsiense136613,108.883.045.747.963.185.62
5ApocynaceaeUrceolarosea118311,936.323.174.977.253.215.14
6AraceaeRhaphidophorahongkongensis18973212.401.417.961.954.424.78
7VitaceaeTetrastigmaplanicaule97711,223.133.304.106.812.294.40
8ApocynaceaeTrachelospermumjasminoides12183715.141.795.112.264.784.05
9ErythropalaceaeErythropalumscandens9558295.603.014.015.042.533.86
10MoraceaeMalaisiascandens6291407.891.402.640.863.452.31
11RutaceaeZanthoxylumdissitum5612386.072.142.361.453.052.28
12ApocynaceaeSecamoneelliptica4224159.163.101.772.522.382.23
13LamiaceaePremnafulva3683658.293.351.552.222.872.21
14RubiaceaeUncariahirsuta5564425.772.972.332.691.342.12
15GnetaceaeGnetummontanum5713103.592.412.401.881.912.07
16RubiaceaeUncariarhynchophylla5273478.812.732.212.111.712.01
17IcacinaceaeIodesvitiginea3931964.342.321.651.192.671.84
18MalpighiaceaeAspidopterysconcava4172029.582.301.751.232.151.71
19PrimulaceaeEmbeliaundulata4232443.292.481.781.481.731.66
20ConvolvulaceaeArgyreiacapitiformis4941307.121.712.070.791.911.59
21ApocynaceaeMarsdeniatinctoria3461401.442.061.450.852.171.49
22FabaceaeCaesalpiniasinensis259837.271.871.090.512.061.22
23FabaceaeBowringiacallicarpa2471610.402.561.040.981.501.17
24MenispermaceaeDiploclisiaglaucescens1981712.733.010.831.041.531.14
25VitaceaeCissussubtetragona2361160.522.320.990.701.661.12
26FabaceaeDalbergiapinnata1481823.283.520.621.111.431.05
27FabaceaeSenegaliarugata1771856.583.200.741.131.171.01
28OpiliaceaeCansjerarheedei1551458.183.050.650.891.410.98
29VitaceaeTetrastigmaerubescens2591908.002.721.091.160.630.96
30MalpighiaceaeAspidopterysnutans192803.252.130.810.491.280.86
31HernandiaceaeIlligerarhodantha169535.571.820.710.331.170.74
32UrticaceaeBoehmerianivea var. tenacissima108691.042.640.450.421.230.70
33MenispermaceaeTinomisciumpetiolare173813.142.250.730.490.760.66
34ApocynaceaeBeaumontiagrandiflora123999.282.920.520.610.810.65
35DioscoreaceaeDioscoreapolystachya115135.041.120.480.081.160.57
36EuphorbiaceaeMallotusrepandus101802.142.910.420.490.780.56
37OleaceaeJasminumalbicalyx96237.281.600.400.141.120.56
38FabaceaeDalbergiadyeriana86716.503.010.360.440.830.54
39RhamnaceaeGouaniajavanica87567.442.630.370.340.900.54
40ApocynaceaeCryptolepisbuchananii107647.882.550.450.390.760.53
41AraceaeSpirodelapolyrhiza67715.633.190.280.430.830.52
42FabaceaeAfgekiafilipes721061.613.840.300.640.490.48
43FabaceaeCheniellatenuiflora601354.764.620.250.820.240.44
44MenispermaceaeTinosporasinensis88208.351.570.370.130.780.42
45FabaceaePterolobiumpunctatum82483.452.530.340.290.630.42
46ConvolvulaceaeArgyreiawallichii81255.321.840.340.160.760.42
47VitaceaeVitissp87287.491.890.370.170.600.38
48ApocynaceaeIchnocarpusfrutescens66235.151.960.280.140.610.34
49VitaceaeVitisheyneana40388.143.010.170.240.450.29
50VitaceaeAmpelopsisglandulosa var. hancei33242.672.150.140.150.470.25
51ApocynaceaeMarsdeniakoi62138.681.530.260.080.400.25
52FabaceaeCalleryacinerea33178.362.430.140.110.450.23
53VitaceaeTetrastigmaretinervium var. pubescens57193.481.940.240.120.330.23
54RosaceaeRosahenryi36364.832.330.150.220.310.23
55FabaceaeDerrisfordii var. lucida51164.041.820.210.100.360.23
56VitaceaeTetrastigmaceratopetalum33173.572.150.140.110.380.21
57RanunculaceaeClematismeyeniana4487.221.500.190.050.380.21
58Asclepiadaceaespsp3781.931.600.160.050.400.20
59ApocynaceaeTelosmaprocumbens25173.822.710.110.110.380.20
60SmilacaceaeSmilaxastrosperma3233.991.150.130.020.420.19
61VitaceaeTetrastigmaserrulatum39109.121.620.160.070.270.17
62RanunculaceaeClematisfinetiana3379.571.680.140.050.310.17
63CapparaceaeCapparisacutifolia24109.512.210.100.070.290.15
64VitaceaeTetrastigmacaudatum2944.541.330.120.030.310.15
65PrimulaceaeMaesabalansae18206.783.310.080.130.250.15
66RanunculaceaeNaraveliapilulifera3358.891.420.140.040.270.15
67EuphorbiaceaeMallotusyunnanensis10349.064.200.040.210.130.13
68CelastraceaeSalaciasessiliflora19108.392.540.080.070.220.12
69VitaceaeAmpelopsiscantoniensis1667.492.090.070.040.250.12
70FabaceaeBauhiniacorymbosa17294.754.310.070.180.110.12
71CelastraceaePristimerasetulosa14151.683.100.060.090.200.12
72FabaceaeDerristonkinensis var. compacta1691.322.440.070.060.220.11
73PiperaceaePipersemiimmersum2526.041.120.110.020.220.11
74RhamnaceaeVentilagoleiocarpa1346.552.040.060.030.220.10
75DioscoreaceaeDioscoreaesquirolii1917.841.090.080.010.200.10
76OleaceaeJasminumelongatum1430.631.600.060.020.180.09
77RhamnaceaeZiziphusoenopolia1151.122.300.050.030.180.09
78VitaceaeCissusassamica1011.561.200.040.010.180.08
79FabaceaeSophoraprazeri1445.031.860.060.030.130.07
80RosaceaeRubuspirifolius1255.352.330.050.030.130.07
81AraceaeRhaphidophoramegaphylla1425.131.450.060.020.130.07
82AristolochiaceaeAristolochiakwangsiensis1151.832.170.050.030.110.06
83PrimulaceaeEmbelialaeta661.563.230.030.040.110.06
84RosaceaeRubusalceifolius816.271.540.030.010.130.06
85VitaceaeTetrastigmasp595.364.820.020.060.070.05
86OleaceaeJasminumprainii616.531.720.030.010.110.05
87AraceaePothoschinensis119.531.050.050.010.090.05
88PhyllanthaceaePhyllanthusreticulatus761.463.100.030.040.070.05
89EuphorbiaceaeMallotusmillietii619.431.930.030.010.090.04
90FabaceaeDalbergiahancei435.463.030.020.020.070.04
91RosaceaeRubusfeddei925.011.820.040.020.050.04
92VitaceaeVitisretordii544.492.980.020.030.050.03
93AnnonaceaeDesmoschinensis513.601.780.020.010.070.03
94PrimulaceaeEmbeliasp422.272.450.020.010.050.03
95FabaceaeMillettiapachyloba320.282.600.010.010.050.03
96CaprifoliaceaeLoniceraconfusa47.561.500.020.010.050.03
97SabiaceaeSabiaswinhoei36.681.670.010.000.040.02
98FabaceaeDerrissp211.982.750.010.010.040.02
99VitaceaeVitisflexuosa26.071.950.010.000.040.02
100RanunculaceaeClematisflorida23.601.500.010.000.040.02
101PrimulaceaeEmbeliascandens23.311.450.010.000.040.02
102PiperaceaePiperkadsura22.111.150.010.000.040.02
103VitaceaeTetrastigmaobtectum22.081.150.010.000.040.02
104VitaceaeTetrastigmasp222.563.750.010.010.020.01
105ApocynaceaeHoyacarnosa32.521.030.010.000.020.01
106RutaceaeZanthoxylumcalcicola22.671.300.010.000.020.01
107RutaceaeCitrustrifoliata16.162.800.000.000.020.01
108RhamnaceaeSageretiathea14.912.500.000.000.020.01
109OleaceaeJasminumsp13.462.100.000.000.020.01
110Rhamnaceaespsp13.142.000.000.000.020.01
111RosaceaeRubussp13.142.000.000.000.020.01
112VitaceaeAmpelopsischaffanjonii11.771.500.000.000.020.01
113OleaceaeJasminummicrocalyx11.331.300.000.000.020.01
For each of the 113 species, we list the density of all rooted stems (Stem density), the total liana basal area (Total BA), the mean liana basal area (Mean dbh), relative density (rel.den), relative dominance (rel.dom), relative frequency (rel.fre), and importance value index (IV); sp stands for unknown species or genus.
Table 3. Comparison of lianas and freestanding woody plants (trees and shrubs) in their total abundance and community structure for individuals ≥1 cm in the NG 15 ha plot.
Diversity IndexLianasTrees
Stem density23,819 (24.16%)74,758
Total basal area (m2)16.48 (4.32%)365.11
Species richness113 (34.66%)213
Shannon diversity3.513.82
Simpson dominance0.950.96
Pielou evenness0.750.71
Disclaimer/Publisher’s Note: The statements, opinions and data contained in all publications are solely those of the individual author(s) and contributor(s) and not of MDPI and/or the editor(s). MDPI and/or the editor(s) disclaim responsibility for any injury to people or property resulting from any ideas, methods, instructions or products referred to in the content.