Article

Neighborhood Competition and Understory-Associated Vegetation Are Important Factors Influencing the Natural Regeneration of Subtropical Mountain Forests

1
Key Laboratory of Southern Mountain Horticulture, College of Horticulture and Landscape Architecture, Southwest University, Chongqing 400715, China
2
Chongqing Forestry Investment Development Co., Ltd., Chongqing 401147, China
*
Author to whom correspondence should be addressed.
Forests 2024, 15(6), 1017; https://doi.org/10.3390/f15061017
Submission received: 15 May 2024 / Revised: 7 June 2024 / Accepted: 9 June 2024 / Published: 12 June 2024

Abstract

:
Natural regeneration is deemed essential for maintaining biodiversity and ecosystem stability. Previous studies, however, have primarily concentrated on regions exhibiting limited environmental and climatic variability, overlooking the classification of natural regeneration based on age and source. Research conducted at the mesoscale, characterized by increased environmental variability and the incorporation of neighborhood competition and understory-associated vegetation, enhances our comprehension of the multifaceted influences on natural regeneration. To comprehend this issue, this study implemented 60 plots, each measuring 20 m × 20 m, across five distinct areas of Chongqing, China. Twenty explanatory variables were chosen from five diverse categories: understory vegetation, neighborhood competition, stand structure, climatic factors, and environmental factors. And the naturally regenerated species were classified into seedlings and saplings, as well as endogenous and exogenous species, based on their age and origin. We examined the response of the different categories of natural regeneration to various factors and constructed a structural equation model (SEM) for significant factors to investigate their direct and indirect effects on natural regeneration. A total of 61 regenerated tree species belonging to 29 families and 42 genera were found in the study area, and the naturally regenerating species with high importance values were Quercus fabri, Robinia pseudoacacia, Alangium chinense, Cunninghamia lanceolata, and Ligustrum lucidum. It was found that neighborhood competition and understory-associated vegetation explained the largest proportion (more than 50%) of the variation in the different categories of natural regeneration, and forests with clumped distribution (W), a high mingling index (M) and strong competition (H) had a reduced natural regeneration capacity. Understory-associated herbs significantly reduced natural regeneration and the crowdedness index (C) significantly inhibited the understory-associated herbs, thus indirectly promoting natural regeneration. The shrub cover is significantly and positively correlated with the number of naturally regenerated plants and can be used as an indicator of a forest community’s regeneration potential. Understanding the differences in the importance of various factors at the mesoscale, as well as their direct and indirect impacts, can help us further comprehend the mechanisms of natural regeneration and provide a foundation for the sustainable development of forests.

1. Introduction

Natural regeneration serves as a crucial mechanism for maintaining biodiversity and stability within forest ecosystems [1], playing a significant role in achieving sustainable forest development [2] and facilitating natural recovery post-disturbance [3,4,5]. Moreover, with the emergence of carbon neutrality goals, natural regeneration has been recognized as a cost-effective and sustainable approach to enhance forest carbon sinks, mitigating climate change [6]. However, the natural regeneration process of trees is susceptible to various factors [7,8], particularly those at vulnerable development stages such as seedlings and saplings [9]. Previous studies have revealed that factors such as elevation [10], aspect [11], and slope [12], and climatic factors like rainfall and temperature [13], are crucial abiotic factors influencing forest regeneration. Biotic factors such as the stand density, tree diameter at breast height (DBH), and tree average height (TAH) have been shown to play significant roles in natural regeneration [14,15,16]. However, most previous studies have focused on sites with limited environmental and climatic heterogeneity. The relative importance of various factors for natural regeneration has not been adequately compared.
Competition among canopy trees for light, growing space, water, and nutrients can influence natural regeneration [17]. Consequently, many researchers have begun to use neighborhood competition to quantify the impact of tree competition on natural regeneration. He et al. (2022) confirmed that neighborhood competition was found to affect the regeneration and biomass allocation of Pinus massoniana [18]. The impact of competition is not necessarily negative. Larger crown sizes may lead to stronger canopy competition and coverage, which can suppress natural regeneration [19]; larger crown coverage can provide a sufficient number of seeds for natural regeneration, potentially benefiting the process [20]. On the other hand, the impact of understory-associated vegetation on natural regeneration is complex. The diversity of shrubs and herbs contributes to the forest’s water-holding capacity and nutrient retention [21]; for example, thorny shrubs can reduce browsing by herbivores [22], thereby increasing the survival rate of seedlings and saplings. However, shrubs may compete with tree seedlings [23]. Neighborhood competition or stand structure factors can also influence shrubs and herbs, thereby exerting direct or indirect effects on forest regeneration [24,25,26]. Neighborhood competition and understory-associated vegetation have complex impacts on natural regeneration. Understanding these mechanisms could help develop appropriate management strategies for trees and understory vegetation.
Previous studies on natural regeneration have rarely categorized regeneration according to age and origin. However, within the realm of natural regeneration, varying responses to biotic and abiotic factors are discernible among seedlings of diverse ages and sizes [13,25,27]. Metslaid et al. (2005) indicated that seedlings taller than 1.3 m may exhibit stronger competitive abilities [28]. The transition from seedling to sapling is often a critical bottleneck in supplementing the forest stand structure through natural regeneration [29]. Therefore, understanding the responses of seedlings and saplings at different age levels to various factors can further elucidate the mechanisms of natural regeneration. On the other hand, in undisturbed conditions, naturally regenerating understory plants represent the future composition of plant communities [30], and the seeds from natural regeneration originate from both within and around the community, resulting in different impacts [31]. Seeds from other stands or communities can effectively alter species diversity in understory regeneration, determining the structure and dynamics of future communities [32,33]. Notably, endogenous regeneration in forests is beneficial for maintaining the stability of species composition and ecosystem services [34], and current forest management aims to transform coniferous forests into mixed forests, thereby enhancing forest biodiversity and productivity [35]. Therefore, studying the mechanisms of natural regeneration effects from different sources of seedlings can help us understand the future changes in forest communities under different environments and assist forestry management authorities in decision-making.
Chongqing, situated in the southwestern region of China, is marked by substantial variations in altitude and an uneven distribution of rainfall, thereby exhibiting pronounced environmental heterogeneity. Therefore, by comparing the capacity of the stand structure (or neighborhood competition), understory-associated vegetation, and environmental factors to influence natural regeneration, a deeper comprehension of this ecological process at the mesoscale can be achieved. Such an understanding is vital for protecting the forest environment in Chongqing, thereby facilitating the realization of sustainable forestry development goals.
Based on these challenges, we proposed the following research objectives: 1. to identify the key factors influencing forest natural regeneration at the mesoscale; 2. to assess the responses of natural regeneration from different ages and origins to various factors; 3. to examine the direct and indirect effects of neighboring competition and understory-associated vegetation on different ages and origins of natural regeneration.

2. Materials and Methods

2.1. Study Site

The study area is located in Chongqing (28°10′–32°13′ N, 105°11′–110°11′ E), situated in inland China, covering a total area of 82,400 km². The terrain predominantly consists of hills, low mountains, and mid-mountains, with altitudes ranging from 400 to 1400 m. Chongqing experiences a subtropical monsoon climate, with an annual average temperature of 14–18 °C and an annual average precipitation of 1000–1400 mm [36]. Due to significant environmental heterogeneity in Chongqing, five representative areas were selected from the east, south, west, north, and central regions for this study (Figure 1). The study areas are located at elevations of 397–1497 m, with annual average temperatures of 12.4–17.4 °C and an annual average precipitation of 1076–1426 mm, which collectively represent the environmental and climatic characteristics of Chongqing (Table S1).

2.2. Plot Selection and Vegetation Investigation Methodology

Within the study area, natural forest communities that are common in each region, with stable structures, minimal human disturbance, no management or logging, and an age of 20–30 years (middle-aged and near-mature forests) were selected. Representative areas within these communities were chosen to establish permanent 20 × 20 m plots. A total of 60 plots were established across the five regions.
In each plot, every tree (height > 5 m) was identified and recorded. Measurements included diameter at breast height (DBH), height, and crown width. Spatial positioning of each tree was conducted using Real-Time Kinematic (Qianxun SI SRmini, Shanghai, China).
To calculate neighborhood competition, a 5 m buffer zone was set around the edge of each plot. Surveys of shrubs and herbaceous plants were conducted within the 10 × 10 m core area at the center of each plot. The core area was divided into four 5 × 5 m subplots, and four of these were selected to identify and record all woody plants (H < 5 m, including shrubs and natural regeneration). Measurements included species, basal diameter, height, crown width, and cover. Additionally, all herb species, heights, and covers were recorded. The basic information for each plot is detailed in Table S1.

2.3. Selection and Interpretation of Explanatory and Response Variables

We tallied the number of naturally regenerated plants within the subplots. When the height of naturally regenerated plants was <1.2 m, they were classified as seedlings, while those with heights between 1.2 and 5 m were categorized as saplings. Naturally regenerated plants were further classified based on their seed source into endogenously and exogenously regenerated plants; endogenously regenerated plants were denoted as progeny originating from parent trees within the 20 m × 20 m plot, and otherwise were classified as exogenous regeneration. According to the classification method, the number of tree regenerations (NTR), the number of herb seedlings (NHS), the number of shrub saplings (NSS), the number of exogenous regenerations (NExR), and the number of endogenous regenerations (NEnR) were considered the five primary response variables in this study.
The explanatory variables were divided into five groups: environmental factors, climate factors, stand structure, neighborhood competition, and understory-associated vegetation (Table 1). The neighborhood competition index was calculated using ArcGIS 10.4 (ESRI, Redlands, CA, USA). The basic information of the explanatory variables is detailed in Table S1.

2.4. Data Analysis

We assessed the potential for multicollinearity by using the Variance Inflation Factor (VIF) and correlation analysis. Variables with VIF > 5 and correlation coefficients exceeding 0.7 were removed, and for these, the tree species richness (TSS) was removed [42]. We checked the normality, homogeneity, and independence of residuals for all models [43], and applied normality transformations and scaling transformations when necessary.
Different canopy structures have varying impacts on the understory [44], and coniferous and broadleaf tree species possess distinct functional traits and canopy structures. Therefore, we divided the proportion of coniferous trees into five categories (0%–20%, 20%–40%, 40%–60%, 60%–80%, 80%–100%) as random effects in the model.
We utilized the R package ‘glmmTMB’ to construct Generalized Linear Mixed Effects Models (GLMMs) to analyze different response variables concerning environmental factors, climate factors, stand structure, neighborhood competition, and understory-associated vegetation. We conducted model selection based on the AICc (ΔAICc ≤ 2) to identify the best predictors of species importance value. This procedure was carried out using the ‘dredge’ function in the R package ‘MuMIn’ [45,46]. Subsequently, we employed the R package ‘glmm. hp’ to calculate the relative importance values of each explanatory variable [47], elucidating the degree of influence of different factors. Using the above methods, we modeled the impact of different factors on regeneration. The models included the following information: (i) Generally, when understory regeneration density exceeds overstory tree density, the community’s regeneration potential is considered better [48]. Therefore, the response variable was set as 0 (lower regeneration density than overstory tree density, indicating poor regeneration potential) or 1 (higher regeneration density than overstory tree density, indicating excellent regeneration potential). GLMM regression models were established based on logit transformation. (ii) GLMM regression models were constructed based on log transformation, with the number of tree regenerations replacing tree regeneration density. Different explanatory variables were used to establish optimal models for the number of tree regenerations (NTR), the number of herb seedlings (NHS), the number of shrub saplings (NSS), the number of exogenous regenerations (NExR), the number of endogenous regenerations (NEnR). These models were constructed to examine the response of different types of natural regeneration to the explanatory variables. (iii) To compare the differences in natural regeneration between the shrub layer and the herb layer, we set the condition where the number of saplings in the shrub layer exceeds that in the herb layer as 1, and vice versa as 0. We then established the optimal model using a GLMM based on logit transformation.
Due to the limited data, structural equation models (SEMs) with fewer variables are expected to provide greater reliability [45,49]. Therefore, SEMs were only established for the important neighborhood competition and understory-associated vegetation in the optimal models. The R package ‘piecewiseSEM’ was utilized to construct SEMs to test whether neighborhood competition indirectly affects spontaneous regeneration through mediating understory-associated vegetation factors.
All analyses were performed using R software (v4.3.1, R Foundation for. Statistical Computing, Vienna, Austria) We set the significance level at p < 0.05. Additionally, data with p < 0.1 were also marked, with explanations provided for any special cases as necessary.

3. Results

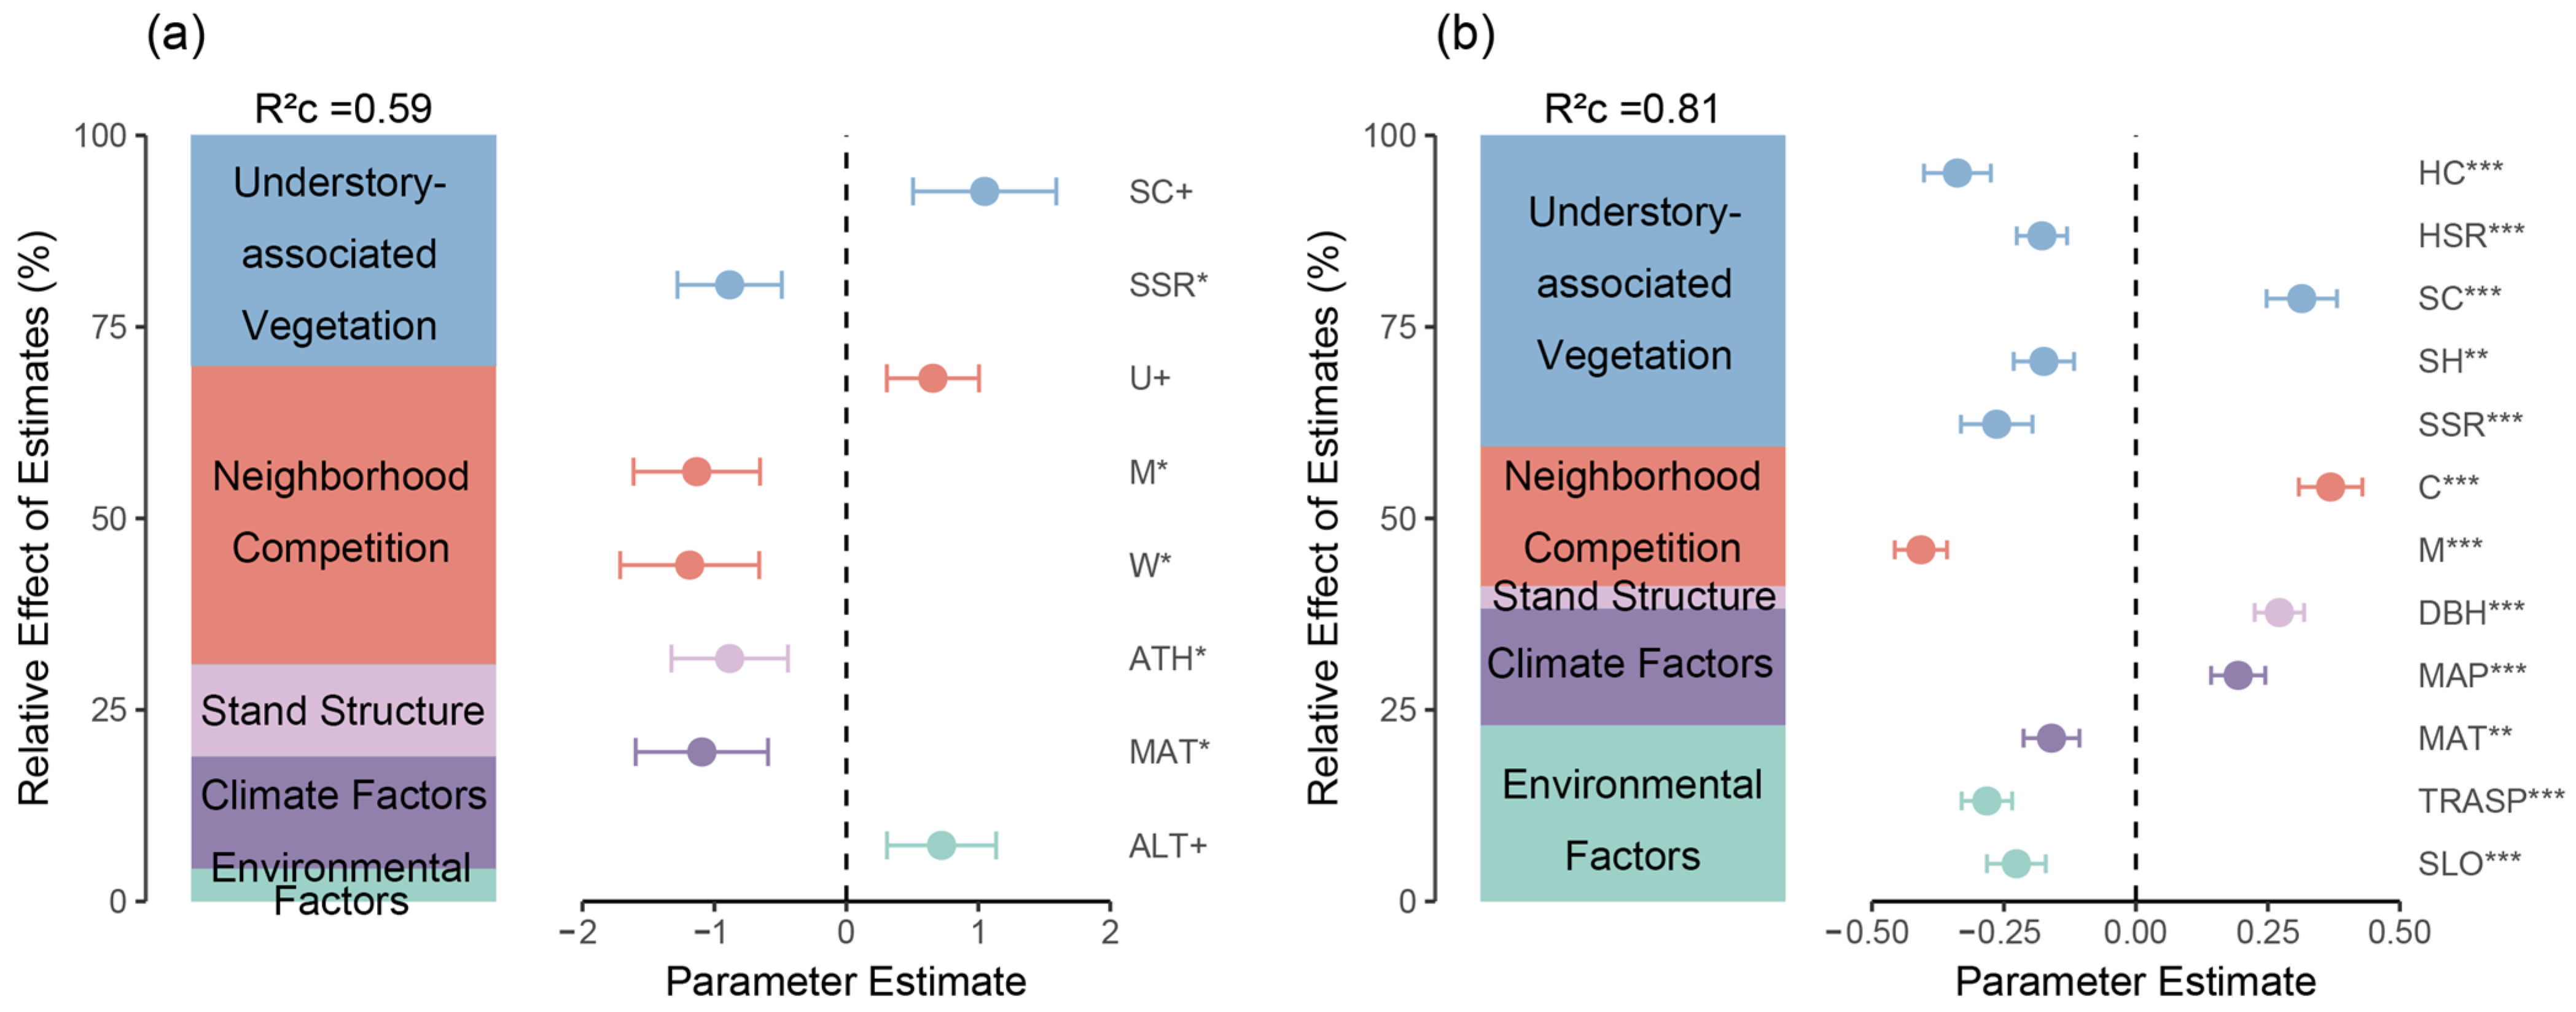
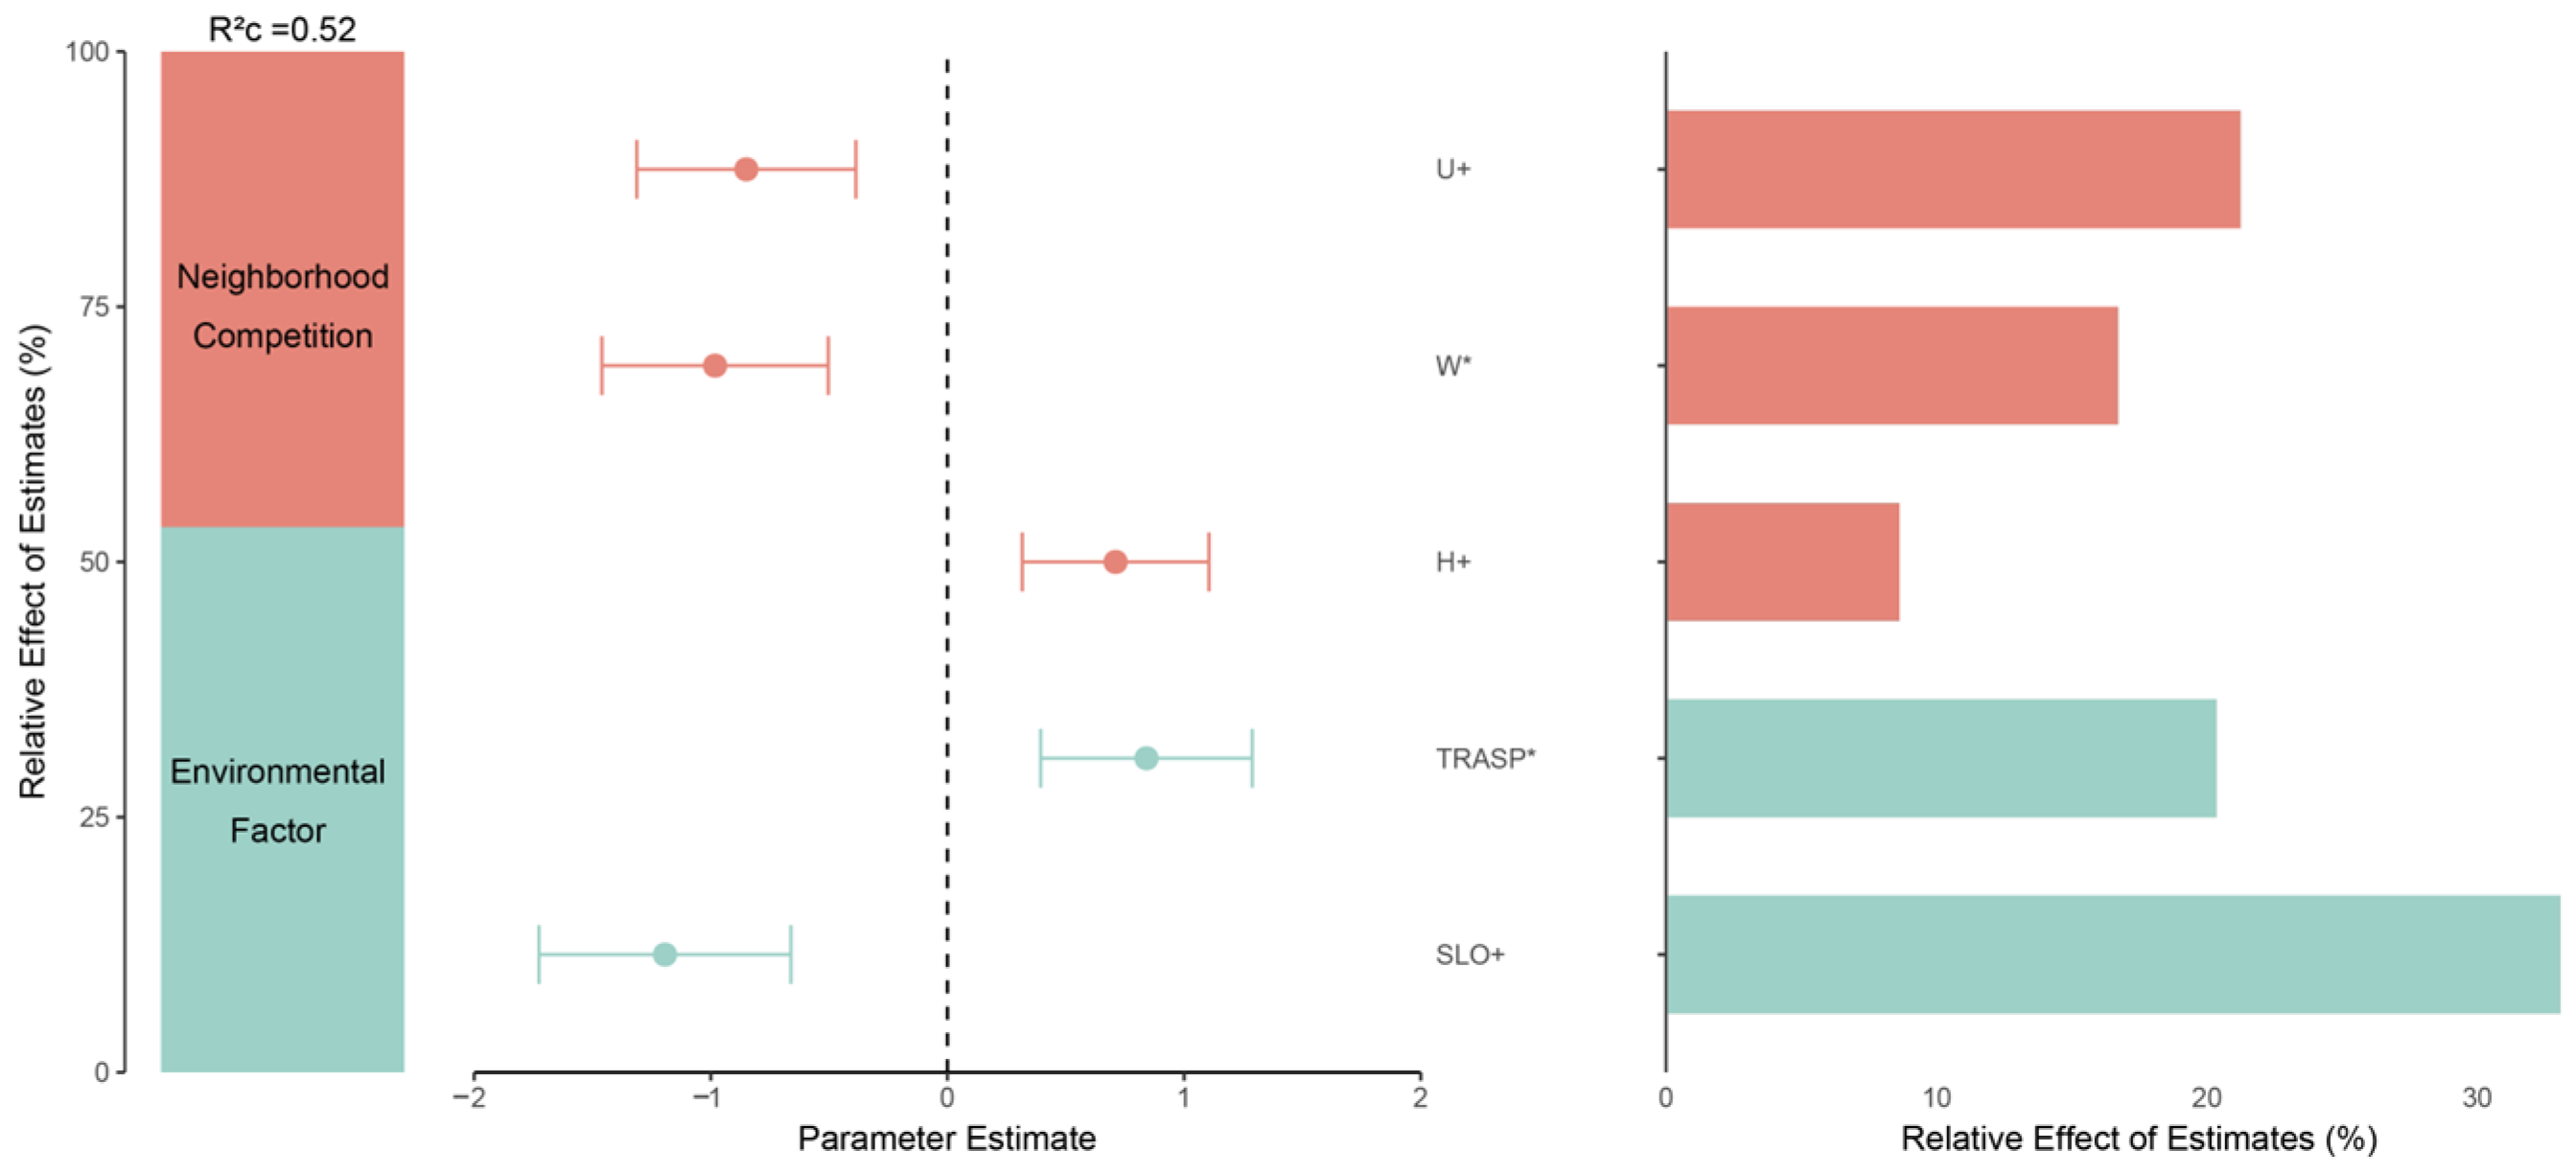
3.1. Natural Regeneration Basics and Important Factors Affecting Regeneration

In the 60 plots, a total of 2522 trees belonging to 76 species, 36 families, and 62 genera were recorded. The top five importance values were given to the following tree species: Pinus massoniana, Cupressus funebris, Cunninghamia lanceolata, Quercus fabri, and Cornus wilsoniana. A total of 636 natural regeneration saplings or seedlings were recorded, comprising 61 species from 29 families and 42 genera. The top five importance values of the regeneration layer were given to Quercus fabri, Robinia pseudoacacia, Alangium chinense, Cunninghamia lanceolata, and Ligustrum lucidum. In the understory-associated vegetation, 89 species of shrubs were recorded, which belonged to 43 families and 69 genera, and the top five importance values of shrubs were given to Camellia oleifera, Coriaria nepalensis, Viburnum erosum, Zanthoxylum armatum, and Vitex negundo. A total of 127 herbaceous species were recorded, which belonged to 53 families and 98 genera, and the top five importance values of herbs were given to Carex breviculmis, Carex brunnea, Cyclosorus acuminatus, Miscanthus floridulus, and Imperata cylindrica. Overall, the number of tree regenerations (10.6 stems) (Table 2) varied considerably in terms of the regeneration density among the different plots, ranging from 0 to 54 stems, with a large standard deviation (S.D.) and coefficient of variation (CV).
Among the plots, 28 were identified as having a better regeneration potential, with the number of tree regenerations (NTR) exceeding the tree density (TDEN). The optimal model indicated that neighborhood competition (38.97%) and understory-associated vegetation (30.1%) had the most significant impact on regeneration (Figure 2a, R2c = 0.59). To further validate the effects of neighborhood competition and understory plants on the regeneration capacity, the optimal model based on the number of tree regenerations (NTR) showed that the understory plants (40.63%) remained the most influential factor (Figure 2b, R2c = 0.81). Therefore, the focus of this study is primarily on neighborhood competition and understory-associated vegetation factors.

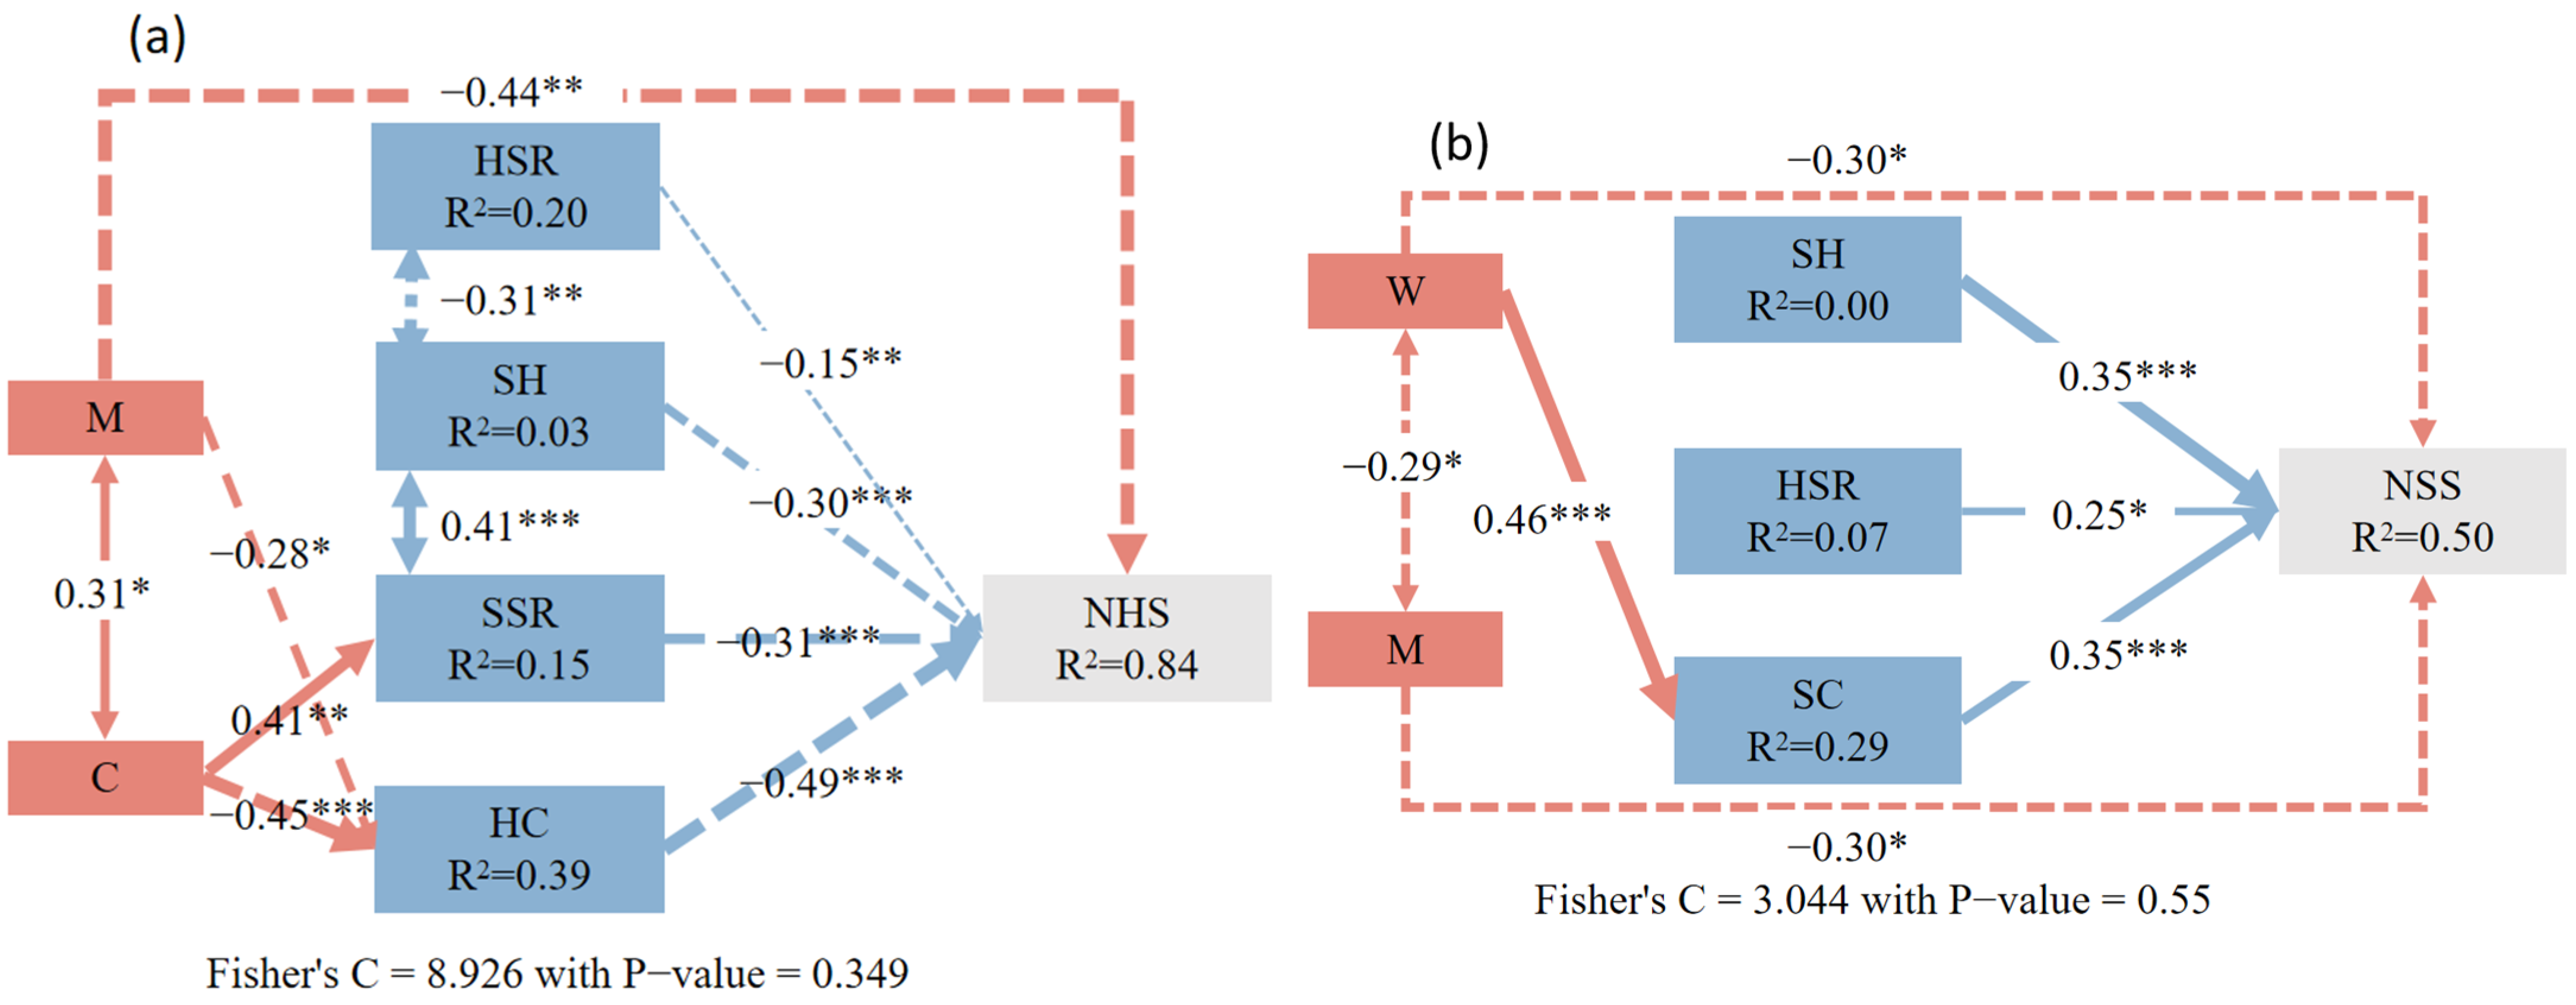
3.2. The Influence of Neighborhood Competition and Understory-Associated Vegetation on Natural Regeneration in the Shrub and Herb Layers

In the plots, there was considerable variability in the influencing factors of natural regeneration across different layers (Figure 3). Neighborhood competition and understory-associated vegetation collectively accounted for the majority of the explained variance proportion, with understory-associated vegetation exerting a greater influence on the shrub layer than the herb layer. Furthermore, the number of herb seedlings (NHS) was negatively correlated with the understory-associated vegetation factors, while the number of shrub saplings (NSS) showed a positive correlation with the understory-associated vegetation factors.
The optimal models for the number of herb seedlings (NHS) and the number of shrub saplings (NSS) exhibited high explained variances (Figure 3, R2c = 0.87 and R2c = 0.61, respectively). Neighborhood competition and understory-associated vegetation collectively accounted for 67.67% (Figure 3a) and 74.64% (Figure 3b) of the explained variance proportion in the two optimal models, respectively. A highly significant negative correlation was observed between the understory-associated vegetation and the number of herb seedlings (NHS, p < 0.001), with the effects of the shrub height (SH, 18.61%) and shrub species richness (SSR, 16.57%) surpassing those of the herb cover (HC, 7.89%) and herb species richness (HSR, 4.83%). Conversely, a significant positive correlation was observed between the number of herb seedlings (NHS) and understory-associated vegetation. The explained variance proportion of the shrub height (SH, 26.18%) and shrub cover (SC, 19.18%) exceeded that of the herb species richness (HSR, 7.56%). Overall, it was found that the influence of the shrub layer in the understory-associated vegetation on natural regeneration exceeded that of the herb layer.
The mingling index (M) exerted significant negative effects on natural regeneration in both layers (Figure 3a, 15.24%; Figure 3b, 13.85%). Additionally, the crowdedness index (C, 4.62%) increased the number of herb seedlings (NHS), while the uniform angle index (W, 7.87%) decreased the number of shrub saplings (NSS).
To better understand the coordinated contributions of neighborhood competition and understory-associated vegetation to natural regeneration in the herb and shrub layers, we further employed structural equation modeling (SEM) to quantify the path coefficients between neighborhood competition, understory-associated vegetation, and natural regeneration in both layers (Figure 4). The explained variances for the two models were R2c = 0.84 and R2c = 0.50, respectively, showing a relatively small decrease compared to the full model. Each neighborhood competition factor exerted direct or indirect effects on natural regeneration through understory-associated vegetation.
In the SEM for the number of herb seedlings (NHS, Figure 4a), the mingling index (M) significantly and directly influenced the number of herb seedlings (NHS, −0.44). However, it also indirectly affected the number of herb seedlings (NHS) positively by negatively impacting the herb cover (HC, −0.28). The crowdedness index (C) exerted a positive direct or indirect influence on the number of herb seedlings (NHS) by affecting various factors of understory-associated vegetation, ultimately leading to a positive effect (0.05) on the number of herb seedlings (NHS).
In the SEM for the number of shrub saplings (NSS, Figure 4b), the uniform angle index (W) indirectly and significantly influenced the shrub cover (SC, 0.46), resulting in a positive indirect effect on the NSS. However, the indirect effect was smaller than the direct effect (indirect effect 0.161 < direct effect −0.30). Therefore, the uniform angle index (W) still exhibited a negative impact on the NSS.

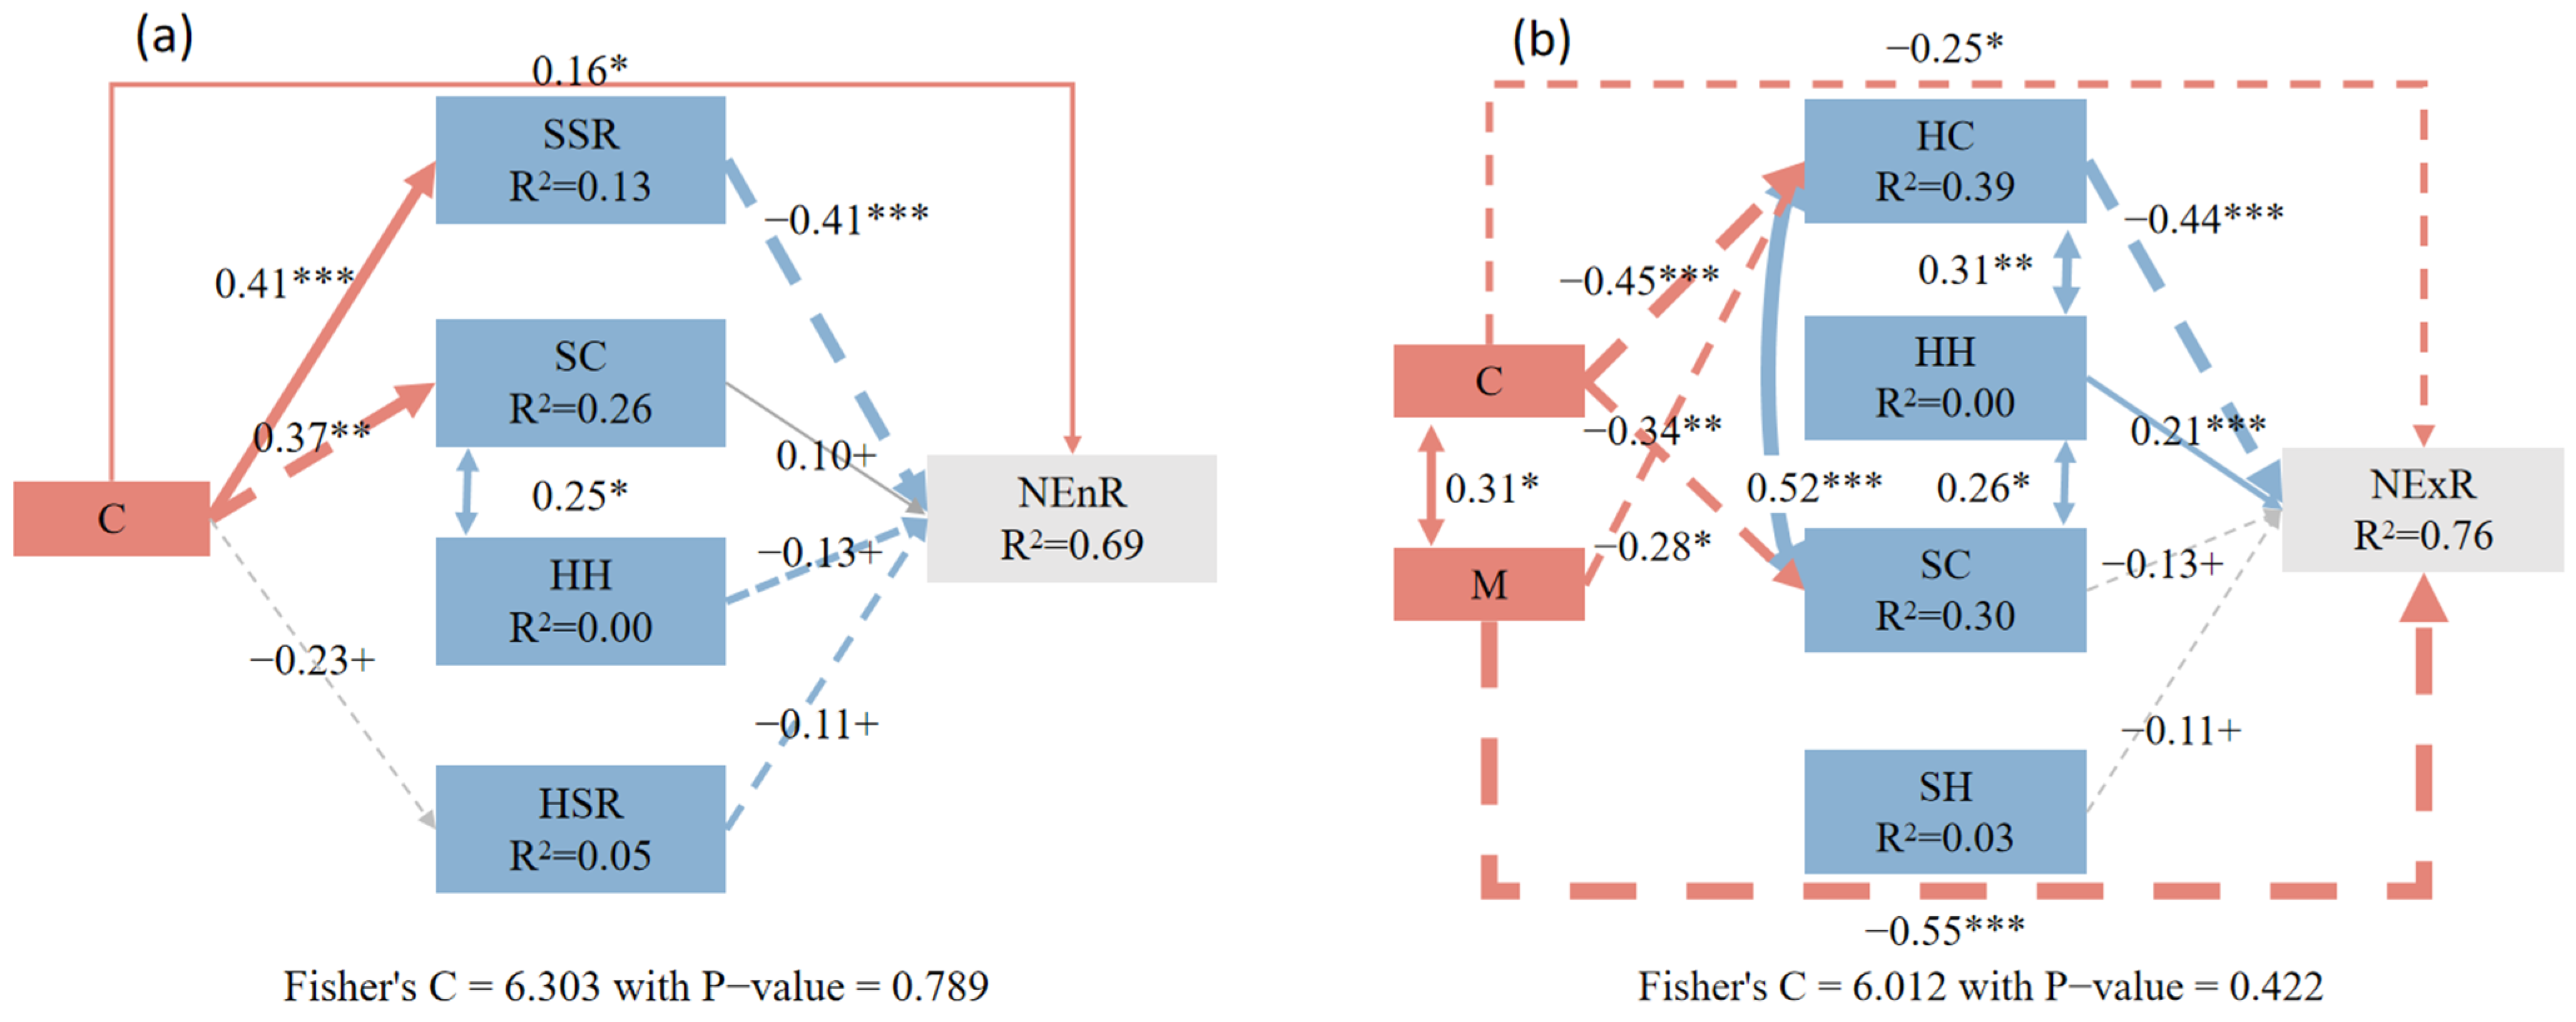
3.3. The Impact of Neighborhood Competition and Understory-Associated Vegetation on Natural Regeneration from Different Sources

There was significant variability in the factors influencing natural regeneration from different sources (Figure 5). Understory-associated vegetation dominated the optimal model for the number of endogenous regenerations (NEnR, R2c = 0.69), explaining 93.05% of the variance. Only the shrub cover (SC, 2.18%) showed a positive correlation with a relatively low explained variance proportion. However, in the optimal model for the number of exogenous regenerations (NExR, R2c = 0.83), the influence of understory-associated vegetation varied, with an overall lower explained variance proportion (10.71%) than that observed for the number of endogenous regenerations (NEnR). The shrub cover (SC, 1.8%) and herb height (HH, 2.54%) were positively correlated with the number of exogenous regenerations (NExR), while the shrub height (SH, 2.26%) and herb cover (HC, 3.87%) were negatively correlated.
Neighborhood competition factors also exhibited significant differences between the exogenous and endogenous tree natural regeneration. In the endogenous natural regeneration model (Figure 5a), the crowdedness index (C) had a positive effect on the number of endogenous regenerations (NEnR) but accounted for a low proportion of the explained variance, at only 0.25%. However, in the optimal model for the number of exogenous regenerations (NExR, Figure 5b), the neighborhood competition factors were the most important explanatory variables. The crowdedness index (C) and the mingling index (M), respectively, accounted for 4.08% (positively correlated) and 30.75% (negatively correlated) of the explained variance.
In the structural equation model (SEM) (Figure 6), the explained variances of the two models were R2c = 0.69 and R2c = 0.76, respectively, with less reduction compared to the full model. Each neighborhood competition factor directly or indirectly influenced natural regeneration through understory-associated vegetation.
In the SEM for the number of endogenous regenerations (NEnR, Figure 6a), the crowdedness index (C) had a significant direct effect (0.16), but C exerted a significant indirect effect through understory-associated vegetation factors (−0.15), explaining the low proportion of explained variance for C in the optimal model (Figure 5a). Similarly, in the SEM for the number of exogenous regenerations (NExR, Figure 6b), the crowdedness index (C) exhibited similar characteristics. C had a significant inhibitory effect on the NExR (−0.25), but C indirectly promoted the NExR by reducing the HC (herb cover, −0.45) and SC (shrub cover, −0.34). The mingling index (M, −0.55) had a highly significant direct negative effect on the NExR, with a relatively lower positive indirect effect through the HC (herb cover, −0.34) on the NExR.

4. Discussion

4.1. Impact of Environment, Climate, and Stand Structure on Natural Regeneration

At the mesoscale level, the stand structure was observed to have the least influence on natural regeneration, indicating that traditional stand structure metrics, such as tree density (TDEN) and average tree diameter at breast height (DBH), may be insufficient to explain natural regeneration.
Climate and environmental factors retained a significant influence, possibly due to variations at the mesoscale, which contrasts with findings from previous microscale studies [50]. The slope (SLO) exhibited significant and relatively important negative correlations with natural regeneration across different categories, which is similar to previous studies related to slope [51] (Figure 2b, Figure 3 and Figure 5b). Generally, steeper slopes were associated with diminished soil moisture and nutrient retention capacities [52,53], exacerbated by the prevalence of karst landforms in the study area, resulting in soil nutrient and water deficiencies unfavorable for natural regeneration [54]. Additionally, our study found that an increase in the mean annual precipitation (MAP) enhanced both the number of herb seedlings (NHS) and the number of exogenous regenerations (NExR) (Figure 3a and Figure 5b). Conversely, shady slopes had abundant seedlings and saplings, possibly due to increased solar radiation on the sunny slopes, leading to seasonal soil aridity and higher mortality rates [55,56]. Furthermore, an enhancement in the mean annual temperature (MAT) can lead to increased drought conditions, significantly reducing the number of herb seedlings (NHS) and the number of endogenous regenerations (NEnR) (Figure 3a and Figure 5a), negatively correlating with the forest regeneration potential within the plots (Figure 2).
Under the context of future climate warming and the prevalence of extreme drought conditions, greater attention should be directed towards forest natural regeneration to ensure the stability of forest communities’ age structures [57,58].

4.2. Direct and Indirect Effects of Neighborhood Competition Factors and Understory-Associated Vegetation on Natural Regeneration

Understory-associated vegetation emerged as a significant kind of explanatory variable in our study, accounting for up to 50% of the explained variance proportion in several optimal models. However, its influence on natural regeneration varied substantially among different categories. The number of herb seedlings (NHS, Figure 3a) and the number of endogenous regenerations (NEnR, Figure 5a) exhibited significant and substantial negative correlations with the understory-associated vegetation, whereas the number of shrub saplings (NSS, Figure 3b) showed a significant positive correlation with it. Previous studies have indicated that herbaceous plants tend to outcompete and reduce natural regeneration due to soil nutrient competition [59,60], and a significant positive correlation was shown only in the number of shrub saplings with higher competitive abilities (Figure 3b). In contrast, as areas with a higher shrub cover exhibited higher sapling numbers and regeneration numbers (Figure 2b and Figure 3b), forests had a better regeneration potential (Figure 2a). We hypothesized that more shrubs reduced the conspecific negative density dependence (CNDD) of naturally regenerating species [13]; shrubs could retain soil moisture or alter the microclimate under high temperatures [25], reducing browsing by phytophagous animals [61]. Therefore, we propose that the shrub cover could be used as an indicator of the potential for the natural regeneration of forests, and that management to promote the natural regeneration of forests should focus attention on areas with high shrub cover. In our study, neighborhood competition emerged as the second most important influencing factor following understory-associated vegetation. Compared to traditional forestry, neighborhood competition encompassed information regarding tree positions and spatial relationships among adjacent trees. These pieces of information directly or indirectly determined the intensity of competition among neighboring trees, exerting a significant impact on the natural regeneration process [62,63]. Our research revealed a significant decrease in the number of herb seedlings (NHS), shrub saplings (NSS), and exogenous natural regenerations (NexR) with increasing M (Figure 3 and Figure 5b). The observed decline has been hypothesized to result from elevated levels of the mingling index (M), which lead to intensified interspecific competition, particularly for light, indirectly reducing resources and thereby impeding natural regeneration [64]. A similar explanation may be drawn from the positive correlation between the mingling index (M) and Hegyi competition index (H) (Figure S5), where the number of herb seedlings (NHS), the number of endogenous regenerations (NEnR), and the number of exogenous regenerations (NExR) were significantly negatively affected by H, consistent with previous studies reporting a negative correlation between regeneration and the Hegyi competition index (H) [18].
In addition, an interesting phenomenon was observed in our results: the crowding index (C) showed greater indirect effects than direct effects on different types of natural regeneration. In single-factor regression, C (Figures S1 and S4) showed a significant negative correlation, while in multi-factor regression, C always showed a significant positive correlation. As shown in Figure 4a and Figure 6b, this difference may stem from indirect effects, where the reduction in C increases the herb cover (HC), and the competition between herbs and natural regeneration weakens natural regeneration [59,60]. Previous studies have also confirmed that the reduction in canopy openness and crowding caused by thinning may promote the colonization of other species in the understory, thereby offsetting the positive impact of larger forest gaps on natural regeneration [19,65]. However, our study further illustrates that reducing canopy crowding may even have detrimental effects on natural regeneration. Although logging is inevitable in forestry development, more attention should be paid to the management of understory-associated vegetation to ensure the natural regeneration of the forest [66].

4.3. Effects of Neighborhood Competition on Natural Regeneration of Shrub and Herb Layers

It is generally considered that taller saplings may possess stronger competitive abilities [28]. This point was also demonstrated in our study through the optimal model of differences in the regeneration capacity between saplings and seedlings that we established (Figure 7). The competition among the trees exerted a stronger negative impact on natural regeneration in terms of the number of herb seedlings (NHS, p < 0.1, 8.63%) due to its weaker competitive ability than that of the saplings. The diameter dominance index (U, 21.24%, Figure 7) has a significant negative effect on the number of naturally regenerating shrub seedlings. In the single-factor regression, there is a significant negative correlation between the diameter dominance index and the number of shrub seedlings (NSS, Figure S2), and a positive correlation between the diameter dominance index and the number of herb seedlings (NHS, Figure S1). It has been hypothesized that the dominance of smaller tree species with an increasing diameter dominance index (U) would lead to the competitive exclusion of saplings from renewal in the shrub layer due to their similar life forms and ecological niches [67]. The uniform angle index (W) of the neighborhood competition factor had a significant negative effect on all the types of natural regeneration (Figures S1–S4). When the trees were distributed in clumps (W > 0.517), the naturally regenerated seedlings were forced to survive in areas with higher localized upper-level competition due to the limitation of seed rain in the canopy [20], or colonization by exogenous wind-borne seeds colliding with the canopy [68]. As a result, the number of naturally regenerated seedlings was reduced. Overall, evenly distributed communities can effectively reduce forest competition and promote natural regeneration.

4.4. The Responses of Endogenous and Exogenous Regeneration to Various Factors

A highly significant negative correlation (90.9%, Figure 5a) was observed between the number of endogenous regenerations (NEnR) and understory-associated vegetation, whereas the explanatory variance for the number of exogenous regenerations (NExR) in understory-associated vegetation was notably lower at 10.8% (Figure 5b). The observed differences may be attributed to both endogenous and exogenous species composition variations. The top five importance values of endogenous regenerations were given to Quercus fabri, Cornus wilsoniana, Cunninghamia lanceolata, Ligustrum lucidum, and Cupressus funebris. Endogenously regenerating species, predominantly comprising pioneer species in early successional stages, exhibit a strong requirement for light and possess weak competitive abilities [69], making them more susceptible to the influence of understory-associated vegetation.
Exogenously regenerating species typically represent late successional species, commonly characterized by certain abilities such as dispersal, colonization, shade tolerance, or competition. The top five importance values of exogenous natural regeneration were given to Alangium chinense, Melia azedarach, Morus alba, Quercus fabri, and Robinia pseudoacacia. For instance, Robinia pseudoacacia demonstrates a strong environmental adaptability and seed germination capability [70], while Morus alba exhibits a high environmental adaptability to drought, infertility, and low temperatures [71]. Moreover, Melia azedarach produces numerous seeds and has strong dispersal capabilities, resulting in abundant seedlings [72]. Consequently, the number of exogenous regenerationd (NExR) is less influenced by understory-associated vegetation and more affected by other factors (Figure 5b). We speculate that this may be related to the mechanisms of seed dispersal. Generally, exogenous seed dispersal is influenced by environmental, climate, and stand structural factors [73]. In our study, areas with a higher mean annual precipitation (MAP, 25.17%) exhibited a greater number of exogenous regenerations (NExR), suggesting that seeds may be more extensively dispersed by water flow from outside the plot (Figure 5b) [73]. The crowdedness index (C, 3.94%) showed a positive correlation with the NexR, indicating that wind-dispersed seeds are more likely to collide with the canopy and become established in communities with a higher crowdedness index (C) [68,74].

4.5. Insights for Forestry Management

Based on our research, at the mesoscale regional level, neighborhood competition and understory-associated vegetation play a significant role in natural regeneration within forests. In the face of future climate warming and frequent extreme droughts, the potential and number of forest regenerations can be increased through effective forest stand and understory management strategies. It is generally observed that evenly distributed communities can effectively reduce competition within forests and enhance natural regeneration. The harvesting of larger trees can increase the density of seedling regenerations and improve the regeneration potential of forests, while the harvesting of smaller trees can promote the density of sapling regeneration and growth. Additionally, the management of understory-associated vegetation is crucial. We believe that a higher shrub cover represents areas suitable for understory natural regeneration. Additionally, the removal of associated herbs and the pruning of associated shrubs increase the number of herb seedlings (NHS) and the number of endogenous regenerations (NEnR), thus enhancing the natural regeneration potential of the forest, maintaining the stability of forest age structures. The retaining of understory-associated shrubs increases the number of shrub saplings (NSS) and provides the potential for them to grow into mature trees that can be added to the stand structure.

5. Conclusions

In mesoscale subtropical forests with environmental and climatic heterogeneity, understory-associated vegetation and neighborhood competition are the two most important influences on natural regeneration. In forests with clumped distribution (W), a high mingling index (M), and strong competition (H), the number of natural forest regenerations was significantly reduced. The crowdedness index (C) indirectly promoted the natural regeneration of the forest by suppressing the understory-associated herbs. The shrub cover (SC) improved the natural regeneration potential of forests, and areas with a high shrub cover were more suitable for natural regeneration. In short, considering future climate warming and frequent extreme droughts, the natural regeneration of forests would unavoidably be limited. Forest management should pay more attention to factors such as neighborhood competition and understory-associated vegetation, evenly distributed trees, minimal inter-tree competition, the removal of understory herbs, and the retention of specific shrubs to facilitate natural forest regeneration. These measures are essential for preserving forest ecosystem resilience and ensuring sustainable forest management practices amidst changing environmental conditions.

Supplementary Materials

The following supporting information can be downloaded at https://www.mdpi.com/article/10.3390/f15061017/s1, Table S1. Plots basic information of the explanatory variables; Figure S1: Relationships between the number of herb seedlings (NHS), understory-associated vegetation and neighborhood competition; Figure S2: Relationships between the number of shrub saplings (NSS), understory-associated vegetation and neighborhood competition; Figure S3: Relationships between the number of endogenous regenerations (NEnR), understory-associated vegetation and neighborhood competition; Figure S4: Relationships between the number of exogenous regenerations (NExR), understory-associated vegetation and neighborhood competition. Figure S5: Pearson’s correlation analysis of explanatory variable.

Author Contributions

Conceptualization, Z.W. and H.W.; methodology, Z.W. and K.Q.; software, Z.W.; investigation, Z.W. and K.Q.; writing—original draft preparation, Z.W.; writing—review and editing, H.W., K.Q. and Z.W.; visualization, Z.W.; supervision, H.W. and W.F.; funding acquisition, H.W. and W.F. All authors have read and agreed to the published version of the manuscript.

Funding

This study was supported by the Chongqing National Forest Reserve Effectiveness Monitoring and Scientific Research Experiment (No. 2023001121), funded by Chongqing Forestry Investment Development Co., Ltd.

Data Availability Statement

The data in this study are available from the authors upon request.

Acknowledgments

Sincere thanks to all the colleagues and students who participated in the field study!

Conflicts of Interest

Author Wen Fang is employed by the company Chongqing Forestry Investment Development Co., Ltd. And the company provided funding in this research. The remaining authors declare that the research was conducted in the absence of any commercial or financial relationships that could be construed as a potential conflict of interest. The funders had no role in the design of the study; in the collection, analyses, or interpretation of the data; in the writing of the manuscript; or in the decision to publish the results.

References

  1. Rahman, M.H.; Khan, M.A.S.A.; Roy, B.; Fardusi, M.J. Assessment of Natural Regeneration Status and Diversity of Tree Species in the Biodiversity Conservation Areas of Northeastern Bangladesh. J. For. Res. 2011, 22, 551–559. [Google Scholar] [CrossRef]
  2. Lewis, S.L.; Wheeler, C.E.; Mitchard, E.T.A.; Koch, A. Restoring Natural Forests Is the Best Way to Remove Atmospheric Carbon. Nature 2019, 568, 25–28. [Google Scholar] [CrossRef] [PubMed]
  3. Johnson, D.J.; Magee, L.; Pandit, K.; Bourdon, J.; Broadbent, E.N.; Glenn, K.; Kaddoura, Y.; Machado, S.; Nieves, J.; Wilkinson, B.E.; et al. Canopy Tree Density and Species Influence Tree Regeneration Patterns and Woody Species Diversity in a Longleaf Pine Forest. For. Ecol. Manag. 2021, 490, 119082. [Google Scholar] [CrossRef]
  4. Pham, V.V.; Ammer, C.; Annighöfer, P.; Heinrichs, S. Tree Regeneration Characteristics in Limestone Forests of the Cat Ba National Park, Vietnam. BMC Ecol. Evol. 2022, 22, 6. [Google Scholar] [CrossRef] [PubMed]
  5. Shive, K.L.; Preisler, H.K.; Welch, K.R.; Safford, H.D.; Butz, R.J.; O’Hara, K.L.; Stephens, S.L. From the Stand Scale to the Landscape Scale: Predicting the Spatial Patterns of Forest Regeneration after Disturbance. Ecol. Appl. 2018, 28, 1626–1639. [Google Scholar] [CrossRef] [PubMed]
  6. Chazdon, R.L.; Broadbent, E.N.; Rozendaal, D.M.A.; Bongers, F.; Zambrano, A.M.A.; Aide, T.M.; Balvanera, P.; Becknell, J.M.; Boukili, V.; Brancalion, P.H.S.; et al. Carbon Sequestration Potential of Second-Growth Forest Regeneration in the Latin American Tropics. Sci. Adv. 2016, 2, e1501639. [Google Scholar] [CrossRef]
  7. Martini, F.; Zou, C.; Goodale, U.M. Intrinsic Biotic Factors and Microsite Conditions Drive Seedling Survival in a Species with Masting Reproduction. Ecol. Evol. 2019, 9, 14261–14272. [Google Scholar] [CrossRef] [PubMed]
  8. Zhao, G.; Shen, Y.; Liu, W.; Tan, B.; Li, Z.; Wang, Q. Quantifying the Effect of Shading and Watering on Seed Germination in Translocated Forest Topsoil at a Subtropical Karst of China. For. Ecol. Manag. 2020, 459, 117811. [Google Scholar] [CrossRef]
  9. Liang, W.; Wei, X. Multivariate Path Analysis of Factors Influencing Larix principis-rupprechtii Plantation Regeneration in Northern China. Ecol. Indic. 2021, 129, 107886. [Google Scholar] [CrossRef]
  10. Duan, R.-Y.; Wang, X.-A.; Tu, Y.-B.; Huang, M.-Y.; Wang, C.; Zhu, Z.-H.; Guo, H. Recruitment pattern of tree populations along an altitudinal gradient: Larix chinensis beissn in qinling mountains (China). Pol. J. Ecol. 2009, 57, 451–459. [Google Scholar]
  11. Li, J.; Li, S.; Liu, C.; Guo, D.; Zhang, Q. Response of Chinese Pine Regeneration Density to Forest Gap and Slope Aspect in Northern China: A Meta-Analysis. Sci. Total Environ. 2023, 873, 162428. [Google Scholar] [CrossRef] [PubMed]
  12. Liang, W.; Feng, Y.; Li, F.; Zhao, Y.; Zhu, J.; Yao, J.; Chang, C.; Wei, X. Drivers of Vegetation and Soil Determine Natural Regeneration of a Single Plantation at Different Slope Positions. Front. For. Glob. Chang. 2023, 6, 1167284. [Google Scholar] [CrossRef]
  13. Liu, H.; Shi, H.; Zhou, Q.; Hu, M.; Shu, X.; Zhang, K.; Zhang, Q.; Dang, H. Habitat Heterogeneity and Biotic Interactions Mediate Climate Influences on Seedling Survival in a Temperate Forest. For. Ecosyst. 2023, 10, 100138. [Google Scholar] [CrossRef]
  14. Lv, K.; Zhou, M.; Ding, Y.; Zang, R.; Yao, J.; Luo, Y.; Yan, D. Regeneration Characteristics and Influencing Factors of Woody Plant on Natural Evergreen Secondary Broad-Leaved Forests in the Subtropical, China. Glob. Ecol. Conserv. 2023, 42, e02394. [Google Scholar] [CrossRef]
  15. Yu, F.; Wang, D.; Shi, X.; Yi, X.; Huang, Q.; Hu, Y. Effects of Environmental Factors on Tree Seedling Regeneration in a Pine-Oak Mixed Forest in the Qinling Mountains, China. J. Mt. Sci. 2013, 10, 845–853. [Google Scholar] [CrossRef]
  16. Zhao, W.; Sun, Y.; Gao, Y. Potential Factors Promoting the Natural Regeneration of Larix principis-rupprechtii in North China. PeerJ 2023, 11, e15809. [Google Scholar] [CrossRef]
  17. Coomes, D.A.; Grubb, P.J. Impacts of root competition in forests and woodlands: A theoretical framework and review of experiments. Ecol. Monogr. 2000, 70, 171–207. [Google Scholar] [CrossRef]
  18. He, W.; Wang, Y.; Wang, X.; Wen, X.; Li, T.; Ye, M.; Chen, G.; Zhao, K.; Hou, G.; Li, X.; et al. Stand Structure Adjustment Influences the Biomass Allocation in Naturally Generated Pinus massoniana Seedlings through Environmental Factors. Front. Plant Sci. 2022, 13, 997795. [Google Scholar] [CrossRef]
  19. Royo, A.A.; Carson, W.P. On the Formation of Dense Understory Layers in Forests Worldwide: Consequences and Implications for Forest Dynamics, Biodiversity, and Succession. Can. J. For. Res. 2006, 36, 1345–1362. [Google Scholar] [CrossRef]
  20. Gonçalves, A.C.; Fonseca, T.F. Influence Management and Disturbances on the Regeneration of Forest Stands. Front. For. Glob. Change 2023, 6, 1123215. [Google Scholar] [CrossRef]
  21. Whigham, D.F. Ecology of Woodland Herbs in Temperate Deciduous Forests. Annu. Rev. Ecol. Evol. Syst. 2004, 35, 583–621. [Google Scholar] [CrossRef]
  22. Salek, L.; Harmacek, J.; Jerabkova, L.; Topacoglu, O.; Machar, I. Thorny Shrubs Limit the Browsing Pressure of Large Herbivores on Tree Regeneration in Temperate Lowland Forested Landscapes. Sustainability 2019, 11, 3578. [Google Scholar] [CrossRef]
  23. De Lombaerde, E.; Baeten, L.; Verheyen, K.; Perring, M.P.; Ma, S.; Landuyt, D. Understorey Removal Effects on Tree Regeneration in Temperate Forests: A Meta-Analysis. J. Appl. Ecol. 2021, 58, 9–20. [Google Scholar] [CrossRef]
  24. O’Brien, M.J.; O’Hara, K.L.; Erbilgin, N.; Wood, D.L. Overstory and Shrub Effects on Natural Regeneration Processes in Native Pinus radiata Stands. For. Ecol. Manag. 2007, 240, 178–185. [Google Scholar] [CrossRef]
  25. Rodríguez-García, E.; Ordóñez, C.; Bravo, F. Effects of Shrub and Canopy Cover on the Relative Growth Rate of Pinus pinaster Ait. Seedlings of Different Sizes. Ann. For. Sci. 2011, 68, 337–346. [Google Scholar] [CrossRef]
  26. Tíscar Oliver, P. Patterns of Shrub Diversity and Tree Regeneration across Topographic and Stand-Structural Gradients in a Mediterranean Forest. For. Syst. 2015, 24, 011. [Google Scholar] [CrossRef]
  27. Pu, X.; Zhu, Y.; Jin, G. Effects of Local Biotic Neighbors and Habitat Heterogeneity on Seedling Survival in a Spruce-fir Valley Forest, Northeastern China. Ecol. Evol. 2017, 7, 4582–4591. [Google Scholar] [CrossRef] [PubMed]
  28. Metslaid, M.; Ilisson, T.; Vicente, M.; Nikinmaa, E.; Jogiste, K. Growth of Advance Regeneration of Norway Spruce after Clear-Cutting. Tree Physiol. 2005, 25, 793–801. [Google Scholar] [CrossRef] [PubMed]
  29. Queenborough, S.A.; Burslem, D.F.R.P.; Garwood, N.C.; Valencia, R. Neighborhood and community interactions determine the spatial pattern of tropical tree seedling survival. Ecology 2007, 88, 2248–2258. [Google Scholar] [CrossRef]
  30. McAlpine, K.; Lamoureaux, S.; Timmins, S. Understory Vegetation Provides Clues to Succession in Woody Weed Stands. NZJE 2021, 45, 3418. [Google Scholar] [CrossRef]
  31. Douh, C.; Daïnou, K.; Joël Loumeto, J.; Moutsambote, J.-M.; Fayolle, A.; Tosso, F.; Forni, E.; Gourlet-Fleury, S.; Doucet, J.-L. Soil Seed Bank Characteristics in Two Central African Forest Types and Implications for Forest Restoration. For. Ecol. Manag. 2018, 409, 766–776. [Google Scholar] [CrossRef]
  32. Kurten, E.L.; Wright, S.J.; Carson, W.P. Hunting Alters Seedling Functional Trait Composition in a Neotropical Forest. Ecology 2015, 96, 1923–1932. [Google Scholar] [CrossRef]
  33. Peres, C.A.; Emilio, T.; Schietti, J.; Desmoulière, S.J.M.; Levi, T. Dispersal Limitation Induces Long-Term Biomass Collapse in Overhunted Amazonian Forests. Proc. Natl. Acad. Sci. USA 2016, 113, 892–897. [Google Scholar] [CrossRef] [PubMed]
  34. Hua, F.; Bruijnzeel, L.A.; Meli, P.; Martin, P.A.; Zhang, J.; Nakagawa, S.; Miao, X.; Wang, W.; McEvoy, C.; Peña-Arancibia, J.L.; et al. The Biodiversity and Ecosystem Service Contributions and Trade-Offs of Forest Restoration Approaches. Science 2022, 376, 839–844. [Google Scholar] [CrossRef]
  35. Felton, A.; Nilsson, U.; Sonesson, J.; Felton, A.M.; Roberge, J.-M.; Ranius, T.; Ahlström, M.; Bergh, J.; Björkman, C.; Boberg, J.; et al. Replacing Monocultures with Mixed-Species Stands: Ecosystem Service Implications of Two Production Forest Alternatives in Sweden. Ambio 2016, 45, 124–139. [Google Scholar] [CrossRef]
  36. Li, L.; Qi, Z.; Zhong, T. Forest Transition and Its Dynamics in Subtropical Chongqing, China since 1990s. Land 2021, 10, 777. [Google Scholar] [CrossRef]
  37. Zhang, H.; Chen, S.; Zheng, X.; Ge, X.; Li, Y.; Fang, Y.; Cui, P.; Ding, H. Neighborhood Diversity Structure and Neighborhood Species Richness Effects Differ across Life Stages in a Subtropical Natural Secondary Forest. For. Ecosyst. 2022, 9, 100075. [Google Scholar] [CrossRef]
  38. Hui, G.; Wang, Y.; Zhang, G.; Zhao, Z.; Bai, C.; Liu, W. A Novel Approach for Assessing the Neighborhood Competition in Two Different Aged Forests. For. Ecol. Manag. 2018, 422, 49–58. [Google Scholar] [CrossRef]
  39. Lv, T.; Zhao, R.; Wang, N.; Xie, L.; Feng, Y.; Li, Y.; Ding, H.; Fang, Y. Spatial Distributions of Intra-Community Tree Species under Topographically Variable Conditions. J. Mt. Sci. 2023, 20, 391–402. [Google Scholar] [CrossRef]
  40. Hui, G.; Zhang, G.; Zhao, Z.; Yang, A. Methods of Forest Structure Research: A Review. Curr. For. Rep. 2019, 5, 142–154. [Google Scholar] [CrossRef]
  41. Sun, Z.; Wang, Y.; Pan, L.; Sun, Y. Hegyi Competition Index Decomposition to Improve Estimation Accuracy of Larix olgensis Crown Radius. Ecol. Indic. 2022, 143, 109322. [Google Scholar] [CrossRef]
  42. Fox, J.; Monette, G. Generalized Collinearity Diagnostics. J. Am. Stat. Assoc. 1992, 87, 178–183. [Google Scholar] [CrossRef]
  43. Zuur, A.; Ieno, E.; Walker, N.; Saveliev, A.; Smith, G. Mixed Effects Models and Extensions in Ecology with R; Springer: New York, NY, USA, 2009. [Google Scholar]
  44. Guimarães-Steinicke, C.; Weigelt, A.; Proulx, R.; Lanners, T.; Eisenhauer, N.; Duque-Lazo, J.; Reu, B.; Roscher, C.; Wagg, C.; Buchmann, N.; et al. Biodiversity Facets Affect Community Surface Temperature via 3D Canopy Structure in Grassland Communities. J. Ecol. 2021, 109, 1969–1985. [Google Scholar] [CrossRef]
  45. García-Palacios, P.; Gross, N.; Gaitán, J.; Maestre, F.T. Climate Mediates the Biodiversity–Ecosystem Stability Relationship Globally. Proc. Natl. Acad. Sci. USA 2018, 115, 8400–8405. [Google Scholar] [CrossRef] [PubMed]
  46. Wang, Z.; Zheng, R.; Yang, L.; Tan, T.; Li, H.; Liu, M. Elevation Gradient Distribution of Indices of Tree Population in a Montane Forest: The Role of Leaf Traits and the Environment. For. Ecosyst. 2022, 9, 100012. [Google Scholar] [CrossRef]
  47. Lai, J.; Zou, Y.; Zhang, S.; Zhang, X.; Mao, L. Glmm.Hp: An R Package for Computing Individual Effect of Predictors in Generalized Linear Mixed Models. J. Plant Ecol. 2022, 15, 1302–1307. [Google Scholar] [CrossRef]
  48. Atsbha, T.; Desta, A.B.; Zewdu, T. Woody Species Diversity, Population Structure, and Regeneration Status in the Gra-Kahsu Natural Vegetation, Southern Tigray of Ethiopia. Heliyon 2019, 5, e01120. [Google Scholar] [CrossRef] [PubMed]
  49. Grace, J. Structural Equation Modeling and Natural Systems-All Databases; Cambridge University Press: Cambridge, UK, 2006. [Google Scholar]
  50. Liang, W.; Wei, X. Factors Promoting the Natural Regeneration of Larix principis-rupprechtii Plantation in the Lvliang Mountains of Central China. PeerJ 2020, 8, e9339. [Google Scholar] [CrossRef] [PubMed]
  51. Wang, J.; Wang, H.; Cao, Y.; Bai, Z.; Qin, Q. Effects of Soil and Topographic Factors on Vegetation Restoration in Opencast Coal Mine Dumps Located in a Loess Area. Sci. Rep. 2016, 6, 22058. [Google Scholar] [CrossRef]
  52. Gastauer, M.; Massante, J.C.; Ramos, S.J.; Da Silva, R.D.S.S.; Boanares, D.; Guedes, R.S.; Caldeira, C.F.; Medeiros-Sarmento, P.S.; De Castro, A.F.; Prado, I.G.D.O.; et al. Revegetation on Tropical Steep Slopes after Mining and Infrastructure Projects: Challenges and Solutions. Sustainability 2022, 14, 17003. [Google Scholar] [CrossRef]
  53. Wang, L.; Li, Y.; Wu, J.; An, Z.; Suo, L.; Ding, J.; Li, S.; Wei, D.; Jin, L. Effects of the Rainfall Intensity and Slope Gradient on Soil Erosion and Nitrogen Loss on the Sloping Fields of Miyun Reservoir. Plants 2023, 12, 423. [Google Scholar] [CrossRef]
  54. Qi, Y.; Zhang, T.; Yu, L.; Li, Y.; Zhang, G. Spatial Patterns of Community-Level Sprouting in a Karst Old-Growth Forest of Southwest China. For. Ecol. Manag. 2022, 523, 120516. [Google Scholar] [CrossRef]
  55. Warren, R.J. Mechanisms Driving Understory Evergreen Herb Distributions across Slope Aspects: As Derived from Landscape Position. Plant Ecol. 2008, 198, 297–308. [Google Scholar] [CrossRef]
  56. Badano, E.I.; Sánchez-Montes de Oca, E.J. Seed Fate, Seedling Establishment and the Role of Propagule Size in Forest Regeneration under Climate Change Conditions. For. Ecol. Manag. 2022, 503, 119776. [Google Scholar] [CrossRef]
  57. Rank, R.; Maneta, M.; Higuera, P.; Holden, Z.; Dobrowski, S. Conifer Seedling Survival in Response to High Surface Temperature Events of Varying Intensity and Duration. Front. For. Glob. Chang. 2022, 4, 731267. [Google Scholar] [CrossRef]
  58. Will, R.E.; Wilson, S.M.; Zou, C.B.; Hennessey, T.C. Increased Vapor Pressure Deficit Due to Higher Temperature Leads to Greater Transpiration and Faster Mortality during Drought for Tree Seedlings Common to the Forest–Grassland Ecotone. New Phytol. 2013, 200, 366–374. [Google Scholar] [CrossRef] [PubMed]
  59. Chmura, D.; Sierka, E. The Invasibility of Deciduous Forest Communities after Disturbance: A Case Study of Carex Brizoides and Impatiens Parviflora Invasion. For. Ecol. Manag. 2007, 242, 487–495. [Google Scholar] [CrossRef]
  60. Lyon, J.; Sharpe, W.E. Impacts of Hay-Scented Fern on Nutrition of Northern Red Oak Seedlings. J. Plant Nutr. 2003, 26, 487–502. [Google Scholar] [CrossRef]
  61. Jensen, A.M.; Gotmark, F.; Lof, M. Shrubs Protect Oak Seedlings against Ungulate Browsing in Temperate Broadleaved Forests of Conservation Interest: A Field Experiment. For. Ecol. Manag. 2012, 266, 187–193. [Google Scholar] [CrossRef]
  62. Liu, N.; Wang, D.; Guo, Q. Exploring the Influence of Large Trees on Temperate Forest Spatial Structure from the Angle of Mingling. For. Ecol. Manag. 2021, 492, 119220. [Google Scholar] [CrossRef]
  63. Dong, L.; Bettinger, P.; Liu, Z. Optimizing Neighborhood-Based Stand Spatial Structure: Four Cases of Boreal Forests. For. Ecol. Manag. 2022, 506, 119965. [Google Scholar] [CrossRef]
  64. Fichtner, A.; Härdtle, W.; Li, Y.; Bruelheide, H.; Kunz, M.; Von Oheimb, G. From Competition to Facilitation: How Tree Species Respond to Neighbourhood Diversity. Ecol. Lett. 2017, 20, 892–900. [Google Scholar] [CrossRef] [PubMed]
  65. Beckage, B.; Lavine, M.; Clark, J.S. Survival of Tree Seedlings across Space and Time: Estimates from Long-term Count Data. J. Ecol. 2005, 93, 1177–1184. [Google Scholar] [CrossRef]
  66. Gavinet, J.; Prévosto, B.; Fernandez, C. Do Shrubs Facilitate Oak Seedling Establishment in Mediterranean Pine Forest Understory? For. Ecol. Manag. 2016, 381, 289–296. [Google Scholar] [CrossRef]
  67. Zhu, Y.; Queenborough, S.A.; Condit, R.; Hubbell, S.P.; Ma, K.P.; Comita, L.S. Density-Dependent Survival Varies with Species Life-History Strategy in a Tropical Forest. Ecol. Lett. 2018, 21, 506–515. [Google Scholar] [CrossRef] [PubMed]
  68. Kaproth, M.A.; McGraw, J.B. Seed Viability and Dispersal of the Wind-Dispersed Invasive Ailanthus altissima in Aqueous Environments. For. Sci. 2008, 54, 490–496. [Google Scholar] [CrossRef]
  69. Xiang, W.; Liu, S.; Lei, X.; Frank, S.C.; Tian, D.; Wang, G.; Deng, X. Secondary Forest Floristic Composition, Structure, and Spatial Pattern in Subtropical China. J. For. Res. 2013, 18, 111–120. [Google Scholar] [CrossRef]
  70. Lu, C.; Li, L.; Liu, X.; Chen, M.; Wan, S.; Li, G. Salt Stress Inhibits Photosynthesis and Destroys Chloroplast Structure by Downregulating Chloroplast Development–Related Genes in Robinia pseudoacacia Seedlings. Plants 2023, 12, 1283. [Google Scholar] [CrossRef] [PubMed]
  71. Hui-hui, Z.; Guang-liang, S.; Jie-yu, S.; Xin, L.; Ma-bo, L.; Liang, M.; Nan, X.; Guang-yu, S. Photochemistry and Proteomics of Mulberry (Morus alba L.) Seedlings under NaCl and NaHCO3 Stress. Ecotoxicol. Environ. Saf. 2019, 184, 109624. [Google Scholar] [CrossRef]
  72. Bhatt, A.; Gairola, S.; Govender, Y.; De Moura Souza-Filho, P.R. The Invasive Melia Azedarach in Durban (South Africa): Impacts on Tree Community Structure. Folia Geobot. 2021, 56, 139–147. [Google Scholar] [CrossRef]
  73. Kim, M.; Lee, S.; Lee, S.; Yi, K.; Kim, H.-S.; Chung, S.; Chung, J.; Kim, H.S.; Yoon, T.K. Seed Dispersal Models for Natural Regeneration: A Review and Prospects. Forests 2022, 13, 659. [Google Scholar] [CrossRef]
  74. Zhu, J.; Liu, M.; Xin, Z.; Liu, Z.; Schurr, F.M. A Trade-off between Primary and Secondary Seed Dispersal by Wind. Plant Ecol. 2019, 220, 541–552. [Google Scholar] [CrossRef]
Figure 1. Location and distribution of permanent plots in Chongqing.
Forests 15 01017 g001
Figure 2. The optimal models and relative importance of various types of explanatory variables: (a) regeneration potential, (b) number of tree regenerations (NTR). The points and error bars represent the mean parameter estimates (standardized regression coefficients) of the predicted variables along with their associated 95% confidence intervals. The relative importance of each explanatory variable category (expressed as a percentage of explained variance) and the relative importance of each explanatory variable (expressed as a percentage of explained variance) are presented. + p < 0.1; * p < 0.05; ** p < 0.01; *** p < 0.001. SC: shrub cover, SH: shrub height, SSR: shrub species richness, HC: herb cover, HSR: herb species richness, U: the diameter dominance index, C: the crowdedness index, M: the mingling index, W: the uniform angle index, ATH: average tree height, DBH: average diameter at breast height, MAP: mean annual precipitation, MAT: mean annual temperature, TRASP: transformation aspect, ALT: altitude, SLO: slope.
Forests 15 01017 g002
Figure 3. The optimal models and relative importance of various explanatory variables: (a) The number of herb seedlings (NHS); (b) the number of shrub saplings (NSS). The points and error bars represent the mean parameter estimates (standardized regression coefficients) of the predicted variables along with their associated 95% confidence intervals. The relative importance of each explanatory variable category (expressed as a percentage of explained variance) and the relative importance of each explanatory variable (expressed as a percentage of explained variance) are presented. * p < 0.05; ** p < 0.01; *** p < 0.001. HC: herb cover, HSR: herb species richness, SH: shrub height, SC: shrub cover, SSR: shrub species richness, C: the crowdedness index, M: the mingling index, W: the uniform angle index, DBH: average tree diameter at breast height, TDEN: tree density, MAP: mean annual precipitation, MAT: mean annual temperature, TRASP: transformation aspect, SLO: slope.
Forests 15 01017 g003
Figure 4. Structural equation modeling of the effects of neighborhood competition and understory-associated vegetation on understory natural regeneration: (a) The number of herb seedlings (NHS) with Fisher’s C = 8.926 and p-value = 0.349; (b) the number of shrub saplings (NSS) with Fisher’s C = 3.044 and p-value = 0.55. Colored single arrows indicate significant positive pathways between factors, while colored double arrows represent correlations between factors, with solid lines indicating positive correlations and dashed lines indicating negative correlations. The numbers on the arrows denote standardized path coefficients, and the thickness of the lines is proportional to the strength of the relationship. Gray indicates non-significance but p < 0.1, while colored lines indicate significance, with symbols indicating significance levels: * p < 0.05, ** p < 0.01, *** p < 0.001. HC: herb cover, HSR: herb species richness, SH: shrub height, SC: shrub cover, SSR: shrub species richness, C: the crowdedness index, M: the mingling index, W: the uniform angle index.
Forests 15 01017 g004
Figure 5. The optimal models and relative importance of various explanatory variables: (a) the number of endogenous regeneration (NEnR); (b) the number of exogenous regeneration (NExR). The points and error bars represent the mean parameter estimates (standardized regression coefficients) of the predicted variables along with their associated 95% confidence intervals. The relative importance of each explanatory variable category (expressed as a percentage of explained variance) and the relative importance of each explanatory variable (expressed as a percentage of explained variance) are presented. * p < 0.05; ** p < 0.01; *** p < 0.001. HH: herb height, HC: herb cover, HSR: herb species richness, SH: shrub height, SC: shrub cover, SSR: shrub species richness, C: the crowdedness index, M: the mingling index, DBH: average tree diameter at breast height, TDEN: tree density, MAP: mean annual precipitation, MAT: mean annual temperature, TRASP: transformation aspect, SLO: slope.
Forests 15 01017 g005
Figure 6. Structural equation modeling of the effects of neighborhood competition and understory-associated vegetation on understory natural regeneration: (a) The number of endogenous regenerations (NEnR) with Fisher’s C = 6.303 with p-value = 0.789, (b) the number of exogenous regenerations (NExR) with Fisher’s C = 6.012 with p-value = 0.422. Colored single arrows indicate significant positive pathways between factors, while colored double arrows represent correlations between factors, with solid lines indicating positive correlations and dashed lines indicating negative correlations. The numbers on the arrows denote standardized path coefficients, and the thickness of the lines is proportional to the strength of the relationship. Gray indicates non-significance but p < 0.1, while colored lines indicate significance, with symbols indicating significance levels: + p < 0.1, * p < 0.05, ** p < 0.01, *** p < 0.001. HH: herb height, HC: herb cover, HSR: herb species richness, SH: shrub height, SC: shrub cover, SSR: shrub species richness, C: the crowdedness index, M: the mingling index.
Forests 15 01017 g006
Figure 7. The optimal models and relative importance of various explanatory variables in regeneration between shrub and herb layers. The points and error bars represent the mean parameter estimates (standardized regression coefficients) of the predicted variables along with their associated 95% confidence intervals. The relative importance of each explanatory variable category (expressed as a percentage of explained variance) and the relative importance of each explanatory variable (expressed as a percentage of explained variance) is presented. + p < 0.1; * p < 0.05; U: the diameter dominance index, W: the uniform angle index, H: Hegyi competition index, TRASP: transformation aspect, SLO: slope.
Forests 15 01017 g007
Table 1. Categorization, selection, and abbreviation of explanatory variables.
CategoriesNo.Explanatory
Variables
EquationNote
Environmental factors(1)Slope (SLO, °) Multiple measurements were averaged using a compass in the plot.
(2)Altitude (ALT, m) The altitude of permanent plots was measured using GPS within the plot,
(3)Transformation aspect (TRASP) T R A S P = 1 c o s [ π ( A S P i 30 ) / 180 ] 2 where ASPi denotes the aspect of the plot i. After conversion, 0 is a sunny slope and 1 is a shady slope.
Climate factors(4)Mean annual temperature (MAT, °C) Mean annual temperature data at 1 km resolution from WorldClim 2.1 https://worldclim.org/ (accessed on 10 February 2024).
(5)Mean annual precipitation (MAP, mm) Mean annual precipitation data at 1 km resolution from WorldClim 2.1 https://worldclim.org/ (accessed on 10 February 2024).
Stand structure(6)Tree density (TDEN, stems/plot) Tree density for which DBH > 5 cm.
(7)Average tree diameter at breast height (DBH, cm) Using vernier calipers, the diameter at breast height (DBH > 5 cm) of each tree at 1.3 m was measured, and the average DBH was calculated.
(8)Average tree height (ATH, m) Using a laser rangefinder (Tianjin Lookout Photoelectric 3M02–600), the height of each tree (DBH > 5 cm) was measured, and the mean ATH was calculated.
(9)Tree species richness (TSS) Tree species richness for which DBH > 5 cm.
Neighborhood competition(10)The uniform angle index (W) W = W i ¯
W i = 1 4 j = 1 4 K i j
K i j = 0 ,   if   α i j > 72 ° 1 ,   otherwise
αij represents the angle formed between the reference tree and its two neighboring trees out of the four nearest trees. i denotes the nth reference tree, while j denotes the nth of the four nearest trees to the reference tree, with n = 1, 2, 3, 4 [37].
(11)The diameter dominance index (U) U = U i ¯
U i = 1 4 j = 1 4 K i j
K i j = 0 ,   if   D i > D j 1 ,   otherwise
Di represents the diameter at breast height (DBH) of the reference tree, while Dj represents the DBH of one of the four nearest trees to the reference tree. Here, i indicates the nth tree within the subplot, and j indicates the nth of the four nearest trees to the reference tree, where n = 1, 2, 3, 4 [38].
(12)The mingling index (M) M = M i ¯
M i = 1 4 j = 1 4 K i j
K i j = 0 ,   if   s p e c i e s i = s p e c i e s k 1 ,   otherwise
speciesi represents the species of the reference tree, while speciesj represents the species of one of the four nearest trees to the reference tree. Here, i denotes the nth tree within the subplot, and j denotes the nth of the four nearest trees to the reference tree, where n = 1, 2, 3, 4 [39].
(13)The crowdedness index (C) C = C i ¯
C i = 1 4 j = 1 4 K i j
K i j = 0 ,   if   ( C W i + C W k ) / 2 < d i j 1 ,   otherwise
i represents the nth tree within the subplot, and j represents the nth of the four nearest trees to the reference tree, where n = 1,2,3,4. CW denotes the average canopy width of the trees, and dij represents the distance between the reference tree and its adjacent tree [40].
(14)Hegyi competition index (H) H = H i ¯
H i = 1 4 j = 1 4 K i j
K i j = j = 1 4 ( D j D i × 1 d i j )
i represents the nth tree within the subplot, and j represents the nth of the four nearest trees to the reference tree, where n = 1,2,3,4. D denotes the diameter at breast height (DBH) of the tree, and dij is the distance between the reference tree and its adjacent tree [41].
Understory-associated vegetation(15)Shrub height (SH, m) The average height of plants between 1.2 and 5 m, excluding natural regeneration saplings.
(16)Shrub cover (SC, %) The coverage of plants between 1.2 and 5 m in height, excluding natural regeneration saplings.
(17)Shrub species richness (SSR) The species richness of all plants excluding natural regeneration saplings with heights between 1.2 and 5 m.
(18)Herb height (HH, m) The average height of plants below 1.2 m, excluding naturally regenerated seedlings.
(19)Herb cover (HC, %) The coverage of plants below 1.2 m in height, excluding natural regeneration seedlings.
(20)Herb species richness (HSR) The species richness of plants below 1.2 m in height, excluding naturally regenerated seedlings.
Table 2. Basic information on natural regeneration.
Mean (Stems/Plot)S.D.CV (%)MaxMin
NTR10.6 11.4 108.0 54.0 0.0
NHS7.9 10.8 136.7 46.0 0.0
NSS2.7 2.9 108.2 14.0 0.0
NEnR4.6 6.8 145.9 30.0 0.0
NExR6.0 8.9 150.3 54.0 0.0
S.D., standard deviation; CV, coefficient of variation, NTR: number of tree regenerations, NHS: number of herb seedlings, NSS: number of shrub saplings (NSS), NEnR: number of endogenous regenerations, NExR: number of exogenous regenerations.
Disclaimer/Publisher’s Note: The statements, opinions and data contained in all publications are solely those of the individual author(s) and contributor(s) and not of MDPI and/or the editor(s). MDPI and/or the editor(s) disclaim responsibility for any injury to people or property resulting from any ideas, methods, instructions or products referred to in the content.

