Abstract
Focusing on the trend of continuously seeking high-precision tree species classification results in small areas from the perspectives of sensors and classification algorithms. This study aimed to explore the effects of data sources, classifiers, and seasons on classification accuracy in regions with significant environmental variation, examining patterns of tree species classification to enhance the transferability of classification. Considering two typical forest distribution regions in the north and south of China, this study utilized the revisitation cycle and open-source advantages of Sentinel-2 and Landsat-8. Leveraging the Google Earth Engine (GEE) platform, this study captured spectral features, vegetation indices, and texture features for single seasonal and seasonal combination images. With the assistance of Sentinel-1A and SRTM (Shuttle Radar Topography Mission) DEM (Digital Elevation Model), backscattering coefficient features and topographical features were extracted and input with features captured from Sentinel-2 and Landsat-8 into three types of classifiers: random forest (RF), support vector machine (SVM), and gradient tree boosting (GTB) for major tree species classification. In this research, we discovered that the best classification for single season in the northern study area was spring, whereas, for the southern study area, it was winter. Seasonal combination images effectively improved the classification accuracy of single seasonal images, with Sentinel-2 imagery displaying better classification performance compared to Landsat-8, and the optimal classifier differing between the north and the south. The inclusion of topographical or backscattering coefficient features in the four-season combination imagery contributed to improvements in classification accuracy, with topographical features significantly enhancing the classification performance in the topographically varied southern study area. The evaluation of feature importance indicated that elevation was the most critical feature for classification, while spectral features and vegetation indices were also significant. In the southern study area with large topographical discrepancies, subdividing into different terrain units led to improved tree species classification accuracy in medium-altitude, gentle slope areas. These findings provide insights into the regularity of enhancing tree species classification accuracy in environmentally diverse areas through the use of multi-source remote sensing data and multi-seasonal imagery. Consequently, the results offer a reference for the identification of tree species across large areas and the creation of spatial distribution maps.
1. Introduction
Forests constitute an essential natural resource, intricately linked to human existence [1]. The “2022 State of the World’s Forests” report released by the Food and Agriculture Organization of the United Nations highlights that humanity is currently confronting a multitude of global threats, including the COVID-19 pandemic, food security, poverty, climate change, conflict, land and water resource degradation, desertification, and biodiversity loss. Forests play a pivotal role in addressing these crises. Understanding the identification and distribution of forest tree species is a crucial aspect of forest resource surveys and holds significant value for assessing biodiversity, conserving soil and water, and estimating forest carbon stocks. Given the considerable variation in natural environments across different regions, China’s forest cover is characterized by a wide and uneven regional distribution of forest resources and is home to a rich diversity of forest types with complex internal structures [2]. The accurate identification of tree species and the creation of spatial distribution maps are vital for improving forest resource management, harnessing the multifunctionality of forests, and unlocking China’s forest potential to counter a range of crises.
Traditional forest resource surveys are costly and labor-intensive, making it difficult to meet actual production needs [3]. The development of computer technology and satellite remote sensing technology has provided opportunities for the more efficient extraction of forest species information and tree species mapping [4]. However, in recent years, research on tree species classification using remote sensing has increasingly focused on “data-algorithm-computing power”, relentlessly pursuing high-precision results primarily from the perspectives of sensors and classification algorithms [5].
In terms of data, as the granularity of forest resource classification work continues to rise, integrating and synthesizing effective information from multi-source remote sensing data to achieve complementary information has become a research trend. Ning et al. [6] fused Sentinel-2 and PlanetScope imagery to enhance spatial resolution and used a random forest classifier for tree species classification in New Zealand forest parks, achieving an overall accuracy of 95.6%. Liu et al. [7] combined canopy structure information obtained from airborne LiDAR and vegetation indices information from hyperspectral imagery with enhanced spectral resolution and used a random forest classifier to produce an urban tree species map for the city of Surrey, Canada, with an overall accuracy of 70%. Michael et al. [8] leveraged the advantage of SAR data to penetrate clouds and fog, combined Sentinel-2 and Sentinel-1 imagery, and used a random forest classifier to classify tree species in an Austrian nature reserve, achieving an overall accuracy of 83.2%.
In terms of algorithms, Janne et al. [9] compared the performance of a 3D-CNN with support vector machines, random forests, and gradient tree boosting in classifying tree species in the forests of southern Finland, concluding that the 3D-CNN had the best classification performance, using it to create a tree species classification map. Corentin et al. [10] used a spectral–spatial deep learning algorithm with Sentinel-2 data to map tree species proportions in southern Belgium. Lei et al. [11] utilized high-resolution Google Earth imagery combined with the H-CNN model to achieve forest type classification in Beijing’s Western Hills Forest Park, with an overall accuracy of 92.48%.
These studies focus on enhancing classification accuracy from data and algorithm perspectives, not only requiring advanced hardware but also lacking consideration for classification costs. Moreover, focusing on achieving high precision in tree species classification in small areas has not fully explored the regularities of tree species classification, limiting its widespread application in forest resource management and failing to completely meet the needs of forest resource management. Due to limitations in satellite revisit cycles, acquisition range, and costs, studies often use single-temporal imagery for mapping local areas, neglecting the fact that trees’ spectral reflectance and texture information, influenced by climate, exhibit periodic changes. Therefore, multi-temporal remote sensing imagery, compared to single-temporal imagery, can improve species classification accuracy by capturing trees’ phenological characteristics. Koukal et al. [12] studied the impact of phenology on tree species mapping in temperate forests in Austria using WorldView-2 and found multi-seasonal remote sensing imagery crucial for capturing key phenological traits during different transitional periods. However, the key phenological periods for tree species classification differ between regions. Pu et al. [13] found that an April image captured the seasonal transition from dry spring to wet summer in Florida, resulting in the highest classification accuracy for seven broadleaf evergreen species compared to images from February, May, August, and November. Thomas et al. [14] recommended October imagery after comparing images from nine dates across May, June, and October to achieve the highest tree species classification accuracy.
Previous studies have emphasized enhancing the accuracy of tree species classification from the perspectives of data and algorithms, neglecting the patterns under which data, algorithms, and seasons affect classification accuracy and whether these patterns remain applicable in different environmental regions. By comparing the effects of tree species classification under the influence of multi-source remote sensing data and multi-seasonal imagery in regions with significant environmental differences, it is possible to uncover the operational regularities of inputs and algorithms under different conditions. This understanding enhances the transferability of tree species classification methods, providing a benchmark for the broad identification of tree species and the creation of spatial distribution maps.
In this study, we selected areas with significant environmental differences in the typical forest distribution regions of northern and southern China for examination. We used Sentinel-2 and Landsat-8 images as data sources, along with backscattering coefficient and topographical features extracted from Sentinel-1A and SRTM DEM. After extracting multiple features, we then employed three machine learning algorithms for classification, improving the transferability of tree species classification methods from aspects of data sources, features, and algorithms. The specific issues we wished to explore were (1) whether the best single season for tree species identification in the typical forest regions of northern and southern China was the same, whether different classification schemes changed the choice of the best single season, and the impact of seasonal combination imagery versus single season imagery on classification accuracy; (2) whether the best classification scheme (image-classifier) under the best classification season was the same for both regions and the impact of classification schemes on classification accuracy; and (3) whether adding topographical and backscattering coefficient features could enhance the classification accuracy in both regions and the extent to which it influenced classification accuracy in different regions. Eventually, by comparative analysis, this study revealed patterns of how imagery and algorithms play a role in tree species classification in various environments across different seasonal and seasonal combination imagery.
2. Materials and Methods
2.1. Study Area
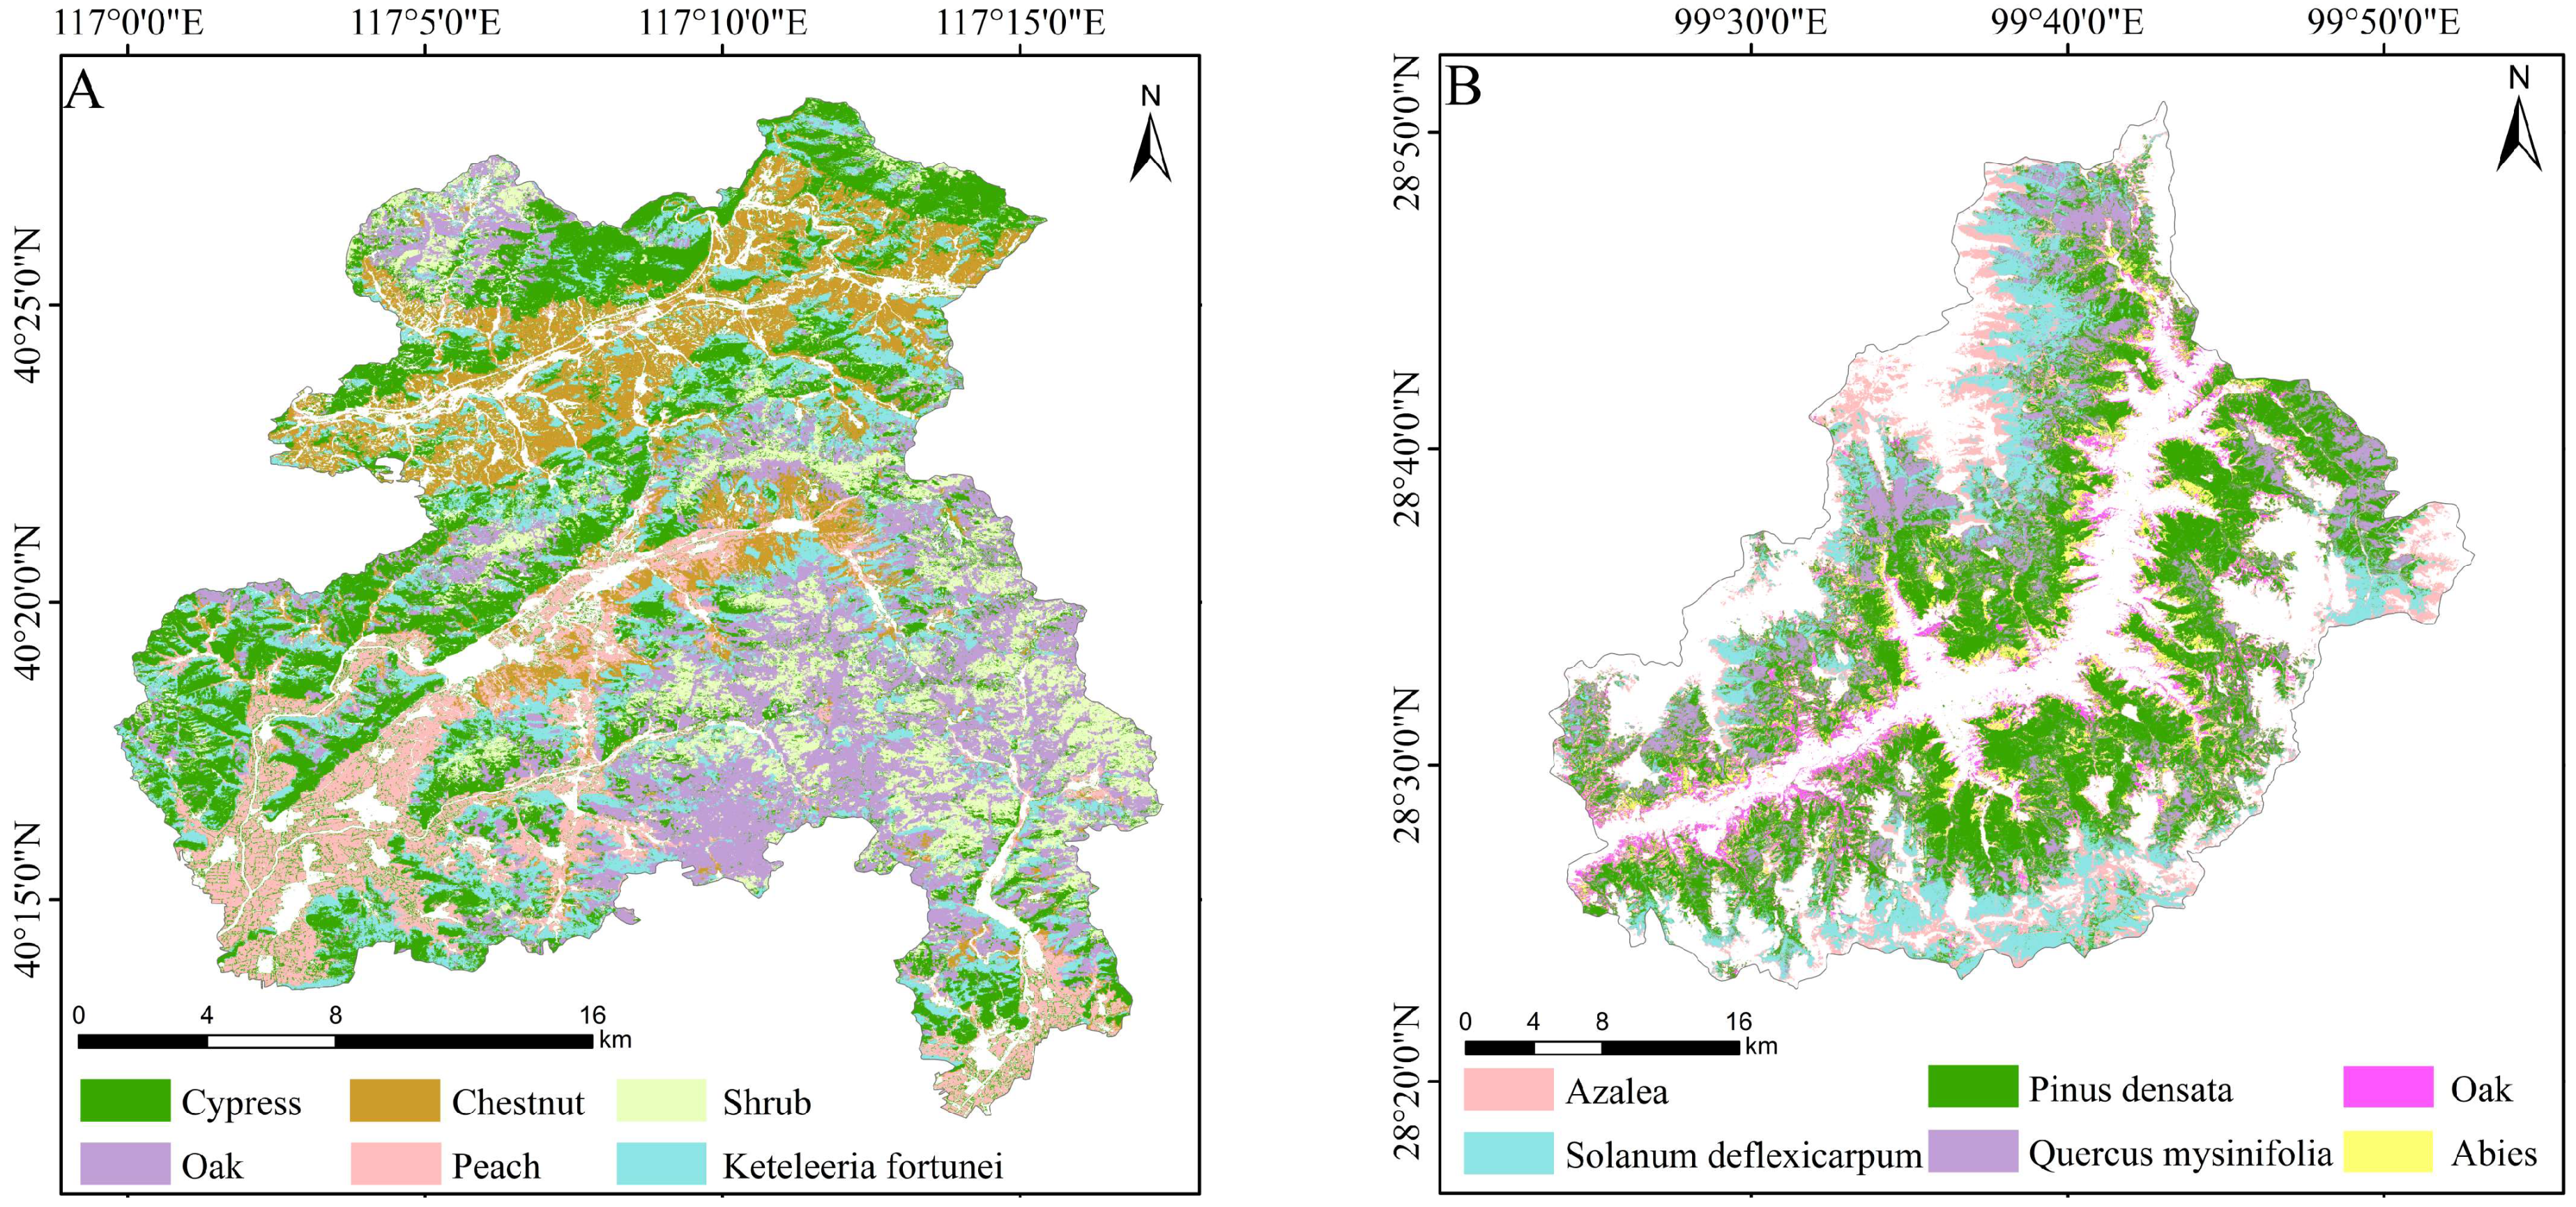
This study focused on two study areas, as shown in Figure 1. Study area A is located at the border between the Miyun and Pinggu districts of Beijing (40°11′ N~40°28′ N, 116°59′ E~117°17′ E) and presents a typical mountainous and hilly landscape of the northern plains of China. It experiences a warm, temperate, continental, monsoon climate. In terms of forest resources, study area A has a forest coverage rate of over 95%, with tree species mainly belonging to temperate broadleaf and coniferous forests. At the same time, the southern Pinggu district is an important fruit tree planting base, especially famous for peach trees. The northern Miyun district is known for its artificially planted chestnut (Castanea mollissima) trees. The distribution of tree species here is distinctive, and human intervention in modifying tree species is significant.
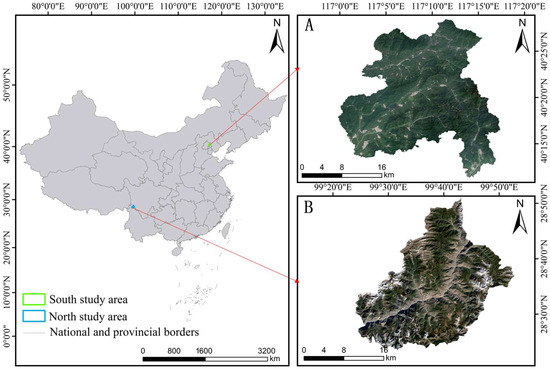
Figure 1.
Study area. (A) Northern study area A. (B) Southern study area B.
Study area B is located in Dongwang Township, Shangri-La City of Diqing Tibetan Autonomous Prefecture in Yunnan (28°23′ N~28°50′ N, 99°22′ E~99°50′ E). It is generally at a high altitude with varied topography and considerable terrain undulation, typical of the plateau mountain landscape of southern China. It is affected by the subtropical plateau monsoon climate and the plateau mountain climate, resulting in very distinct vertical climate characteristics. The forest coverage rate in study area B exceeds 87%, with vast expanses of undisturbed primary forest. The main tree species are those commonly found in high-altitude areas, such as pinus densata (P.D.) trees and abies trees, with the pinus densata trees being endemic to the alpine regions of western China and known for their cold resistance. They predominantly grow on the shady slopes of subalpine and alpine zones. Broadleaf species in the area include oak (Cyclobalanopsis yunnanensis) trees and solanum deflexicarpum (S.D.) trees. Yunnan is known for its rich variety of azaleas (Rhododendron), with azaleas and solanum deflexicarpum being common shrub species in the area.
2.2. Data and Pre-Processing
The data for this study came from two sources: remote sensing data and sample data obtained from field measurements.
2.2.1. Remote Sensing Data
In this study, we utilized the Google Earth Engine (GEE) platform to access preprocessed Sentinel-2 Level-2A data and employed its inherent QA60 band for cloud removal [15]. Pixel losses resulting from the cloud removal process were mitigated through median composite substitution. Due to considerable cloud cover in the images from study area B, compounded by a limitation in the number of available images, there were still missing pixels in the composite images for the single season of 2021. To address this, imagery spanning three years, from 2020 to 2022, was selected for single-season composite generation. This strategy effectively resolved the issue of pixel loss. Similarly, three years’ worth of images were also composited for study area A. The Level-2 data from Landsat-8 Surface Reflectance (SR) from 2020 to 2022 were also obtained via GEE, with cloud removal conducted using the image’s QA band.
For the Sentinel-1A data, Level-1 ground range detected (GRD) products collected in interferometric wide (IW) mode were used. The 2021 imagery accessed via the GEE platform was merged using ascending and descending track fusion techniques to create a composite image for the year, facilitating backscatter coefficient feature extraction. Topographic data were derived from the SRTM DEM at a 30 m resolution product. The SRTM DEM provided three topographical features: elevation, slope, and aspect. Both datasets were resampled in the analysis to match the resolutions of Sentinel-2 and Landsat-8 images.
2.2.2. Sample Data
The tree species sample data for study areas A and B were derived from the 2021 forest inventory data. By statistically analyzing the sub-compartment area of various tree species, six main tree species were identified for both study areas. The quality of the samples significantly impacted the accuracy of the classification. To purify the samples, the first step involved creating a 30 m inward buffer from the border of the tree species sub-compartment to generate buffer zones, ensuring that there was only one species of tree sample point under the spatial resolution of Landsat-8. In the next step, the NDVI images of the study areas calculated from the red and near-infrared bands of Sentinel-2 were overlaid with the buffer zones to calculate the NDVI standard deviation within the buffer zones. Buffers with a variance less than 0.1 were selected to eliminate those with large NDVI differences, thereby purifying the tree species buffer zones. Finally, in the purified buffer zones, random points with a minimum distance of 100 m were generated as sample points for each tree species; the larger the area of a tree species, the more corresponding sample points it had. For classification, a 6:4 ratio was used to split the training and validation sets [16]. Before conducting tree species classification, forest and non-forest samples purified using the same method were classified using a random forest classifier. This resulted in an overall accuracy of 97.12% for study area A and 98.79% for study area B in the forest versus non-forest classification, and forest masks were created for both study areas.
2.3. Methods
Our methodology involved the following steps. To synthesize images for the four seasons of 2021, image combinations were created using data from Sentinel-2 and Landsat-8, respectively. Spectral features, vegetation indices, and texture features were extracted based on single-season or combined seasonal images. Additionally, Sentinel-1A and DEM data were employed to extract backscattering coefficient features and topographic features. Various feature types were then paired with three different classification algorithms to form distinct classification schemes. These schemes were compared based on overall accuracy (OA), producer’s accuracy (PA), user’s accuracy (UA), and Kappa coefficient to evaluate the accuracy of each classification scheme. This comparison endeavored to understand the impact of different classification schemes on the accuracy of classification.
2.3.1. Image Combination
According to the climate bulletin (https://weather.cma.cn/ (accessed on 10 October 2023)), Beijing’s spring ranges from 15 March to 15 May, summer from 15 May to 15 September, autumn from 15 September to 15 November, and winter from 15 November to 15 March. In Yunnan, spring lasts from 15 March to 31 May, summer from 1 June to 31 August, autumn from 1 September to 30 November, and winter from 1 December to 28 February. To minimize the impact of the number of images acquired during each season on the classification accuracy, the defined collection dates for the spring in both study areas were set from 15 March to 15 May, summer from 15 June to 15 August, autumn from 15 September to 15 November, and winter from 15 December to 15 February. Seasonal combined images were assembled by stacking single-season image bands.
2.3.2. Feature Extraction
The features extracted in this article are presented in Table 1.

Table 1.
Description of the selected features for this study.
Spectral Features: Sentinel-2 input the original bands except the B9 and B10 bands [17], which were extracted directly from the spectral bands of the images. B1 in the environment with high aerosol content was helpful for distinguishing between different tree species. Study area A is located in a highly modernized region and there is a higher aerosol level. In study area B, due to a combination of unique topography and climate factors, there is also a higher aerosol concentration [17]. The B2–B4 visible bands and B8–B8A near-infrared red bands play an important role in the classification of different tree species. Different tree species have significant specificity in the reflectance of these bands. Healthy green vegetation tends to absorb a lot of blue and red visible bands and strongly reflect the near-infrared red bands, but the absorption and reflection patterns are not the same in different species due to the influence of chlorophyll content and leaf structure. The B5–B7 red edge bands and the B11–B12 short-wave infrared red bands play an important role in species classification [18]; the red edge bands are more sensitive to the changes of chlorophyll, which means the red edge bands can be used for species identification and even for the monitoring of plant pests, diseases, and nutrient levels, while the short-wave infrared red bands have a longer wavelength compared to visible and near-infrared red bands, so they have a stronger ability to penetrate clouds and are often combined with visible bands to increase the possibility of distinguishing between tree species. The B9 water vapor band is not significant for tree species identification because it is mainly used to monitor atmospheric water content, which is strongly affected by atmospheric moisture, and the B10 band is mainly designed for atmospheric water vapor correction, which is not suitable for species classification. Landsat-8 also input visible, near-infrared red, and short-wave infrared red bands [19].
Vegetation Indices: Vegetation indices were calculated from different specific bands, so different vegetation indices were input in Sentinel-2 and Landsat-8. NDVI, EVI, LSWI, SAVI, and NBR are common vegetation indices and have proven effective for tree species classification [20]. REP, RENDVI, and NDRE1 indices are calculated using the unique red-edge band combinations of Sentinel-2 and have demonstrated good application capabilities in tree species identification. In addition to the original bands and vegetation indexes, both Sentinel-2 and Landsat-8 have undergone tasseled cap transform (TCT), resulting in brightness, greenness, and wetness indices, which relate to plant growth processes and soil and can therefore be utilized in tree species classification [21].
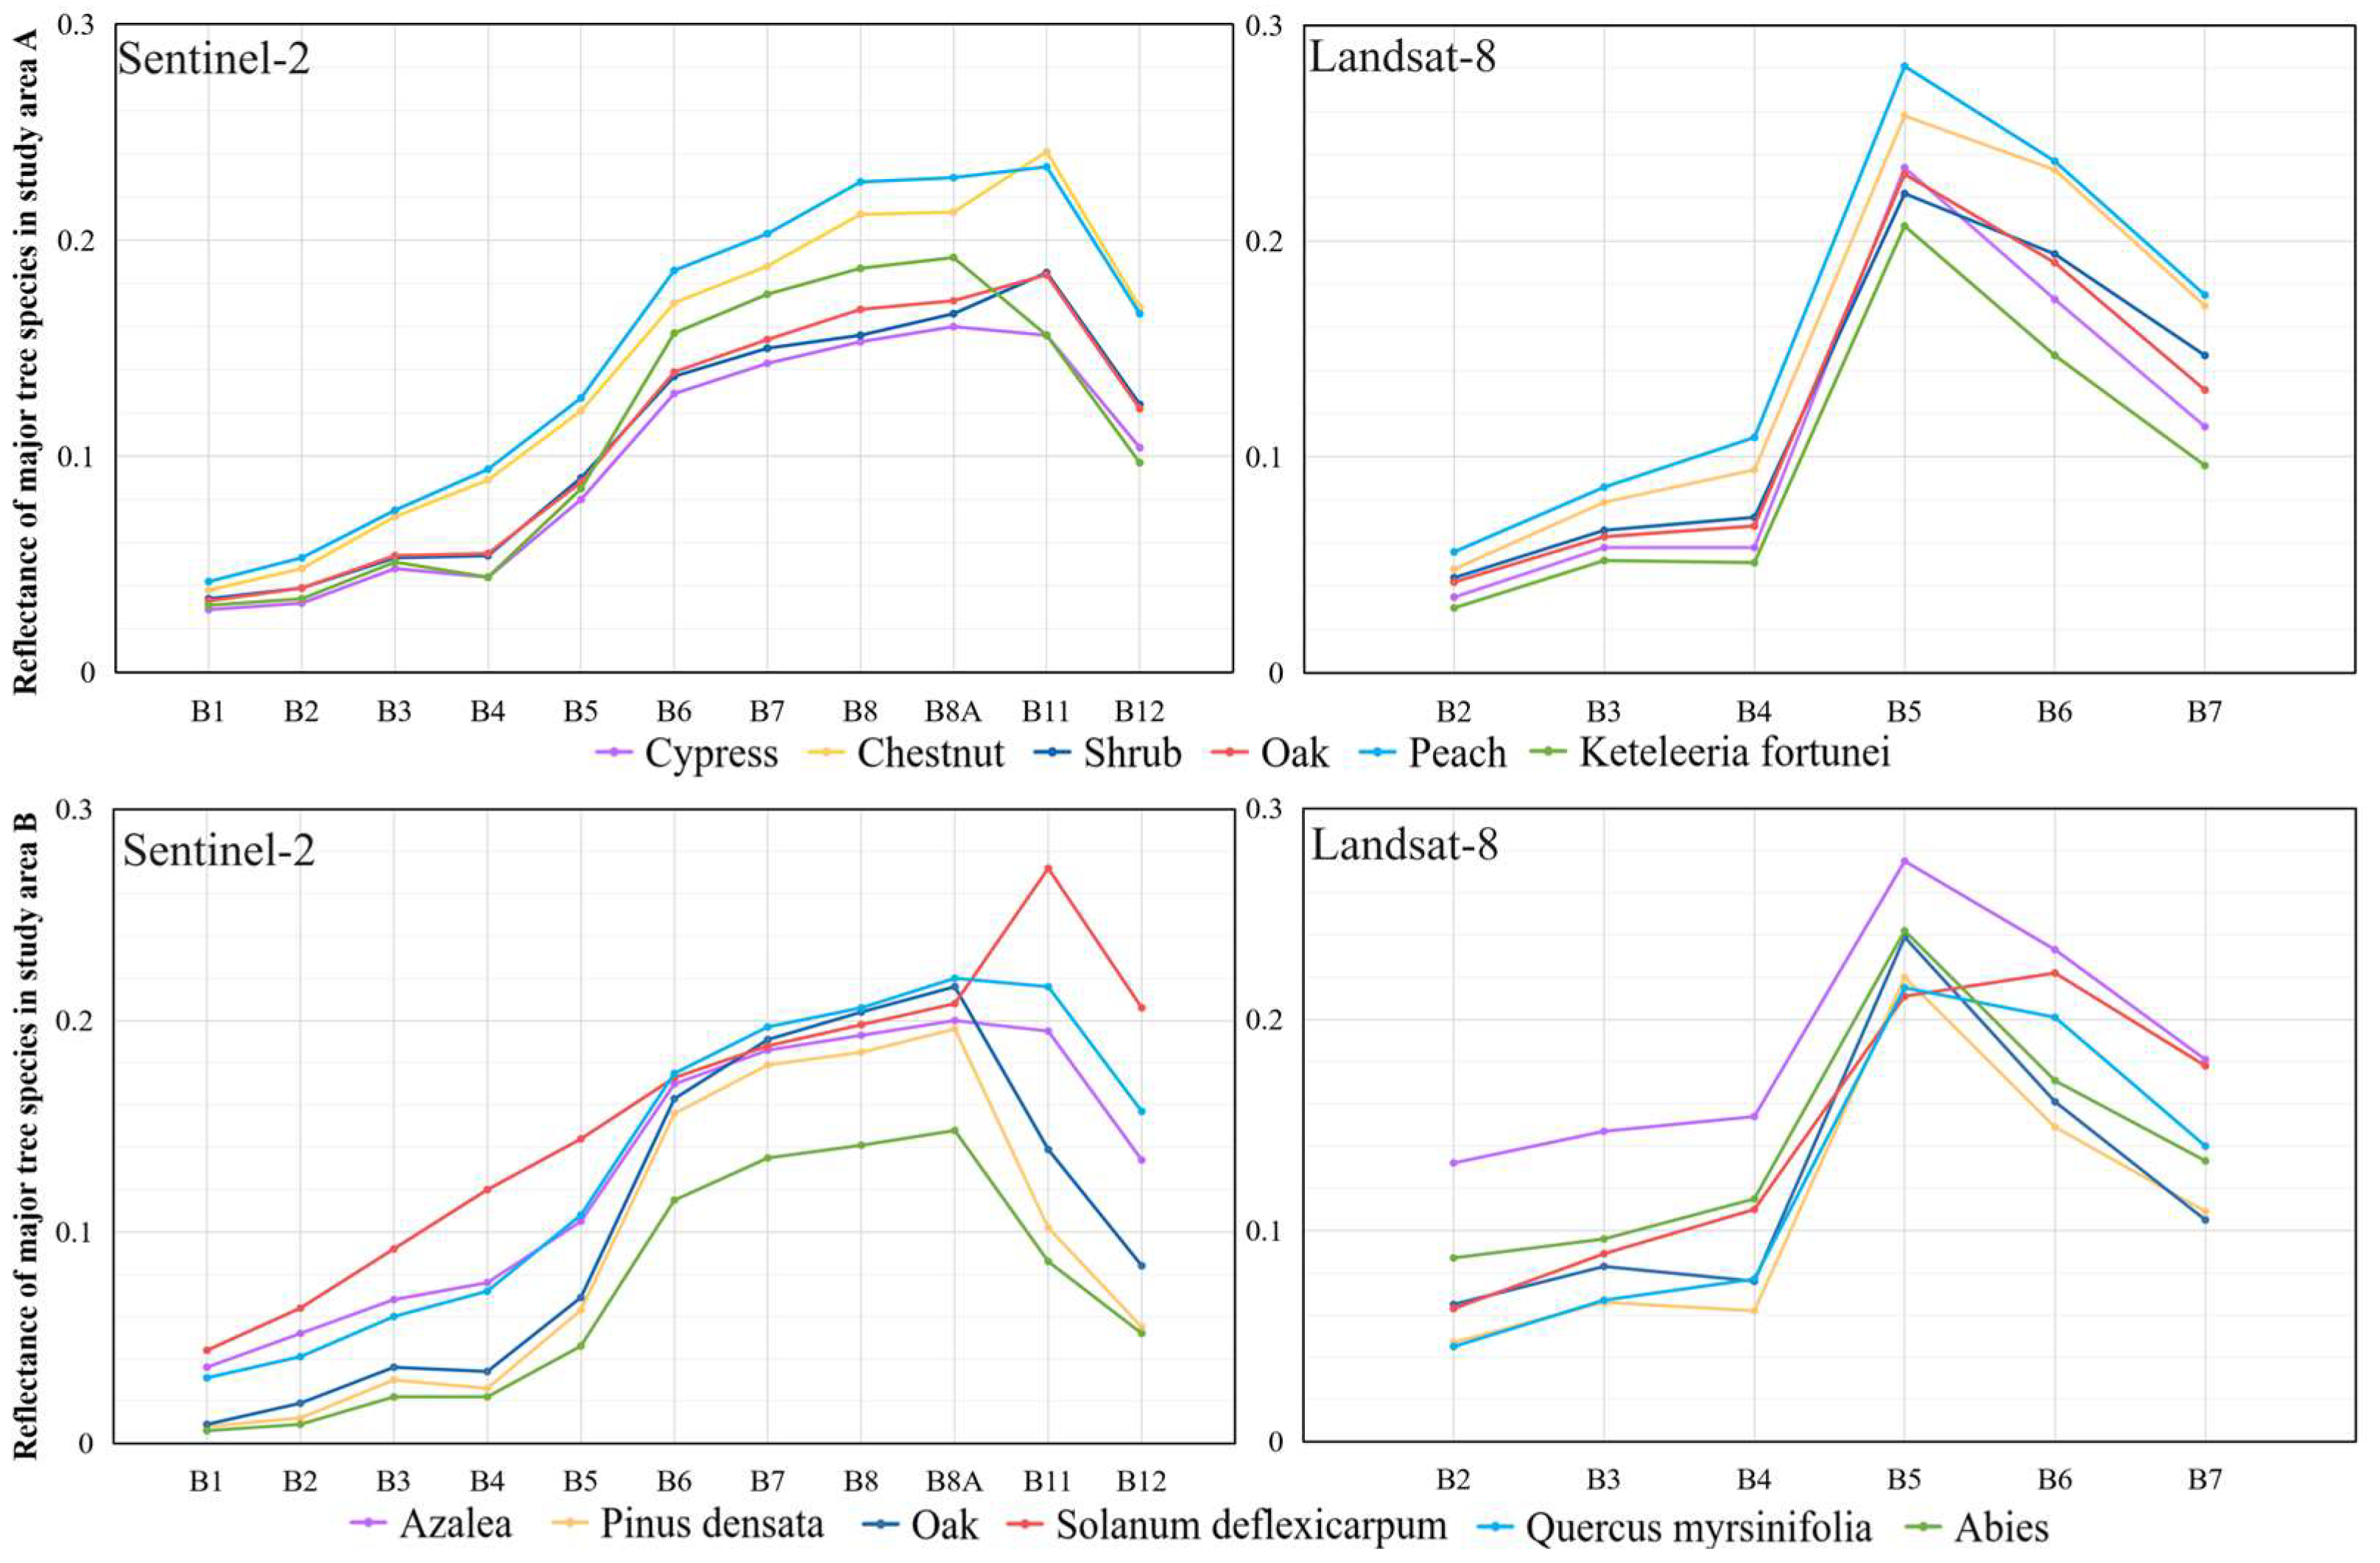
Texture Features: Characteristics such as contrast (Con), variance (Var), and dissimilarity (Diss) can reflect the physical properties of tree crowns [22]. Based on the variance of reflectance for each tree species in different bands (Figure 2), the bands with the highest variances in the two study areas were B11 in Sentinel-2 and B6 in Landsat-8. As such, near-infrared bands from both types of imagery were inputted, and texture features were calculated through the gray-level co-occurrence matrix (GLCM).
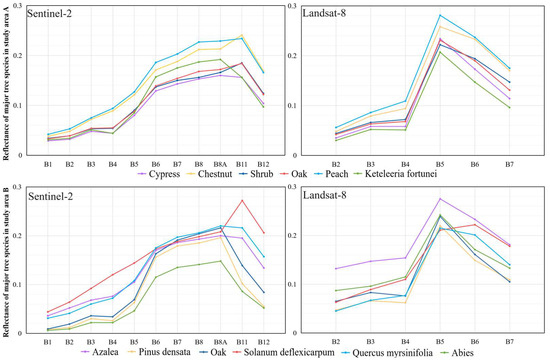
Figure 2.
Reflectance of major tree species on Sentinel-2 and Landsat-8 bands.
Backscatter Coefficient Features: This study utilized the projection angle method proposed by Ulander [23] for terrain radiometric correction of imagery. After correction, backscatter coefficients for two polarization modes were extracted.
Topographic Features: Topographic characteristics hold significant potential for distinguishing tree species with different spatial distributions. Slope mainly affects the angle of direct sunlight, aspect influences the duration and intensity of direct sunlight, and the phenomenon of vertical zonation of vegetation reflects the impact of changes in elevation on temperature and humidity conditions, which combine to form a complex spatial pattern of vegetation types. In this study, the SRTM 30 m resolution DEM product of the study area was directly extracted from GEE, and the resolution of the DEM product was adjusted to 10 m by resampling to be consistent with the bands in Sentinel-2, while no resampling was needed when classifying using Landsat-8, and three topographic features of slope, aspect, and elevation were obtained by calculating based on the DEM product.
2.3.3. Classification Methods and Accuracy Assessment
Tree species classification methods based on remote sensing have been evolving, and the two mainstream classification methods are machine learning methods and deep learning methods. In this study, three commonly used machine learning methods in tree species classification were selected, that is, the random forest (RF), support vector machine (SVM), and gradient tree boosting (GTB) algorithms. The random forest algorithm, a typical representative of ensemble learning methods, is centered on the conglomeration of multiple decision trees. In this study, an RF classifier was constructed using functions enclosed on the GEE platform
A support vector machine is a supervised classification algorithm that predominantly hinges on choosing optimal support vectors based on training samples and constraints for each category and constructing an optimal classification surface accordingly. In this study, an SVM classifier was constructed using functions enclosed on the GEE platform.
Gradient tree boosting (GTB) is an advanced algorithm developed within the framework of ensemble learning. Compared to the performance requirements of a single tree in a random forest, its individual performances are relatively weak. However, in iterative processes, these weak classifiers gradually collaborate to form a strong classifier overall.
For the parameter settings of all three algorithms, the optimal hyperparameter settings were found by systematically traversing multiple parameter combinations through a grid search on the basis of k-fold cross-validation.
The accuracy validation of the classification results primarily used four indicators based on the confusion matrix to represent them, including the Kappa coefficient, overall accuracy (OA), producer’s accuracy (PA), and user’s accuracy (UA). PA refers to the proportion of correctly identified instances of a particular class to the total number of instances that were actually of that class. UA measures the proportion of correctly identified instances of a particular class to the total number of instances that were classified as belonging to that class. The overall accuracy (OA), producer’s accuracy (PA), and user’s accuracy (UA) were derived through the confusion matrix and used to perform accuracy assessments:
where n denotes the number of rows of the confusion matrix, denotes the values in rows and columns, and denote the sum of row i and column j, respectively, and N denotes the total number of pixels in the real reference.
3. Results
3.1. Optimal Season for Classification
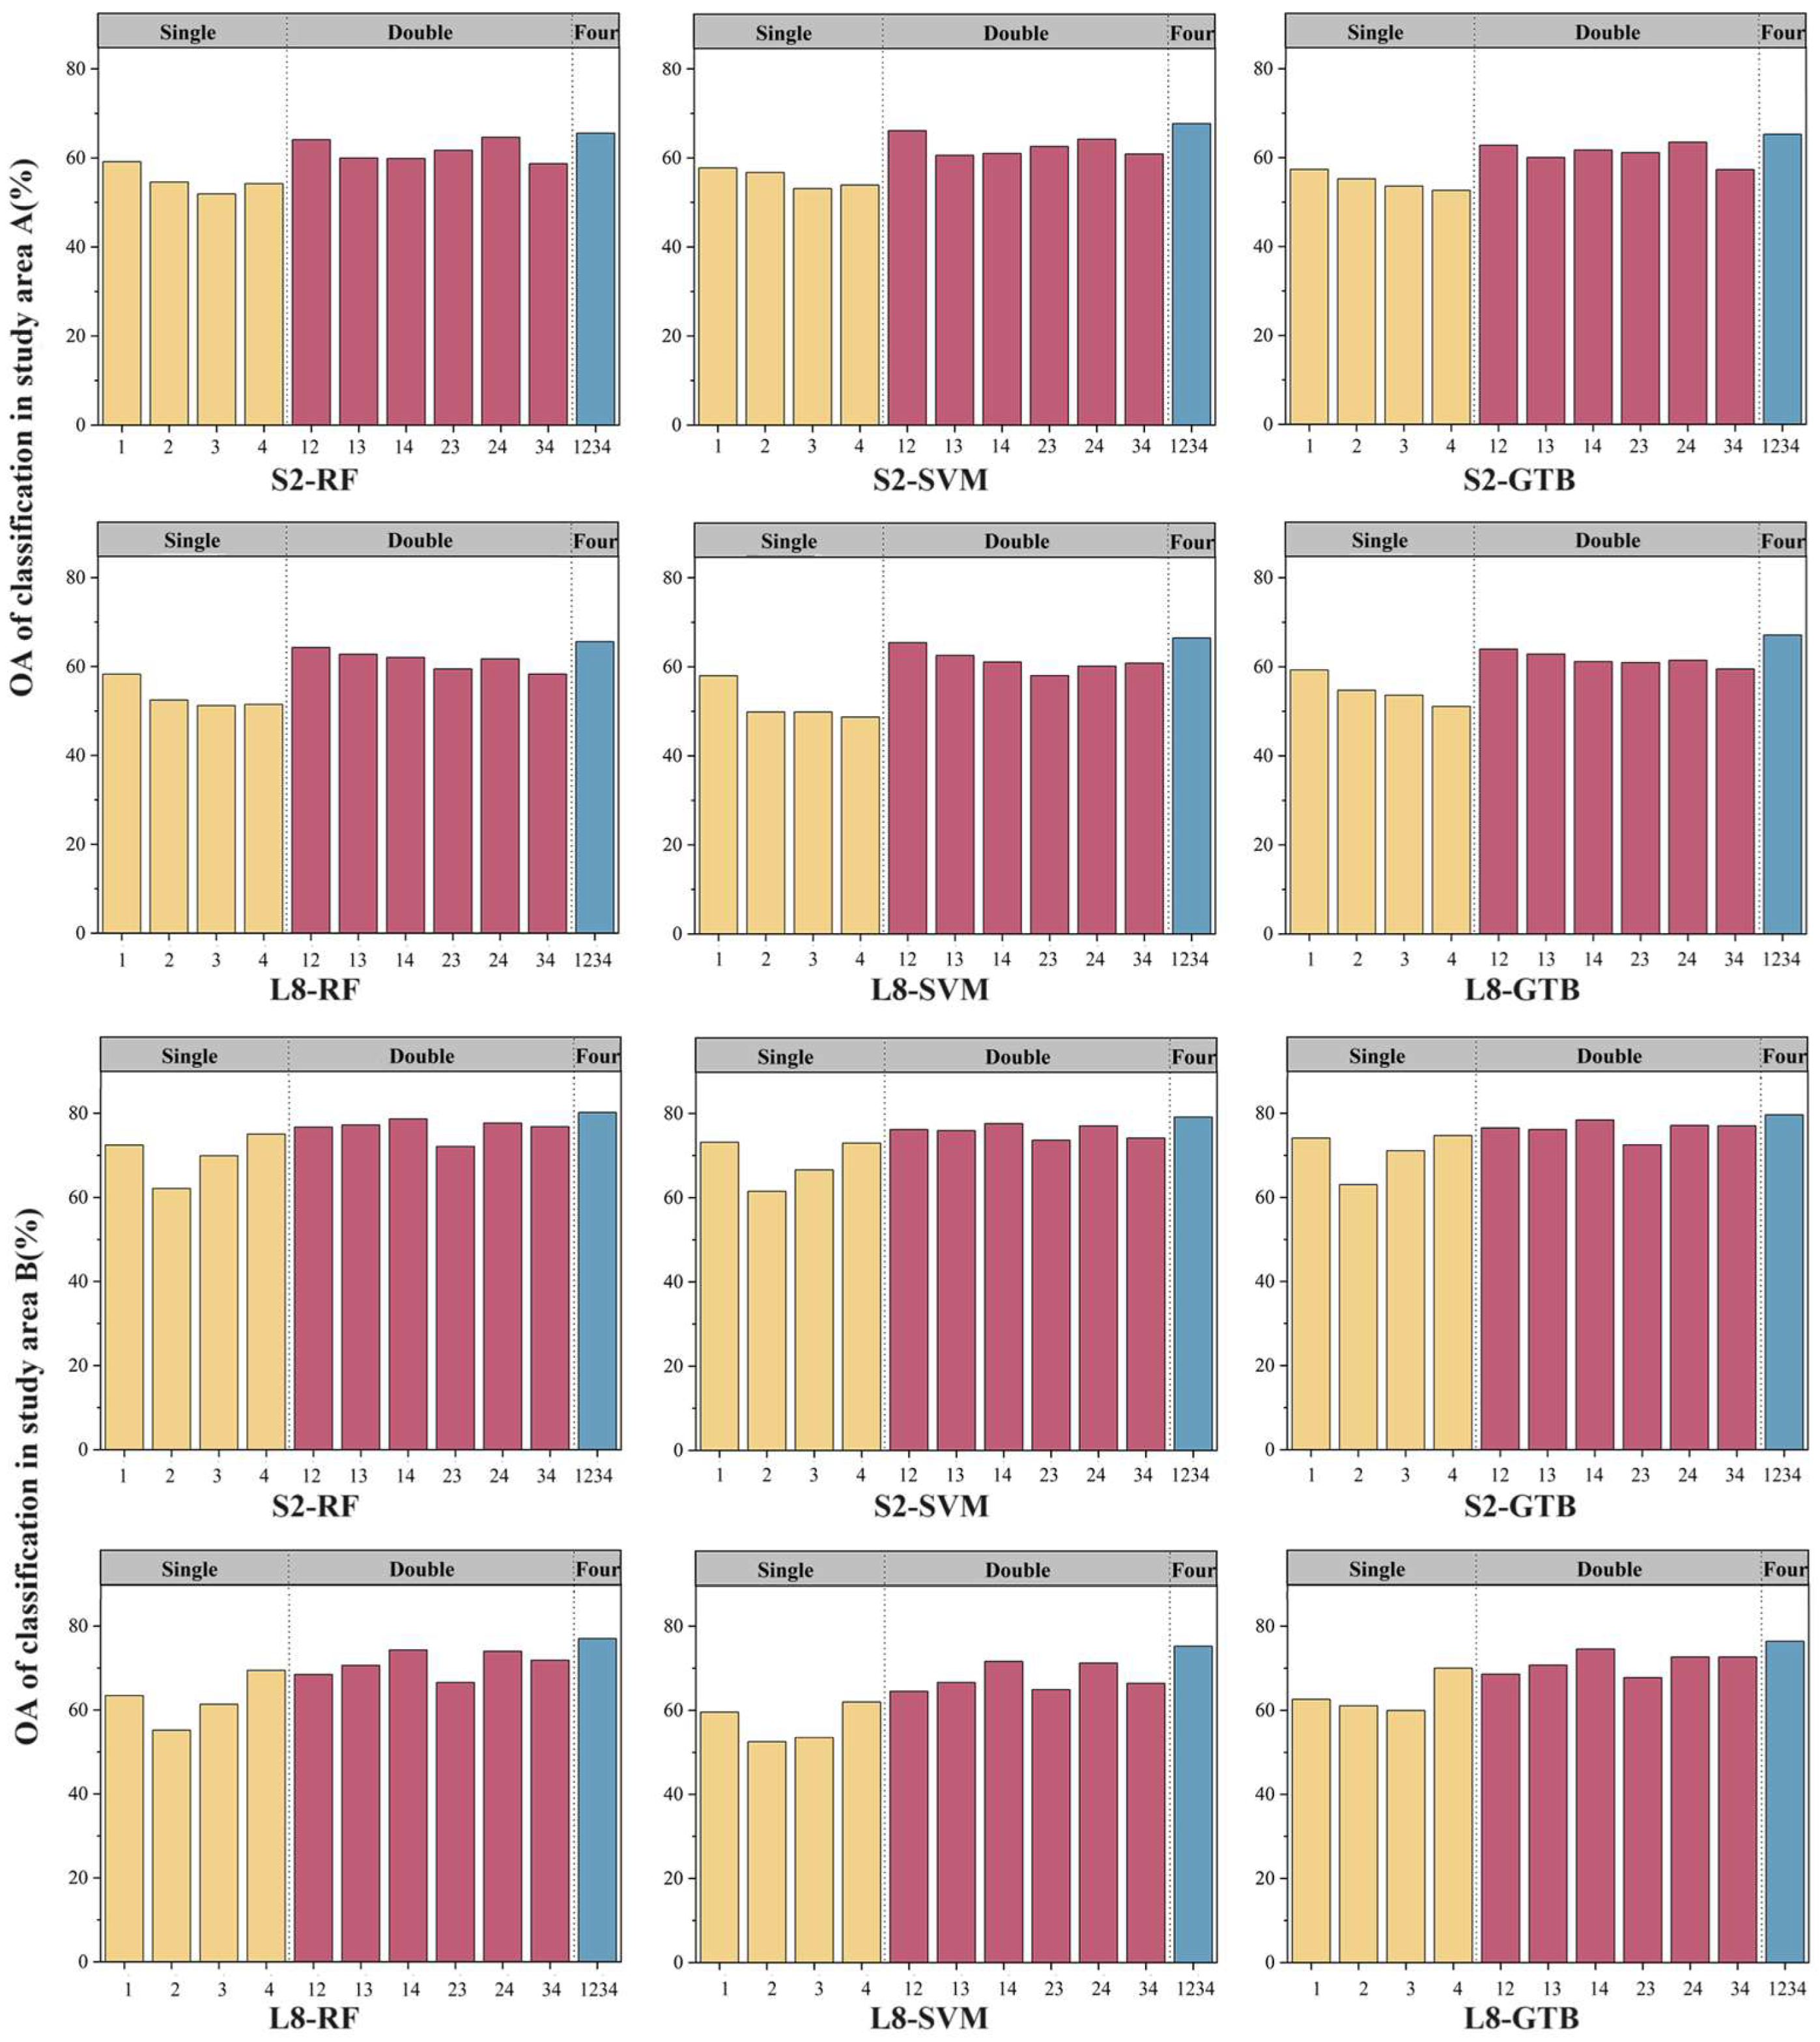
The overall accuracy of classification in the study area under different seasons is shown in Figure 3, with the numbers 1, 2, 3, and 4 representing the four seasons of spring, summer, fall, and winter, respectively. The best classification season for study area A under different classification schemes was consistently spring, followed by summer. Likewise, for study area B, the best classification season under different schemes was consistently winter, followed by spring. The selection of the best seasons did not change amongst different classification schemes, suggesting that phenological changes in vegetation have a greater impact on classification accuracy. Incorporating seasonal information into the classifier, especially information related to vegetation phenology, could enhance the classifier’s performance to some extent. This aligns with conclusions drawn by Clark [24] in his research on multi-seasonal regional land cover mapping.
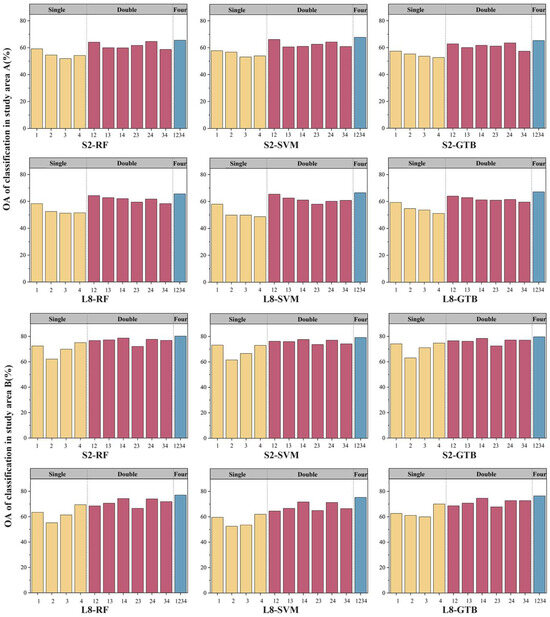
Figure 3.
Overall accuracy of classification under different seasonal combinations of images. The numbers 1, 2, 3, and 4 represent the seasons of spring, summer, fall, and winter.
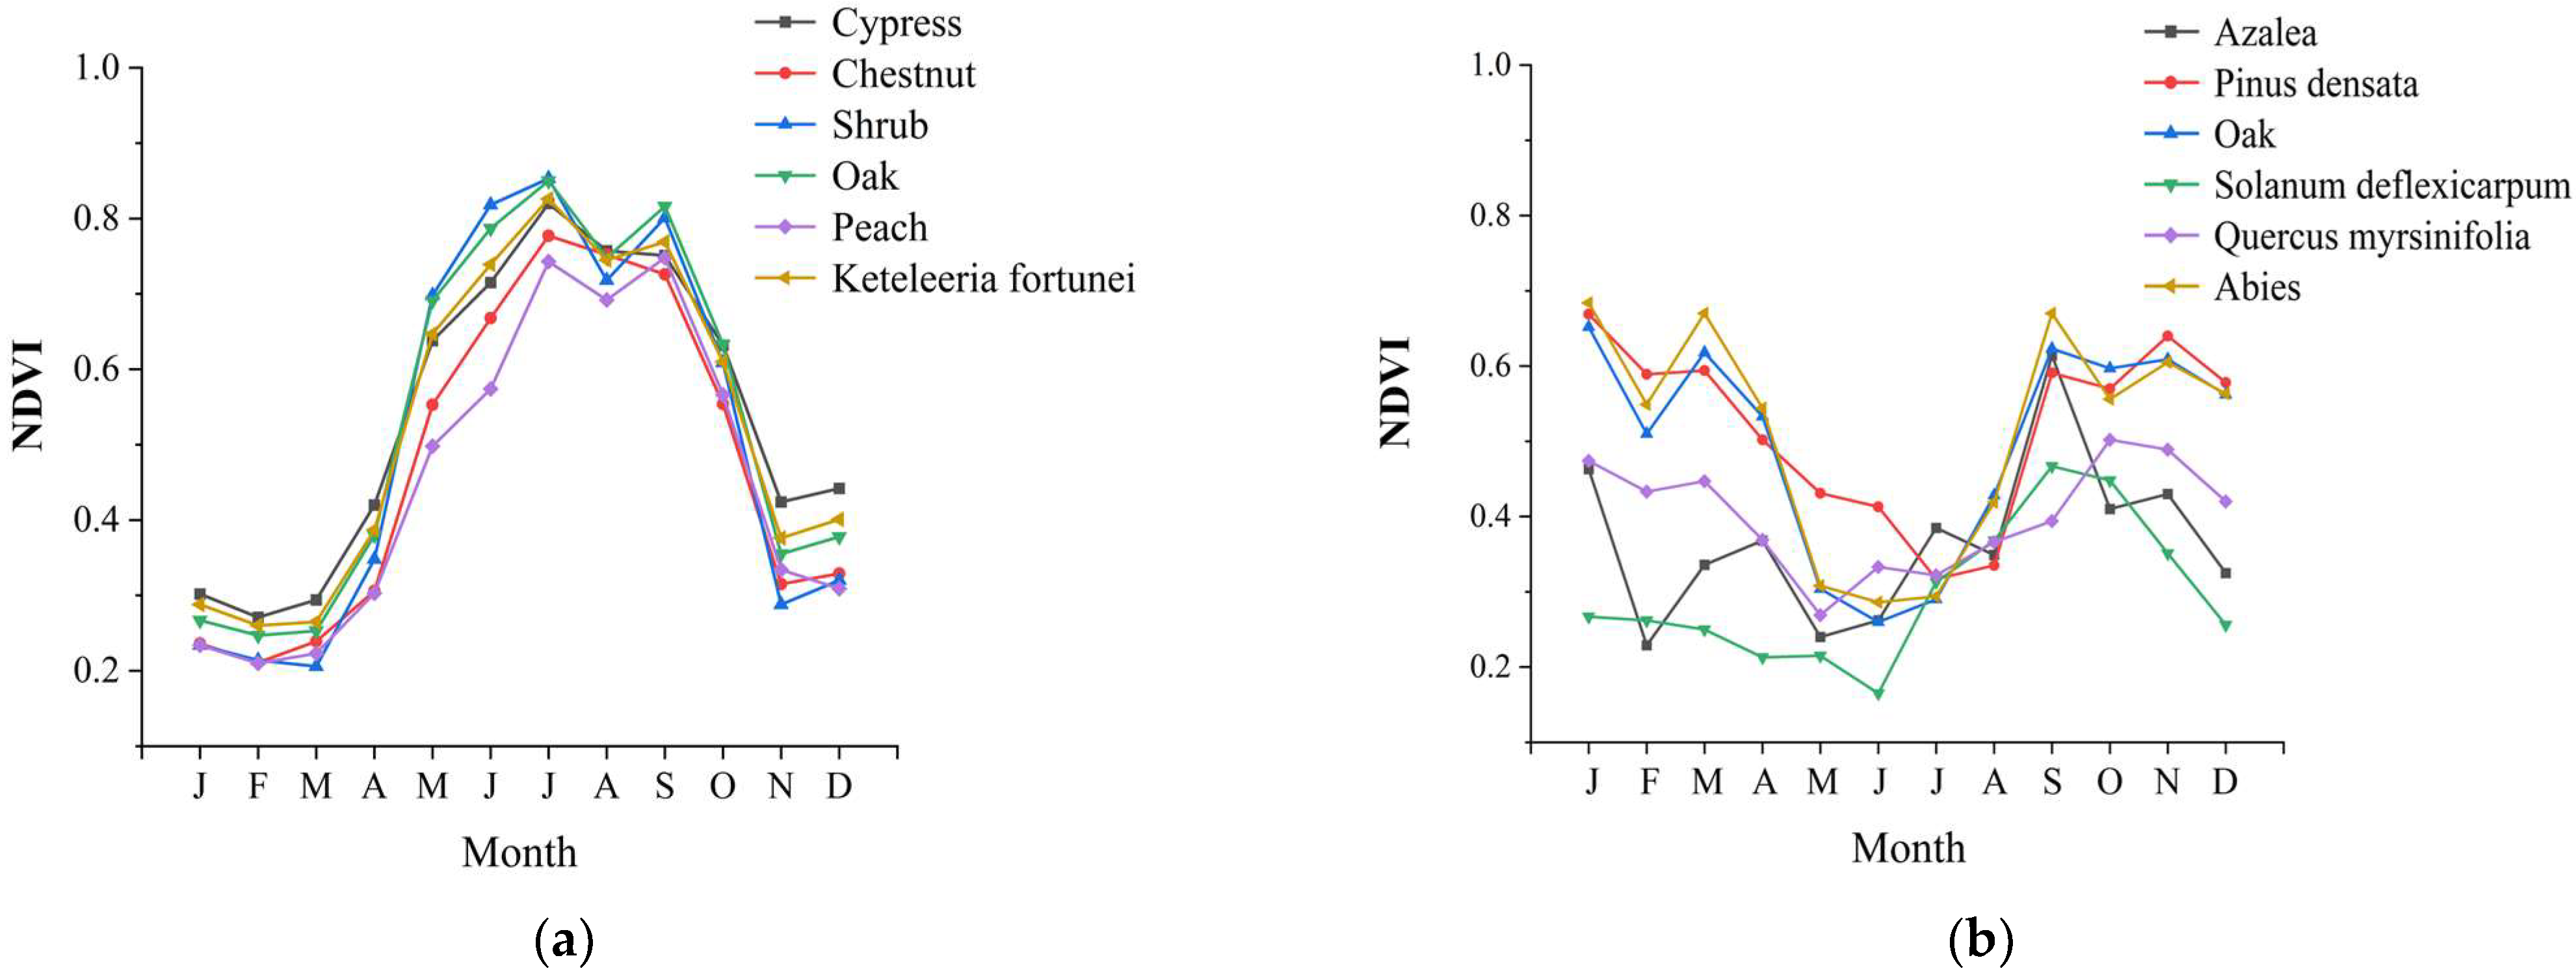
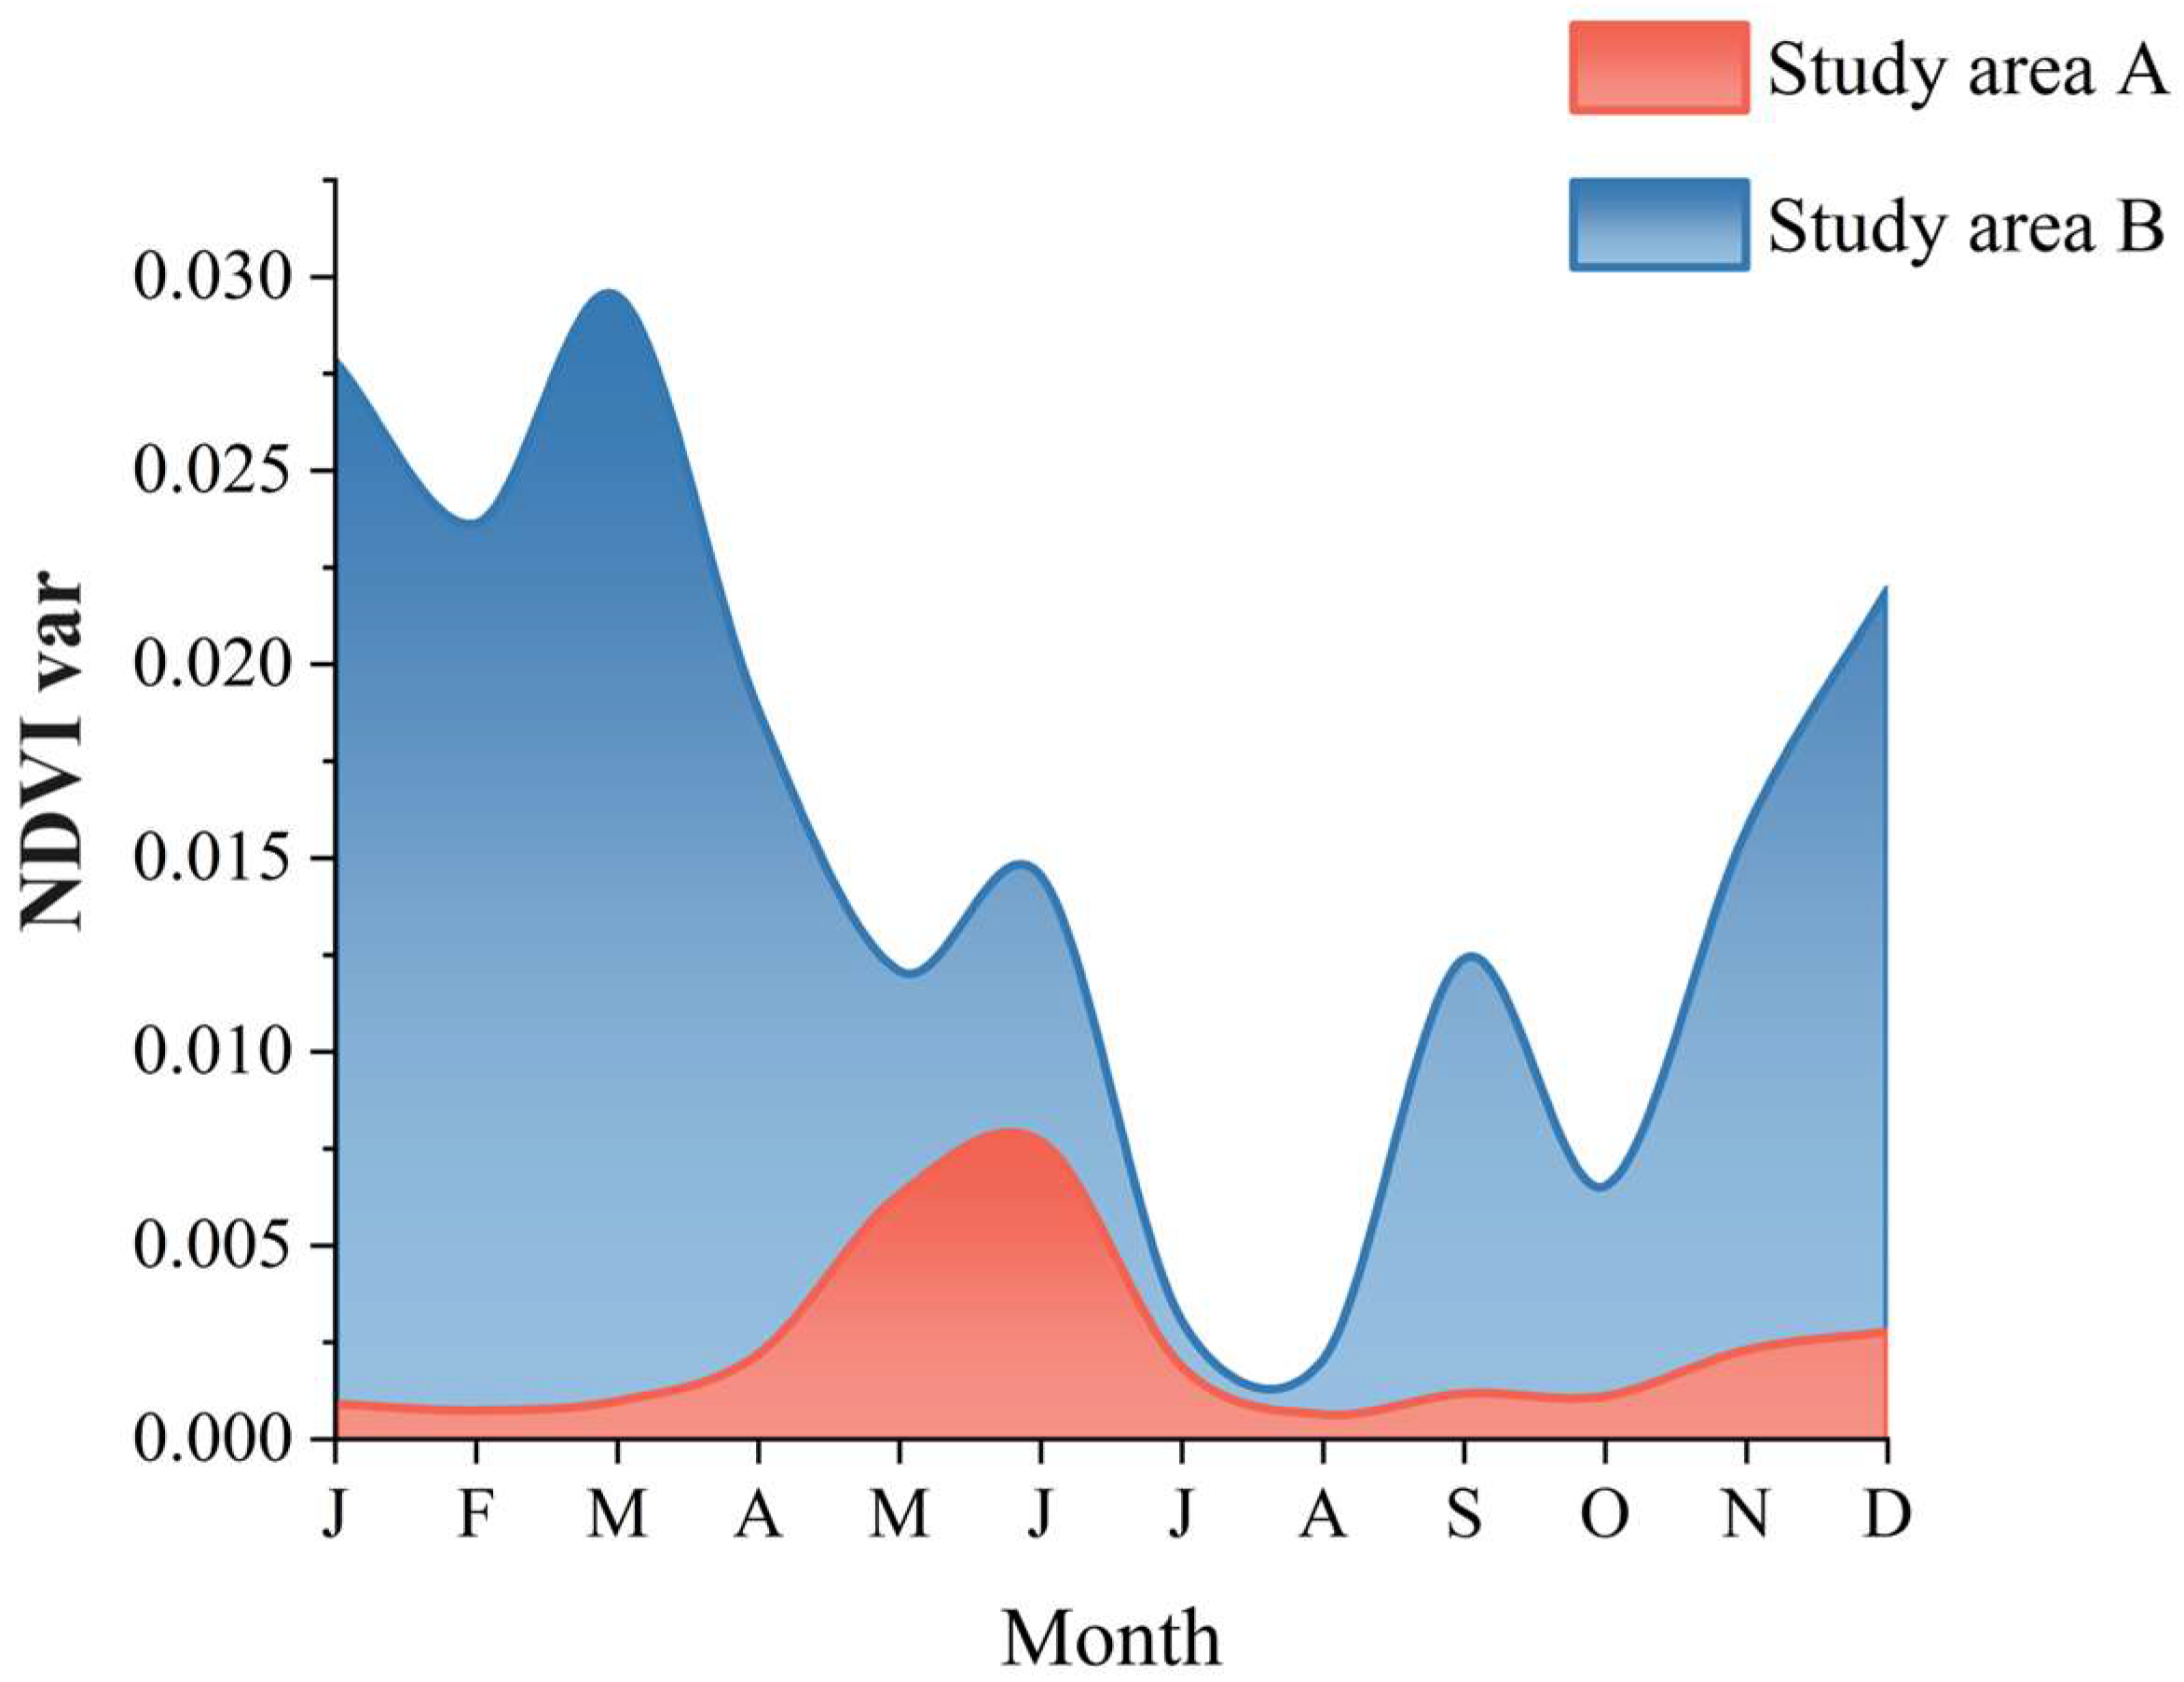
The selection of the best single season varied between regions and related to the differing key phenological stages in these regions. NDVI is a common approximation of vegetation phenology [25]. We used the Sentinel-2 NDVI time series and variance to select key phenology dates. As shown in Figure 4, with the horizontal axis showing the abbreviations from January to December, the changes in NDVI of various tree species during 2021 were distinct and trended similarly in study area A. Variance in the NDVI of various tree species (Figure 5) illustrated more significant differences between spring and summer than other seasons. In study area B, the NDVI difference between spring and winter was more prominent than it was for other seasons.
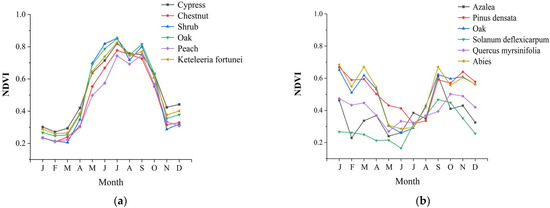
Figure 4.
NDVI time series of major tree species in (a) study area A and (b) study area B.

Figure 5.
NDVI variance of major tree species in different months.
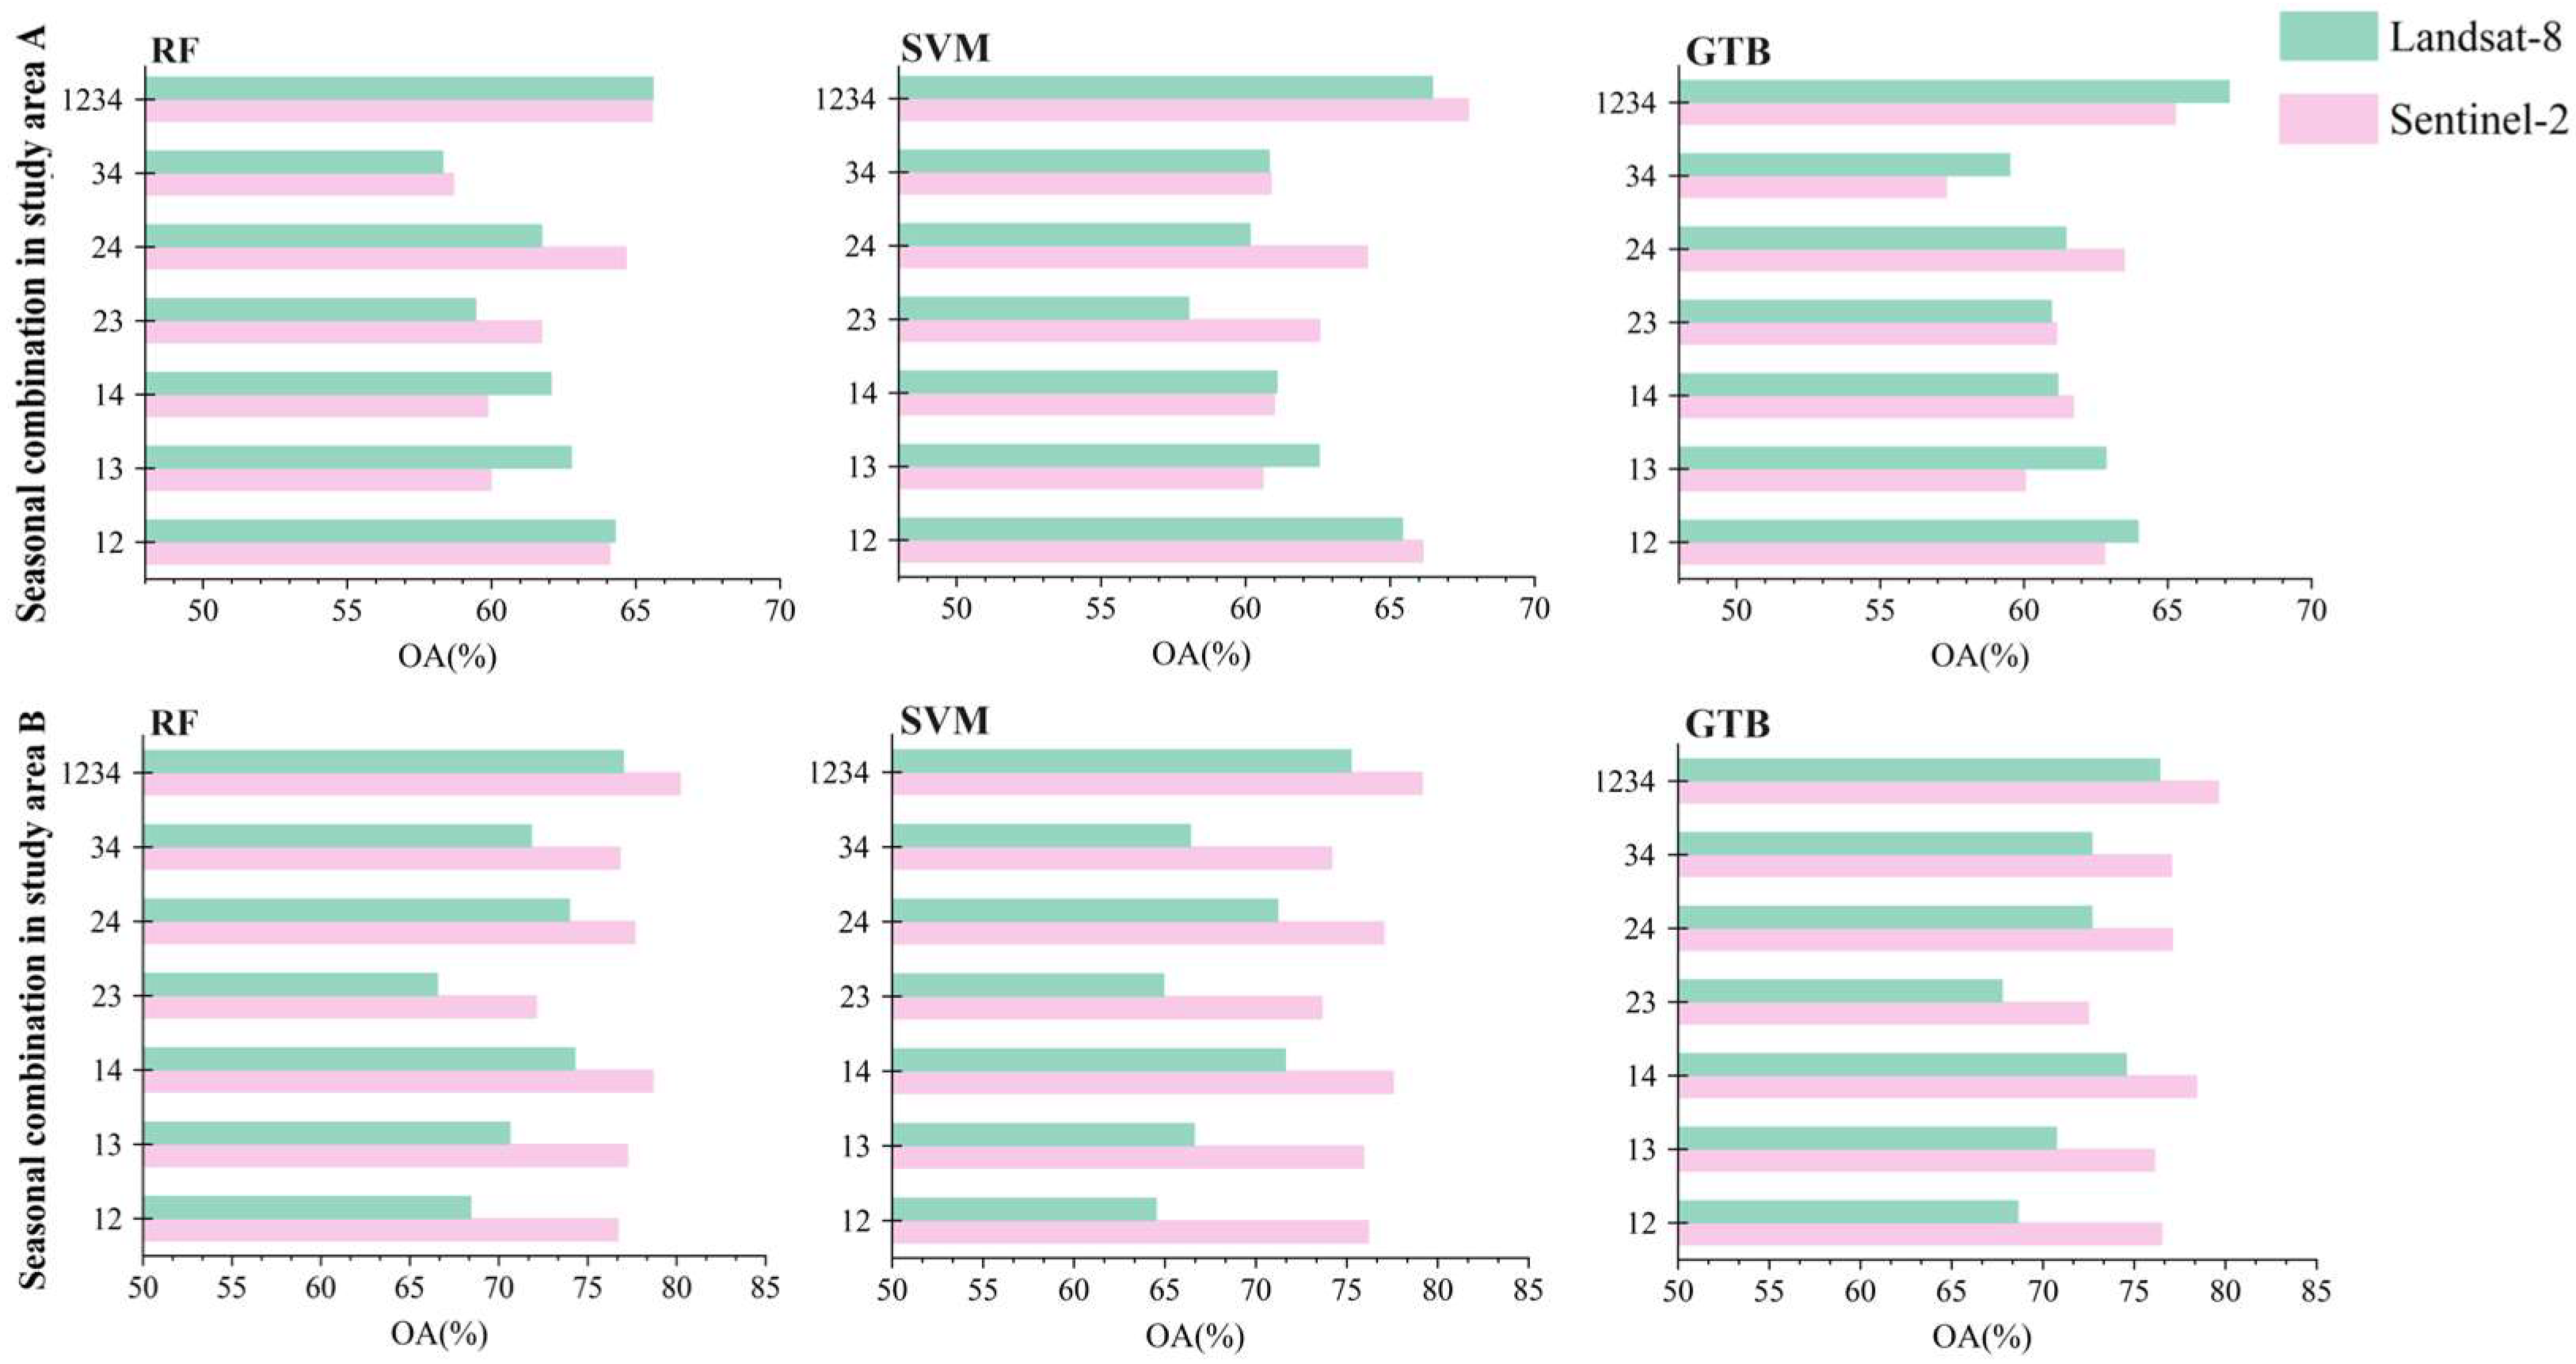
In terms of seasonal combinations, in study area A, tree species classification was best under the four-season combination. Among the combinations of two seasons, the best season combinations for the four classification schemes were all spring and summer; although the best season combination for Sentinel-2 image combined with RF algorithm and GTB algorithm classification was summer and winter, the overall accuracy was only 0.56% and 0.52% less than the spring and summer combination, respectively.
In study area B, the best species classification was under the four-season combination, with the best dual-season combination being spring and winter. Comparatively, multi-season images could provide information in the time dimension, especially for tree species with distinct phenological characteristics, as their spectral features differed significantly at different phases, and they were more easily identifiable under multi-season images.
3.2. Optimal Classification Scheme
Multi-season imagery has classification advantages over single-season imagery, prompting an exploration of the best classification scheme for seasonal combination imagery. As shown in Figure 6, under the best dual-season combination, study area A ranked the classification schemes by overall accuracy from high to low as follows: S2-SVM > L8-SVM > S2-RF > L8-RF > L8-GTB > S2-GTB. There was no apparent pattern in the classification performance between Sentinel-2 and Landsat-8, but, algorithm-wise, the SVM classifier performed the best. In study area B, the classification schemes were ranked by overall accuracy from high to low: S2-RF > S2-GTB > S2-SVM > L8-GTB > L8-RF > L8-SVM, with Sentinel-2 outperforming Landsat-8 and the RF and GTB classifiers outperforming the SVM classifier.
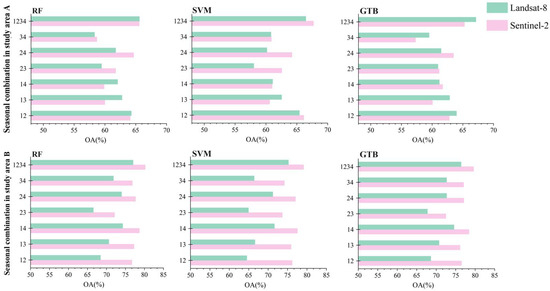
Figure 6.
Overall accuracy of classification for different classification schemes under seasonal combinations. The numbers 1, 2, 3, and 4 represent the seasons of spring, summer, fall, and winter.
Under four-season combinations, the best classification scheme for study area A was S2-SVM, and, for study area B, it was S2-RF. The tree species classification maps drawn according to the best classification schemes are shown in Figure 7.
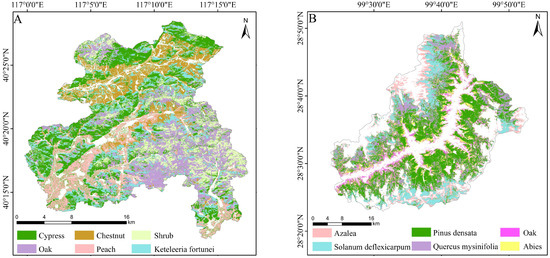
Figure 7.
Forest type coverage (10 m resolution) in 2021 for (A) study area A and (B) study area B.
The overall accuracy of tree species classification was influenced by the combination of imagery and classifiers. The classification performance of Sentinel-2 imagery was good, which was consistent with conclusions drawn by Soleimannejad et al. [26]. The choice of the best classifier varied according to the study area; the smaller number of sample points in study area A compared to B may be the reason why the SVM classifier could effectively find the optimal separation boundaries between different tree species [27]. Given the limitations of satellite trajectories and revisit cycles, the RF classifier’s resilience to interference might have made it a better choice for classifications in study area B.
Under the same classification scheme, study area B had higher classification accuracy than study area A. This could be related to the fact that study area B is mainly composed of natural forests, while study area A contains large areas of plantation forests. Natural forests have higher species diversity and more complex understory vegetation structures. This leads to richer textures and structural differences in remote sensing imagery, which helps to improve classification accuracy.
3.3. Optimal Data Source Combinations
The effects of topographical and backscattering coefficient features on classification accuracy were explored using the four-season combination imagery with the highest classification accuracy. As can be seen from Figure 8, the introduction of either topographical or backscattering coefficient features could improve the classification accuracy to some extent. When topographical features were added alone, the improvement in classification accuracy for study area A was generally within 1%. On average, the addition of topographical features enhanced the classification accuracy for study area B by 4.2%, a significant improvement. This suggests that topographical features can effectively improve the performance of tree species classification in areas with notable terrain differences [16]. The improvement of classification accuracy in both study areas A and B was generally within 1% when backscattering coefficient features were added alone, which was not a significant effect [28].
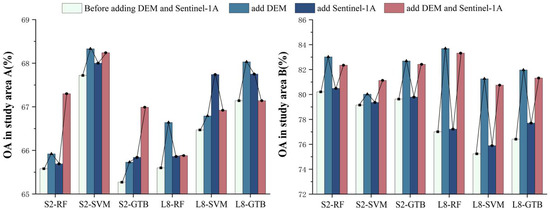
Figure 8.
Comparison of overall accuracy before and after adding DEM and Sentinel-1A.
Compared to the introduction of a single feature, the simultaneous introduction of both features in most cases actually caused a decline in classification accuracy. After the simultaneous addition of both features, only the S2-RF and S2-GTB classification schemes continued to rise in classification accuracy for study area A. For study area B, only the S2-SVM classification scheme continued to improve in accuracy after the introduction of both data types. Therefore, the simultaneous introduction of these two features did not always positively affect classification performance [29]; the inclusion of topographical features or backscattering coefficient features alone in study area A could improve classification accuracy and the inclusion of topographical features alone in study area B could significantly improve classification accuracy.
4. Discussion
4.1. Comparison of Important Features in the Study Area
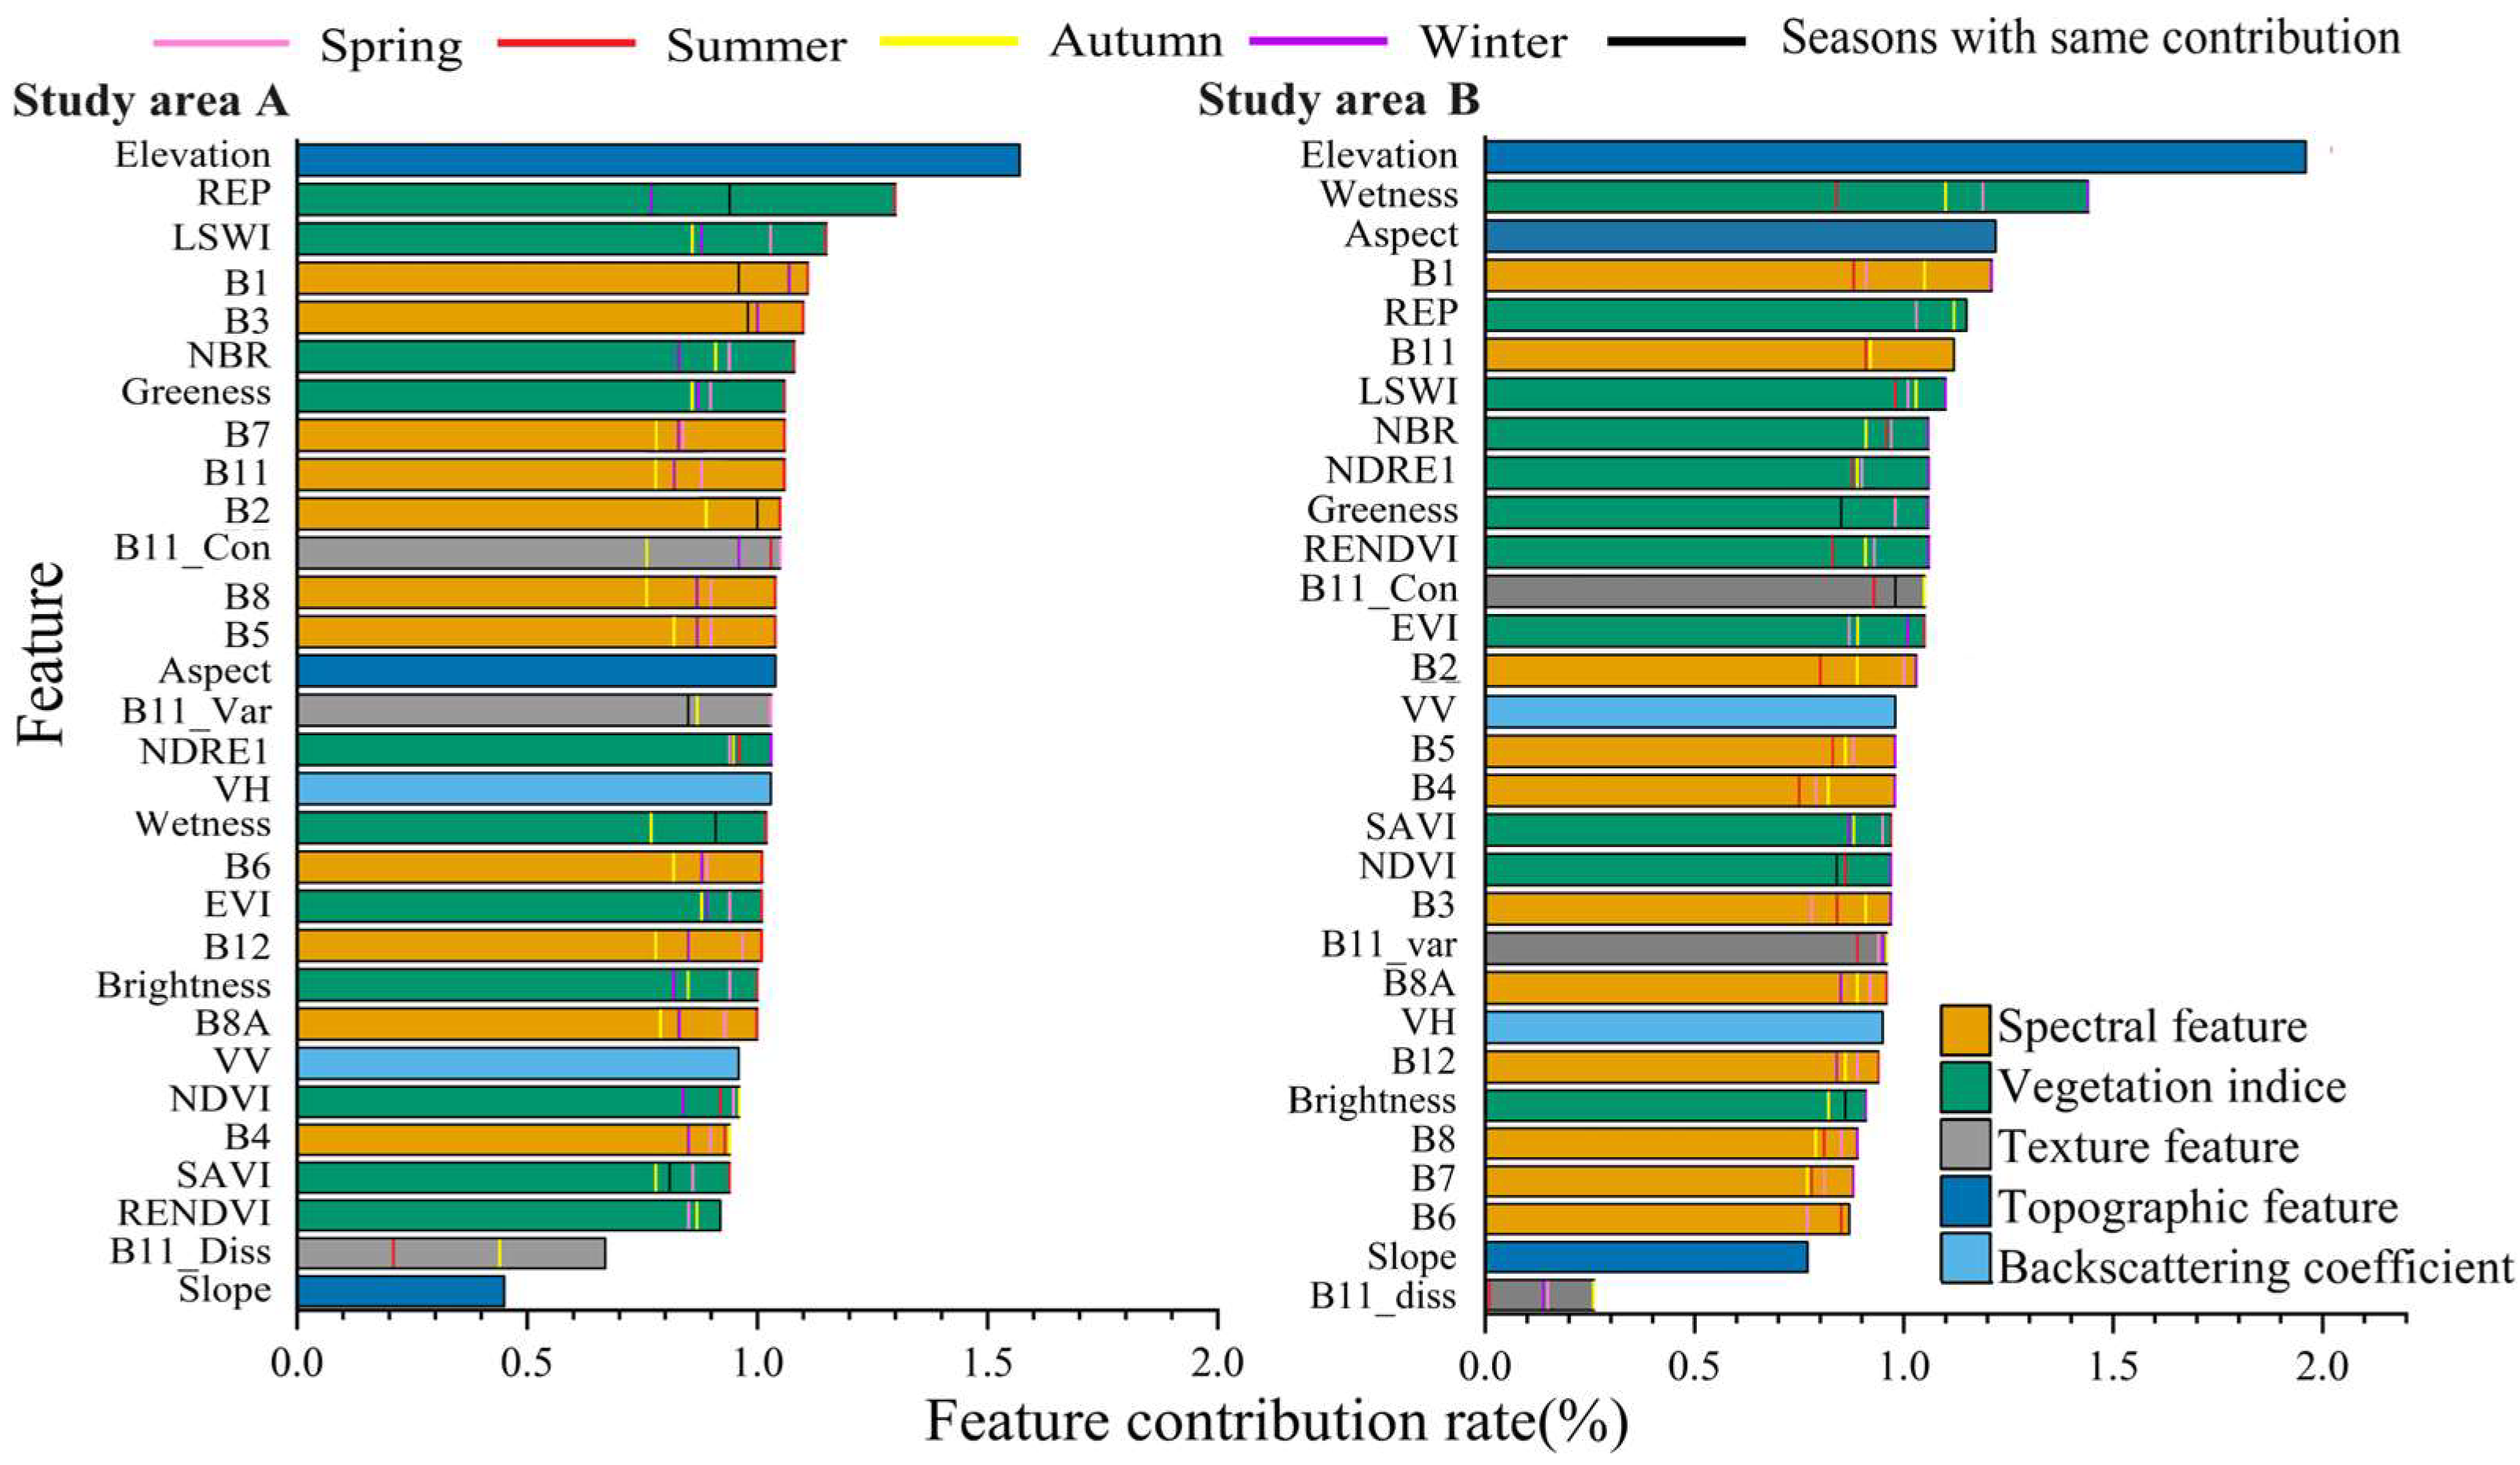
Feature importance can be used to evaluate the contribution level of each feature to classification [30]. In this study, the importance of feature components was characterized by the RF classifier, which calculated the contribution rate of each feature based on the Sentinel-2 imagery for all four seasons to quantitatively evaluate the patterns in which different features played a role in the classification of study areas in the north and south [31]; the feature contribution rates are shown in Figure 9. In both study areas A and B, elevation was identified as the most important feature. This finding is consistent with a study by Sesnie et al. [32], which found that elevation is closely related to tree species composition. The most important features for tree species classification in different environmental areas are not the same. Besides elevation, spectral features and vegetation indices also have significant importance for classification.
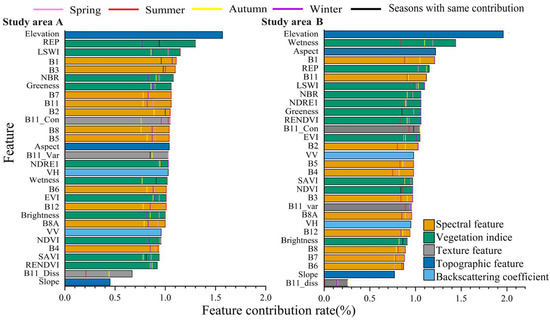
Figure 9.
Feature contribution rates for study areas A and B.
In study area A, winter B1 and summer B3 had relatively high feature contribution rates, while, in study area B, winter B1 and B11 had high feature contribution rates. The developed industry in study area A and the unique climate in study area B are the main factors behind the high aerosol content in both areas, which can aid in distinguishing different tree species in such environments [33]. The reflection in the visible and near-infrared bands was primarily dominated by vegetation’s absorption of chlorophyll, making them powerful bands for differentiating vegetation [34].
In study area A, summer REP and LSWI had relatively high feature contribution rates. In study area B, winter wetness and REP were influential. REP can respond promptly to minute changes in vegetation chlorophyll concentration [35] and LSWI is sensitive to the water content in vegetation leaves and soil moisture. The high vegetative cover in study area B enabled a better capturing of the seasonal changes in trees through humidity [5].
In study area B, aspect also had a relatively high feature contribution rate. In areas with significant topographical variation, terrain is one of the main factors affecting forest type classification.
Texture and backscattering coefficient features did not have as significant an impact on classification as the other types of features. Additionally, in study area B, the season with the highest contribution rate for the spectral features and vegetation indices was consistent with the best single season for classification, which was winter [36].
4.2. Impact of Topographic Units on Classification
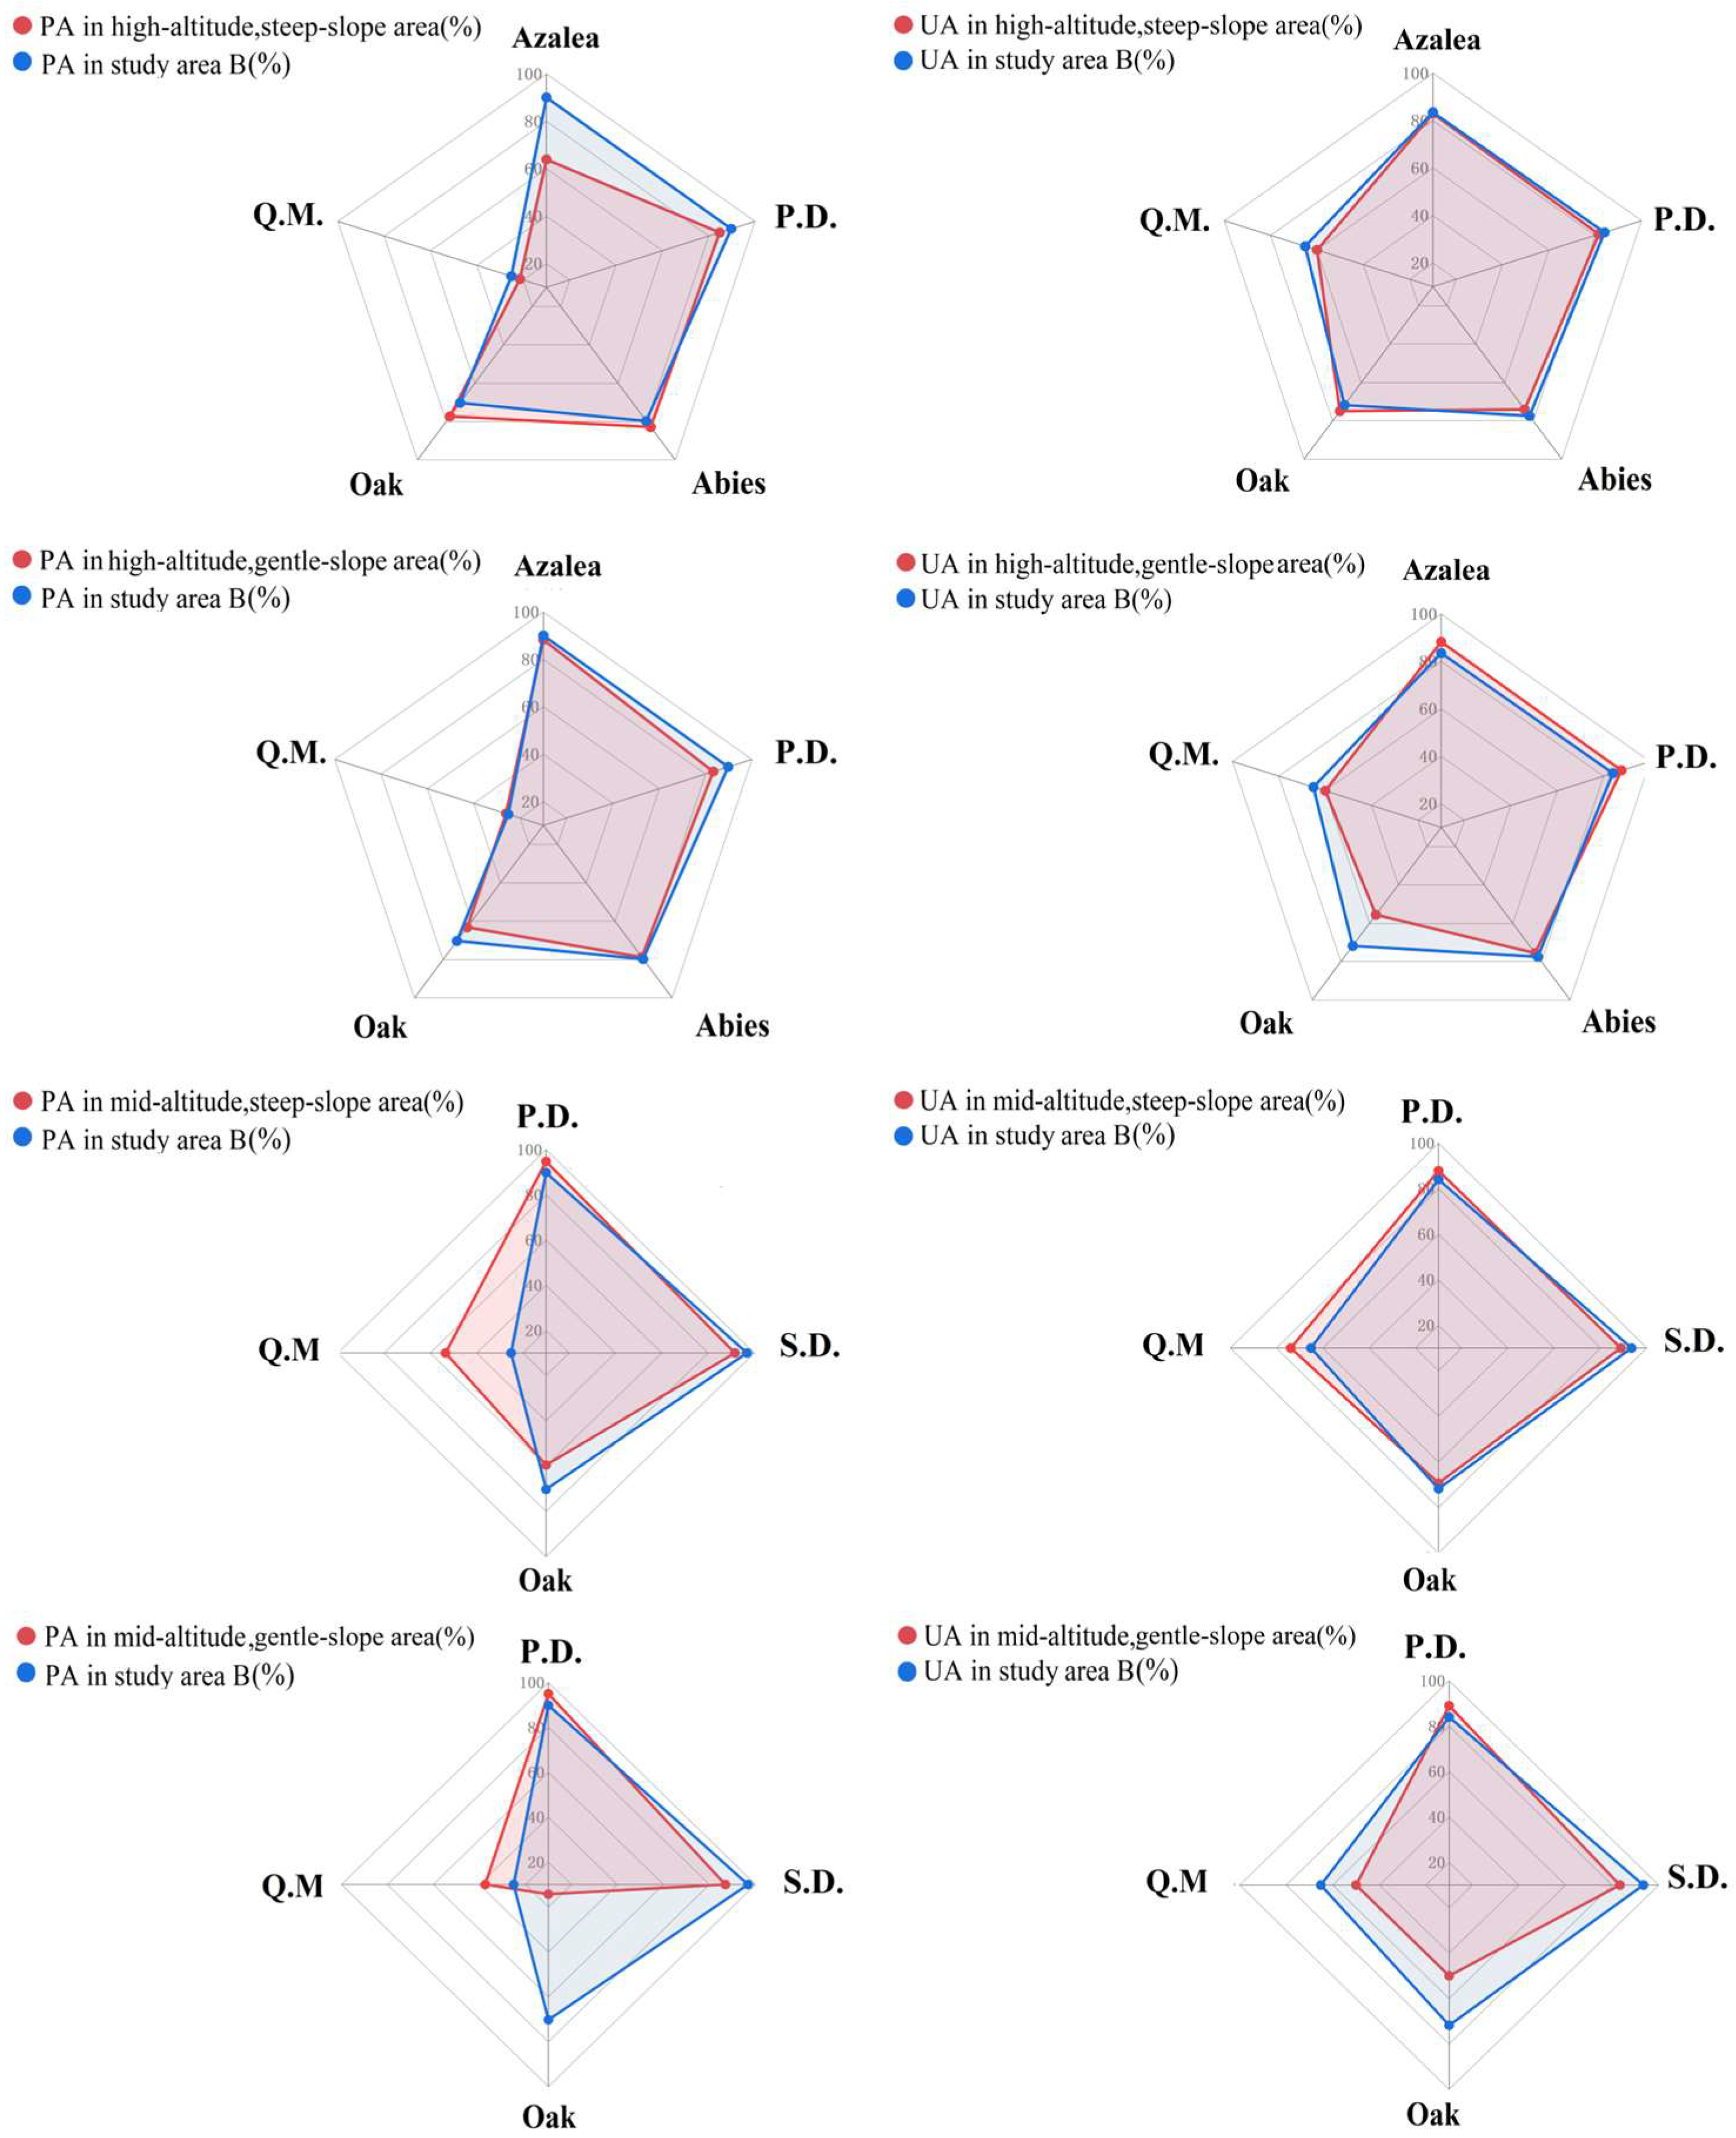
The variation in terrain has a significant impact on the distribution of tree species within forests [37], and many vegetation distribution patterns are related to the altitude of topographic units [38]. For study area B, where there are substantial terrain differences and the distribution of tree species is closely related to the terrain, the area was divided into four topographic units based on elevation and slope categories used in forestry surveys: high-altitude, steep slope area; high-altitude, gentle slope area; mid-altitude, steep slope area; and mid-altitude, gentle slope area; the units are as shown in Figure 10. To assess the impact of these defined topographic units on tree species classification accuracy, the best classification scheme derived from Section 3.3 was applied, which involved using Landsat-8 four-season composite imagery with added topographic features in combination with an RF classifier. This approach allowed for the exploration of how the division into different topographic units could affect the accuracy of tree species classification in study area B. Producer’s accuracy and user accuracy for the major tree species are shown in Figure 11, and the overall accuracy and Kappa static of each topographic unit shown in Table 2.
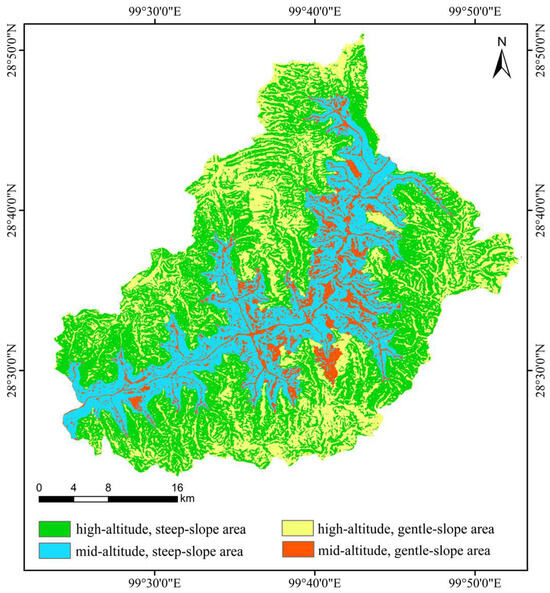
Figure 10.
Topographic units in study area B.
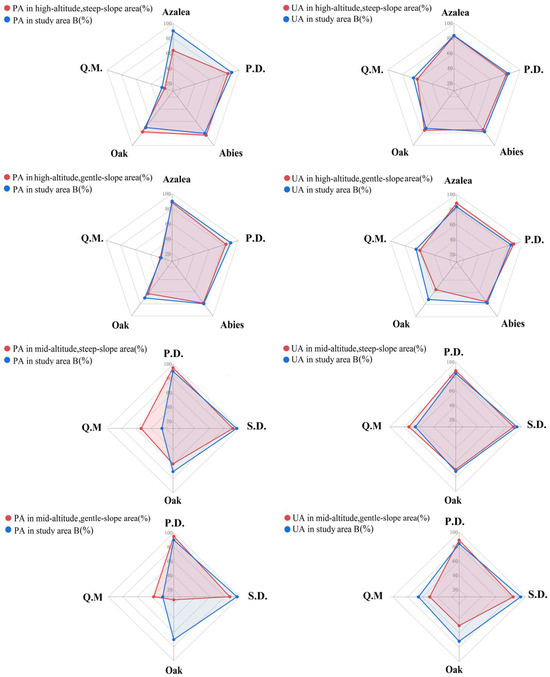
Figure 11.
Producer’s accuracy and user accuracy of major tree species in different topographic units.
Table 2.
Comparison of accuracy before and after terrain delineation.
In the high-altitude, steep slope area, there was no significant difference in user accuracy across different tree species before and after delineating the topographic unit. However, when it came to producer’s accuracy, the classification accuracy of Azalea decreased by 26.11% after the division into topographic units, while the classification accuracy of oak increased by 6.99%. From the perspective of overall accuracy, the classification accuracy of tree species decreased after the division into high-altitude, steep slope areas, indicating certain difficulties in tree species classification in these areas.
In the high-altitude, gentle slope area, there was no significant difference in producer’s accuracy across different tree species before and after delineating the topographic unit. However, from the user accuracy perspective, the classification accuracy of oak decreased by 16.19% and the accuracy for quercus myrsinifolia (Q.M.) decreased by 4.31% after the division into topographic units, with other tree species not showing significant changes. In general, most tree species saw a decline in classification accuracy after being divided into high-altitude, gentle slope areas.
In the mid-altitude, steep slope area, the classification accuracy of Q.M. increased by 28.33% from the producer’s accuracy perspective after the division into topographic units, while oak classification accuracy decreased by 10.73%. In terms of user accuracy, the classification accuracy for Q.M. increased by 7.86% after the division. Combining this with overall accuracy, there appeared to be an improvement in tree species classification accuracy after the division into mid-altitude steep slope areas, consistent with the findings of Camile et al. [39].
In the mid-altitude, gentle slope area, from a producer’s accuracy standpoint, the classification accuracy for oak decreased by 56% after the division into topographic units. Looking at user accuracy, there was a clear decline in classification accuracy for all three species of trees. Combined with the overall accuracy, there was a decline in tree species classification accuracy after the division into mid-altitude, gentle slope areas. Overall, after dividing into topographic units, the classification accuracy for some units improved, while, for others, it declined, which is consistent with the patterns found by Pittman and Hu in their tree species classification study in Ontario, Canada [37].
4.3. Limitations and Future Prospects
In terms of data sources, although this study combined data from multiple sources, the Sentinel-1A data did not improve the classification accuracy of the two study areas satisfactorily. As an active remote sensing technology, the synthetic aperture radar (SAR) system used by Sentinel-1A can record signals reflected back from the ground in any weather, day and night. It is necessary to further understand the working principle and applicable conditions of the SAR technology in order to better combine passive and active remote sensing to improve the classification effect. Tree height information can make up for the lack of information on the vertical structure of forests, and it is necessary to further explore how to use digital photogrammetry technology to extract information such as forest canopy height and apply it to the classification of tree species. The fusion of hyperspectral and high spatial resolution data can be used for refined tree species mapping, but the high cost of image acquisition, the loss of information during image fusion, and the lack of effective fusion algorithms need to be further solved.
In terms of classification algorithms, with the continuous development of hardware and technology, deep learning methods have also been applied to tree classification, and they can be utilized to obtain better classification effects when the training dataset is large. However, deep learning methods have high requirements for samples and are not yet able to be applied to large-scale tree classification due to the large amount of data at runtime, the long runtime caused by the number of iterations, and the high hardware requirements. Therefore, we can try to use deep learning methods in a small range and compare them with machine learning in future research to explore the best algorithm to improve the accuracy and efficiency of tree classification.
5. Conclusions
In this study, six classification schemes consisting of image–classifier combinations were used to classify tree species using imagery from both single seasons and seasonal combinations. Taking two typical forest distribution regions in northern and southern China as examples, it was found that the optimal single season for classification differed between the north and south study areas, with seasonal combinations providing enhanced classification accuracy compared to single seasons. Among the six classification schemes, Sentinel-2 performed well in classification. The optimal classifier was influenced by factors such as the study area’s size, environment, and tree species distribution; SVM classifiers yielded higher classification accuracy in northern forests, while RF classifiers were more accurate for southern forests.
The degree to which features contributed to classification varied in different environments. The inclusion of topographic features or backscattering coefficient features could improve classification accuracy, with topographic features having a more significant positive effect on classification accuracy in the southern study area, where terrain variations were larger. The evaluation of feature importance indicated that elevation was the most important feature for classification, with spectral features and vegetation indices also being significant.
In areas with large terrain variations, dividing the study area into topographic units could enhance the accuracy of tree species classification within specific units. This detailed attention to the role of terrain elevates the precision of forestry mapping and contributes to a deeper understanding of how environmental characteristics influence the distribution and classification of tree species.
Author Contributions
Conceptualization, J.Z. and J.W.; methodology, J.Z.; software, J.Z., H.L., R.L. and X.S.; validation, J.Z.; formal analysis, J.Z., H.L. and J.W.; investigation, J.Z.; resources, J.Z.; data curation, J.Z.; writing—original draft preparation, J.Z.; writing—review and editing, J.Z., J.W. and Y.L.; visualization, J.Z.; supervision, J.W.; project administration, J.W.; funding acquisition, J.W. All authors have read and agreed to the published version of the manuscript.
Funding
This work was supported by the Fundamental Research Funds for the Beijing Natural Science Foundation Program (grant numbers 8222069 and 8222052) and the Natural Science Foundation of China (grant numbers 42330507 and 42171329).
Data Availability Statement
Data are contained within the article.
Acknowledgments
We are grateful to the undergraduate students and staff of the Laboratory of Forest Management and “3S” Technology, Beijing Forestry University.
Conflicts of Interest
The authors declare no conflicts of interest. The funders had no role in the design of the study; in the collection, analyses, or interpretation of data; in the writing of the manuscript; or in the decision to publish the results.
References
- Xiang, L.; Julian, F.; Catalina, M.; Nicole, S.; Barbara, K. Mapping tree species diversity in temperate montane forests using Sentinel-1 and Sentinel-2 imagery and topography data. Remote Sens. Environ. 2023, 292, 113576. [Google Scholar]
- Zhang, P.; Shao, G.; Zhao, G.; Master, D.C.L.; Parker, G.R.; Dunning, J.B.; Li, Q. China’s Forest Policy for the 21st Century. Science 2000, 288, 2135–2136. [Google Scholar] [CrossRef] [PubMed]
- Goodbody, T.R.H.; Coops, N.C.; White, J.C. Digital Aerial Photogrammetry for Updating Area-Based Forest Inventories: A Review of Opportunities, Challenges, and Future Directions. Curr. For. Rep. 2019, 5, 55–75. [Google Scholar] [CrossRef]
- Ruiliang, P. Mapping Tree Species Using Advanced Remote Sensing Technologies: A State-of-the-Art Review and Perspective. J. Remote Sens. 2021, 2021, 9812624. [Google Scholar]
- Fassnacht, F.E.; Latifi, H.; Stereńczak, K.; Modzelewska, A.; Lefsky, M.; Waser, L.T.; Straub, C.; Ghosh, A. Review of studies on tree species classification from remotely sensed data. Remote Sens. Environ. 2016, 186, 64–87. [Google Scholar] [CrossRef]
- Ning, Y.; Justin, M.; Cong, X.; Na, C. Indigenous forest classification in New Zealand—A comparison of classifiers and sensors. Int. J. Appl. Earth Obs. Geoinf. 2021, 102. [Google Scholar]
- Liu, L.; Coops, N.C.; Aven, N.W.; Pang, Y. Mapping urban tree species using integrated airborne hyperspectral and LiDAR remote sensing data. Remote Sens. Environ. 2017, 200, 170–182. [Google Scholar] [CrossRef]
- Michael, L.; Alena, D.; Markus, H.; Clement, A.; Markus, I. Combination of Sentinel-1 and Sentinel-2 Data for Tree Species Classification in a Central European Biosphere Reserve. Remote Sens. 2022, 14, 2687. [Google Scholar] [CrossRef]
- Janne, M.; Sarita, K.-S.; Sonja, K.; Topi, T.; Pekka, H.; Peter, K.; Laura, P.; Arto, V.; Sakari, T.; Timo, K.; et al. Tree species classification from airborne hyperspectral and LiDAR data using 3D convolutional neural networks. Remote Sens. Environ. 2021, 256, 112322. [Google Scholar]
- Corentin, B.; Philippe, L.; Adrien, M.; Nicolas, L. Mapping tree species proportions from satellite imagery using spectral–spatial deep learning. Remote Sens. Environ. 2022, 280, 113205. [Google Scholar]
- Zhonglu, L.; Hui, L.; Jie, Z.; Linhai, J.; Yunwei, T.; Hongkun, W. Individual Tree Species Classification Based on a Hierarchical Convolutional Neural Network and Multitemporal Google Earth Images. Remote Sens. 2022, 14, 5124. [Google Scholar] [CrossRef]
- Koukal, T.; Immitzer, M.; Atzberger, C. Tree Species Classification with Random Forest Using Very High Spatial Resolution 8-Band WorldView-2 Satellite Data. Remote Sens. 2012, 4, 2661–2693. [Google Scholar] [CrossRef]
- Pu, R.; Landry, S.; Yu, Q. Assessing the potential of multi-seasonal high resolution Pléiades satellite imagery for mapping urban tree species. Int. J. Appl. Earth Obs. Geoinf. 2018, 71, 144–158. [Google Scholar]
- Key, T.; Warner, T.A.; McGraw, J.B.; Fajvan, M.A. A Comparison of Multispectral and Multitemporal Information in High Spatial Resolution Imagery for Classification of Individual Tree Species in a Temperate Hardwood Forest. Remote Sens. Environ. 2001, 75, 100–112. [Google Scholar] [CrossRef]
- Traganos, D.; Aggarwal, B.; Poursanidis, D.; Topouzelis, K.; Chrysoulakis, N.; Reinartz, P. Towards Global-Scale Seagrass Mapping and Monitoring Using Sentinel-2 on Google Earth Engine: The Case Study of the Aegean and Ionian Seas. Remote Sens. 2018, 10, 1227. [Google Scholar] [CrossRef]
- Kai, C.; Juanle, W.; Xinrong, Y. Mapping Forest Types in China with 10 m Resolution Based on Spectral–Spatial–Temporal Features. Remote Sens. 2021, 13, 973. [Google Scholar] [CrossRef]
- Jingru, Y.; Feiyue, M.; Lin, Z.; Yi, Z.; Jia, H.; Jianhua, Y.; Jiangping, C. Why do extreme particulate pollution events occur in low-emission Yunnan Province, China? Atmos. Environ. 2022, 289, 119336. [Google Scholar]
- Immitzer, M.; Vuolo, F.; Atzberger, C. First Experience with Sentinel-2 Data for Crop and Tree Species Classifications in Central Europe. Remote Sens. 2016, 8, 166. [Google Scholar] [CrossRef]
- Mengyu, W.; Yi, Z.; Chengquan, H.; Ran, M.; Yong, P.; Wen, J.; Jie, Z.; Zehua, H.; Linchuan, F.; Feng, Z. Assessing Landsat-8 and Sentinel-2 spectral-temporal features for mapping tree species of northern plantation forests in Heilongjiang Province, China. For. Ecosyst. 2022, 9, 100032. [Google Scholar]
- Ying, Y.; Xuefeng, W.; Mengmeng, S.; Peng, W. Performance comparison of RGB and multispectral vegetation indices based on machine learning for estimating Hopea hainanensis SPAD values under different shade conditions
. Front. Plant Sci. 2022, 13, 928953. [Google Scholar]
- Rogan, J.; Franklin, J.; Roberts, D.A. A comparison of methods for monitoring multitemporal vegetation change using Thematic Mapper imagery. Remote Sens. Environ. 2002, 80, 143–156. [Google Scholar] [CrossRef]
- Firat, E.; Can, B.O. Evaluating the effects of texture features on Pinus sylvestris classification using high-resolution aerial imagery. Ecol. Inform. 2023, 78. [Google Scholar]
- Ulander, L.M.H. Radiometric slope correction of synthetic-aperture radar images. IEEE Trans. Geosci. Remote Sens. 1996, 34, 1115–1122. [Google Scholar] [CrossRef]
- Clark, M.L. Comparison of simulated hyperspectral HyspIRI and multispectral Landsat 8 and Sentinel-2 imagery for multi-seasonal, regional land-cover mapping. Remote Sens. Environ. 2017, 200, 311–325. [Google Scholar] [CrossRef]
- Jong, R.d.; Bruin, S.d.; Wit, A.d.; Schaepman, M.E.; Dent, D.L. Analysis of monotonic greening and browning trends from global NDVI time-series. Remote Sens. Environ. 2010, 115, 692–702. [Google Scholar] [CrossRef]
- Soleimannejad, L.; Ullah, S.; Abedi, R.; Dees, M.; Koch, B. Evaluating the potential of sentinel-2, landsat-8, and irs satellite images in tree species classification of hyrcanian forest of iran using random forest. J. Sustain. For. 2019, 38, 615–628. [Google Scholar] [CrossRef]
- Liu, P.; Ren, C.; Wang, Z.; Jia, M.; Yu, W.; Ren, H.; Xia, C. Evaluating the Potential of Sentinel-2 Time Series Imagery and Machine Learning for Tree Species Classification in a Mountainous Forest. Remote Sens. 2024, 16, 293. [Google Scholar] [CrossRef]
- Yu, Y.; Li, M.; Fu, Y. Forest type identification by random forest classification combined with SPOT and multitemporal SAR data. J. For. Res. 2018, 29, 1407–1414. [Google Scholar] [CrossRef]
- Zhang, C.; Franklin, S.E.; Wulder, M.A. Geostatistical and texture analysis of airborne-acquired images used in forest classification. Int. J. Remote Sens. 2004, 25, 859–865. [Google Scholar] [CrossRef]
- Olofsson, P.; Foody, G.M.; Herold, M.; Stehman, S.V.; Woodcock, C.E.; Wulder, M.A. Good practices for estimating area and assessing accuracy of land change. Remote Sens. Environ. 2014, 148, 42–57. [Google Scholar] [CrossRef]
- Qian, G.; Jian, Z.; Shijie, G.; Zhangxi, Y.; Hui, D.; Xiaolong, H.; Houxi, Z. Urban Tree Classification Based on Object-Oriented Approach and Random Forest Algorithm Using Unmanned Aerial Vehicle (UAV) Multispectral Imagery. Remote Sens. 2022, 14, 3885. [Google Scholar] [CrossRef]
- Sesnie, S.E.; Gessler, P.E.; Finegan, B.; Thessler, S. Integrating Landsat TM and SRTM-DEM derived variables with decision trees for habitat classification and change detection in complex neotropical environments. Remote Sens. Environ. 2008, 112, 2145–2159. [Google Scholar] [CrossRef]
- Haotian, Y.; Yuanwei, H.; Zhigang, Q.; Jianjun, C.; Yao, L. Forest Tree Species Classification Based on Sentinel-2 Images and Auxiliary Data. Forests 2022, 13, 1416. [Google Scholar] [CrossRef]
- Hennessy, A.; Clarke, K.; Lewis, M. Hyperspectral Classification of Plants: A Review of Waveband Selection Generalisability. Remote Sens. 2020, 12, 113. [Google Scholar] [CrossRef]
- Torsten, W.; Lukas, A.; Kevin, K.; Stefan, K.; Jonas, F. Mapping Dominant Tree Species of German Forests. Remote Sens. 2022, 14, 3330. [Google Scholar] [CrossRef]
- Persson, M.; Lindberg, E.; Reese, H. Tree Species Classification with Multi-Temporal Sentinel-2 Data. Remote Sens. 2018, 10, 1794. [Google Scholar] [CrossRef]
- Clifford, P.R.; Baoxin, H. Contribution of topographic features and categorization uncertainty for a tree species classification in the boreal biome of Northern Ontario. GIScience Remote Sens. 2023, 60, 2214994. [Google Scholar]
- Chuyong, G.B.; Kenfack, D.; Harms, K.E.; Thomas, D.W.; Condit, R.; Comita, L.S. Habitat specificity and diversity of tree species in an African wet tropical forest. Plant Ecol. 2011, 212, 1363–1374. [Google Scholar] [CrossRef]
- Sothe, C.; Dalponte, M.; Almeida, C.M.d.; Schimalski, M.B.; Lima, C.L.; Liesenberg, V.; Miyoshi, G.T.; Tommaselli, A.M.G. Tree Species Classification in a Highly Diverse Subtropical Forest Integrating UAV-Based Photogrammetric Point Cloud and Hyperspectral Data. Remote Sens. 2019, 11, 1338. [Google Scholar] [CrossRef]


Disclaimer/Publisher’s Note: The statements, opinions and data contained in all publications are solely those of the individual author(s) and contributor(s) and not of MDPI and/or the editor(s). MDPI and/or the editor(s) disclaim responsibility for any injury to people or property resulting from any ideas, methods, instructions or products referred to in the content. |
© 2024 by the authors. Licensee MDPI, Basel, Switzerland. This article is an open access article distributed under the terms and conditions of the Creative Commons Attribution (CC BY) license (https://creativecommons.org/licenses/by/4.0/).