Article

Assembly and Comparative Analyses of the Chloroplast Genomes of the Threatened Plant Rosa anemoniflora

1
Institute of Forest Ecology and Carbon Sink Measurement, Department of Forestry, Fujian Forestry Vocational and Technical College, Nanping 353000, China
2
National Nature Reserve of Mangdang Mountain of Fujian Province, Nanping 353000, China
3
Landscape Planning and Design Institute of Fujian Academy of Forestry, Fuzhou 353012, China
*
Author to whom correspondence should be addressed.
Forests 2024, 15(6), 940; https://doi.org/10.3390/f15060940
Submission received: 17 April 2024 / Revised: 18 May 2024 / Accepted: 25 May 2024 / Published: 29 May 2024
(This article belongs to the Special Issue Forest-Tree Comparative Genomics and Adaptive Evolution)

Abstract

:
Due to insufficient molecular biology and genetic research on Rosa anemoniflora, this endangered plant has not yet received effective protection. Therefore, the complete chloroplast genome sequence of R. anemoniflora, along with comparative analysis of the chloroplast genomes of related species, is necessary and crucial for reconstructing phylogenetic relationships and developing genetic markers to conserve these species. A series of analyses, including genome structure, GC content, gene number, selection pressure, and nucleotide diversity, were performed by comparing the chloroplast genomes of R. anemoniflora and its relatives. The results indicate that the chloroplast genomes of R. anemoniflora and its close relatives are highly conserved in all genome characteristics, and all protein-coding genes in R. anemoniflora have not experienced significant positive or negative selection pressures. Comparative analysis revealed several variation hotspots, such as the atpH-atpI region, which can serve as a DNA barcode for distinguishing R. anemoniflora from its close relatives. Finally, the results confirmed that R. anemoniflora belongs to Rosa section Synstylae and that R. anemoniflora and its close relatives likely originated from the Fujian and Taiwan regions of China and diverged approximately 3.24 million years ago. This study provides crucial information for future biodiversity conservation and genetic resource management.

1. Introduction

Rosa anemoniflora Fortune ex Lindl. belongs to the genus Rosa, which is important within the Rosaceae family. This genus includes numerous species and serves as a source of many horticultural and medicinal plants. R. anemoniflora is a climbing shrub with a small stature. Its young branches are purple-brown and cylindrical. The plant has three small leaflets and light pink flowers, making it highly ornamental and an important plant germplasm resource. Currently, R. anemoniflora is found only in Nanping city, Fujian Province, China, and is primarily distributed on slopes, wastelands, roadsides, and riverbanks at altitudes ranging from 400 to 1000 m [1]. Its population is currently distributed in a patchy manner, with some small populations in a state of severe isolation. Field surveys have indicated a substantially insufficient population size, classifying it as a typical extremely small population, well below the globally recognized minimum viable population standard (approximately 10,000 individuals) for shrubby plants. Consequently, in 2020, R. anemoniflora was listed on the China Biodiversity Red List (https://www.mee.gov.cn/xxgk2018/xxgk/xxgk01/202305/W020230522536560832337.pdf, accessed on 16 May 2024) and designated as a second-level protected plant on the Chinese National Key Protected Wild Plants List.
R. anemoniflora’s exserted and columnated styles provide strong evidence for its inclusion in the Synstylae section [2]. However, morphological characteristics have a limited ability to establish species boundaries due to small variations induced by environmental or genetic factors. Consequently, distinguishing R. anemoniflora from its close relatives based on external features is challenging, complicating the accurate identification of conservation targets. Genetic characterization studies on R. anemoniflora can clarify its phylogenetic position and evolutionary history and aid in the development of high-resolution molecular markers. To our knowledge, such studies have not been conducted previously, and filling this knowledge gap was the primary motivation for this study.
Studying the chloroplast genomes of this highly endangered species provides a solid foundation for its genetic characterization. Chloroplast genome sequences are widely employed in plant molecular phylogenetics, population genetics, and conservation genetics due to their slower evolution rate than nuclear genomes, maternal inheritance, and lower recombination rate [3,4]. In addition, chloroplast genomes are important for determining plant stress responses [5]. For instance, the upregulation of psbA significantly enhances the repair of photosystem II under strong light stress [6], petL is markedly upregulated during cold acclimation, potentially playing a role in a plant’s response to low-temperature stress [7], and the expression of the chloroplast ribosomal protein-encoding gene RPS1 is crucial for the response to heat stress [8]. Therefore, whole chloroplast genome sequences can provide a wealth of genetic information and are useful molecular markers for efficient conservation and management strategies [9,10,11].
In this study, the first complete chloroplast genome of the endangered species R. anemoniflora was assembled and compared with that of its close relatives. Our main goals were (1) to characterize and compare the chloroplast genomes of Rosa sect. Synstylae plants; (2) to identify hotspots of variation in the chloroplast genomes of Rosa sect. Synstylae plants and develop high-resolution molecular markers based on these hotspots; and (3) to clarify the taxonomic status, evolutionary history, and ancestral distribution of R. anemoniflora. Our study results will provide important scientific insights for the comprehensive conservation of R. anemoniflora.

2. Materials and Methods

2.1. Collection and Preservation of Experimental Material

The R. anemoniflora research material was collected from the Mangdangshan National Nature Reserve in Fujian (34°10′12″ N, 116°30′41″ E). The collection and experiments of plant materials complied with the relevant guidelines and regulations of the Mangdangshan National Nature Reserve. Species identification was performed by Guosheng He, a professor at Fujian Forestry Vocational and Technical College, and specimens were deposited in the Herbarium, Institute of Botany, Chinese Academy of Sciences (PE 01651707). Leaf samples were dried with silica gel and stored in the laboratory. The silica-dried leaf samples of R. anemoniflora were subsequently sent to Genepioneer Biotechnologies (Nanjing, China) for sequencing. Total genomic DNA was extracted using the Plant Genomic DNA Kit (TIANGEN, Beijing, China). DNA purity was assessed using a 1.0% agarose gel, and qualified DNA samples were used to construct libraries and perform paired-end sequencing (PE) with a read length of 150 bp on the Illumina NovaSeq platform. Sequencing was conducted by Nanjing Jessyn Bio Science & Technology Co., Ltd. (Nanjing, China).

2.2. Chloroplast Genome Assembly and Annotation

Fastp v0.20.0 [12] (https://github.com/OpenGene/fastp, accessed on 16 May 2024) software was used for initial data filtering. Subsequently, Bowtie2 v2.2.4 [13] (http://bowtie-bio.sourceforge.net/Bowtie2/index.shtml, accessed on 16 May 2024) was used to align the sequences to the chloroplast genome database. The resulting sequences were considered the study chloroplast genome sequences. SPAdes [14] generated the seed sequence, subjected to Kmer iterative extension and classified as a contig if an overlap group was formed. This sequence was designated a pseudogenomic sequence. Bowtie2 was used to align the sequenced sequence to the pseudogenomic sequence, ensuring that the reads coverage of the assembly results was normal. SSPACE v2.0 (https://www.baseclear.com/, accessed on 16 May 2024) was used to connect contigs into scaffolds, and Gapfiller v2.1.1 (https://sourceforge.net/projects/gapfiller/, accessed on 16 May 2024) was used to fill in the scaffold sequences. In the case of gaps, primers were designed for PCR sequencing until a complete pseudogenomic sequence was obtained. Alignment to the pseudogenome verified the final assembly accuracy. Finally, using the large single-copy region as the starting point and referring to the orientation of the small single-copy region in Rosa lucidissima H. Lév. (MK782979.1.gbk), the pseudogenome was rearranged to construct a circular chloroplast genome sequence. For annotation, the CDSs were compared with those of the closely related species R. lucidissima on NCBI using BLAST [15]. The rRNA sequences of the R. lucidissima (MK782979) were extracted and aligned using MAFFT [16] (v, --auto), and then the hidden Markov model was constructed using the hmmbuild tool from the HMMER [17] package. Finally, nhmmer was used to search. Aragorn [18] was used to predict tRNAs, and OGDRAW (https://chlorobox.mpimp-golm.mpg.de/OGDraw.html, accessed on 16 May 2024) was used to generate circular plastome maps.

2.3. Chloroplast Genome Comparative Analysis

Seven species belonging to Rosa sect. Synstylae and sect. Chinenses were selected for analysis. R. anemoniflora and R. lucidissima are endangered plants, while Rosa brunonii Lindl., Rosa maximowicziana Regel, Rosa multiflora Thunb., Rosa chinensis Jacq. and Rosa odorata (Andr.) Sweet are non-endangered plants that served as controls (Table S1). The Geneious Prime 2024.0 [19] software was used to calculate the lengths of the different boundaries (SSC, LSC, and IR regions), the number and types of genes, GC content, and other information of the chloroplast genomes of seven species based on their GenBank annotation files. Mauve 2.4.1 [20] (https://darlinglab.org/, accessed on 16 May 2024) was used for homologous and collinear comparative analysis of the entire chloroplast genome sequences of other Rosa species (default parameters). IRscope was used to show the IR/SC boundaries of the tested chloroplasts. PAML 4.9j [21] was used for selection pressure analysis, with R. anemoniflora and R. lucidissima set as foreground branches. Under the branch model, if the dn/ds value is greater than 1 and the M0 model can be rejected, this indicates significant positive selection pressure on the foreground branch. If the dn/ds value of the foreground branch is less than the background value and the M0 model can be rejected, this indicates significant relaxed selection pressure on the foreground branch.

2.4. Molecular Marker Discovery

The chloroplast sequences of R. anemoniflora and 10 closely related species belonging to Rosa sect. Synstylae were selected for analysis (Table S1). MAFFT [16] was used for the alignment of the 11 chloroplast genome sequences, and DnaSP 6 [22] was used for sliding window analysis to calculate nucleotide diversity (Pi) values of the chloroplast genome sequences. The step size was set at 200 bp, and the window length was set at 600 bp. Regions with Pi values greater than 0.005 were designated single nucleotide polymorphism (SNP) hotspots. Gene typing analyses were used to determine whether SNPs in the hotspot regions could effectively differentiate the 11 tested Rosa species. MISA [23] (parameters: 1-8, 2-5, 3-3, 4-3, 5-3, and 6-3) was used to detect simple sequence repeats (SSRs) in the chloroplast sequence of R. anemoniflora. The chloroplast sequences of R. anemoniflora were aligned with those of 11 closely related species, and potential polymorphic sites were identified by comparing SSR sites with insertion-deletion sites.

2.5. Phylogenetic Analysis

Seventeen Rosa species were selected, representing Synstylae, Chinenses, Caninae, Microphyllae, and Bracteatae. Rubus pedunculosus and Dasiphora glabra were chosen as outgroups. The chloroplast genome data of the 19 plants were obtained from the GenBank database (Table S1). MAFFT [21] was used to align the complete chloroplast genome sequences. Determined K3Pu+F+I as the best-fit model using ModelFinder [24]. RAxML-NG [25] was used to construct a phylogenetic tree via the maximum likelihood (ML) method by comparing the chloroplast genome sequences of different species with 1000 bootstrap replicates.

2.6. Molecular Dating Analysis

The alignment files of the chloroplast sequences were converted into nexus format using PhyloSuite v1.2.1 [26]. The optimal GTR+I+R model was obtained with the Model Finder plugin of PhyloSuite v1.2.3 software. Site model parameters were set with BEAUti in BEAST v1.10.4 [27] software. The molecular clock model was set by selecting the relaxed molecular clock model Relaxed clock log Normal with default parameters. The Yule tree prior was selected as the tree prior model. The separation of the genus Rosa and the outgroup at 50.0 Ma (with a 97.5% confidence interval between 51.0 and 49.0 Ma) and the crown age of Core Synstylae estimated to be 24.2 Ma (95% HPD: 15.4–33.7 Ma) were used as the calibration points [28]. The MCMC chain length set to 25,000,000 generations, with a sampling frequency of 1000 Tracer v1.7 [29], was used to construct the tracer distribution plot and determine the effective sample size (ESS). If the ESS value was >200, it was determined that the running parameters had converged. TreeAnnotator was used to discard 10% of the trees as burn-in and retain median height values. After the run, trees with time nodes were viewed in FigTree v1.4.3 (http://tree.bio.ed.ac.uk/software/figtree/, accessed on 16 May 2024).

2.7. Biogeographical Analysis

Those widely distributed Rosa species (Rosa multiflora and Rosa chinensis) whose central distribution could not be identified were not included in the analysis. The tested Rosa plants were divided into seven biogeographical regions according to the ancestral area reconstruction (AAR): (A) Northeast China, (B) Northwest China, (C) Southwest China, (D) Central China, (E) Taiwan Province and Fujian Province, (F) South China, and (G) outside China. RASP v4.2 [30] was used to analyze six models of ancestral geographical range estimation: dispersal–extinction cladogenesis (DEC), dispersal–extinction cladogenesis with jump (DEC+J), dispersal–vicariance analysis (DIVALIKE), dispersal–vicariance analysis with jump (DIVALIKE+J), BI for discrete areas (BAYAREALIKE), and BI for discrete areas with jump (BAYAPEALIKE+J). All parameters were set to default values.

3. Results

3.1. General Features and Comparative Analyses of Rosa anemoniflora Chloroplast Genomes

The chloroplast genome of R. anemoniflora exhibits the typical quadripartite structure found in typical land plant chloroplasts, with a total length of 156,578 bp. These included inverted repeat regions (IRA and IRB, 26,058 bp), a large single-copy region (LSC, 85,722 bp), and a small single-copy region (SSC, 18,740 bp) (Figure 1). The GC content of the chloroplast genome of R. anemoniflora was 37.23%. However, the GC content varied significantly among the three regions (LSC, SSC, and IR), with the highest GC content occurring in the IR region (42.73%), followed by that occurring in the LSC region (35.18%), and the lowest occurring in the SSC region (31.34%). The chloroplast genome of R. anemoniflora contained a total of 130 genes, including 8 rRNA genes, 37 tRNA genes, and 85 protein-coding genes, with the ycf1 gene identified as a pseudogene. The length of the chloroplast genomes among the seven species was approximately 156,543.571 bp ± 66.51 bp, the gene count was 131 ± 2.082, and the GC content was approximately 37.243% ± 0.008%. Overall, the chloroplast genome structure, total GC content, GC content in different regions, and gene number of R. anemoniflora were highly similar to those of the other tested species (Table 1).

3.2. Comparative Analysis of Gene Number and Selection Pressure

Compared with R. brunonii, R. chinensis, and R. odorata, R. anemoniflora lost infA, and R. lucidissima lost both infA and rps19. In contrast, R. maximowicziana and R. multiflora had more genes than R. brunonii, R. chinensis, and R. odorata, mainly due to the presence of two orf42s and one orf18. Interestingly, ycf1 was pseudogenized in both R. anemoniflora and R. lucidissima, but their chloroplast genomes contained another normal copy of the ycf1 gene. In R. maximowicziana and R. multiflora, infA was found to be pseudogenized. Among the seven species tested, a total of 82 core genes were found. The branch model test showed that none of these genes rejected the M0 model. This indicates that the selection pressure on all genes in R. anemoniflora and R. lucidissima is consistent with the other five non-endangered species (Table S2).

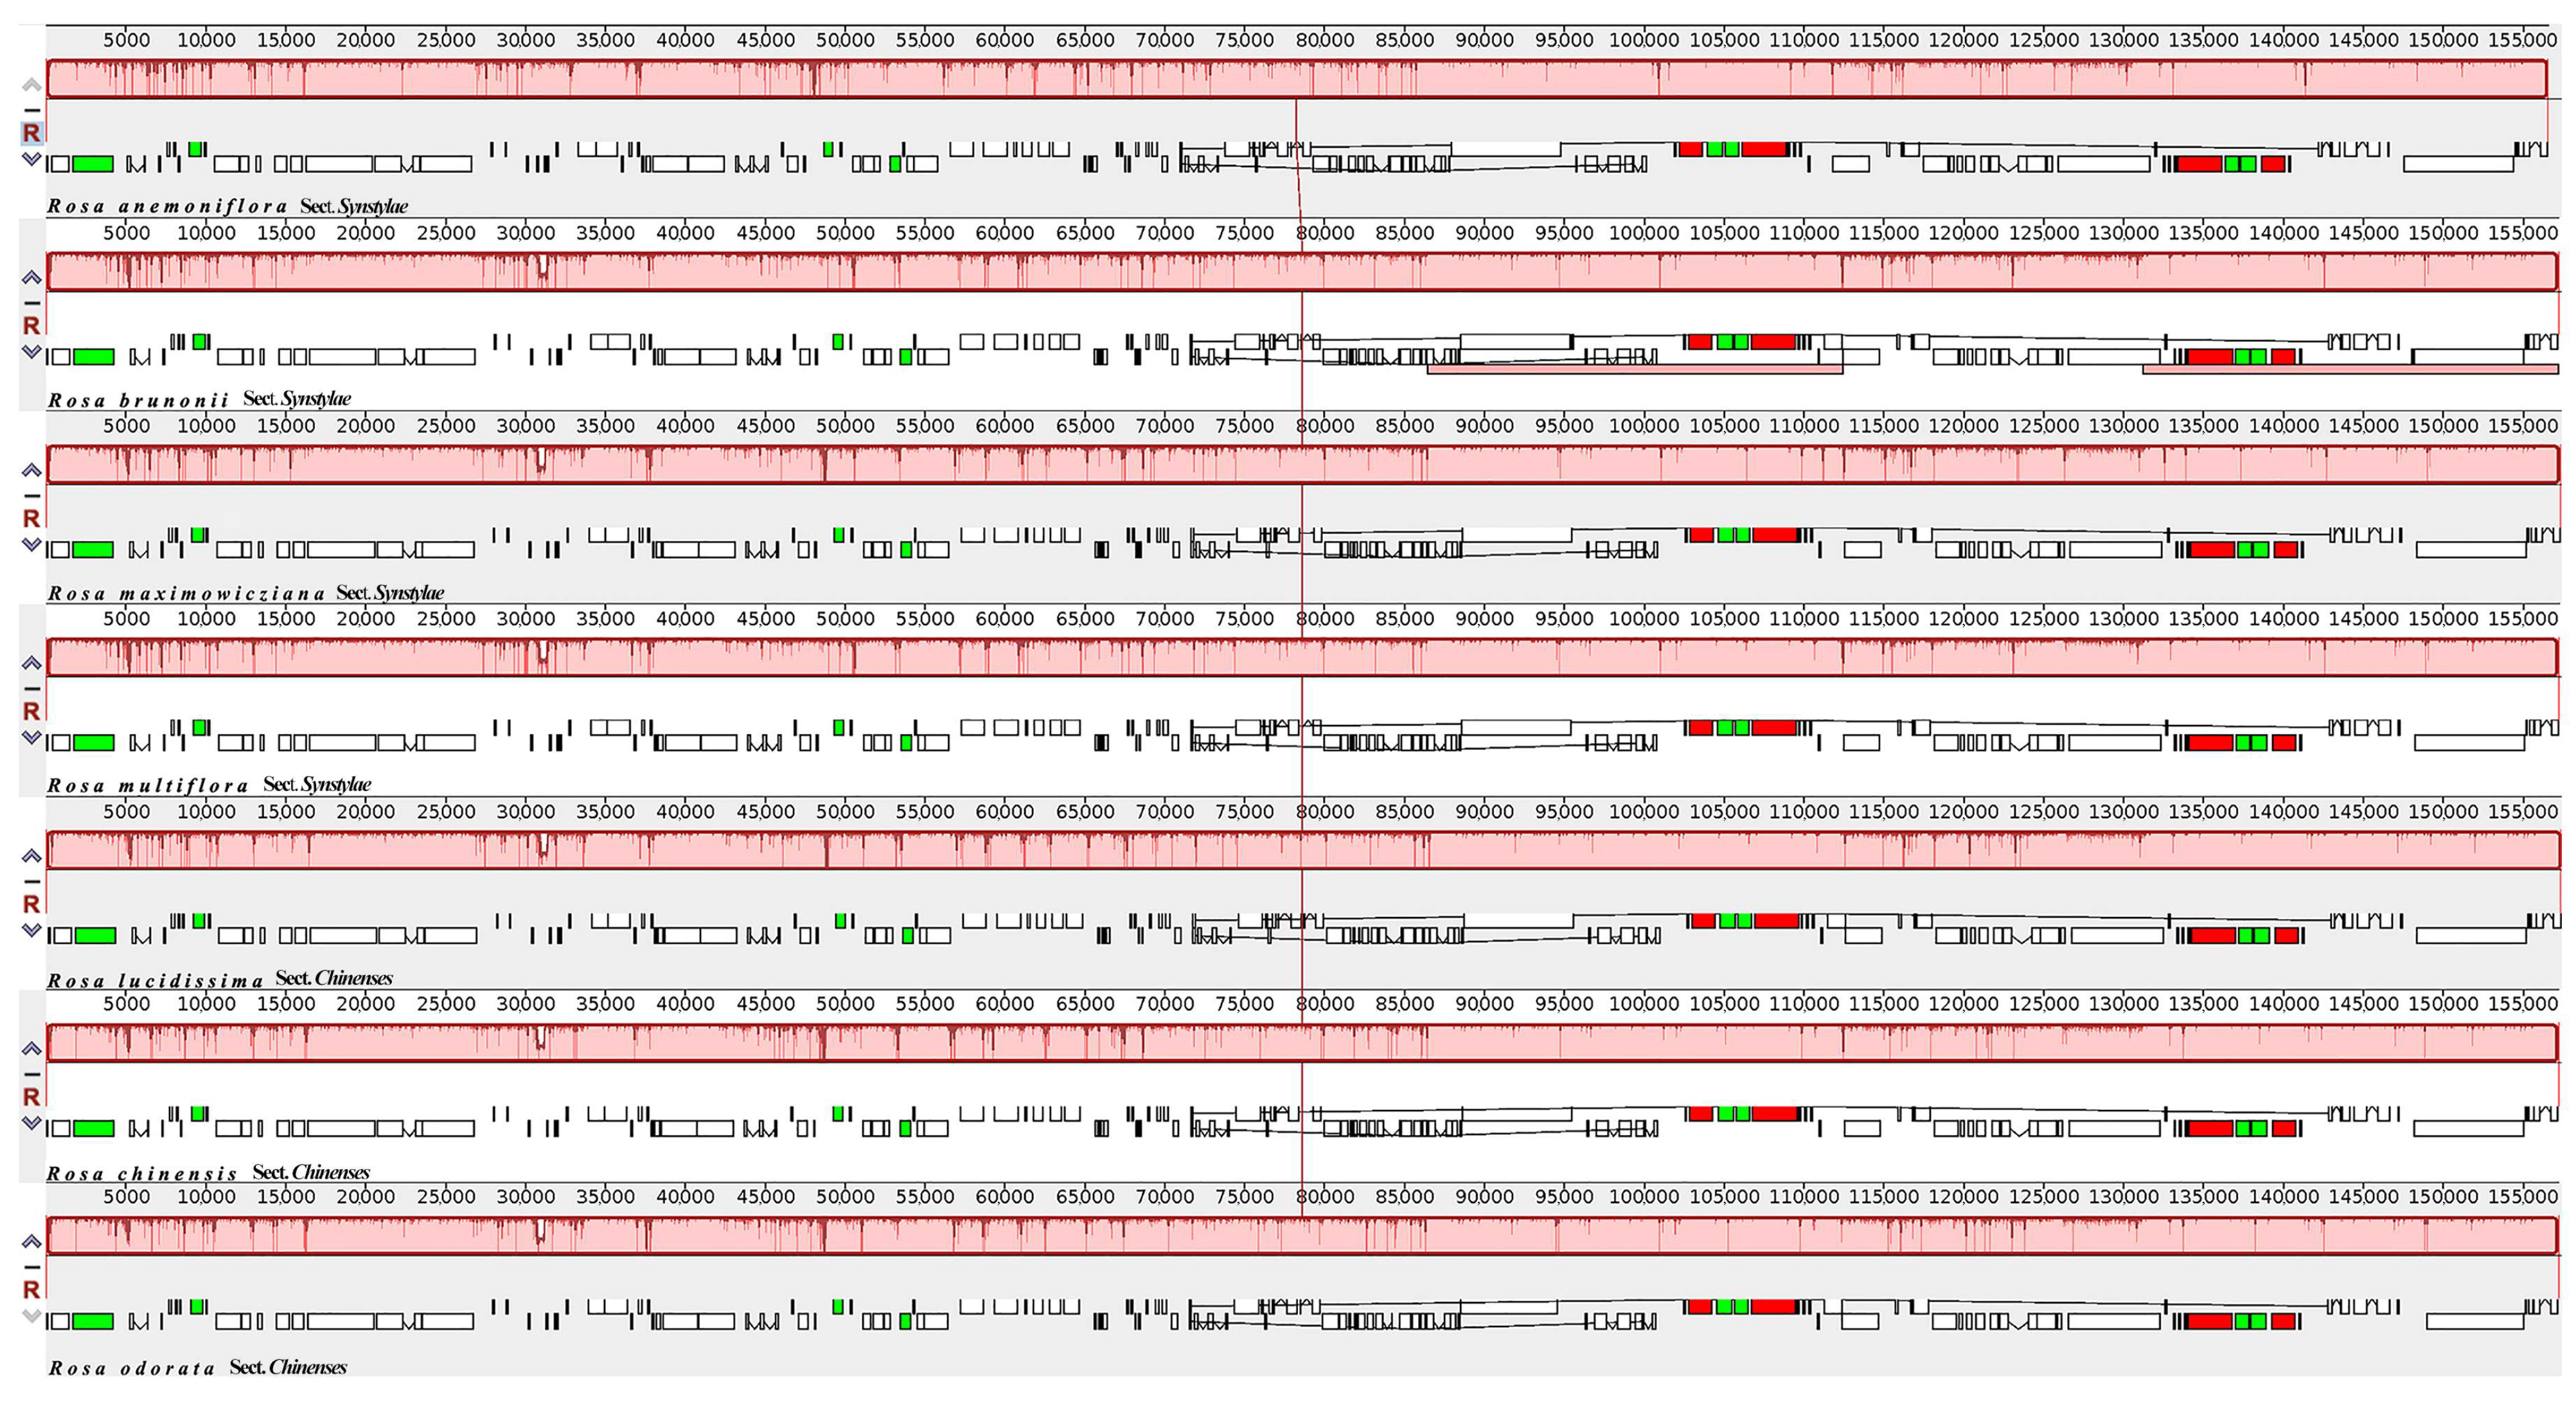
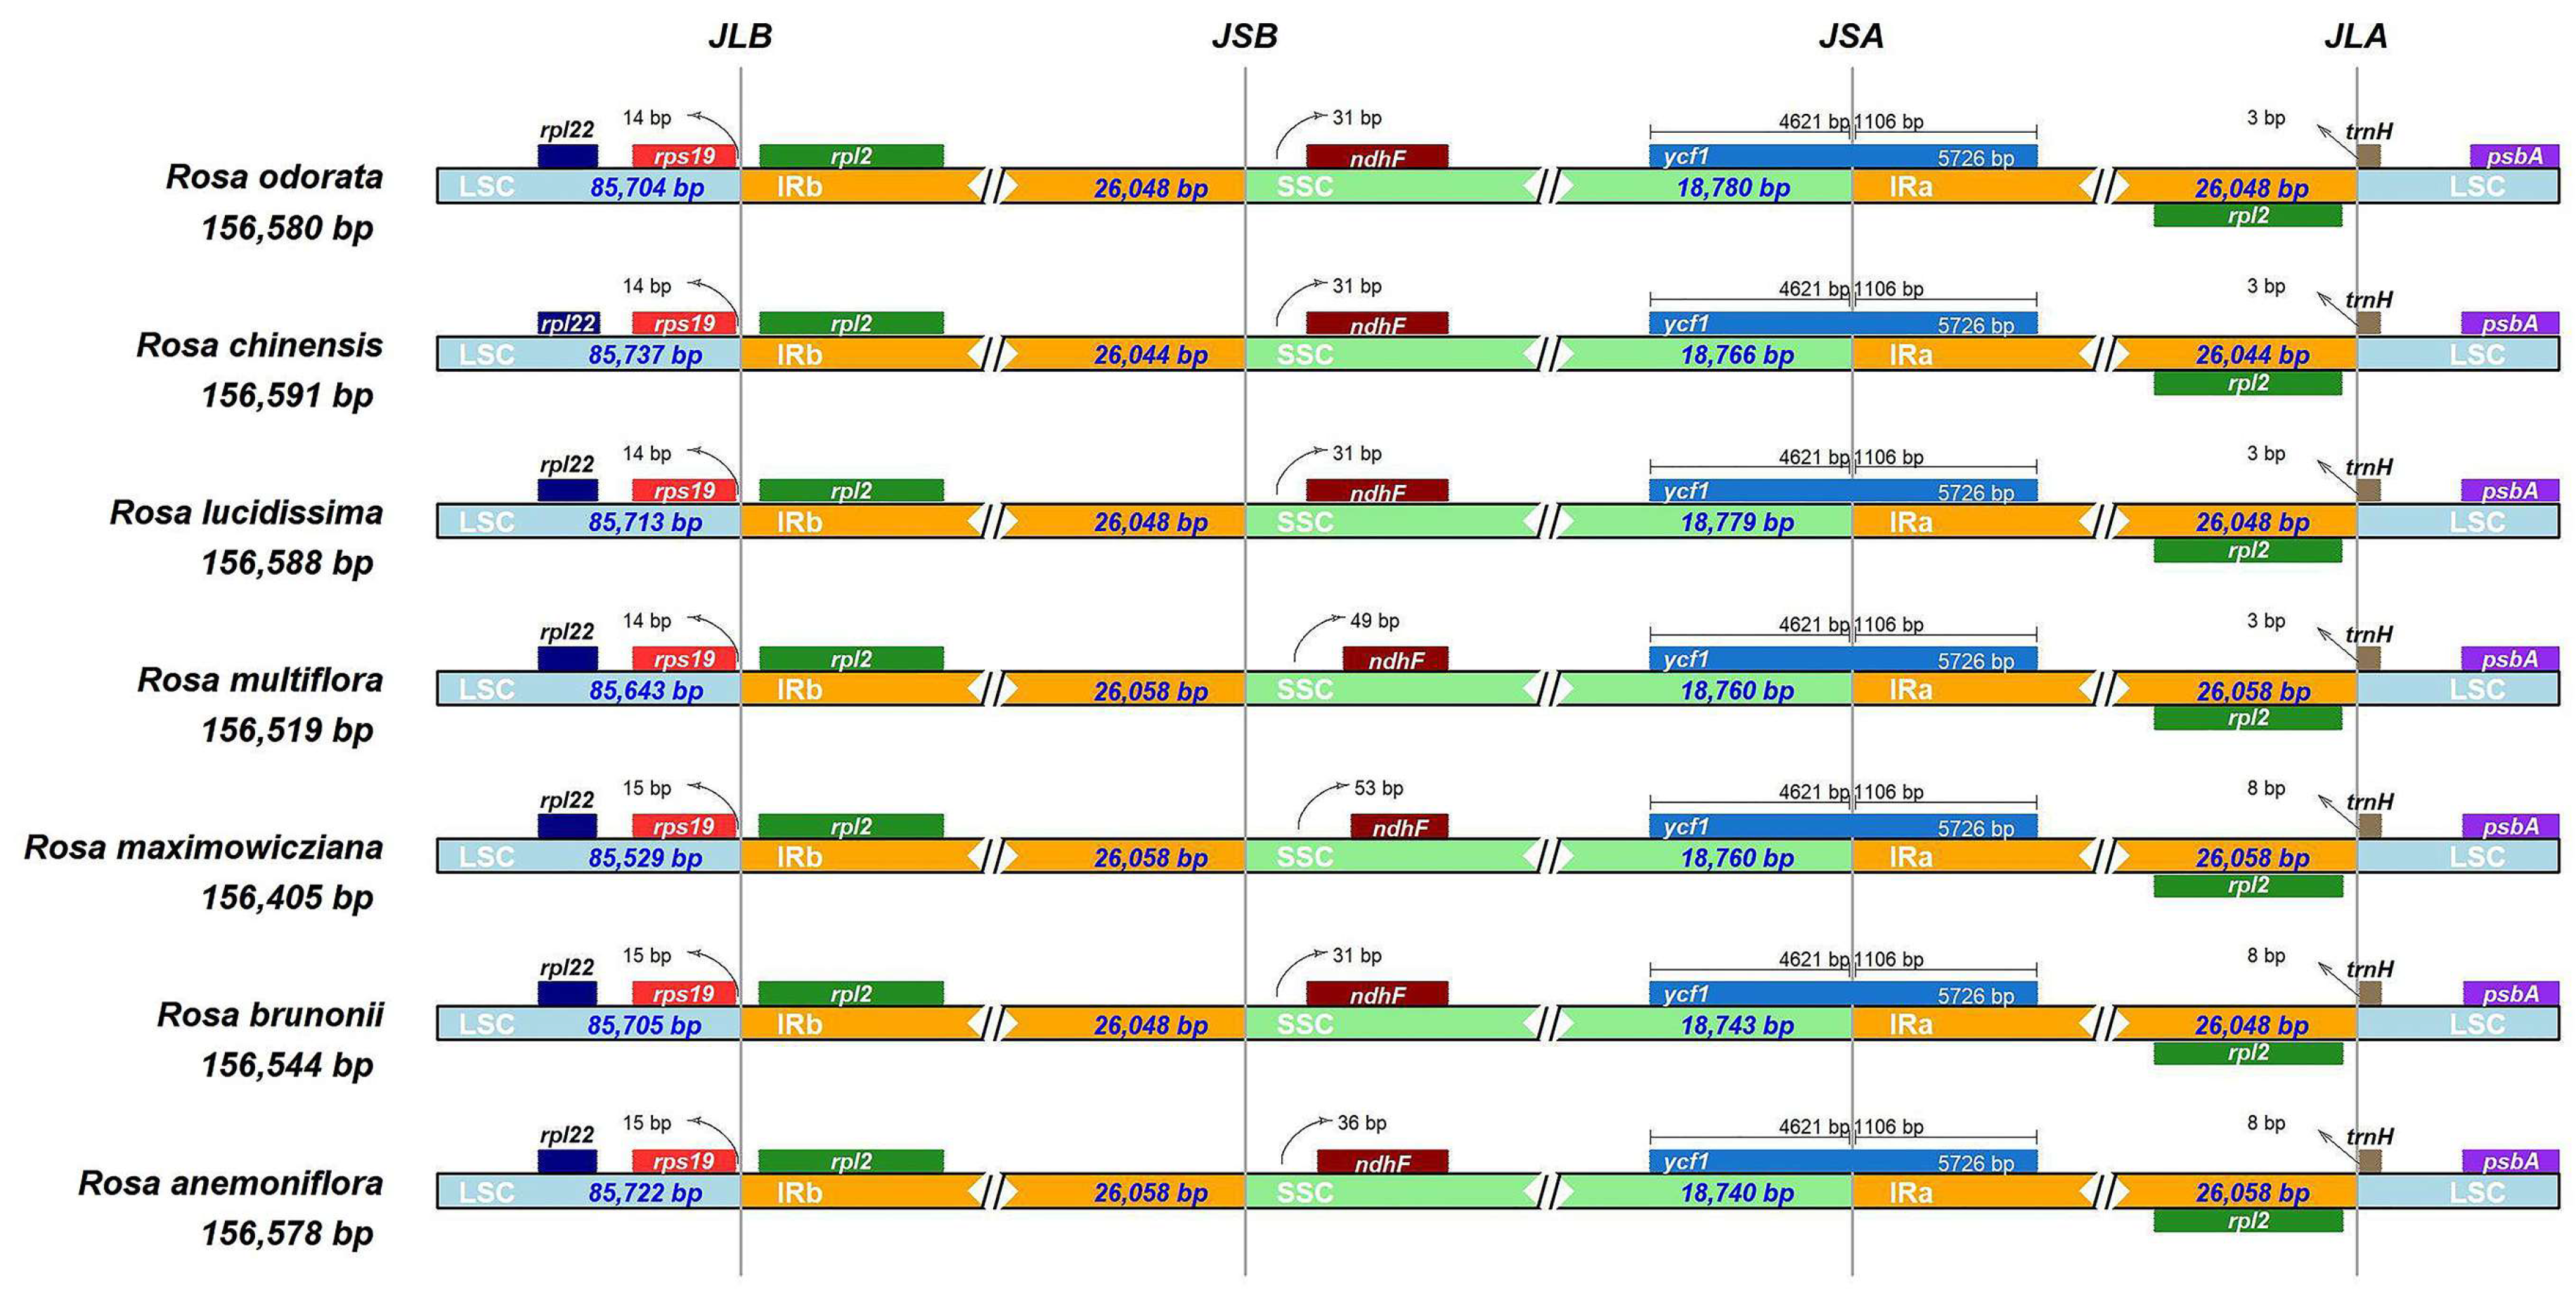
3.3. Comparative Analysis of Chloroplast Genome Structure

To assess structural differences in the genome sequences, Mauve 2.4.1 software was used to analyze the collinearity of the chloroplast genomes of R. anemoniflora and its close relatives (Figure 2). The chloroplast genome of R. anemoniflora showed complete collinearity with those of the other six Rosa species, with no large indels, inversions, or rearrangements. A comparative analysis of the IR-LSC and IR-SSC boundaries of the seven Rosa species was also conducted (Figure 3). The results indicated that the coding genes at the LSC/IR boundaries of the chloroplast genomes were highly conserved, with rps19 and rpl2 at both LSC/IRB boundaries and rpl2 and trnH at both IRa/LSC boundaries. Based on the distribution of genes and boundary positions, there were no major expansions or contractions in the LSC or IR regions of the chloroplast genomes among these seven species, demonstrating a high degree of conservation.

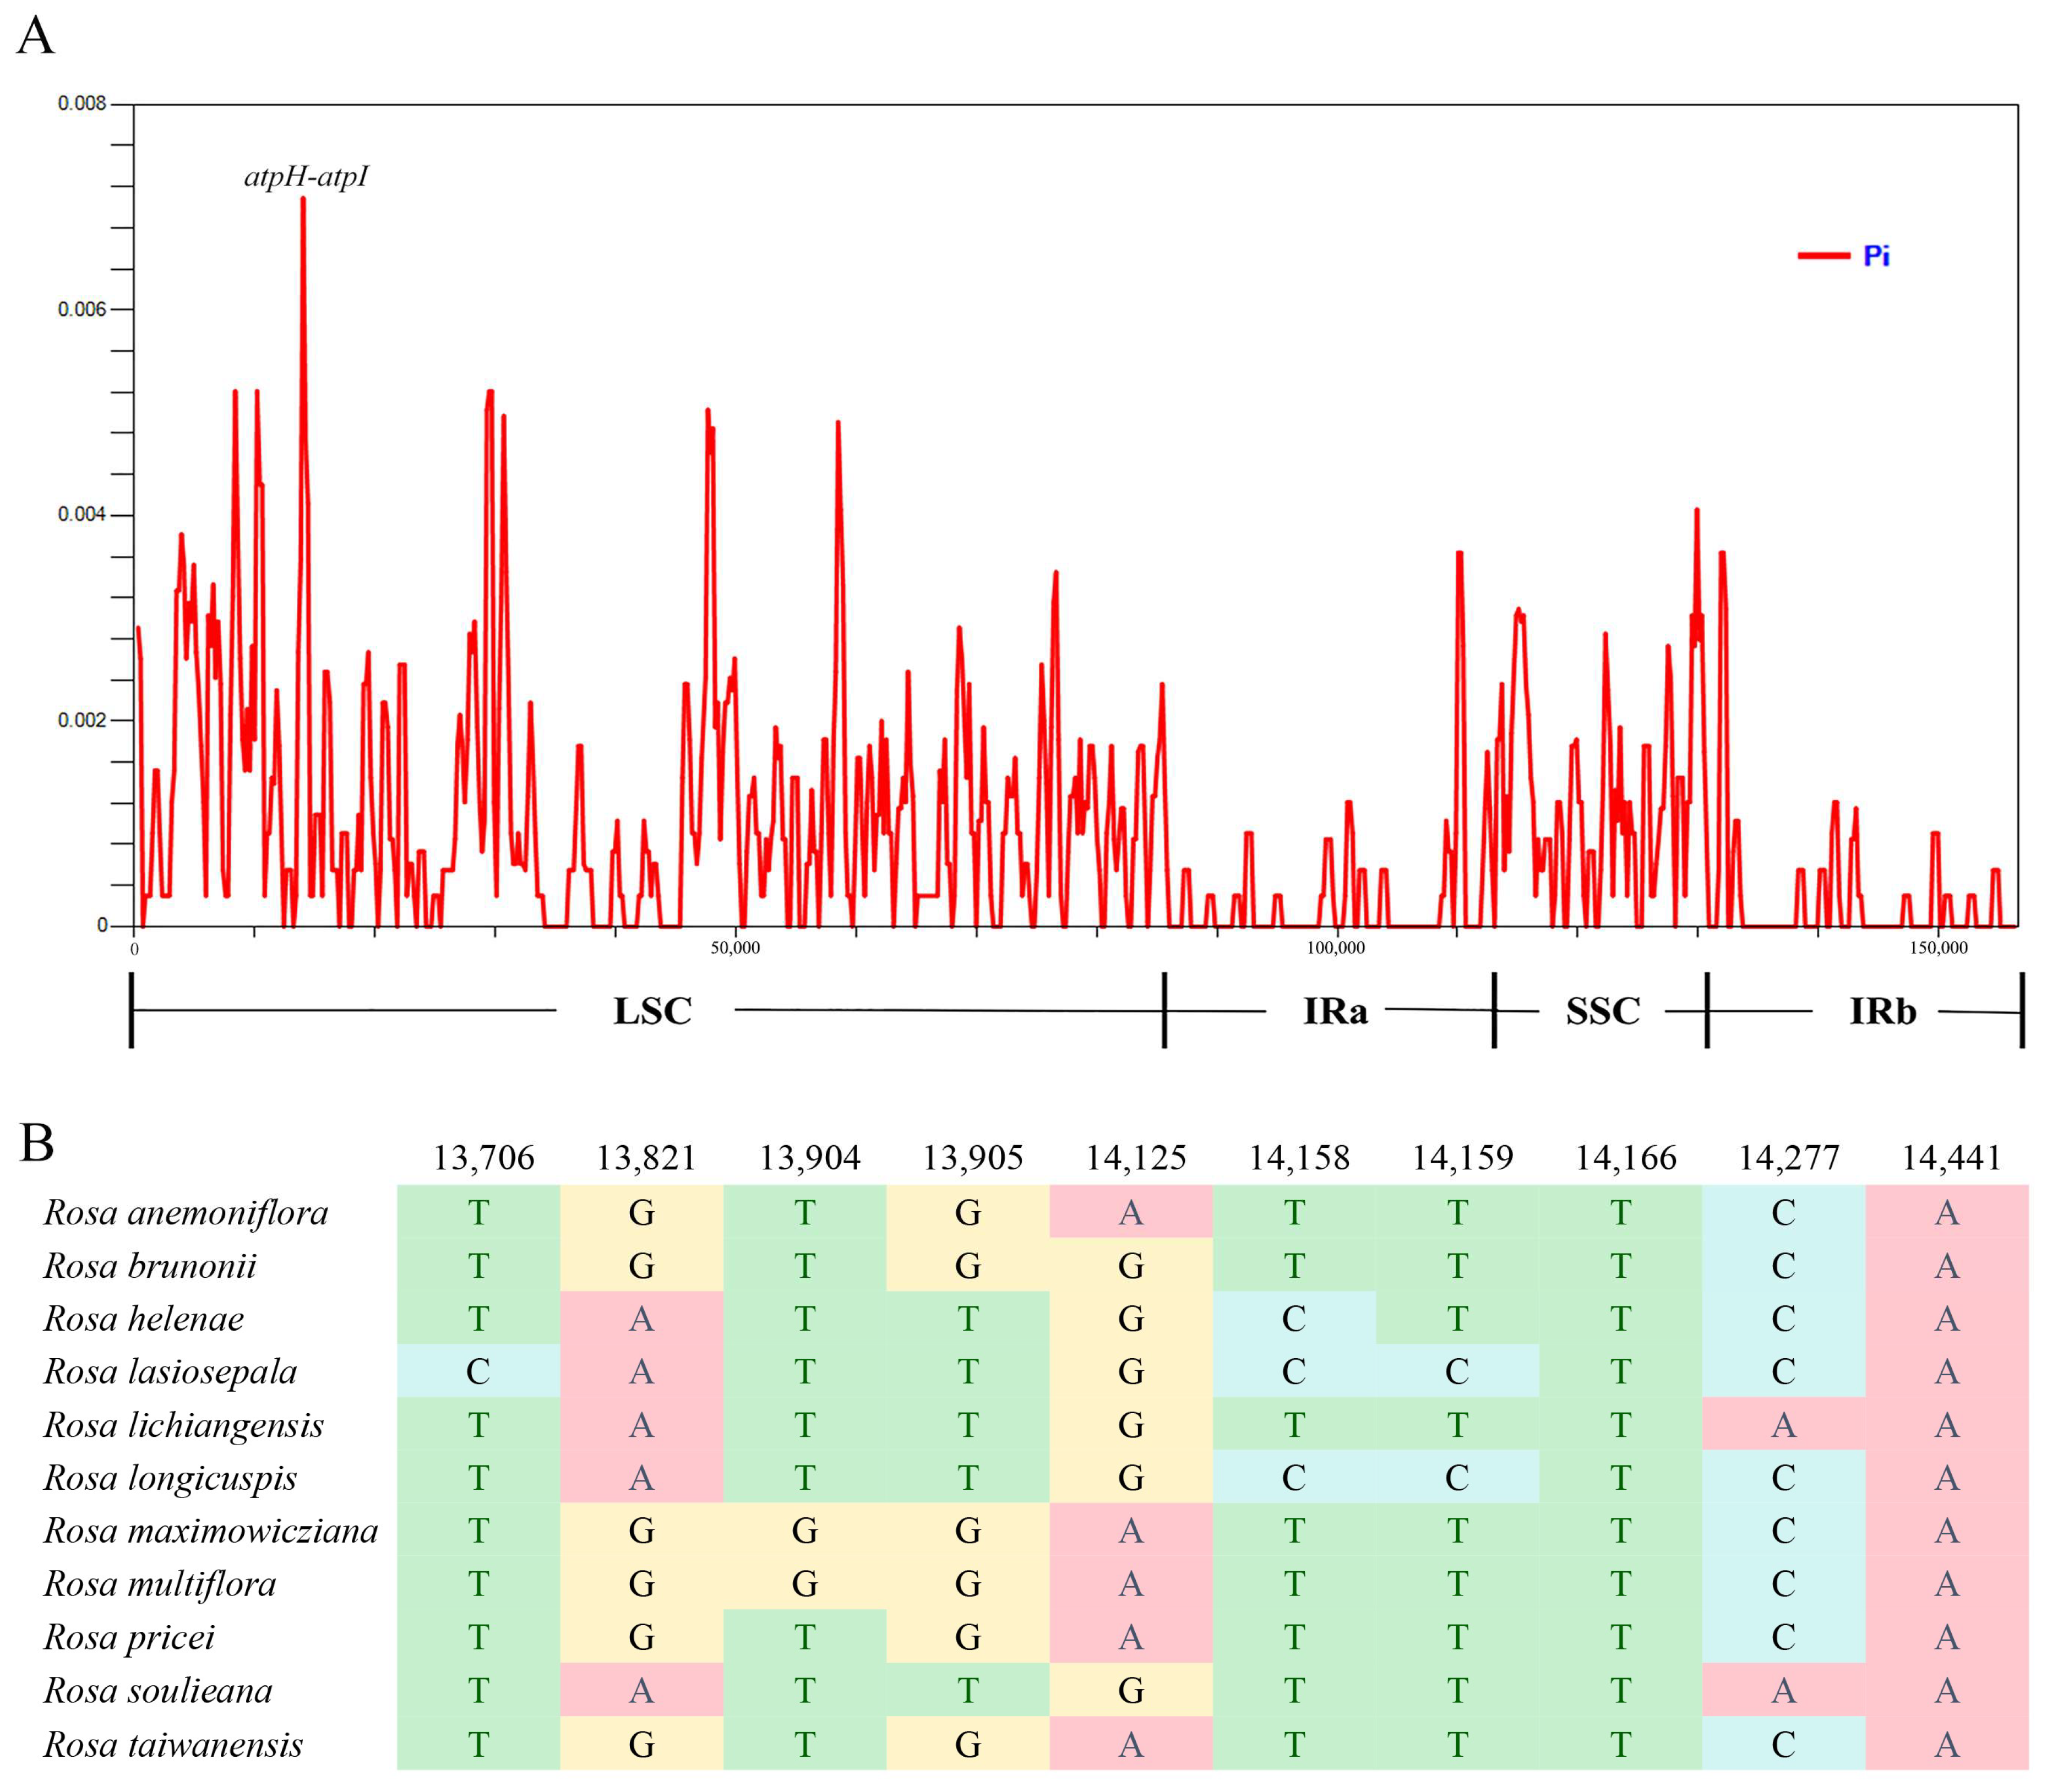
3.4. Highly Divergent Regions and Molecular Marker Development among Rosa Section Synstylae Plants

The results of sliding window analysis using DnaSP6 indicated that all seven mutation hotspots are located in the LSC region, suggesting that nucleotide variations in the chloroplast genome of sect. Synstylae of Rosa primarily occur in the LSC region (Figure 4A). In descending order of pi values, these seven mutation hotspots were found in five regions (atpH-atpI, trnS_GCU-trnG_GCC, trnR_UCU-atpA, petN-psbM, and trnT_UGU-trnL_UAA). The extraction of 10 SNP loci in the atpH-atpI region for gene typing revealed that these SNP loci could effectively distinguish the 11 tested species in sect. Synstylae (Figure 4B). According to the screening criteria, a total of 248 SSR loci were identified in the chloroplast genome of R. anemoniflora. Among them, there were 155 mononucleotide repeats, 11 dinucleotide repeats, 68 trinucleotide repeats, 11 tetranucleotide repeats, 1 pentanucleotide repeat, and 2 hexanucleotide repeats (Table S3). Additionally, 18 types of base repeat motifs were identified (Table S3), with A/T repeats being the most abundant (145). Based on sequence alignment, 48 SSR loci exhibiting interspecies polymorphisms were ultimately screened in the chloroplast genome of R. anemoniflora.

3.5. Phylogenetic Position, Species Divergence Time, and Ancestral Distribution Reconstruction of Rosa anemoniflora

Using chloroplast genome data from the tested plants, phylogenetic trees were constructed via the ML method. The bootstrap values of each node in the phylogenetic tree were generally high, indicating a reliable topology. In addition to the two outgroups, sect. Microphyllae and sect. Bracteatae were located at the base of the evolutionary tree. Although Synstylae and sect. Chinensis did not form separate branches, the sub-branches where R. anemoniflora is located were all from sect. Synstylae, providing sufficient evidence that R. anemoniflora belongs to sect. Synstylae. According to the evolutionary tree, R. anemoniflora was most closely related to R. taiwanensis and R. pricei (Figure 5). Subsequently, based on the chloroplast genome sequence dataset, the divergence time of the tested plants was estimated. The results indicated that R. anemoniflora and its closest relative, R. taiwanensis, diverged approximately 3.24 million years ago (Figure 5). In the reconstruction of ancestral geographical distributions, DEC was identified as the optimal model among the six models used to study the biogeographic evolution of the tested Rosa species. The results of biogeographic reconstruction showed that the common ancestors of R. anemoniflora, R. taiwanensis, and R. pricei likely originated from the Fujian and Taiwan regions of China, with a probability of 91.56% (Figure 6).

4. Discussion

In this study, the chloroplast genome of R. anemoniflora was sequenced and assembled, and this information was applied for comparative analysis with that of six other related species in sect. Synstylae and sect. Chinenses. The size of the genome; length of the IR, LSC, and SSC regions; and GC number and content revealed high similarity among the genomes. The length of the seven chloroplast genomes was 156,544 bp, the number of genes was approximately 130, and the GC content was approximately 37.24%. These data closely resemble reports from other sections of the Rosa genus [31,32,33], suggesting that Rosa species share low diversity. The contraction and expansion of IR regions are the main driving forces of chloroplast genome structure variation in some taxa [34]. However, the IR/SC boundaries are conserved among our seven Rosa species. The reverse orientation of the SSC region has also been reported in a wide variety of plant species [35]. However, the SSC region was not inverted in the seven tested Rosa species. These results strongly suggest that the chloroplasts of R. anemoniflora and related species are highly conserved.
Endangered plants often exhibit weaker environmental adaptability, manifested in their excessive dependence on specific environments, while lacking sufficient interspecific competitiveness in other environments and leading to an inability to adapt to alternative conditions, which is commonly referred to as an “evolutionary dead-end” [36]. Many epiphytic orchids restricted to tropical regions serve as typical examples [37]. Positive selection pressure contributes to plants specializing in adapting to specific [38]. Conversely, relaxed selection pressure may lead to functional degradation of genes [39]. Considering the crucial role of chloroplast genes in photosynthesis and in the response to environmental stress, specialization or functional degradation of these genes can impact a plant’s interspecific competitiveness. However, in our study, the chloroplast genes of R. anemoniflora did not experience positive or relaxed selection pressure, leading to the inference that the endangered status of R. anemoniflora might not be attributed to differential selection pressures on chloroplast genes. Nevertheless, the chloroplast genome contains fewer genes, and their functions are relatively singular. Further comprehensive studies of nuclear genome sequences are necessary to fully understand whether R. anemoniflora specializes in a specific environment, consequently weakening its adaptability to other environments.
Accurately identifying conservation targets is the primary prerequisite and foundation for biodiversity protection. The diversity of Rosa species is vast and remarkable, encompassing approximately 200 species that thrive in various temperate and warm regions of the Northern Hemisphere [40]. This diversity is not only reflected in their wide range of morphological traits, such as flower color, size, and fragrance, but also in their complex genetic makeup resulting from frequent hybridizations and polyploidization events [41]. However, hybridization frequently occurs, leading to morphological similarities among species. This convergence in phenotypic characteristics complicates species identification [42,43]. Under such circumstances, highly variable regions in the chloroplast genome could be potential molecular markers for species identification. In this study, through the analysis of the chloroplast genome sequences of 11 species within Synstylae, we successfully identified seven variable hotspot regions. These regions are located in noncoding regions, where noncoding sequences appear to show higher variability than coding regions, providing more critical informative sites [44]. The ndhF and ndhF-rpl32 regions have been widely employed as highly divergent regions within Rosa [45,46]. We reported the identification of a rarely reported variable hotspot region, namely, the atpH-atpI intergenic region, where SNP sites effectively differentiate the 11 species within sect. Synstylae. This region can serve as a barcode in systematic studies of Rosa sect. Synstylae, providing powerful tools for accurate species identification.
After the implementation of conservation measures, it is crucial to continuously monitor and evaluate the population dynamics of conservation targets by assessing genetic indicators [47] for the targeted adjustment of conservation strategies. Due to their maternal inheritance and high levels of within-population polymorphism, chloroplast-specific SSRs have been widely employed in conservation genetic research [48]. Similar to the chloroplasts reported for Rosa species [31,46], A/T-type SSRs had the highest proportion in the chloroplasts of R. anemoniflora. This may be attributed to the greater content of AT bases than GC bases in the chloroplast genome of R. anemoniflora, as the nucleotide composition of the genome can influence the dominant SSR types. This study identified highly conserved SSR loci at the interspecific level and plans to select appropriate SSR markers from the remaining 48 loci for conservation genetic analysis of the R. anemoniflora population.
The frequent hybridization between Rosa sect. Chinensis and Sect. Synstylae, defined by traditional taxonomic methods, makes the taxonomic status of R. anemoniflora difficult to ascertain based on morphological characteristics. Therefore, there is an urgent need for phylogenetic analysis. Our results support those of previous research, confirming that sect. Chinensis and sect. Synstylae are not monophyletic [28]. Based on the topology and nodal support of the phylogenetic tree, we strongly confirmed that R. anemoniflora indeed belongs to sect. Synstylae. Remarkably, R. anemoniflora and its two close relatives exhibit distinct geographical distribution characteristics and are restricted to the Fujian and Taiwan regions of China [49]. Molecular dating analysis revealed that R. anemoniflora and R. taiwanensis diverged approximately 1.82 million years ago. The Taiwan Strait between Taiwan and the Asian mainland formed approximately 10,000 years ago during the Holocene [50]. Since their divergence time predates the formation of the strait, this finding suggested that the difference between R. anemoniflora and R. taiwanensis was not solely attributable to geographic isolation caused by the Taiwan Strait. In addition to clarifying taxonomic status and evolutionary history, phylogenetics provides a novel approach for assessing biodiversity, evaluating conservation priorities, and quantifying species evolutionary history [51]. Studies indicate that if a species faces the threat of extinction, its close relatives also have an extinction risk higher than the average level [52]. In this context, rose species exclusively distributed in the Taiwan region, such as R. pricei and R. taiwanensis, may also face the risk of endangerment, warranting further in-depth attention and research.

Supplementary Materials

The following supporting information can be downloaded at: https://www.mdpi.com/article/10.3390/f15060940/s1, Table S1: The species used for this study; Table S2: Branch model test of selective pressures on genes; Table S3: Number of classified repeat types.

Author Contributions

X.Z. and W.G. conducted the research and drafted the original manuscript. Q.Y., G.L. and C.F. also contributed to the research efforts. T.K. and H.Z. were responsible for collecting biological samples. X.Z. and W.G. designed the research and reviewed the draft manuscript. W.G. and Q.Y. obtained funding. All authors have read and agreed to the published version of the manuscript.

Funding

This research was funded by the Fujian Provincial Forestry Scientific Research Project (No. 2024FKJ30 and No. 2023FKJ31) and the Fujian Provincial Key Research Project for Young and Middle-aged Teachers in Education (No. JZ230077).

Data Availability Statement

Data are provided within the manuscript or Supplementary Information Files.

Conflicts of Interest

The authors declare no conflict of interest.

References

  1. Chinese Academy of Sciences, Editorial Committee of Flora of China. Flora of China; Science Press: Beijing, China, 1985; Volume 37. [Google Scholar]
  2. Ku, T.; Robertson, K. Rosa linnaeus . In Flora of China; Wu, C., Raven, P., Eds.; Science Press: Beijing, China, 2003; Volume 9, pp. 339–381. [Google Scholar]
  3. Clegg, M.T.; Gaut, B.S.; Learn, G.H.; Morton, B.R. Rates and patterns of chloroplast DNA evolution. Proc. Natl. Acad. Sci. USA 1994, 91, 6795–6801. [Google Scholar] [CrossRef]
  4. Irisarri, I.; Strassert, J.F.H.; Burki, F. Phylogenomic insights into the origin of primary plastids. Syst. Biol. 2022, 71, 105–120. [Google Scholar] [CrossRef]
  5. Zhang, Y.; Zhang, A.; Li, X.; Lu, C. The role of chloroplast gene expression in plant responses to environmental stress. Int. J. Mol. Sci. 2020, 21, 6082. [Google Scholar] [CrossRef]
  6. Mulo, P.; Sakurai, I.; Aro, E.M. Strategies for psbA gene expression in cyanobacteria, green algae and higher plants: From transcription to PSII repair. Biochim. Biophys. Acta 2012, 1817, 247–257. [Google Scholar] [CrossRef]
  7. Gao, Y.; Thiele, W.; Saleh, O.; Scossa, F.; Arabi, F.; Zhang, H.; Sampathkumar, A.; Kühn, K.; Fernie, A.; Bock, R.; et al. Chloroplast translational regulation uncovers nonessential photosynthesis genes as key players in plant cold acclimation. Plant Cell 2022, 34, 2056–2079. [Google Scholar] [CrossRef]
  8. Hu, S.; Ding, Y.; Zhu, C. Sensitivity and responses of chloroplasts to heat stress in plants. Front. Plant Sci. 2020, 11, 375. [Google Scholar] [CrossRef]
  9. Zhou, T.; Zhu, H.; Wang, J.; Xu, Y.; Xu, F.; Wang, X. Complete chloroplast genome sequence determination of Rheum species and comparative chloroplast genomics for the members of Rumiceae. Plant Cell Rep. 2020, 39, 811–824. [Google Scholar] [CrossRef]
  10. Yang, L.; Deng, S.; Zhu, Y.; Da, Q. Comparative chloroplast genomics of 34 species in subtribe Swertiinae (Gentianaceae) with implications for its phylogeny. BMC Plant Biol. 2023, 23, 164. [Google Scholar] [CrossRef]
  11. Zhang, J.-Y.; Liao, M.; Cheng, Y.-H.; Feng, Y.; Ju, W.-B.; Deng, H.-N.; Li, X.; Plenković-Moraj, A.; Xu, B. Comparative chloroplast genomics of seven edangered Cypripedium species and phylogenetic relationships of orchidaceae. Front. Plant Sci. 2022, 13, 911702. [Google Scholar] [CrossRef]
  12. Chen, S.; Zhou, Y.; Chen, Y.; Gu, J. Fastp: An ultra-fast all-in-one fastq preprocessor. Bioinformatics 2018, 34, i884–i890. [Google Scholar] [CrossRef]
  13. Langmead, B.; Salzberg, S.L. Fast gapped-read alignment with bowtie 2. Nat. Methods 2012, 9, 357–359. [Google Scholar] [CrossRef]
  14. Bankevich, A.; Nurk, S.; Antipov, D.; Gurevich, A.A.; Dvorkin, M.; Kulikov, A.S.; Lesin, V.M.; Nikolenko, S.I.; Pham, S.; Prjibelski, A.D.; et al. Spades: A new genome assembly algorithm and its applications to single-cell sequencing. J. Comput. Biol. 2012, 19, 455–477. [Google Scholar] [CrossRef]
  15. Mount, D.W. Using the basic local alignment search tool (blast). Cold Spring Harb. 2007, 2007, pdb.top17. [Google Scholar] [CrossRef]
  16. Katoh, K.; Standley, D.M. MAFFT multiple sequence alignment software version 7: Improvements in performance and usability. Mol. Biol. Evol. 2013, 30, 772–780. [Google Scholar] [CrossRef]
  17. Eddy, S.R. Accelerated profile hmm searches. PLoS Comput. Biol. 2011, 7, e1002195. [Google Scholar] [CrossRef]
  18. Laslett, D.; Canback, B. Aragorn, a program to detect tRNA genes and tmRNA genes in nucleotide sequences. Nucleic Acids Res. 2004, 32, 11–16. [Google Scholar] [CrossRef]
  19. Kearse, M.; Moir, R.; Wilson, A.; Stones-Havas, S.; Cheung, M.; Sturrock, S.; Buxton, S.; Cooper, A.; Markowitz, S.; Duran, C.; et al. Geneious basic: An integrated and extendable desktop software platform for the organization and analysis of sequence data. Bioinformatics 2012, 28, 1647–1649. [Google Scholar] [CrossRef]
  20. Darling, A.C.; Mau, B.; Blattner, F.R.; Perna, N.T. Mauve: Multiple alignment of conserved genomic sequence with rearrangements. Genome Res. 2004, 14, 1394–1403. [Google Scholar] [CrossRef]
  21. Yang, Z.H. Paml: A program package for phylogenetic analysis by maximum likelihood. Bioinformatics 1997, 13, 555–556. [Google Scholar] [CrossRef]
  22. Rozas, J.; Ferrer-Mata, A.; Sánchez-DelBarrio, J.C.; Guirao-Rico, S.; Librado, P.; Ramos-Onsins, S.E.; Sánchez-Gracia, A. Dnasp 6: DNA sequence polymorphism analysis of large data sets. Mol. Biol. Evol. 2017, 34, 3299–3302. [Google Scholar] [CrossRef]
  23. Beier, S.; Thiel, T.; Münch, T.; Scholz, U.; Mascher, M. Misa-web: A web server for microsatellite prediction. Bioinformatics 2017, 33, 2583–2585. [Google Scholar] [CrossRef]
  24. Kalyaanamoorthy, S.; Minh, B.Q.; Wong, T.K.F.; von Haeseler, A.; Jermiin, L.S. Modelfinder: Fast model selection for accurate phylogenetic estimates. Nat. Methods 2017, 14, 587–589. [Google Scholar] [CrossRef]
  25. Kozlov, A.M.; Darriba, D.; Flouri, T.; Morel, B.; Stamatakis, A. Raxml-ng: A fast, scalable and user-friendly tool for maximum likelihood phylogenetic inference. Bioinformatics 2019, 35, 4453–4455. [Google Scholar] [CrossRef]
  26. Zhang, D.; Gao, F.; Jakovlić, I.; Zou, H.; Zhang, J.; Li, W.X.; Wang, G.T. Phylosuite: An integrated and scalable desktop platform for streamlined molecular sequence data management and evolutionary phylogenetics studies. Mol. Ecol. Resour. 2020, 20, 348–355. [Google Scholar] [CrossRef]
  27. Suchard, M.A.; Lemey, P.; Baele, G.; Ayres, D.L.; Drummond, A.J.; Rambaut, A. Bayesian phylogenetic and phylodynamic data integration using beast 1.10. Virus Evol. 2018, 4, vey016. [Google Scholar] [CrossRef]
  28. Zhu, Z.m.; Gao, X.f.; Fougère-Danezan, M. Phylogeny of Rosa sections Chinenses and Synstylae (Rosaceae) based on chloroplast and nuclear markers. Mol. Phylogen. Evol. 2015, 87, 50–64. [Google Scholar] [CrossRef]
  29. Rambaut, A.; Drummond, A.J.; Xie, D.; Baele, G.; Suchard, M.A. Posterior summarization in bayesian phylogenetics using tracer 1.7. Syst. Biol. 2018, 67, 901–904. [Google Scholar] [CrossRef]
  30. Yu, Y.; Blair, C.; He, X. Rasp 4: Ancestral state reconstruction tool for multiple genes and characters. Mol. Biol. Evol. 2019, 37, 604–606. [Google Scholar] [CrossRef]
  31. Shen, W.; Dong, Z.; Zhao, W.; Ma, L.; Wang, F.; Li, W.; Xin, P. Complete chloroplast genome sequence of Rosa lucieae and its characteristics. Horticulturae 2022, 8, 788. [Google Scholar] [CrossRef]
  32. Gao, C.; Li, T.; Zhao, X.; Wu, C.; Zhang, Q.; Zhao, X.; Wu, M.; Lian, Y.; Li, Z. Comparative analysis of the chloroplast genomes of Rosa species and rna editing analysis. BMC Plant Biol. 2023, 23, 318. [Google Scholar] [CrossRef]
  33. Ding, M.; Liao, M.; Liu, P.; Tan, G.; Chen, Y.; Shi, S. The complete chloroplast genome of Rosa cymosa (Rosaceae), a traditional medicinal plant in south China. Mitochondrial DNA Part B 2020, 5, 2571–2572. [Google Scholar] [CrossRef]
  34. Zhu, A.; Guo, W.; Gupta, S.; Fan, W.; Mower, J.P. Evolutionary dynamics of the plastid inverted repeat: The effects of expansion, contraction, and loss on substitution rates. New Phytol. 2016, 209, 1747–1756. [Google Scholar] [CrossRef]
  35. Lu, Q.; Ye, W.; Lu, R.; Xu, W.; Qiu, Y. Phylogenomic and comparative analyses of complete plastomes of Croomia and Stemona (Stemonaceae). Int. J. Mol. Sci. 2018, 19, 2383. [Google Scholar] [CrossRef]
  36. Bell, G.; Collins, S. Adaptation, extinction and global change. Evol. Appl. 2008, 1, 3–16. [Google Scholar] [CrossRef]
  37. Huda, M.K.; Wilcock, C.C. Impact of floral traits on the reproductive success of epiphytic and terrestrial tropical orchids. Oecologia 2008, 154, 731–741. [Google Scholar] [CrossRef]
  38. Zhang, X.; Sun, Y.; Landis, J.B.; Shen, J.; Zhang, H.; Kuang, T.; Sun, W.; Sun, J.; Tiamiyu, B.B.; Deng, T.; et al. Transcriptomes of Saussurea (Asteraceae) provide insights into high-altitude adaptation. Plants 2021, 10, 1715. [Google Scholar] [CrossRef]
  39. Lahti, D.C.; Johnson, N.A.; Ajie, B.C.; Otto, S.P.; Hendry, A.P.; Blumstein, D.T.; Coss, R.G.; Donohue, K.; Foster, S.A. Relaxed selection in the wild. Trends Ecol. Evol. 2009, 24, 487–496. [Google Scholar] [CrossRef]
  40. Wissemann, V. Conventional taxonomy of wild roses. In Encyclopedia of Rose; Roberts, A., Debener, T., Gudin, S., Eds.; Science Press: London, UK, 2003; pp. 111–117. [Google Scholar]
  41. Bruneau, A.; Starr, J.R.; Joly, S. Phylogenetic relationships in the genus Rosa: New evidence from chloroplast DNA sequences and an appraisal of current knowledge. Syst. Bot. 2007, 32, 366–378. [Google Scholar] [CrossRef]
  42. Joly, S.; Starr, J.R.; Lewis, W.H.; Bruneau, A. Polyploid and hybrid evolution in roses east of the Rocky mountains. Am. J. Bot. 2006, 93, 412–425. [Google Scholar] [CrossRef]
  43. Matthews, J. Hybridism and classification in the genus Rosa. New Phytol. 1920, 19, 153–171. [Google Scholar] [CrossRef]
  44. Borsch, T.; Quandt, D. Mutational dynamics and phylogenetic utility of noncoding chloroplast DNA. Plant Syst. Evol. 2009, 282, 169–199. [Google Scholar] [CrossRef]
  45. Jian, H.; Zhang, Y.; Yan, H.; Qiu, X.; Wang, Q.; Li, S.; Zhang, S. The complete chloroplast genome of a key ancestor of modern roses, Rosa chinensis var. spontanea, and a comparison with congeneric species. Molecules 2018, 23, 389. [Google Scholar] [CrossRef] [PubMed]
  46. Yin, X.; Liao, B.; Guo, S.; Liang, C.; Pei, J.; Xu, J.; Chen, S. The chloroplasts genomic analyses of Rosa laevigata, R. rugosa and R. canina. Chin. Med. 2020, 15, 18. [Google Scholar] [CrossRef] [PubMed]
  47. Li, Y.; Zhang, X.; Wu, T.; Lu, H.; Cai, Y. Genetic differences between wild and artificial populations of Metasequoia glyptostroboides: Implications for species recovery. Conserv. Biol. 2005, 19, 224–231. [Google Scholar] [CrossRef]
  48. Edmands, S. Between a rock and a hard place: Evaluating the relative risks of inbreeding and outbreeding for conservation and management. Mol. Ecol. 2007, 16, 463–475. [Google Scholar] [CrossRef] [PubMed]
  49. Hung, L.Y.; Che, W.J. A revision of Rosa transmorrisonensis hayata and allied species in Taiwan. Taiwania 2022, 67, 484–496. [Google Scholar] [CrossRef]
  50. Chang, K. The neolithic Taiwan strait. Kaogu 1989, 6, 541–569. [Google Scholar]
  51. Revell, L.J. Comparing the rates of speciation and extinction between phylogenetic trees. Ecol. Evol. 2018, 8, 5303–5312. [Google Scholar] [CrossRef]
  52. Mace, G.M.; Gittleman, J.L.; Purvis, A. Preserving the tree of life. Science 2003, 300, 1707–1709. [Google Scholar] [CrossRef]
Figure 1. Gene map of the chloroplast genome of Rosa anemoniflora.
Forests 15 00940 g001
Figure 2. Mauve alignment of the seven Rosa chloroplast genomes revealing no rearrangements. Homologous regions between different chloroplast genomes are represented by the same color blocks.
Forests 15 00940 g002
Figure 3. Comparison of genome boundaries in chloroplasts from seven tested Rosa species.
Forests 15 00940 g003
Figure 4. Highly divergent regions and their snp loci. (A) Sliding window analysis of the entire chloroplast genome of 11 species from Rosa section Synstylae (window length: 600 bp; step size: 200 bp). X-axis: position of the midpoint of a window; Y-axis: nucleotide diversity of each window. (B) SNP loci of the atpH-atpI region based on 11 species from Rosa section Synstylae. T: Thymine; G: Guanine; A: Adenine; C: Cytosine, with the same bases represented by the same color blocks.
Forests 15 00940 g004
Figure 5. Maximum likelihood (ML) phylogenetic tree based on 19 plant chloroplast genomes.
Forests 15 00940 g005
Figure 6. Results of ancestral distribution reconstruction.
Forests 15 00940 g006
Table 1. Characteristics of selected chloroplast genomes.
Genome FeaturesRosa
anemoniflora
Rosa
brunonii
Rosa
maximowicziana
Rosa
multiflora
Rosa
lucidissima
Rosa
chinensis
Rosa
odorata
Genome size (bp)156,578156,544156,405156,519156,588156,591156,580
LSC size (bp)85,72285,70585,52985,64385,71385,73785,704
SSC size (bp)18,74018,74318,76018,76018,77918,76618,780
IR size (bp)26,05826,04826,05826,05826,04826,04426,048
Total GC content37.2337.2437.2537.2437.2537.2437.25
GC content in LSC35.1835.231.3235.235.235.235.21
GC content in SSC31.3431.335.2131.3231.3531.3231.35
GC content in IR42.7342.7342.7342.7342.7342.7142.73
Number of genes130130134134129130130
Protein-coding genes84858888838585
tRNA genes8888888
rRNA genes37373737373737
Pseudo genes1011100
Disclaimer/Publisher’s Note: The statements, opinions and data contained in all publications are solely those of the individual author(s) and contributor(s) and not of MDPI and/or the editor(s). MDPI and/or the editor(s) disclaim responsibility for any injury to people or property resulting from any ideas, methods, instructions or products referred to in the content.

