Abstract
Diameter at breast height (DBH) is a unique attribute used to characterize forest growth and development for forest management planning and to understand forest ecology. Forest managers require an array of DBHs of forest stands, which can be reconstructed using selected probability distribution functions (PDFs). However, there is a lack of practices that fit PDFs of sub-dominating species grown in natural mixed forests. This study aimed to fit PDFs and develop predictive models for PDF parameters, so that the predicted distribution would represent dynamic forest structures and compositions in mixed forest stands. We fitted three of the simplest forms of PDFs, log-normal, gamma, and Weibull, for the DBH of eight tree species, namely balsam fir (Abies balsamea [L.] Mill.), eastern white pine (Pinus strobus L.), paper birch (Betula papyrifera Marshall), red maple (Acer rubrum L.), red pine (Pinus resinosa Aiton), sugar maple (Acer saccharum Marshall), trembling aspen (Populus tremuloides Michx), and white spruce (Picea glauca [Moench] Voss), all grown in natural-origin mixed forests in Ontario province, Canada. We estimated the parameters of the PDFs as a function of DBH mean and standard deviation for these species. Our results showed that log-normal fit the best among the three PDFs. We demonstrated that the predictive model could estimate the recovered parameters unbiasedly for all species, which can be used to reconstruct the DBH distributions of these tree species. In addition to prediction, the cross-validated R2 for the DBH mean ranged between 0.76 for red maple and 0.92 for red pine. However, the R2 for the regression of the standard deviation ranged between 0.00 for red pine and 0.69 for sugar maple, although it produced unbiased predictions and a small mean absolute bias. As these mean and standard deviations are regressed with dynamic covariates (such as stem density and stand basal area), in addition to climate and static geographic variables, the predicted DBH distribution can reflect change over time in response to management or any type of disturbance in the regime of the given geography. The predictive model-based DBH distributions can be applied to the design of appropriate silviculture systems for forest management planning.
1. Introduction
Tree diameter at breast height (DBH) is the fundamental attribute used to characterize individual trees and stand-level forest growth and development. It has always been used in forest management planning [1,2] to predict other tree- and stand-level attributes, such as tree height, tree forms, stem density, basal area, stand structure and composition, and wood biomass and volume [3]. Model-based prediction systems for assessing forest resources require DBH at the foremost, as it is an input variable used in growth model simulators, which are used in management planning and implementation. The Forest Vegetation Simulator (FVS) [4], Mixedwood Growth Model [5], NATURA [6], and the Tree and Stand Simulator [7] are a few examples of growth simulators used in various parts of North America that rely on DBH. These simulators are used to characterize forest stand growth and predict long-term timber volumes, stand density, and basal area [8,9] as needed for forest management.
Silviculture practices in commercially managed forest largely depend on stand-level basal area and stem density to regulate and direct the succession trajectory throughout the rotation cycle of forest stands. The stand density management diagram [10,11] and the stocking diagram [12,13] are examples of decision tools for regulating silvicultural systems. The proper maintenance of DBH (class) distribution, stand age, structure, composition, relative frequency (or proportion) [14], and gap dynamics [15] are the basis for regulating forests over rotation cycles.
The DBH distribution of naturally grown forests can serve as a reference for management. For example, it helps minimize the differences of age classes in frequency distributions, while applying silviculture systems and harvest schedules. Management requires accounting for gap dynamics [15] for competition-related mortality, natural senescence, and other forms of natural disturbance like wildfire, insect epidemics, and disease [16,17], in order to mimic the natural process of stand development. An appropriate silvicultural strategy can convert evenly aged forest stands into close-to-naturally grown unevenly aged structures [18] using stem density manipulation over time. Growth models provide a useful decision support tool in long-term forest management, so more precise predictive systems are beneficial [19].
An array of individual tree DBHs may follow some (standard) probability distribution functions (PDFs) depending on various environmental variables, such as the following dendrometric variables: stem density, basal area, dominant height, and species composition, including age structure. Geo- and topographic variables like elevation, slope, aspect, geographic position, and climate, particularly precipitation and temperature, among others, also affect species’ DBH distribution [20,21]. Some of these variables are static (e.g., geographic position) but many are dynamic (e.g., vegetation structure and bioclimate). Therefore, the parameter of the PDFs, once fitted, may change over time, which may be predicted by developing some predictive models [22,23,24]. Alternatively, the parameters of the probability density function can be mathematically calculated by solving the system of equations of moments and percentiles [22,25,26], which can be regressed in terms of dynamic variables.
Several tree species in the province of Ontario, Canada are commercially important. Although black spruce (Picea mariana (Mill) B.S.P) and jack pine (Pinus banksiana Lamb) are dominating species in terms of presence and abundancy across the province, 82 species are listed in provincial inventory data, of which 42 occur in our current study site in various proportions [27]. Among these, a few have a substantial presence, depending on location and ecological distribution. These species have two sources of origin: naturally grown, mainly by wildfire disturbance, which encompasses about 75% of the sample plots or plantation origin. Naturally originated stands are richer in diversity in DBH, height, and age than the plantation origin stands [28,29].
There have been a few studies on the development of diameter distribution models for jack pine and black spruce grown in Ontario [22,30,31,32]. However, these models are not available for many other commercially important tree species which are less common or sub-dominating in terms of abundancy in Ontario. The study scoped that the developed model would be used in need-based forest management planning, along with being valued for use in the scientific literature for DBH simulations using simple statistics-based parameter recovery techniques. The goal of this study was to develop dynamic models for DBH distributions of eight commercial tree species grown in natural-origin mixed stands across Ontario, namely balsam fir (Abies balsamea (L.) Mill.), eastern white pine (Pinus strobus L.), paper birch (Betula papyrifera Marshall), red maple (Acer rubrum L.), red pine (Pinus resinosa Aiton), sugar maple (Acer saccharum Marshall), trembling aspen (Populus tremuloides Michx), and white spruce (Picea glauca [Moench] Voss). The specific objectives were to: (a) fit selected three PDFs, gamma, log-normal, and Weibull, for the DBHs of these species, (b) compare DBH distributions reconstructed based on the parameters obtained using maximum likelihood and parameter recovery methods, and (c) construct predictive models for the estimated parameters as functions of stand-level dynamic variables, using data collected from permanent sample plots across Ontario.
2. Methods
2.1. Description of Study Area
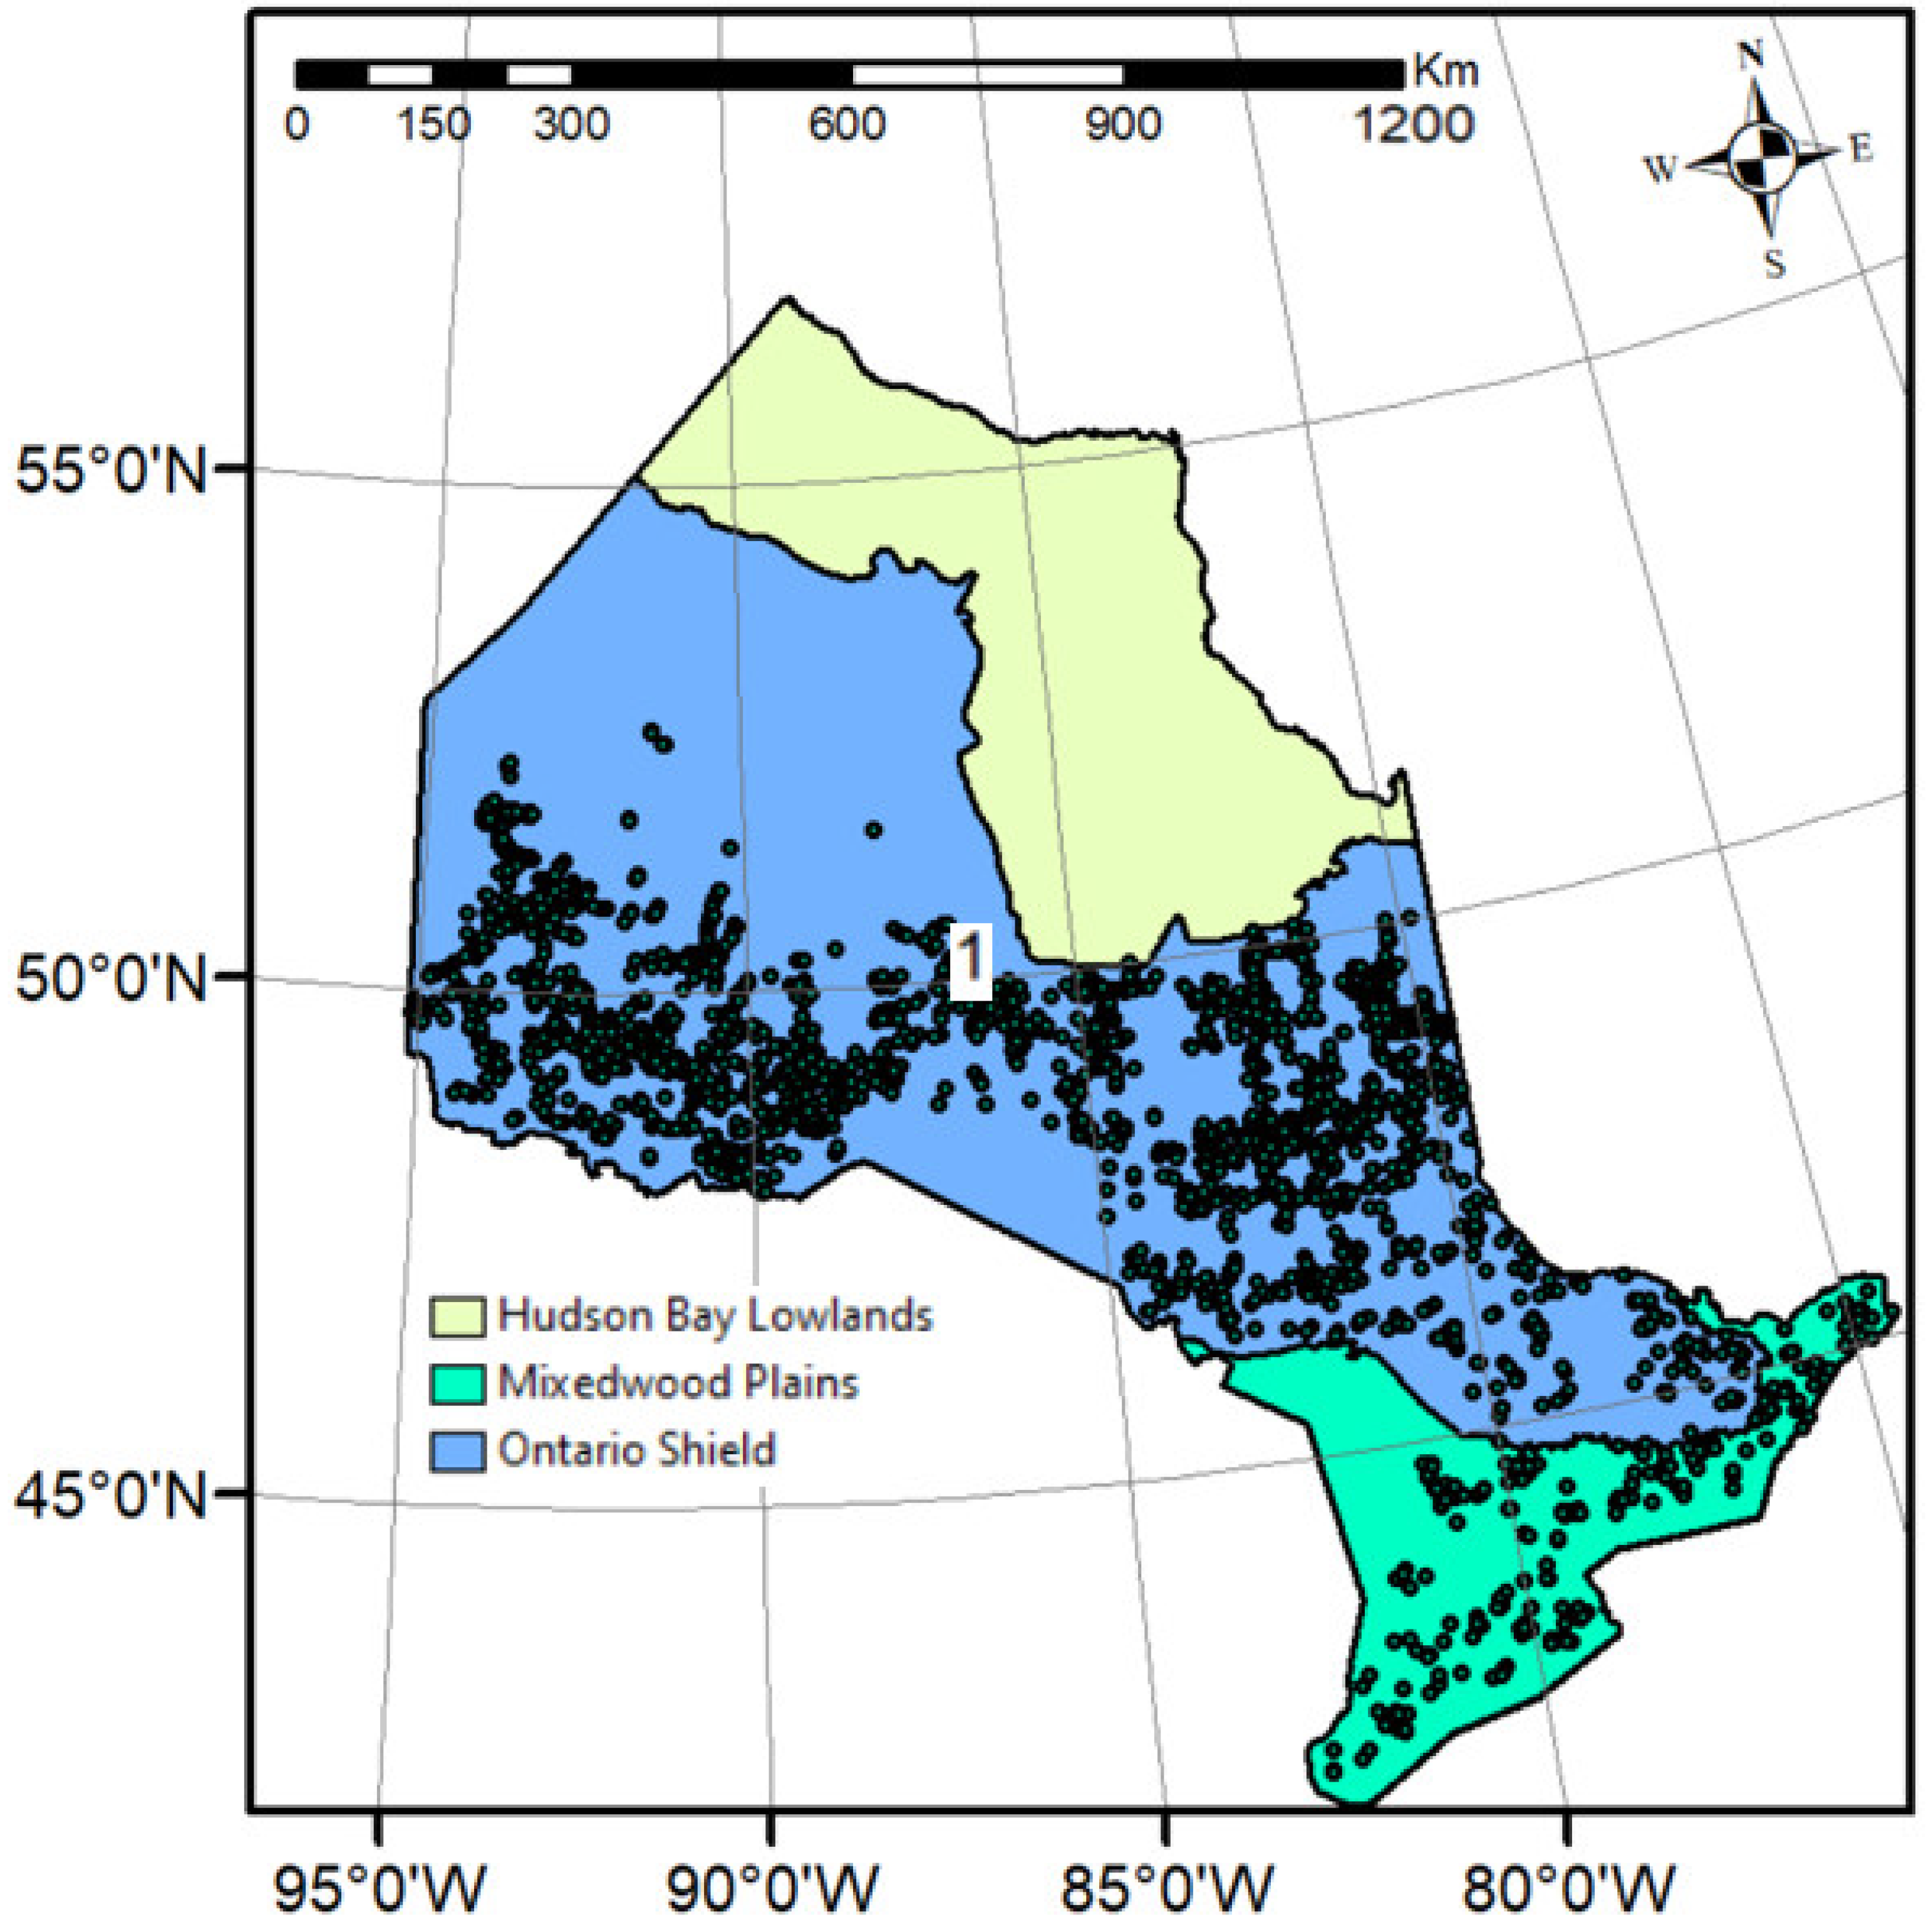
Our study area is spread across Ontario, Canada. It expands between 75° W and 95° W longitude and 43° N and 53° N latitude. All sample plots taken in this study are located in the Ontario Shield and Mixedwood Plains ecozones (Figure 1).

Figure 1.
Study area showing the sample plots (points) distributions, and ecozone, within Ontario. The provincial base maps and ecozone polygons were downloaded from Ontario GeoHub (https://geohub.lio.gov.on.ca/) on 26 December 2023.
The area features wildfire-origin coniferous pure or mixed forest stands in the north and windthrow and insect epidemics (especially, spruce budworm—Choristoneura fumiferana [Clemens])-origin mixed species in the south [33,34]. Black spruce, jack pine, balsam fir, and tamarack (Larix laricina) are dominating coniferous species in the northern region, whereas deciduous mixtures of sugar maple and American beech (Fagus grandifolia) are found in the southern region of this ecozone. Although the structural compositions of the vegetation vary, black spruce and jack pine are universal across this ecozone [35]. Other species can be found in various proportions.
2.2. Data Source
Data collected from permanent sample plots, which were established and repeatedly measured by the Ontario Ministry of Natural Resources and Forestry, were used in our study. These plots were established and maintained in the natural and planted forest stands, comprising different forest types in terms of ecology, geography, and species composition [36]. Most of the sample plots have repeated measurements, but the number of repetitions varied between two and five. However, a few sample plots had one time measurement. Among these, we used DBH data selected from live trees grown only in natural mixed stands.
The tree species (other than black spruce and jack pine) that accounted for at least 20% of the basal area in each sample plot was selected for this study. That threshold resulted in eight species with varying numbers of sample plots, repeatedly measured plots, and individual trees (Table 1). The mean proportions of the selected species varied between 27% and 71%, but in some cases were 100%, signifying a single-species sample plot.

Table 1.
Species included in this study and sample numbers for two plot types and individual trees. The species codes in this table are used throughout the paper to refer to the respective species.
To avoid the non-convergence problem when fitting probability distribution functions, we selected plots for the species that included at least five individual trees’ DBH measurements of the same species individually. Summary statistics of tree-level DBHs are presented in Table 2.
Table 2.
Summary statistics of diameters at breast height of selected eight species from the selected sample plots.
2.3. Model Development
We fit and evaluated two types of models. The first was to fit the probability distribution functions (PDFs) of the DBHs of individual trees of eight selected species. To fit the PDFs, we used the entire individual trees for global fit and, for each repeated plot, DBH for a plot (stand)-level fit, assuming the repeated data were independent (Table 1). The second was to construct two regression models; one for the DBH’s mean and another for standard deviation, from which we could recover parameters of the PDFs. We constructed the regression fitting at the spatial plot level by considering a hierarchical random effect for the repeated measurements within the spatial plot.
2.3.1. Fitting Probability Distribution Functions
The parameters of any PDFs may be estimated using distribution fitting that involves the maximum likelihood method. Alternatively, these parameters can be estimated or calculated using simple statistics like the mean and standard deviation, which is often referred to as the parameter recovery method [25,37]. This method has been used in studies by several researchers such as Liu et al. [22,23] and Zhang et al. [38], among others. In this method, the parameters of PDFs are functionally linked to the stand-level mean and standard deviation of DBH [22,23]. We reconstructed DBH distributions for eight species (Table 1) based on the parameters estimated using both methods and constructed 5 cm DBH classes. The mathematical forms of selected PDFs, their relationships with the mean and standard deviation of the data (DBH), and their respective parameters are described in the following subsections.
We fit three PDFs, namely log-normal [39] adopted from [24], gamma [40], and Weibull [41,42,43], which are suitable for fitting positive and continuous random variables. Although there are several types of PDFs suitable for these types of variables that have been used and tested for selected tree species (see [24,26,44,45]), we selected the simplest that could readily be applicable for forest management for all species considered in this study.
Log-Normal Probability Distribution Function
Let us suppose X is a random variable (DBH in our case) with positive values (non-negative). The log-transformed variable (log(X) follows a normal distribution with a mean (µ > 0) and standard deviation (σ > 0), provided the variable X follows a log-normal distribution. Here, µ and σ are the mean and standard deviation of the log-transformed random variable log(X). The PDF (f) of X is as given in Equation (1) below. For simplicity, Equations (1)–(9) are reproduced here from Rijal and Sharma [32].
We estimate the parameters µ and σ using the maximum likelihood method. The sample mean () and standard deviation (s) of the random variable (X) can be used to calculate the parameters (µ: population mean and σ: standard deviation), as they are unbiased estimators, using the following simultaneous Equations (2) and (3):
The “fitdistrplus” package [46] in R [47] was used to fit Equation (1) and estimate the parameters for the available DBH data values. In the parameter recovery method, these parameters were calculated by solving two simultaneous equations (Equations (2) and (3)), relating the parameters with the sample mean () and sample variance s2. The “nleqslv” package [48] in R was used to solve the system of simultaneous equations (Equations (2) and (3)).
Weibull Probability Distribution Function
Assume X is a positive and continuous random variable. The PDF of the Weibull distribution with scale parameter α (>0) and shape parameter β (>0) is given in Equation (4), as follows:
The parameters α and β are estimated using the maximum likelihood method. We used the “fitdistrplus” package to estimate these parameters, as above in Equation (1), for an array of the DBH. Alternatively, these parameters can be calculated using the sample mean () and sample standard deviation (s) of an array of DBHs by solving simultaneous Equations (5) and (6), as given below:
where Γ is the gamma function. Please note that the sample mean and standard deviation are the unbiased estimators of population mean (µ) and standard deviation ().
As described in the section “Log-Normal Probability Distribution Function”, parameters α and β were found as the solution values of Equation (4) using the maximum likelihood method. The parameters in Equations (5) and (6) were calculated as the solution of two simultaneous equations. Like above, the “nleqslv” package was used to solve the system of simultaneous equations (Equations (5) and (6)).
Gamma Probability Distribution Function
Let us suppose X is a positive continuous random variable (>0 to ). The PDF of gamma distribution of random variable X with the (shape) parameter β (>0) and (rate) parameter λ (>0) is given by Equation (7), as follows:
Once again, as described in the sections “Log-normal probability distribution function” and “Weibull probability distribution function” above, parameters β and λ were estimated by solving Equation (7) using the “fitdistrplus” package. The simultaneous Equations (8) and (9) were solved to find parameters β and λ, using the sample mean and standard deviation as an unbiased estimator of the population mean (μ) and standard deviation (σ). As above, the simultaneous equations were solved using the “nleqslv” package.
2.3.2. Development of Regression Models
The distribution of DBH depends on various environmental variables, including dendrometric variables such as competition-related attributes like basal area, stem density, dominant height, species composition [22,49], and age structure; geographic variables such as elevation, slope, aspect, geographic position, and climate [20,21,49], chiefly precipitation and temperature, among others. These are either static or dynamic variables. The dendrometric variables are dynamic as they change over time in response to management interventions or natural growth and disturbances, whereas the geographic variables are considered static as they do not change within the span of a forest rotation. It indicates that the parameters of the PDFs may change over time and can be predicted by developing the models based on the dendrometric variables like site index, stand density, age, basal area, or quadratic mean diameter (QMD) [22,23,24], in addition to static variables like geographic attributes.
To construct predictive models, we require model covariates. From an array of measured DBHs of species-wise individual trees listed in each sample plot, we computed the following stand-level dendrometric variables: species-wise and total basal area per ha (BAPH), stem density per ha, quadratic mean diameter, and dominant height for each sample plot (Table 3). Additionally, we received simulated climatic attributes such as annual and monthly mean precipitation, temperature, number of growing days, and moisture index from Natural Resources Canada, Great Lake Forestry Centre, Ontario, for each sample plot. We calculated the overall annual mean and standard deviation of these variables and used them as model covariates. Some variables were log-transformed to eliminate the possible effects of multicollinearity among the covariates considered in our full models, especially basal area, stem density, and total and species-wise attributes for the given stands. The formulation of the regressions is given in Equation (10) and detailed with the examined covariates in Equation (11).
Table 3.
Summary statistics of stand-level derived variables for eight selected species found in sample plots of this study.
We fit the two models, one for the DBH mean and another for standard deviation, as a function of stand-level covariates. These response variables (mean and standard deviation) were used to compute the parameters of each PDF using the equations aforementioned (Equations (2), (3), (5), (6), (8) and (9)) and then simulate the DBH distributions using selected three PDFs.
Let be a random variable (DBH) representing one of our response variables (the mean of DBH and standard deviation of DBH of (each) sample plot i).
The expected value of is subjected to the random effect of the sample plot i. The expected values (E(Yi)) are regressed with model covariates using a generalized linear modelling technique [47] with m (=1, 2, 3, …) covariates using link function g(.) [50], as follows:
where β0 is the intercept parameter for fixed effects, φi is the plot level random effect, and φij is the year-level random effect nested within the plot. The random effects were considered only in the intercept portion of the parameters model for simplicity, and βm (m = 1, 2, 3, …) are parameters associated with other model covariates, as presented in Equation (11).
Our model response variables, the mean and standard deviation, are positive continuous numbers. Therefore, the parameters of these models were estimated assuming the gamma-distributed random errors, e.g., [22], instead of the traditional practice of assuming the normality of the errors.
Foremost, we fit full models that consisted of all dendrometric, geographic, and climatic attributes as model covariates, as mentioned above, for these two models, one for DBH mean and another for DBH standard deviation, for all eight species. We sorted out the model covariates to construct the reduced models using Bayesian information criteria (BIC) [51] and removed the covariates that had the highest non-significant (>0.05) p-value systematically one at a time. We were cautious of the possible impacts of multicollinearity on the estimated parameters. We calculated the pairwise variance inflation factor (VIF) among the covariates that we considered in our full model. We kept the threshold value of VIF less than 5 (or Pearson’s correlation coefficient of about 0.90), following the thumb rule [52]. In addition to a high VIF, the impact of multicollinearity could be observed through the inconsistent signs of estimated parameters and/or high t-values associated with model variables [53].
Our preliminary analyses showed that adding a hierarchal level for repeated measures, i.e., random effect (φij), did not improve the model. Therefore, these repeated sample plots were also considered to be independent samples in our study. The mathematical formulation of the regression model is as follows:
where Species_BA and Tot_BA are species-wise and total basal area (m2ha−1), respectively. Likewise, density is the stand-level stem density (no. ha−1) and QMD is the quadratic mean diameter (cm). The model includes a set of climate variables (j). The random effects were applied only to the plot level in our reduced model. The glmmTMB package [54] in R was used to fit the equations. We fit Equation (11) for the DBH mean and standard deviation separately. When we fit for the mean, the µ represents the mean of the DBH mean, whereas when we fit for standard deviation, the notation µ represents the mean of standard deviation.
2.4. Model Performances
The foremost statistical tool we used to compare the PDF was the BIC [51]. We simulated DBH distribution using the parameters estimated, using both approaches for the same number of individual trees for all species separately, as we had in the original dataset for each sample plot (Table 1). To predict consistent DBH distributions, we repeated the simulations 1000 times and calculated the mean of the model-predicted DBH distributions of these 1000 repetitions. We used the same random seed at the start of each species and PDF to make the results comparable while reconstructing the simulation-based DBH distributions. We compared the simulated DBH with the observed data. In addition, DBH class intervals of five centimeters (<5 cm, 5–10 cm, …, 45–50 cm) were constructed for the observed data array and the simulated values. We used the terms “fitted parameter” for the solutions obtained from distribution fitting and “recovered parameters” for those obtained from solving simultaneous equations. A Chi-squared test was performed to evaluate the hypothesis of whether the simulated and observed DBH were significantly different or not. In addition, we calculated the mean absolute bias (MAB), mean bias (MB), and R2 from the mean of 1000 repeated simulations and observed DBHs. We relied on the differences in the graphical presentation, as well as on other statistics.
We applied a cross-validation technique to compare the model performance statistics. For this, a one-fold 20% leave-out method was applied, and the process was repeated 200 times [55,56]. These 200 iterations produced the distribution of MB, MAB, and R2, but, for simplicity, we present the median and 90% confidence band of these statistics.
3. Results
3.1. Distribution Fitting
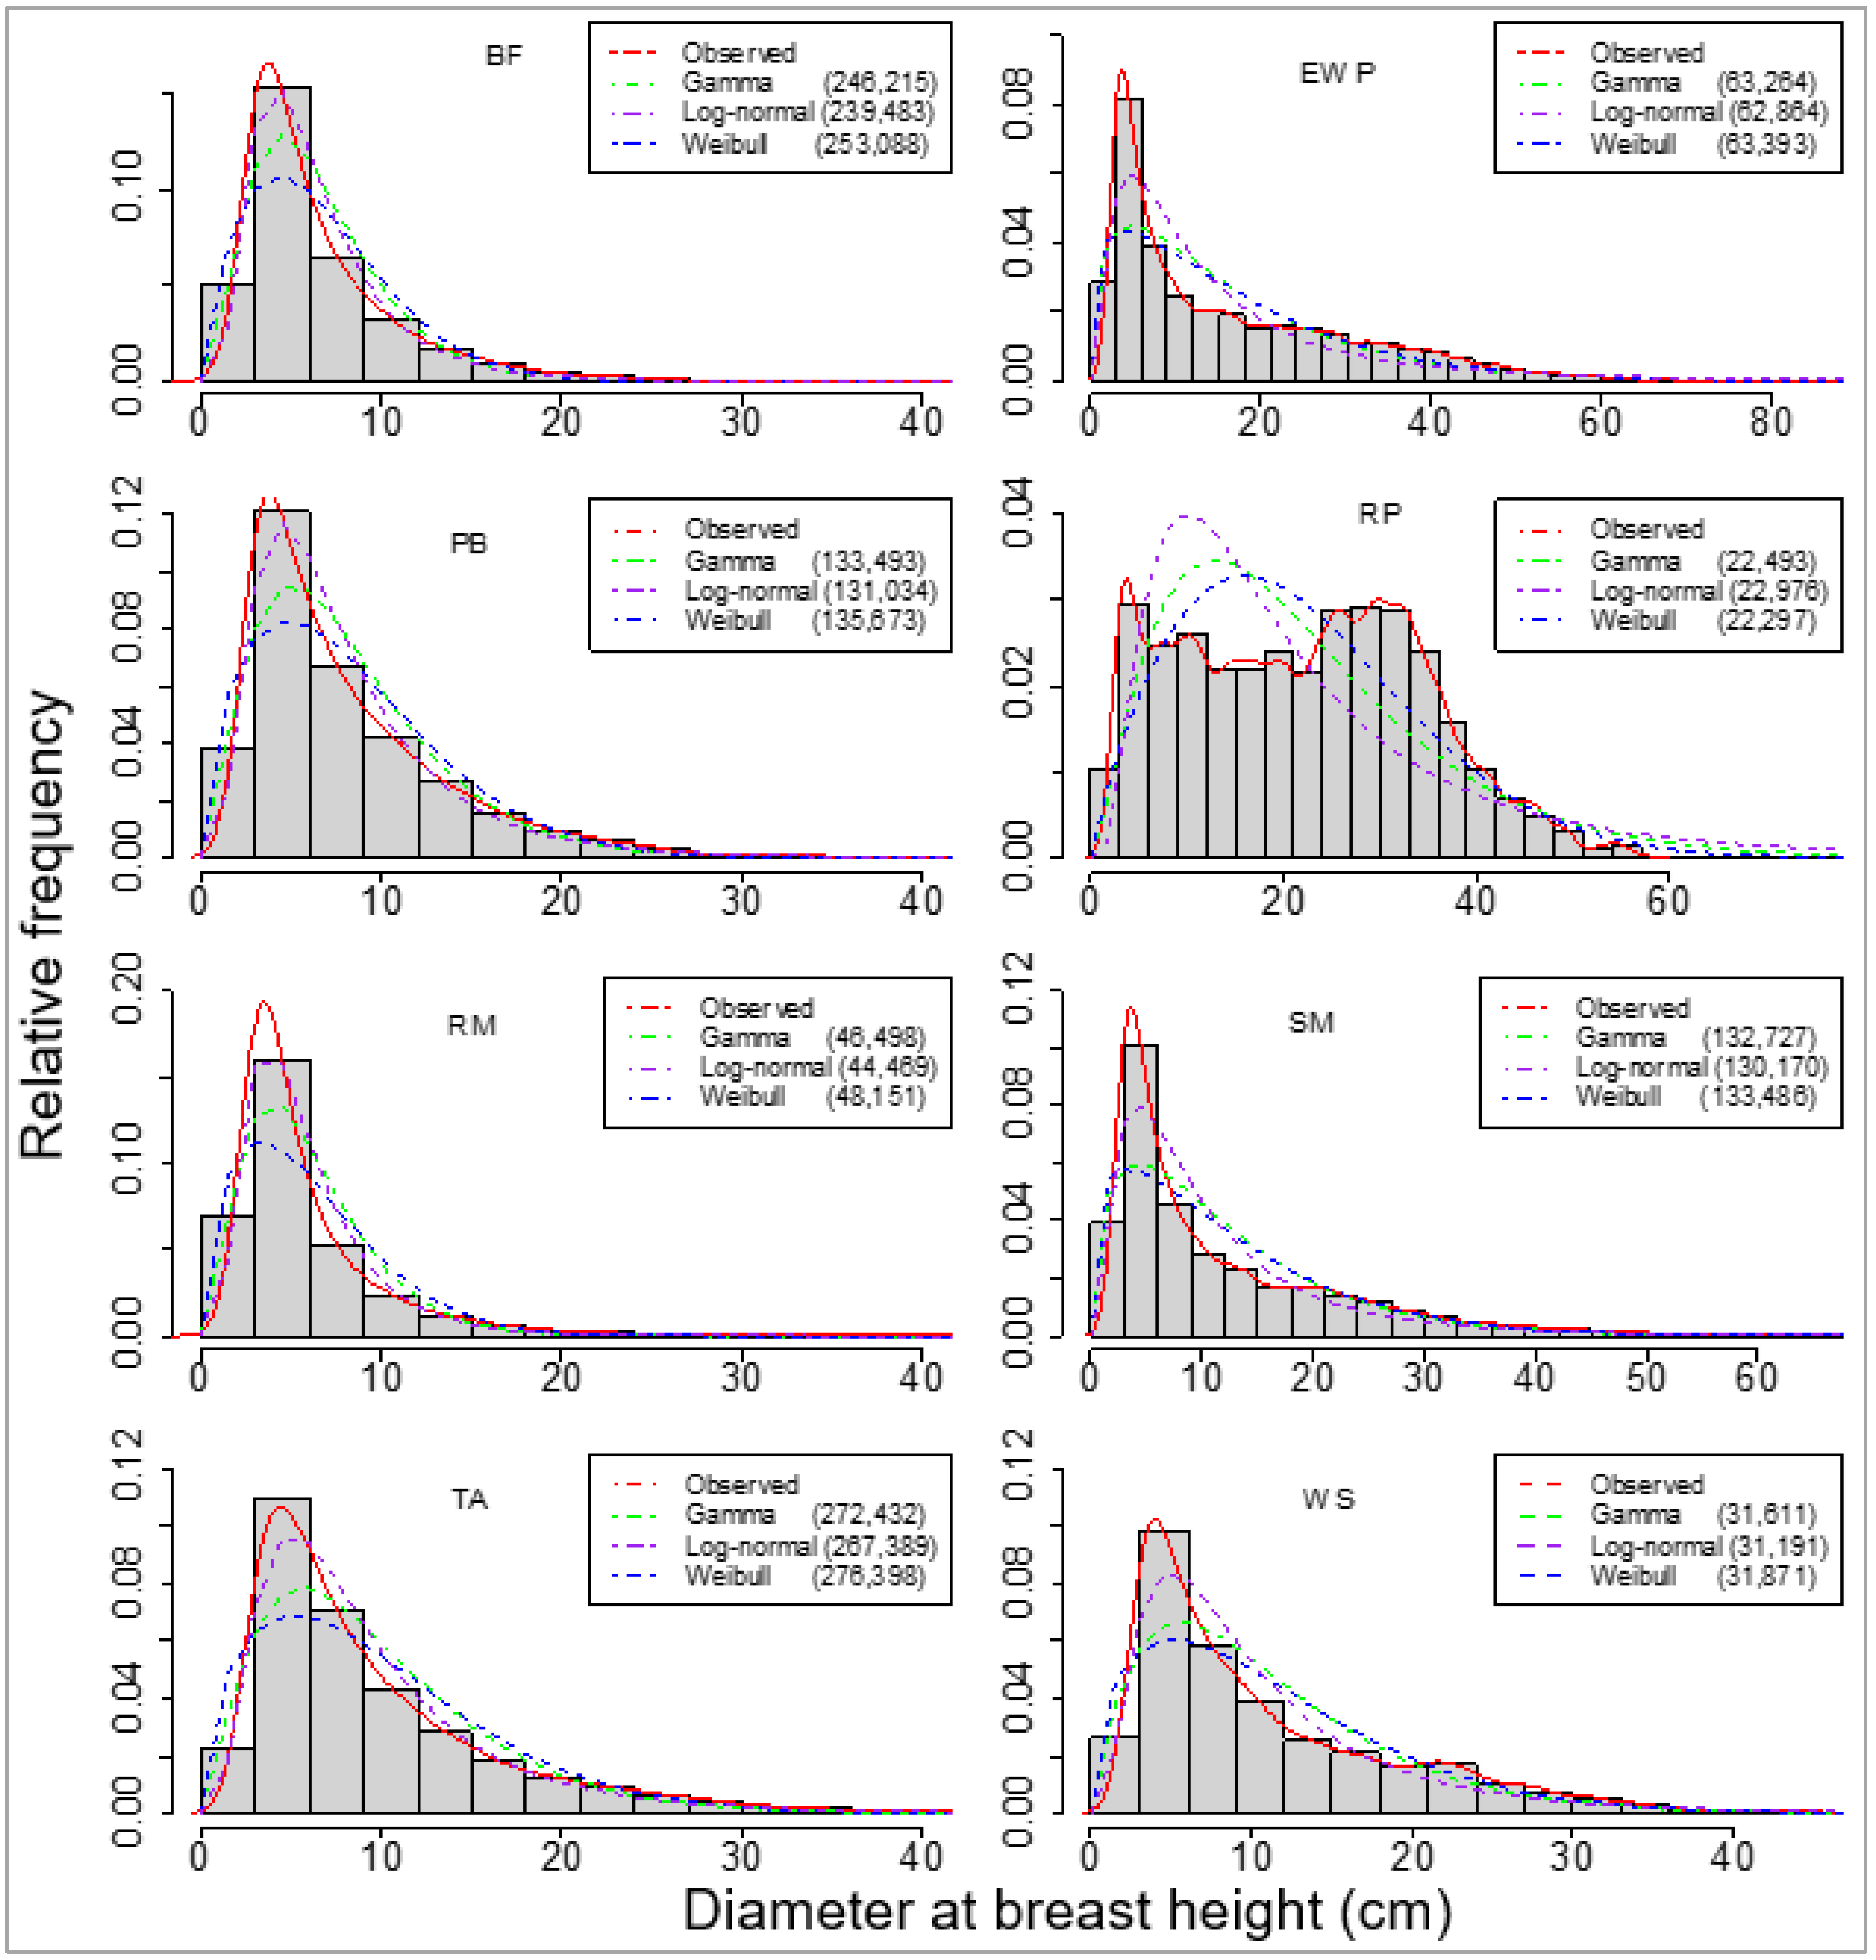
Firstly, we selected three probability distribution functions, which were fitted for eight species separately, using all trees from all sample plots to obtain a landscape level (Table 1) model for each species. Comparatively, these PDFs fit well with the observed data across the data range, as shown in Figure 2.
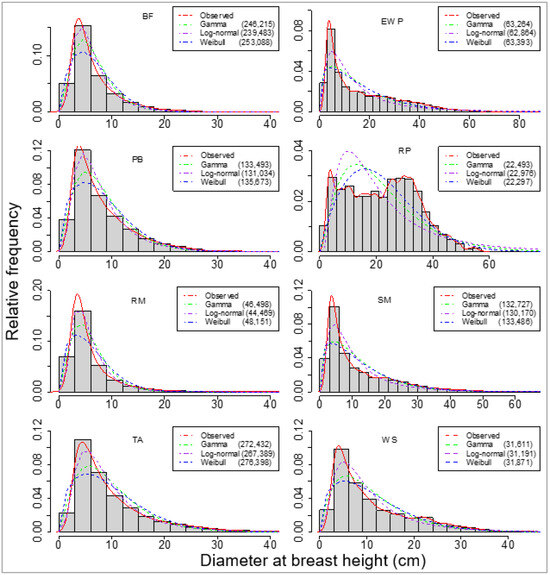
Figure 2.
Overall fit of one empirical and three parametric probability distribution functions (PDFs) for eight species. The species are balsam fir (BF), eastern white pine (EWP), paper birch (PB), red maple (RM), red pine (RP), sugar maple (SM), trembling aspen (TA), and white spruce (WS). Bayesian information criteria of the fits are provided in parentheses.
However, the BIC values showed that the log-normal distribution fit best for seven species, excluding red pine, which seemed to have a bimodal or multimodal distribution that differed from the other seven species, which had reverse j-shaped curves (Figure 2). Using the sample plot-wise large dataset, the model-estimated parameters were used to reconstruct the DBH distributions at the forest landscape level (Table 4) using any of the three PDFs.
Table 4.
Fitted and recovered parameters of species-wise three probability distribution functions (Equations (1)–(9)) at landscape level (all sample plots) for eight species. The species are balsam fir (BF), eastern white pine (EWP), paper birch (PB), red maple (RM), red pine (RP), sugar maple (SM), trembling aspen (TA), and white spruce (WS).
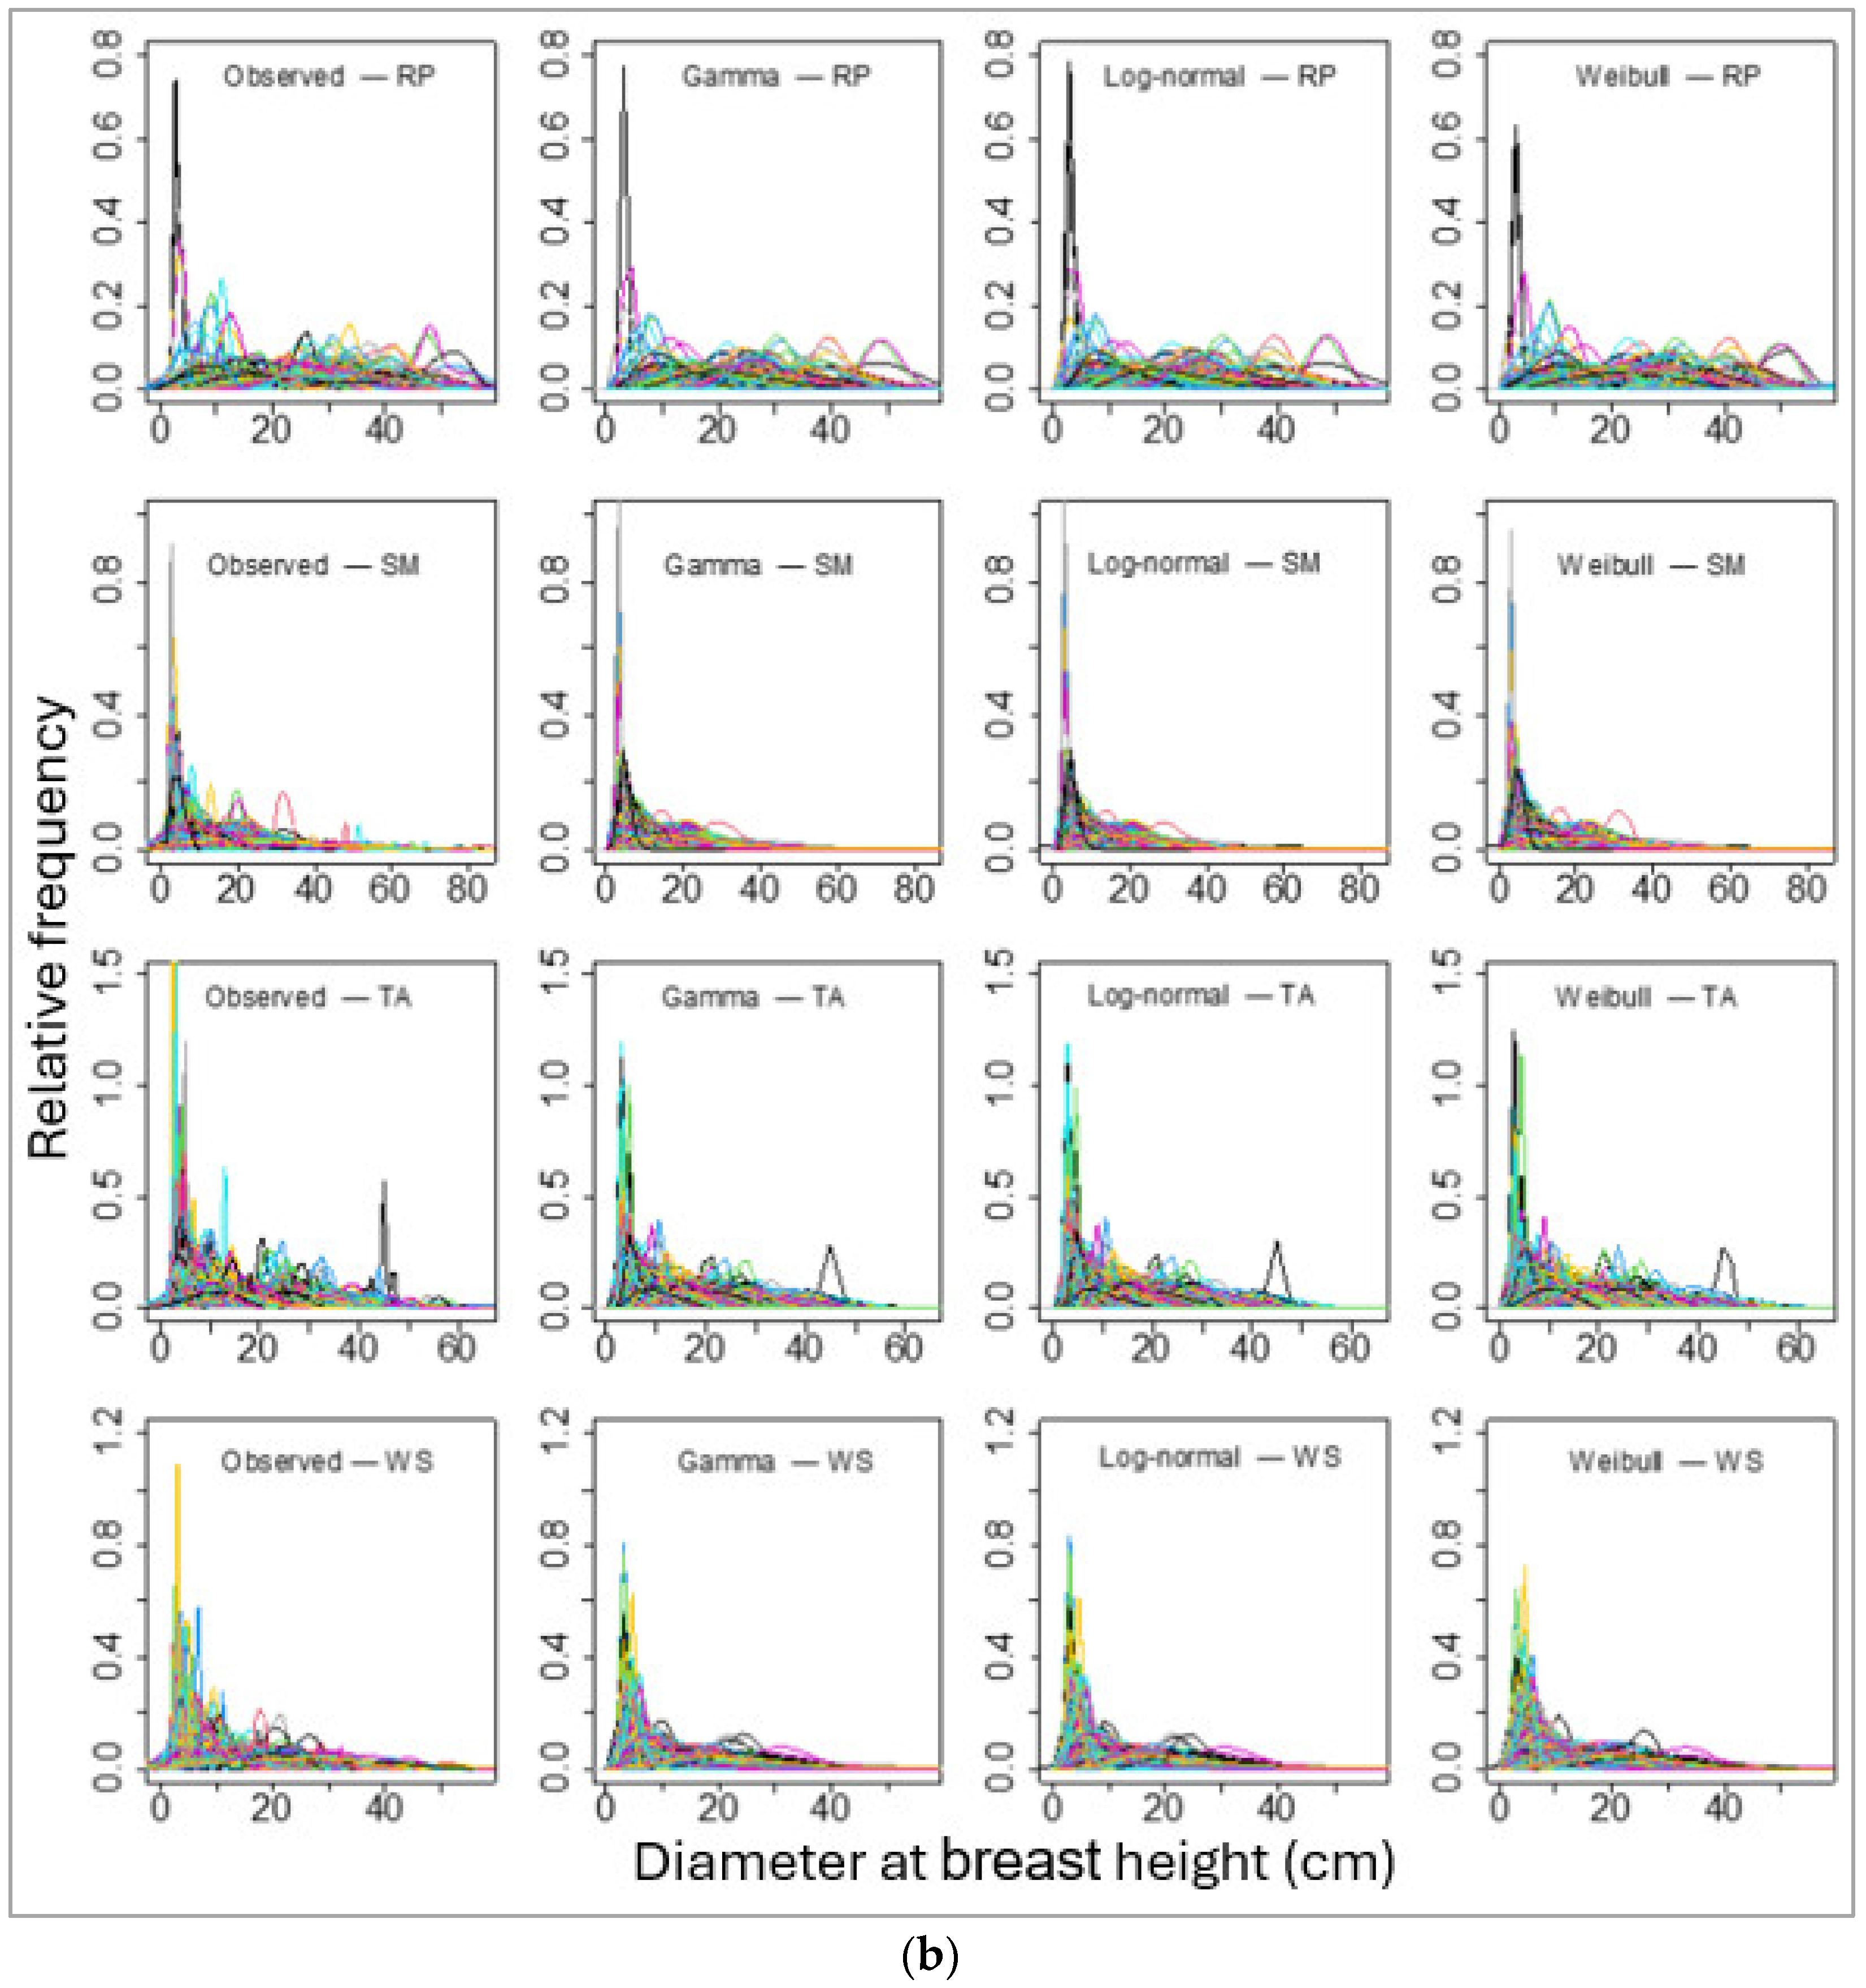
We then fitted these three PDFs of the individual tree DBHs for each species for each sample plot. The number of sample plots varied from 165 (for red pine) to 1433 (for balsam fir). The sample plot-wise distributions fits for all species using these three PDFs seemed to be alike in graphical representation (Figure 3a,b). However, the values of BIC showed that the log-normal distribution fit best in most of the sample plots (for all except red pine; Table 5).
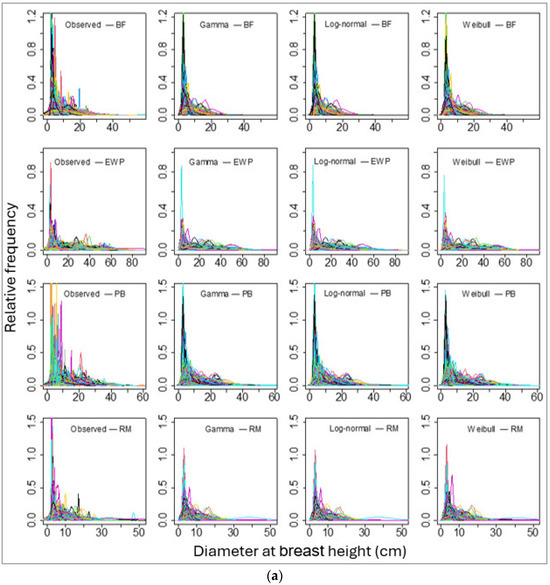
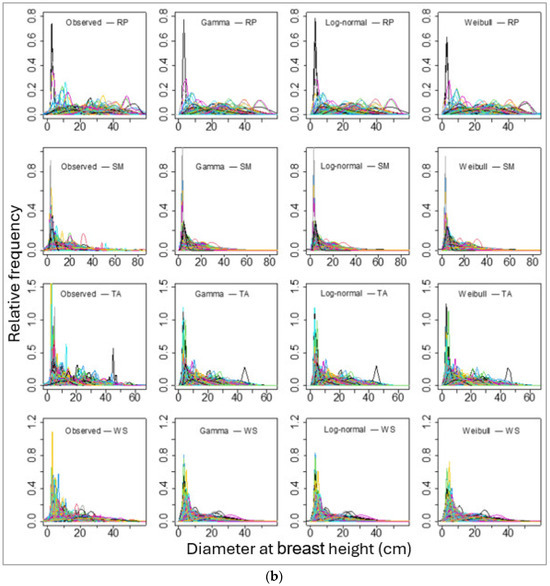
Figure 3.
Sample plots-wise observed (empirical probability) and parametric probability distributions fitted diameter at breast height for four species, namely (a) balsam fir (BF), Eastern white pine (EWP), paper birch (PB), and red maple (RM). And (b) red pine (RP), sugar maple (SM), trembling aspen (TA), and white spruce (WS). Please note that each line represents an array of DBHs of a single stand and the line colors represent DBHs of different stands, though they overlap with the same set of colors for multiple stands.
Table 5.
Number of sample plots with best fit for three probability distribution fittings based on Bayesian information criteria for eight species taken in this study.
We compared the recovered and fitted parameters of these three PDFs. The differences between these two for the landscape level fit were not substantial (Table 3). Our analysis results for sample plot-wise model fits and recoveries for all cases (Table 6) showed that we can precisely estimate the parameters of these distributions using simple and widely available variables, namely the computed mean and standard deviation of DBH. Depending on individual sample plots and the size of the sample, DBH distributions varied across species based on the median and 90% percentiles (Table 6).
Table 6.
The median and 90% confidence band of fitted and recovery parameter distributions of the diameters at breast height of eight species for all sample plots fitted individually. The species are balsam fir (BF), eastern white pine (EWP), paper birch (PB), red maple (RM), red pine (RP), sugar maple (SM), trembling aspen (TA), and white spruce (WS).
Thereafter, we grouped the continuous values of observed and simulated DBHs into class intervals of 5 cm and reconstructed the DBH class-wise frequency distribution. The class interval of simulated DBH and observed DBH applying the three PDFs (log-normal, gamma, and Weibull) and recovered and fitted parameters showed that they were alike in general. The p values of the Chi-squared test ranged from 0.22 to 0.99 for all PDFs for all species, except for the Weibull distribution for red pine (p = 0.01). The p values greater than our threshold, 0.05, suggested that the distribution which we selected can represent the observed values that correspond to the ones in Figure 3.
3.2. Fitting Regression Models
We constructed predictive models for the mean and standard deviation DBH (Equation (11)) in terms of dendrometric and environmental covariates. The covariates had different levels of impact and significance in predicting the mean (Table 7a) and standard deviation (Table 7b).
Table 7.
(a) Estimated parameters of species-wise regression fit for (response variable) stand-level mean with environmental variables. The species are balsam fir (BF), eastern white pine (EWP), paper birch (PB), red maple (RM), red pine (RP), sugar maple (SM), trembling aspen (TA), and white spruce (WS). The numbers presented in the table are significant values at a significance level of 0.05. Parameter details with t and p values are presented in Table A1. (b) Estimated parameters of species-wise regression fit for (response variable) stand-level standard deviation with environmental variables. The species are balsam fir (BF), eastern white pine (EWP), paper birch (PB), red maple (RM), red pine (RP), sugar maple (SM), trembling aspen (TA), and white spruce (WS). Numbers presented in the table are significant values at the probability significance level of 0.05. The details of the parameters with t and p values are presented in Table A2.
We initially considered two levels of random effects, namely sample plot and repeated measurement. Our analyses indicated that the impact of repeated-measurement-related random effects were nonsignificant. They only increased computational complexity and caused problems with model convergence, along with producing inconsistent parameter estimates.
The sample plot-level random effects were higher than the residual standard deviation for the models of the mean for all species (Table 7a). Similarly, the random effects were higher for the model of standard deviation for all species, except for paper birch and red maple. The comparative numbers of random effects and residuals standard deviation could infer that the random effects were substantial in explaining the model variability.
We examined models’ performances based on cross-validated statistics, namely MB, MAB, and R2. The models yielded unbiased prediction at 90% confidence intervals for the mean (Table 8a) and the standard deviation (Table 8b) for all species. The median of mean absolute bias varied between 0.48 and 2.74, and between 0.72 and 2.56 for mean and standard deviation, respectively. Likewise, the R2 varied between 0.76 and 0.92 for the mean and 0 and 0.46 for the standard deviation.
Table 8.
Species-wise regression model performance statistics, using regression for the (a) mean and (b) standard deviation. The species are balsam fir (BF), eastern white pine (EWP), paper birch (PB), red maple (RM), red pine (RP), sugar maple (SM), trembling aspen (TA), and white spruce (WS).
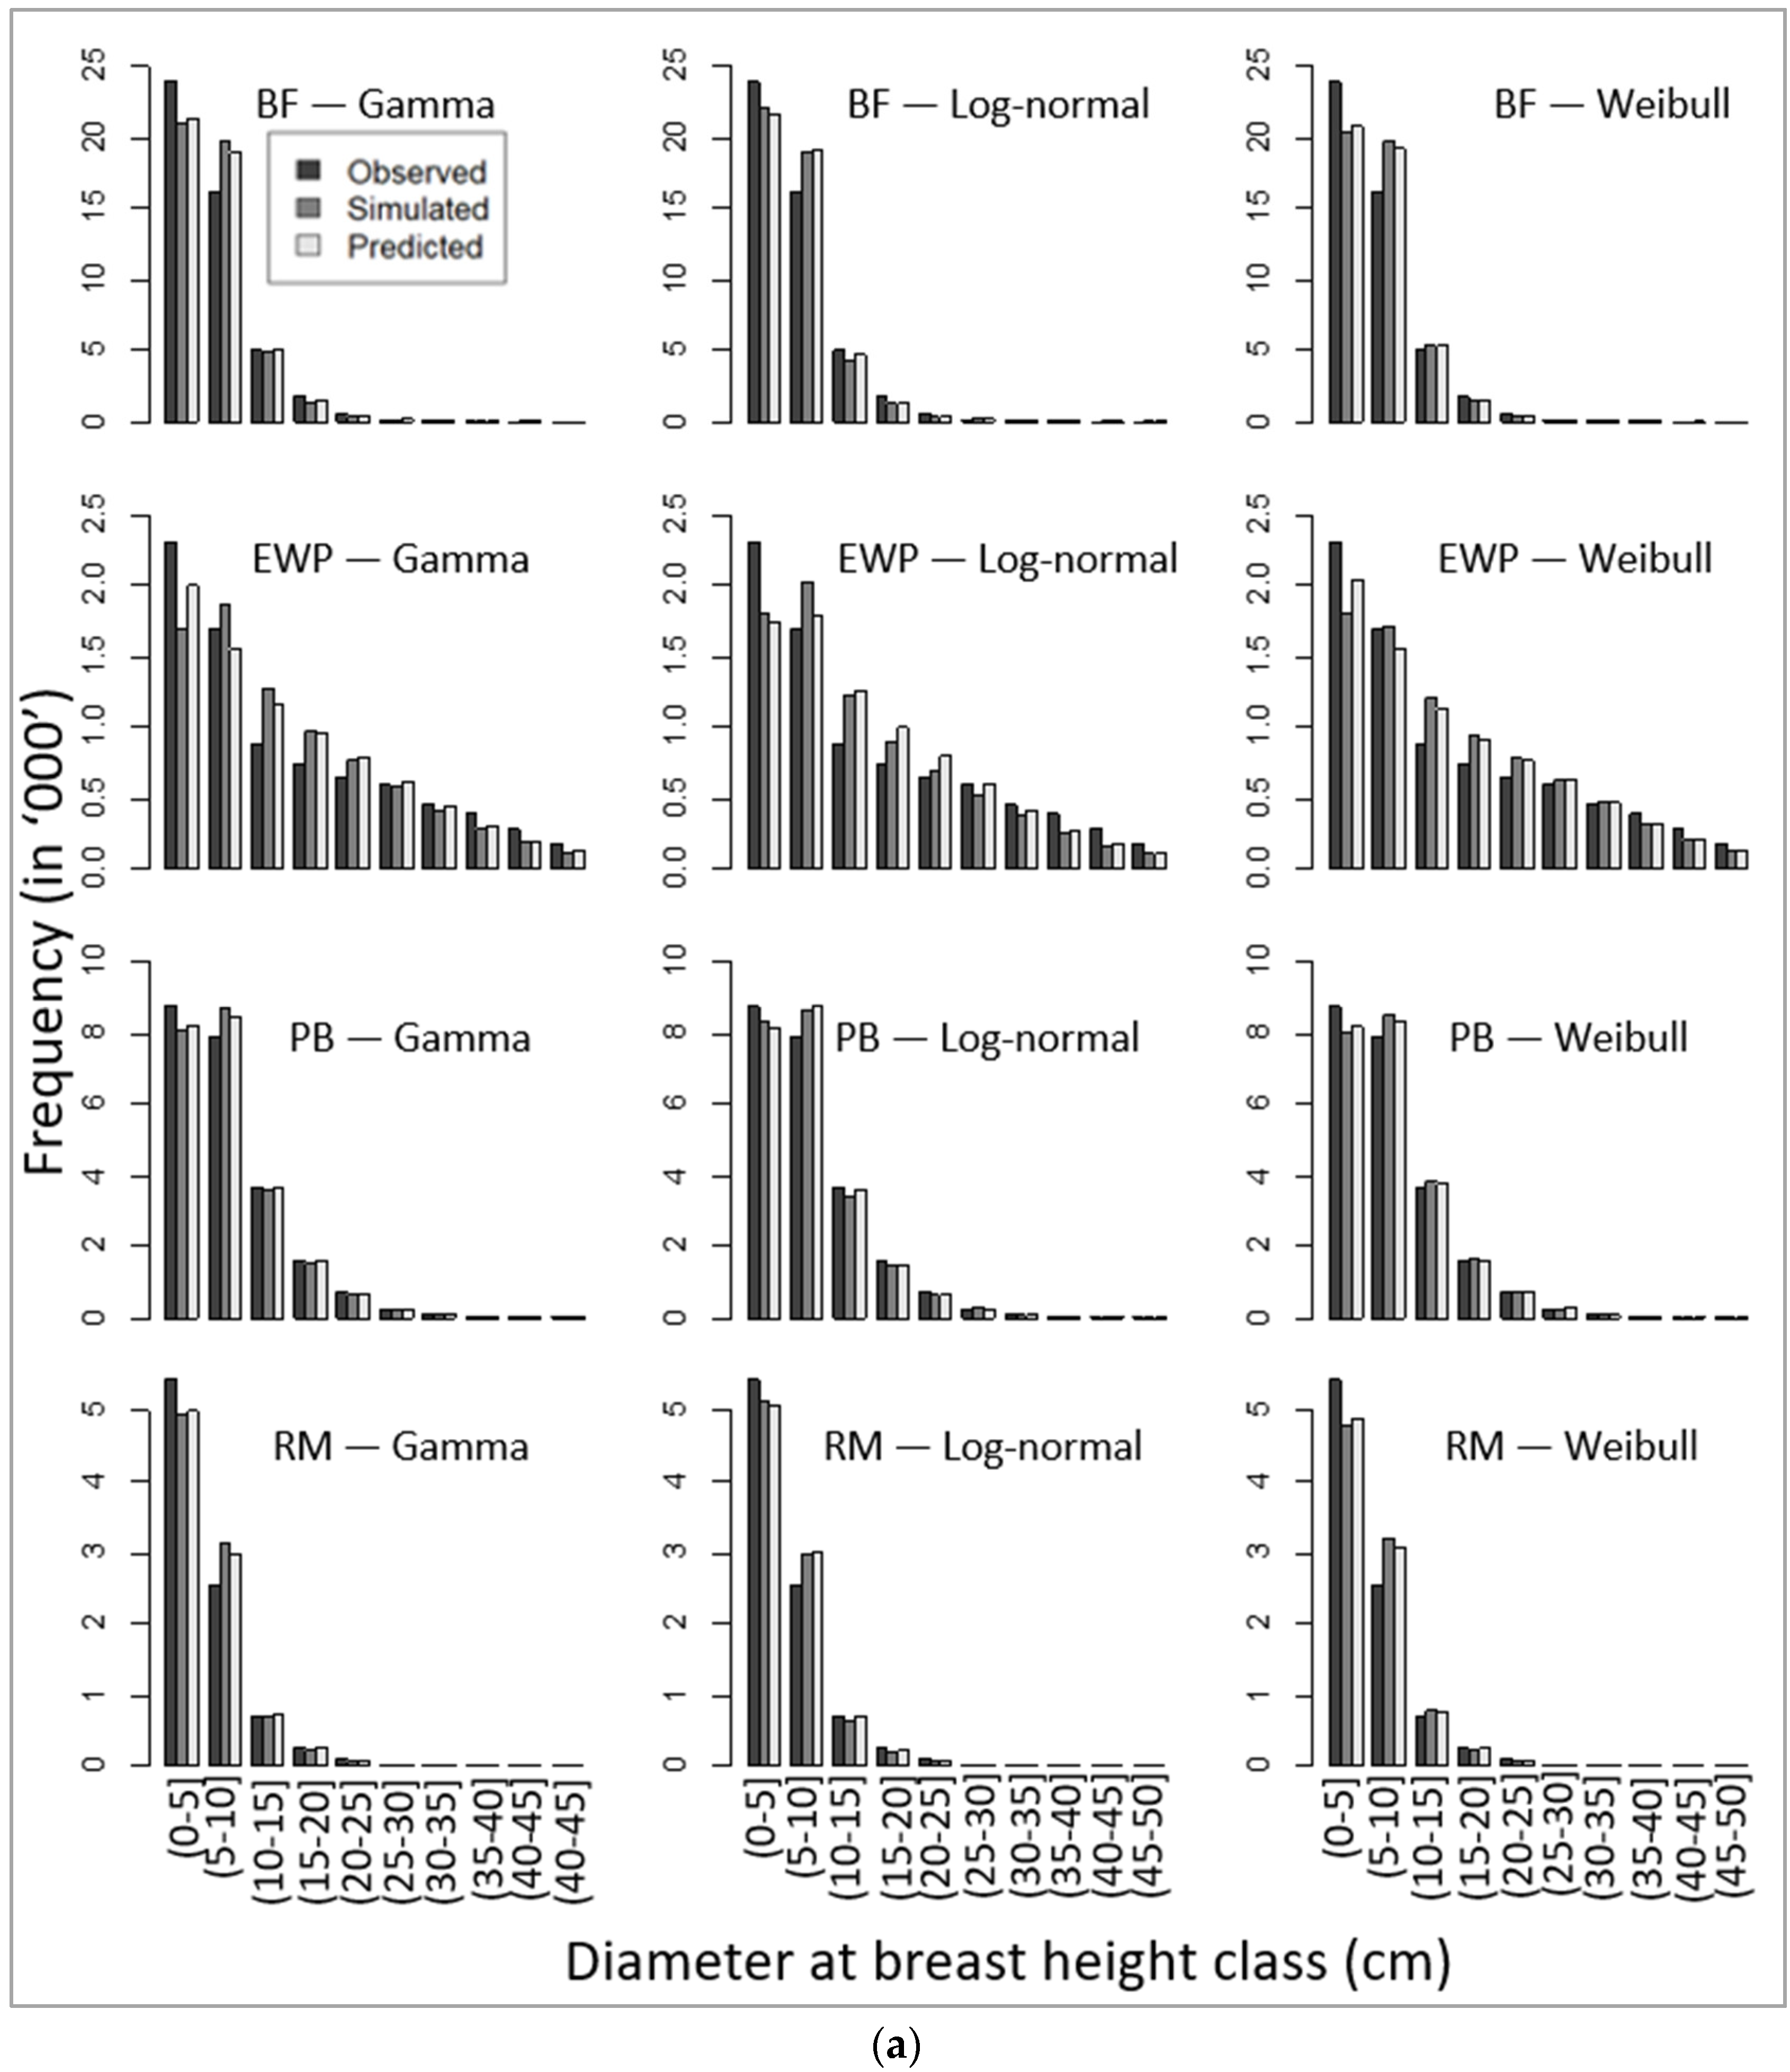
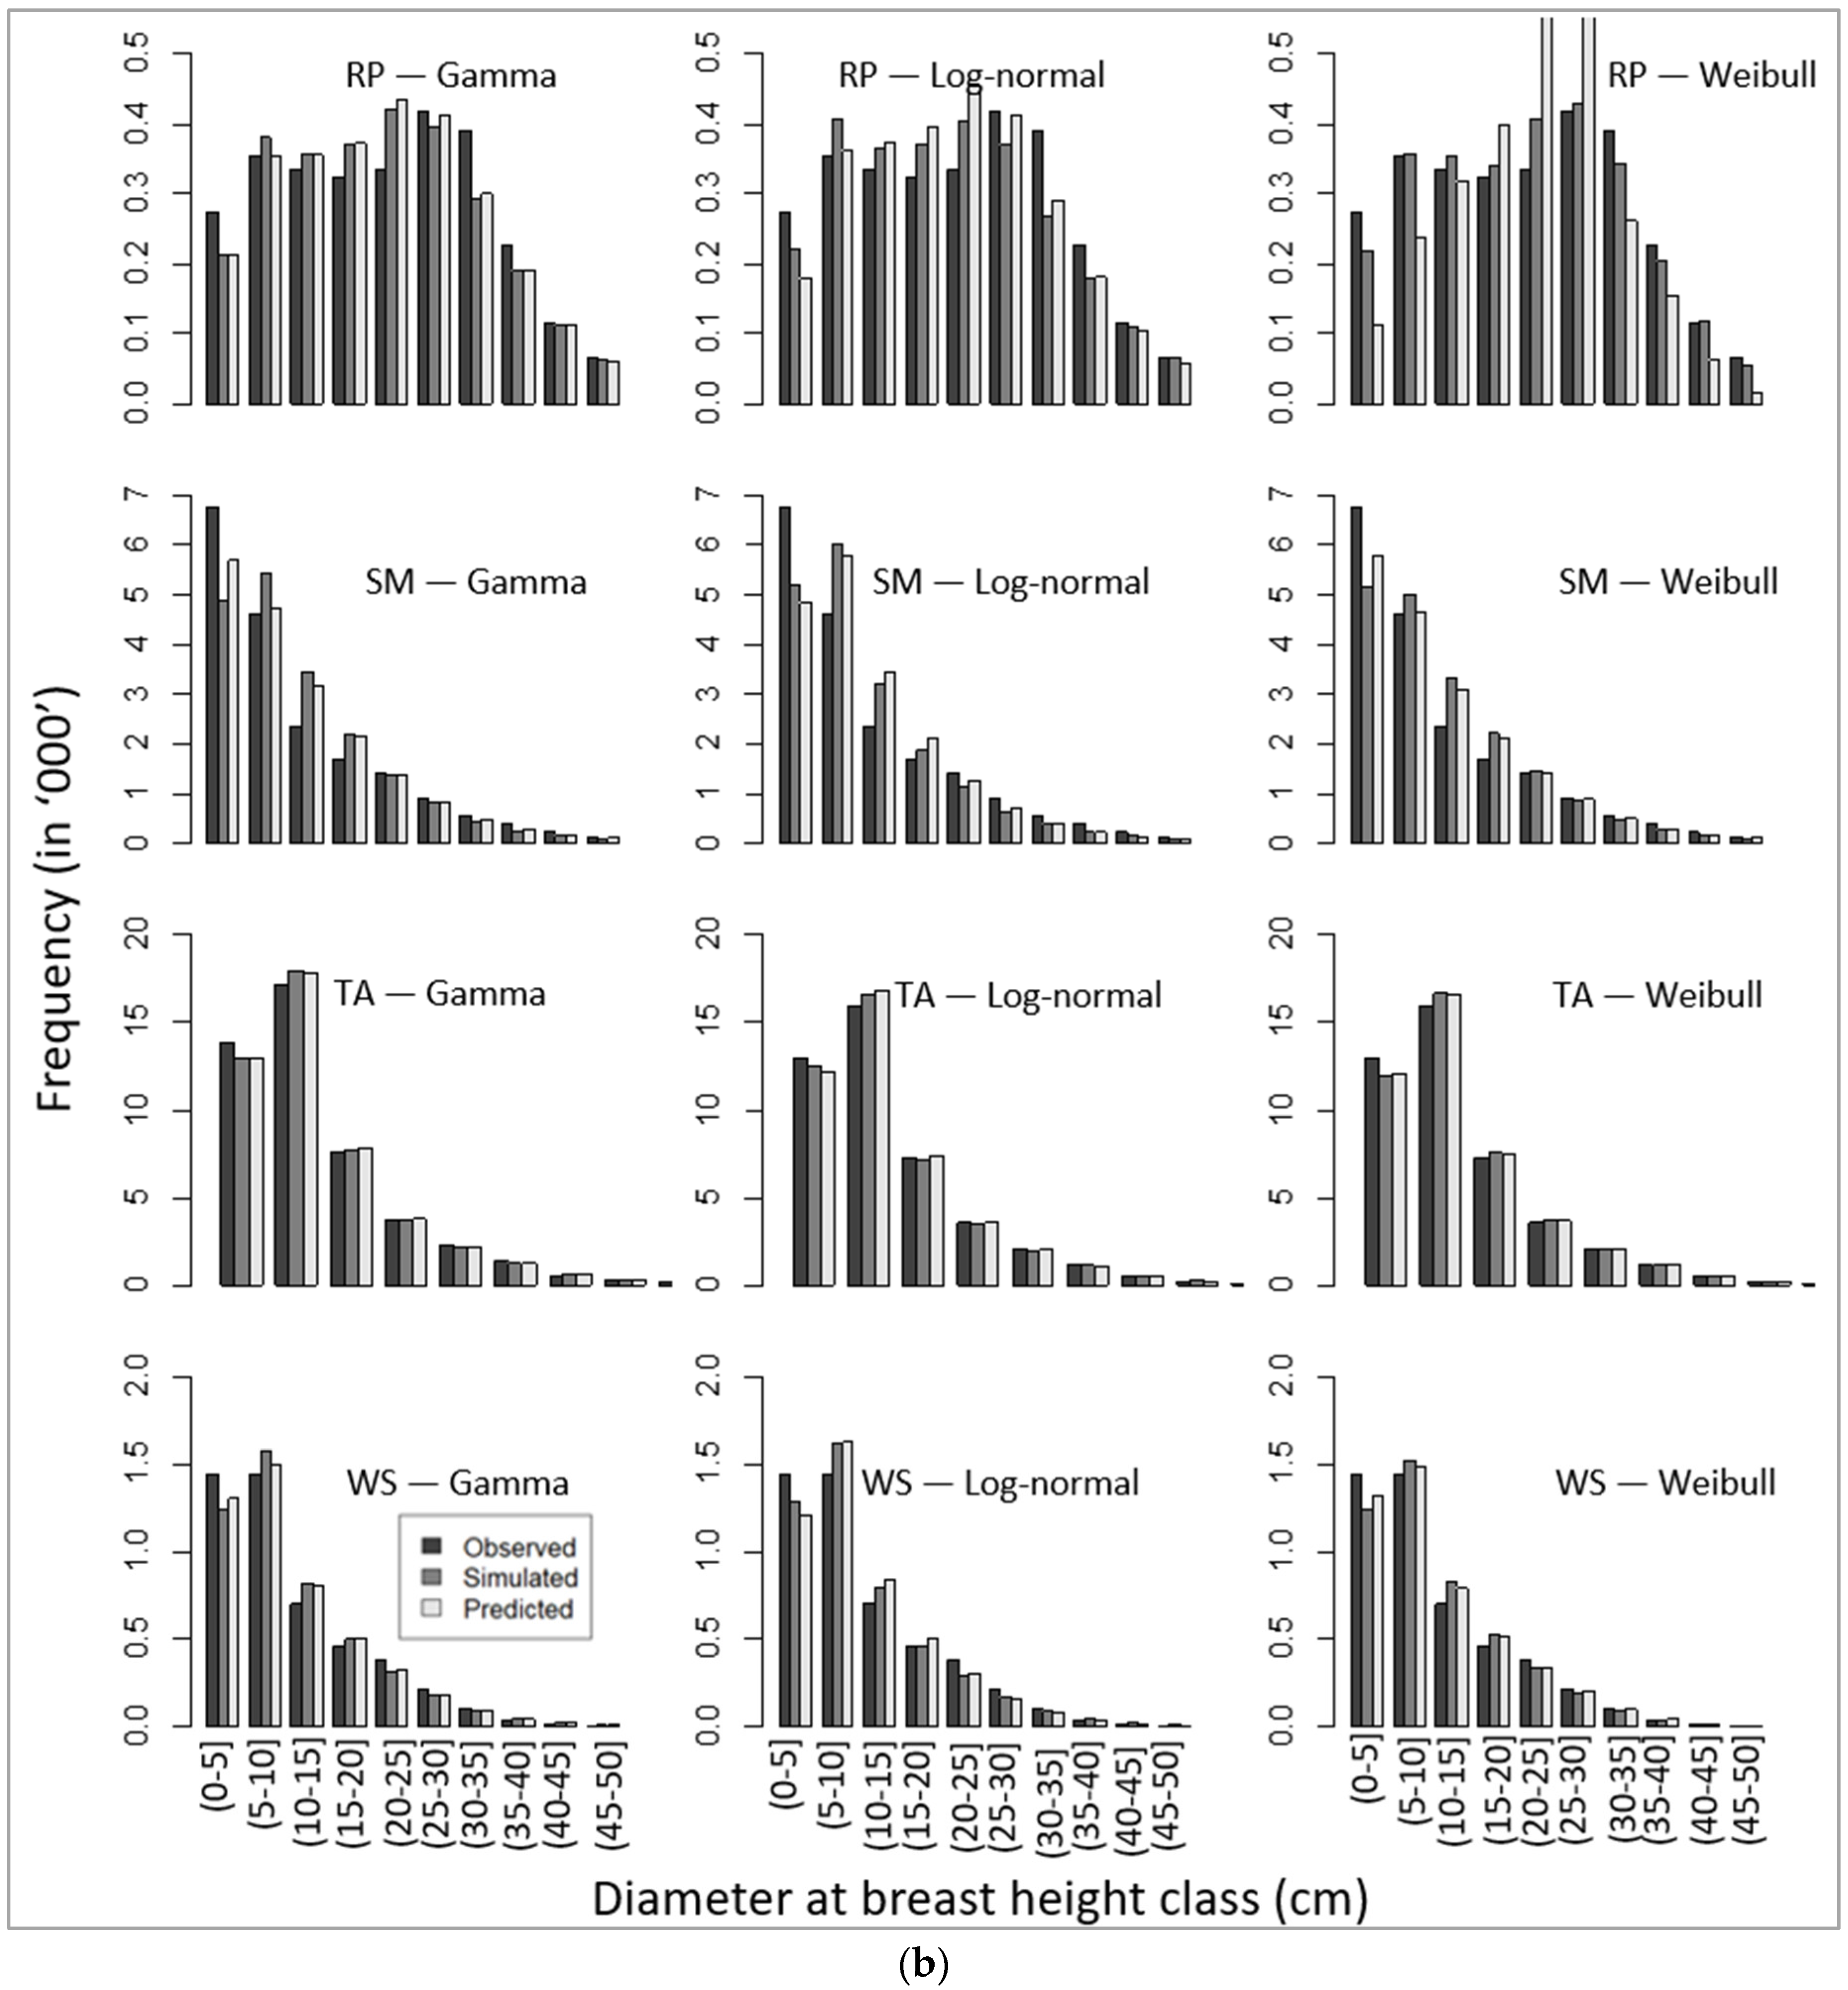
Corresponding to unbiased parameters (Table 8), our simulated DBH distributions applying the recovered parameters (using the parameter recovery technique) from the model-predicted mean and standard deviation (Equation (11)) also produced similar patterns of DBH class distribution, as presented in Figure 4a,b.
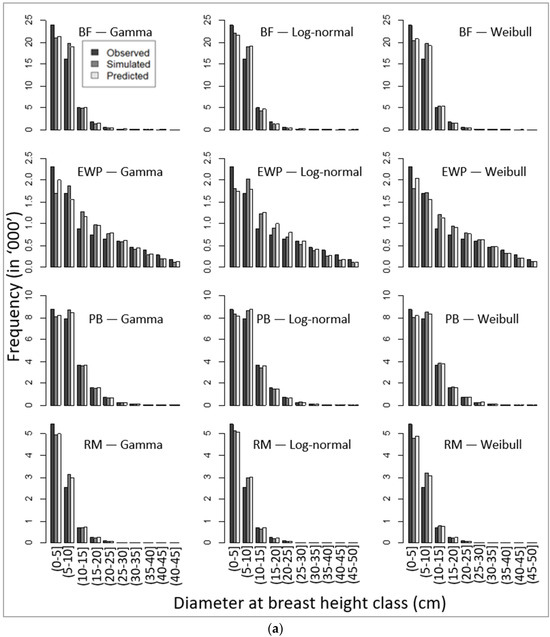

Figure 4.
Comparative presentation of stand-wise diameter at breast height class distribution among observed, simulated, and predicted values for four species, namely (a) balsam fir (BF), eastern white pine (EWP), paper birch (PB), and red maple (RM), and (b) red pine (RP), sugar maple (SM), trembling aspen (TA), and white spruce (WS).
4. Discussion
DBH is a uniquely important attribute in forest research and management planning. It can be measured or estimated at the individual tree level or at a stand level. For management and harvest schedule planning, stand-level attributes are needed. Although the measurement of individual tree DBHs is common, stand-level estimates may often be more precise than individual tree level measurements, due to higher chances of error accumulation [57]. On the other hand, stand-level DBH distribution can be used to reconstruct individual tree DBHs [30] or size class distributions [58].
Fitting DBH probability distributions and undertaking the reconstruction of distributions are not new techniques, but they are rarely used in practice and only for dominating species in localized geography [24,26]. Nonetheless, these still lack models for multiple species growing in mixed forests. We evaluated three commonly tested PDFs for eight commercial tree species in Ontario grown in natural mixed stands. The use of Weibull PDF for DBH distribution fitting is very common in a wide range of the literature [59], with a few studies reflecting comparative analyses among competing PDFs for different species globally, e.g., [60,61].
We compared three PDFs: Weibull, gamma, and log-normal. Log-normal is the simplest form of distribution, after negative exponential, to fit positive continuous random variables like DBH. Our preliminary analysis indicated that the one-parametric negative exponential did not fit at all for any species. But all three PDFs generally fit well for all species except red pine. Among these PDFs, log-normal fitted the best at the landscape and sample plot levels (Figure 2, Table 5) for all species. In a similar study, Rijal and Sharma [30] found that gamma PDF was the best among these three PDFs for two dominant species, jack pine and black spruce, which are also grown in Ontario. This difference could be because of the number of individual trees in the sample plots and the range of DBH. The less dominating eight species consisted of a lower number of trees within the sample plots, but the range of DBH was wider. This resulted in higher standard deviations and, hence, a longer right tail (Figure 3 and Figure 4) for these species, compared to the ones for jack pine and black spruce. Highly right-skewed data favor log-normal distribution, which is consistent with the previous works, e.g., [60,61].
We confined this study to the naturally grown forest stands. The DBH distribution of species in naturally grown forests features opposite J-shaped curves [62]. This characteristic reverse J-shape is approximately met based on the graphical presentation for all species, with a very high negative slope at the beginning of the curves (Figure 3). The DBH class distributions show a similar pattern for all species, except for trembling aspen and white spruce in the DBH class (0–5] and the DBH class up to (25–30] for red pine (Figure 4). A reason for such a lower density in the DBH class below five cm might have been attributed to the undercounting of seedlings and saplings. To our knowledge, there were no recent disturbances in the area. Nevertheless, the selected PDF could fit well for trembling aspen and white spruce. In the case of red pine, it seemed that there could have been more intensive forest management intervention in the recent decades that resulted roughly uniform distribution or may require multimodal PDF. The selected eight species were sub-dominant species after jack pine and black spruce in the study area. There could be a small number of individual trees that could escape from suppression, resulting in a DBH with a long right tail, which supports log-normal distribution.
The first part of this study examined two approaches to parameter estimations, namely maximum likelihood and parameter recovery methods for the selected three PDFs, but both require solving non-linear functions. The parameter recovery technique involves stand-level attributes [37], belonging to simple statistics, such as the mean, the standard deviation, a percentile of an array of the data, or the dominant diameter [22,26], among others. Among them, we used the mean and standard deviation, which are the simplest statistics and most common variables in forest management planning [3]. Using these variables in determining distribution functions worked well compared to the maximum likelihood method (Table 3 and Table 5, Figure 4). Mathematically, the maximum likelihood or moment-based methods (Equations (1)–(9)) are the same, and we should have the same results, provided there are no computational problems. Our results with the use of the selected three PDFs have demonstrated that DBH distribution can be simulated using any parametric PDFs for any range of DBHs for any species and can evaluate their performance from such simple statistics (mean and standard deviation).
From the perspective of forest management planning, our study would help the development of DBH distributions in response to various silvicultural treatments with the use of dynamic variables. The statistics of DBH change over time in response to various natural and anthropogenic disturbance factors. Consequently, either only the parameters of the PDF or the form of distribution may vary though time. More importantly, when there is intensive forest management, the growth trajectories of different species can vary substantially in a way that can be addressed with the use of simple statistics. Fitting regression models with dendrometric, geographic, and climatic variables in the second component of our work helped to update the parameters of PDF. Among the evaluated model covariates, the dendrometric variables could explain more than the selected geographic and climatic variables for most of the examined species. The parameters associated with geographic variables (longitude and latitude), as well as the annual mean and variability (standard deviation) of bioclimatic variables, were also significant for some species like balsam fir and eastern white pine when we fit of an array of DBH for eight species for mean and standard deviation (Table 7a-b). These results correspond to previous pieces of work that showed that geography and climate can substantially impact DBH growth [20,49]. When dendrometric variables have a strong relationship with the response variables, like DBH, the bioclimatic variables may come to be insignificant [32], even though these variables are always important in forest growth and development.
Stand dendrometric attributes like basal area, stem density, QMD, dominant height, and age are common as covariates in predictive modelling, e.g., [22,26,30,31]. Based on the data availability, we limited dendrometric covariates (Table 1), and the regression evaluations demonstrated that total and species-wise stand attributes, especially QMD, stem density, and basal area, were significant covariates for predicting the mean and standard deviation for the selected species, but showed different magnitudes and signs of parameters (Table 5). For example, total basal area as a model covariate had a negative parameter sign whenever it was significant for all species in regressions for DBH mean and standard deviation, except for the mean of trembling aspen. Stem density had a positive relationship with the DBH mean. Likewise, the QMD was positively related to the mean and the standard deviation. A reason for the opposite behaviors of the stem density and basal area could be due to the fact that the stands were dominated by small-sized trees [63]. Such a parametric relationship with the response variable, DBH mean, was consistent with an earlier study for two dominant species: black spruce and jack pine, in the same study area [32].
Our regression models for the DBH mean and standard deviation for eight species using various model covariates performed differently in terms of model performance statistics. In all cases, they yielded unbiased predictions. The magnitude of cross-validated other statistics, namely MAB and R2, varied by model for each species, but the median and 90 percentile range (confidence interval) values inferred that these models’ fit had precise predictions. However, there was a wide range of variations in R2, especially for the model of standard deviation. The model for the mean had a range of R2 between 0.76 and 0.91, whereas the values for the standard deviation were between zero and 0.46. The mean values are generally related linearly to the examined dendrometric covariates, resulting in a high R2. On the other hand, the standard deviation, a form of transformation of the DBH, is not linearly related to the model covariates, resulting in low R2 values despite seeing unbiased predictions.
The simulation of DBH distribution for multiple species is challenging for sub-dominating species because of their limited presence in various proportions or absence in many sample plots. There were more than 80 individual tree species listed. Modelling for all individual trees’ DBHs is neither desirable for increased complexity, nor do we achieve better estimates for very small number of sample trees. For better consistency of model parameters, we set a minimum threshold of five individual trees, and, even with this, we often encountered problems with convergence or inconsistent parameters and required several iterations for better results. Despite the possibility that other forms of PDF may still be better than ours for some species we covered, we had to limit ourselves to only these three PDFs. Nevertheless, there can be some extended avenue of improvement, leading to covering a wide spectrum by developing multi-modal distributions to capture the characteristics of the growth responses of different types of silvicultural operations in managed forests. For example, distribution fitting for red pine, in our case, may have warranted exploring multimodal PDFs, but we limited ourselves to unimodal PDFs for some resource constraints and because we hoped to keep this method operationally simple and feasible for other practitioners. A general model can be developed for minor species, in terms of their presence, by taking them together. A comparative study of the model parameters of individual trees and combined parameters for all minor species may help us to understand the species’ ecology and growth dynamics in the given forest stands. These parameters, more specific to general levels of PDF and regression fit, would help with selecting better silviculture systems for directing and maintaining forest growth and development trajectory, as desired by forest management planners and managers.
5. Conclusions
This study comprised a comparative analysis of three probability distribution functions for the individual tree diameters at breast height (DBHs) of eight sub-dominating tree species. Past studies have shown that the Weibull probability distribution function (PDF) is the best fit for dominant species, whereas our results indicated that log-normal PDF was the best fit for sub-dominant species. While several PDFs have been evaluated in research, only a few have been used in practice. The parameter estimation of individual PDFs using the mean and standard deviation can be simpler than the maximum likelihood method. Moreover, we illustrated that these simple statistics, mean and standard deviation, can be used simultaneously to estimate the parameters of three PDFs and to reconstruct DBH distributions using these PDFs. As all statistical PDFs are mathematically related to the mean and standard deviation, albeit with varying computation complexity, our study has opened an avenue of reconstruction and evaluation of any PDF using just the mean and standard deviation. Another advantage of the use of the mean is that it is usually modelled for many purposes. Our construction of predictive models using dynamic variables shows that we can fit dynamic probability distribution functions in response to forest management and or any type of forest growth or disturbances over time.
Author Contributions
Funding acquisition: M.S.; Conceptualization: B.R.; Methodology: B.R.; Software: B.R.; Data curation: B.R. and M.S.; Formal analysis: B.R.; Investigation: B.R. and M.S.; Project administration: M.S.; Resources: B.R. and M.S.; Supervision: M.S.; Validation: B.R. and M.S.; Visualization: B.R.; Writing—original draft: B.R.; Writing—review & editing: B.R. and M.S. All authors have read and agreed to the published version of the manuscript.
Funding
Ontario Ministry of Natural Resources and Forestry (MNRF).
Data Availability Statement
The experimental data used or analyzed in this study are not publicly available due to their ownership by the Government of Ontario, but may be available by reaching out to MS, a coauthor of this paper upon reasonable request and subject to a data-sharing agreement.
Acknowledgments
This study was supported by Ontario Ministry of Natural Resources and Forestry (MNRF). We thank Dan McKenny, of the Great Lake Forestry Centre, Ontario, for providing us with bioclimate data.
Conflicts of Interest
The authors of this article declare no conflicts of interest.
Appendix A
Table A1.
Estimated parameters of species-wise regression equation for the DBH mean.
Table A1.
Estimated parameters of species-wise regression equation for the DBH mean.
| Variable | Estimate | Std. Error | z Value | p Value |
|---|---|---|---|---|
| Balsam fir (BF) | ||||
| log (Density Total) | 0.029 | 0.005 | 6.318 | 0.000 |
| QMD Species | 0.114 | 0.001 | 137.195 | 0.000 |
| Longitude | 0.007 | 0.001 | 5.247 | 0.000 |
| Latitude | 0.040 | 0.006 | 6.240 | 0.000 |
| Temperature Mean | 0.068 | 0.016 | 4.350 | 0.000 |
| No. of Growing Days Mean | −0.005 | 0.001 | −3.504 | 0.000 |
| Precipitation SD | 0.000 | 0.000 | −2.276 | 0.023 |
| No. of Growing Days SD | 0.013 | 0.005 | 2.550 | 0.011 |
| Eastern white pine (EWP) | ||||
| log (Density Total) | 0.075 | 0.018 | 4.104 | 0.000 |
| log(Density Species + 1) | 0.000 | 0.000 | −4.947 | 0.000 |
| log (QMD Total) | 0.177 | 0.035 | 4.986 | 0.000 |
| QMD Species | 0.051 | 0.001 | 50.785 | 0.000 |
| Longitude | 0.057 | 0.014 | 3.997 | 0.000 |
| Temperature Mean | 0.083 | 0.019 | 4.371 | 0.000 |
| Moisture Index Mean | 0.208 | 0.059 | 3.504 | 0.000 |
| Precipitation SD | 0.008 | 0.002 | 4.934 | 0.000 |
| Temperature SD | 3.763 | 1.083 | 3.474 | 0.001 |
| Paper birch (PB) | ||||
| BAPH Total | −0.002 | 0.000 | −4.902 | 0.000 |
| log (Density Total) | 0.073 | 0.003 | 24.776 | 0.000 |
| log(Density Species + 1) | 0.000 | 0.000 | 4.188 | 0.000 |
| log (QMD Total) | 0.271 | 0.012 | 22.529 | 0.000 |
| QMD Species | 0.090 | 0.001 | 91.304 | 0.000 |
| Red maple (RM) | ||||
| BAPH Total | −0.004 | 0.001 | −4.595 | 0.000 |
| log (Density Total) | 0.082 | 0.008 | 9.957 | 0.000 |
| log(Density Species + 1) | 0.000 | 0.000 | 1.908 | 0.056 |
| Dominant Height | 0.004 | 0.002 | 1.693 | 0.090 |
| log (QMD Total) | 0.181 | 0.027 | 6.705 | 0.000 |
| QMD Species | 0.100 | 0.003 | 39.759 | 0.000 |
| Red pine (RP) | ||||
| BAPH Total | −0.012 | 0.001 | −8.280 | 0.000 |
| BAPH Species | 0.010 | 0.001 | 7.505 | 0.000 |
| log (Density Total) | 0.245 | 0.021 | 11.531 | 0.000 |
| log(Density Species + 1) | 0.000 | 0.000 | −9.260 | 0.000 |
| log (QMD Total) | 0.740 | 0.049 | 15.031 | 0.000 |
| QMD Species | 0.035 | 0.002 | 21.121 | 0.000 |
| Longitude | 0.019 | 0.003 | 5.790 | 0.000 |
| Precipitation SD | 0.004 | 0.001 | 2.740 | 0.006 |
| Sugar maple (SM) | ||||
| BAPH Total | −0.008 | 0.001 | −7.476 | 0.000 |
| log (Density Total) | 0.056 | 0.020 | 2.729 | 0.006 |
| log (QMD Total) | 0.281 | 0.045 | 6.289 | 0.000 |
| QMD Species | 0.064 | 0.001 | 46.395 | 0.000 |
| No. of Growing Days Mean | 0.003 | 0.001 | 2.097 | 0.036 |
| Trembling aspen (TA) | ||||
| BAPH Species | 0.004 | 0.001 | 4.485 | 0.000 |
| log (Density Total) | 0.093 | 0.009 | 10.633 | 0.000 |
| log(Density Species + 1) | 0.000 | 0.000 | −2.760 | 0.006 |
| log (QMD Total) | 0.412 | 0.021 | 19.367 | 0.000 |
| QMD Species | 0.055 | 0.001 | 50.896 | 0.000 |
| Temperature Mean | 0.022 | 0.007 | 3.222 | 0.001 |
| Temperature SD | 0.407 | 0.084 | 4.836 | 0.000 |
| No. of Growing Days SD | −0.050 | 0.009 | −5.289 | 0.000 |
| White spruce (WS) | ||||
| BAPH Species | −0.010 | 0.003 | −3.829 | 0.000 |
| log (Density Total) | 0.074 | 0.010 | 7.195 | 0.000 |
| log(Density Species + 1) | 0.050 | 0.016 | 3.113 | 0.002 |
| Dominant Height | 0.004 | 0.002 | 2.451 | 0.014 |
| log (QMD Total) | 0.162 | 0.022 | 7.433 | 0.000 |
| QMD Species | 0.080 | 0.002 | 41.674 | 0.000 |
Table A2.
Estimated parameters of species-wise regression equation for the DBH standard deviation.
Table A2.
Estimated parameters of species-wise regression equation for the DBH standard deviation.
| Variable | Estimate | Std. Error | z Value | p Value |
|---|---|---|---|---|
| Balsam fir (BF) | ||||
| BAPH Species | −0.021 | 0.005 | −4.392 | 0.000 |
| log(Density Species + 1) | 0.000 | 0.000 | 5.699 | 0.000 |
| Dominant Height | 0.004 | 0.002 | 1.763 | 0.078 |
| QMD Species | 0.174 | 0.005 | 33.606 | 0.000 |
| Latitude | −0.017 | 0.005 | −3.650 | 0.000 |
| Temperature Mean | −0.033 | 0.010 | −3.396 | 0.001 |
| Moisture Index Mean | 0.126 | 0.049 | 2.589 | 0.010 |
| Eastern white pine (EWP) | ||||
| Intercept | −14.257 | 2.176 | −6.552 | 0.000 |
| BAPH Total | −0.021 | 0.005 | −4.595 | 0.000 |
| log (Density Total) | 0.761 | 0.116 | 6.580 | 0.000 |
| log (QMD Total) | 1.404 | 0.235 | 5.976 | 0.000 |
| QMD Species | 0.028 | 0.003 | 11.238 | 0.000 |
| No. of Growing Days Mean | 0.022 | 0.005 | 4.823 | 0.000 |
| Temperature SD | 3.219 | 0.937 | 3.436 | 0.001 |
| Paper birch (PB) | ||||
| BAPH Total | −0.009 | 0.003 | −3.653 | 0.000 |
| BAPH Species | −0.023 | 0.006 | −3.569 | 0.000 |
| log (Density Total) | 0.162 | 0.040 | 4.034 | 0.000 |
| log(Density Species + 1) | 0.000 | 0.000 | 3.670 | 0.000 |
| Dominant Height | −0.008 | 0.004 | −1.870 | 0.062 |
| log (QMD Total) | 0.679 | 0.088 | 7.724 | 0.000 |
| QMD Species | 0.105 | 0.005 | 19.696 | 0.000 |
| No. of Growing Days Mean | −0.008 | 0.002 | −4.589 | 0.000 |
| Moisture Index Mean | −0.233 | 0.076 | −3.087 | 0.002 |
| Red maple (RM) | ||||
| Intercept | 19.675 | 6.678 | 2.946 | 0.003 |
| log(Density Species + 1) | 0.071 | 0.032 | 2.246 | 0.025 |
| log (QMD Total) | 0.272 | 0.091 | 2.985 | 0.003 |
| QMD Species | 0.133 | 0.007 | 19.387 | 0.000 |
| Longitude | −0.045 | 0.022 | −1.998 | 0.046 |
| Latitude | −0.464 | 0.162 | −2.863 | 0.004 |
| Elevation | −0.003 | 0.001 | −3.705 | 0.000 |
| Temperature Mean | −0.482 | 0.139 | −3.467 | 0.001 |
| Red pine (RP) | ||||
| BAPH Total | −0.023 | 0.006 | −4.094 | 0.000 |
| log (Density Total) | 0.986 | 0.114 | 8.621 | 0.000 |
| log(Density Species + 1) | −0.134 | 0.055 | −2.442 | 0.015 |
| log (QMD Total) | 1.769 | 0.221 | 8.007 | 0.000 |
| Latitude | −0.184 | 0.027 | −6.802 | 0.000 |
| Sugar maple (SM) | ||||
| Intercept | −5.088 | 3.687 | −1.380 | 0.168 |
| log(Density Species + 1) | 0.000 | 0.000 | 5.885 | 0.000 |
| log (QMD Total) | −0.235 | 0.082 | −2.867 | 0.004 |
| QMD Species | 0.084 | 0.004 | 22.554 | 0.000 |
| Latitude | 0.227 | 0.088 | 2.589 | 0.010 |
| Precipitation Mean | 0.001 | 0.000 | 2.307 | 0.021 |
| Temperature Mean | 0.550 | 0.166 | 3.301 | 0.001 |
| No. of Growing Days Mean | −0.038 | 0.012 | −3.191 | 0.001 |
| Trembling aspen (TA) | ||||
| Intercept | −5.140 | 0.887 | −5.795 | 0.000 |
| BAPH Total | −0.018 | 0.004 | −4.906 | 0.000 |
| log (Density Total) | 0.485 | 0.070 | 6.970 | 0.000 |
| Dominant Height | 0.011 | 0.004 | 2.571 | 0.010 |
| log (QMD Total) | 1.090 | 0.134 | 8.142 | 0.000 |
| QMD Species | 0.046 | 0.003 | 14.717 | 0.000 |
| Precipitation SD | −0.003 | 0.001 | −2.324 | 0.020 |
| Temperature SD | 0.816 | 0.299 | 2.732 | 0.006 |
| No. of Growing Days SD | −0.077 | 0.032 | −2.398 | 0.016 |
| White spruce (WS) | ||||
| Intercept | −1.867 | 0.831 | −2.245 | 0.025 |
| BAPH Species | −0.049 | 0.008 | −5.990 | 0.000 |
| log (Density Total) | 0.258 | 0.059 | 4.416 | 0.000 |
| log(Density Species + 1) | 0.144 | 0.048 | 3.002 | 0.003 |
| log (QMD Total) | 0.323 | 0.109 | 2.964 | 0.003 |
| QMD Species | 0.120 | 0.006 | 20.941 | 0.000 |
| Temperature SD | −1.508 | 0.393 | −3.834 | 0.000 |
References
- Hara, T.; Kimura, M.; Kikuzawa, K. Growth patterns of tree height and stem diameter in populations of Abies veitchii, A. mariesii and Betula ermanii. J. Ecol. 1991, 79, 1085–1098. [Google Scholar] [CrossRef]
- Sterck, F.J.; Bongers, F. Ontogenetic changes in size, allometry, and mechanical design of tropical rain forest trees. Am. J. Bot. 1998, 85, 266–272. [Google Scholar] [CrossRef]
- Burkhart, H.E.; Tomé, M. Modeling Forest Trees and Stands; Springer Science & Business Media: Berlin, Germany, 2012; 458p. [Google Scholar]
- Crookston, N.L.; Dixon, G.E. The forest vegetation simulator: A review of its applications, structure, and content. Comput. Electron. Agric. 2005, 49, 60–80. [Google Scholar] [CrossRef]
- Johnson, K.; Comeau, P.; Bokalo, M. Best Practices for Using the Mixedwood Growth Model (MGM21–VS8. 2.21. 39/Rev6378). 2022. Available online: https://mgm.ualberta.ca/wp-content/uploads/sites/60/2022/02/MGM21_Best_Practices_Feb_28_22.pdf (accessed on 2 January 2023).
- Pothier, D.; Auger, I. NATURA-2009: Un Modèle de Prévision de la Croissance à l’échelle du Peuplement Pour les Forêts du Québec; Ministère des Ressources Naturelles et de la Faune, Direction de la Recherche Forestière: Quebec, QC, Canada, 2011. [Google Scholar]
- Mitchell, K.J.; Stone, M.S.E.; Grout, M.; Di Lucca Nigh, G.D.; Goudie, J.W.; Stone, J.N.; Nussbaum, A.J.; Yanchuk, A.; Stearns-Smith, S.; Brockley, R. TIPSY Version 3.2 [Online]; Ministry of Forests and Range, Research Branch: Victoria, BC, Canada, 2004. Available online: http://www.for.gov.bc.ca/hre/software/tipsy3.htm (accessed on 15 December 2023).
- Siitonen, M. Experiences in the use of forest management planning models. Silva Fenn. 1993, 27, 167–178. [Google Scholar] [CrossRef]
- Avery, T.E.; Burkhart, H.E. Forest Measurements, 5th ed.; Waveland Press, Inc.: Long Grove, IL, USA, 2015; p. 456. [Google Scholar]
- Drew, T.J.; Flewelling, J.W. Some recent Japanese theories of yield density relationships and their application to Monterey pine plantations. For. Sci. 1977, 23, 517–534. [Google Scholar]
- Flewelling, J.W.; Wiley, K.N.; Drew, T.J. Stand Density Management in Western Hemlock; Weyerhaeuser Corporation: Vancouver, BC, Canada; Western Forestry Research Centre: Vancouver, BC, Canada, 1980. [Google Scholar]
- Gingrich, S.F. Measuring and evaluating stocking and stand density in upland hardwood forests in the Central States. For. Sci. 1967, 13, 38–53. [Google Scholar]
- Larsen, D.R.; Dey, D.C.; Faust, T. A stocking diagram for midwestern eastern cottonwood-silver maple-American sycamore bottomland forests. N. J. Appl. For. 2010, 27, 132–139. [Google Scholar] [CrossRef]
- Eriksson, S.; Hammer, M. The challenge of combining timber production and biodiversity conservation for long-term ecosystem functioning—A case study of Swedish boreal forestry. For. Ecol. Manag. 2006, 237, 208–217. [Google Scholar] [CrossRef]
- Oliver, C.D.; Larson, B.C. Forest Stand Dynamics: Updated Edition; John Wiley and Sons: Hoboken, NJ, USA, 1996. [Google Scholar]
- Hunter Jr, M.L. Natural fire regimes as spatial models for managing boreal forests. Biol. Conserv. 1993, 65, 115–120. [Google Scholar] [CrossRef]
- Harvey, B.D.; Leduc, A.; Gauthier, S.; Bergeron, Y. Stand-landscape integration in natural disturbance-based management of the southern boreal forest. For. Ecol. Manag. 2002, 155, 369–385. [Google Scholar] [CrossRef]
- Grondin, P.; Noël, J.; Hotte, D. Raréfaction de L’épinette Blanche dans la Sapinière de la Forêt Boréale; Grondin et, P., Cimon, A., Eds.; Les Enjeux de Biodiversité Relatifs à la Composition Forestière; Ministère des Ressources Naturelles, de la Faune et des Parcs, Direction de la Recherche Forestière et Direction de l’Environnement Forestier: Quebec, QC, Canada, 2003; pp. 67–84. Available online: https://diffusion.mern.gouv.qc.ca/public/Biblio/Mono/2011/08/1086366.pdf (accessed on 2 January 2023).
- Pretzsch, H.; Zenner, E.K. Toward managing mixed species stands: From parametrization to prescription. For. Ecosyst. 2017, 4, 19. [Google Scholar] [CrossRef]
- Sharma, M. Modelling climate effects on diameter growth of red pine trees in boreal Ontario, Canada. Trees For. People 2021, 4, 100064. [Google Scholar] [CrossRef]
- Latterini, F.; Pawlik, L.; Stefanoni, W.; Dyderski, M.K. The effects of geomorphology, soil and climate on the trajectory of aboveground biomass accumulation of beech (Fagus sylvatica L.) at the southern range margin. Catena 2024, 237, 107787. [Google Scholar] [CrossRef]
- Liu, C.; Zhang, S.Y.; Lei, Y.; Newton, P.F.; Zhang, L. Evaluation of three methods for predicting diameter distributions of black spruce (Picea mariana) plantations in central Canada. Can. J. For. Res. 2004, 34, 2424–2432. [Google Scholar] [CrossRef]
- Liu, C.; Beaulieu, J.; Pregent, G.; Zhang, S.Y. Applications and comparison of six methods for predicting parameters of the Weibull function in unthinned Picea glauca plantations. Scand. J. For. Res. 2009, 24, 67–75. [Google Scholar] [CrossRef]
- Duchateau, E.; Schneider, R.; Tremblay, S.; Dupont-Leduc, L. Density and diameter distributions of saplings in naturally regenerated and planted coniferous stands in Québec after various approaches of commercial thinning. Ann. For. Sci. 2020, 77, 38. [Google Scholar] [CrossRef]
- Hyink, D.M.; Moser, J.W. A generalized framework for projecting forest yield and stand structure using diameter distributions. For. Sci. 1983, 29, 85–95. [Google Scholar]
- Mauro, F.; García-Abril, A.; Ayuga-Téllez, E.; Rojo-Alboreca, A.; Valbuena, R.; Manzanera, J.A. Comparison of two parameter recovery methods for the transformation of Pinus sylvestris yield tables into a diameter distribution model. Ann. For. Sci. 2021, 78, 12. [Google Scholar] [CrossRef]
- [OMNR] Ontario Ministry of Natural Resources. Forest Resources of Ontario 2006: State of the Forest Report 2006; Ontario Ministry of Natural Resources, Queen’s Printer: Ontario, ON, Canada, 2006; 159p. [Google Scholar]
- Morris, D.M.; Reid, D.E.; Kwiaton, M.; Hunt, S.L.; Gordon, A.M. Comparing growth patterns of jack pine and black spruce in mixed natural stands and plantations. Ecoscience 2014, 21, 1–10. [Google Scholar] [CrossRef]
- Sharma, M.; Reid, D.E. Stand height/site index equations for jack pine and black spruce trees grown in natural stands. For. Sci. 2017, 64, 33–40. [Google Scholar] [CrossRef]
- Newton, P.F.; Lei, Y.; Zhang, S.Y. Stand-level diameter distribution yield model for black spruce plantations. For. Ecol. Manag. 2005, 209, 181–192. [Google Scholar] [CrossRef]
- Newton, P.F.; Amponsah, I.G. Evaluation of Weibull-based parameter prediction equation systems for black spruce and jack pine stand types within the context of developing structural stand density management diagrams. Can. J. For. Res. 2005, 35, 2996–3010. [Google Scholar] [CrossRef]
- Rijal, B.; Sharma, M. Modelling diameter at breast height distribution of jack pine and black spruce natural stands in eastern Canada. Can. J. For. Res. 2023, 54, 5. [Google Scholar] [CrossRef]
- Baldwin, D.J.B.; Desloges, J.R.; Band, L.E. Physical geography of Ontario. In Ecology of a Managed Terrestrial Landscape: Patterns and Processes of Forest Landscapes in Ontario; Perera, A.H., Euler, D.L., Thompson, I.D., Eds.; University of British Columbia Press: Vancouver, BC, Canada, 2000; pp. 12–29. 336p. [Google Scholar]
- Thompson, I.D. Forest Vegetation of Ontario: Factors Influencing Landscape Change. In Ecology of a Managed Terrestrial Landscape: Patterns and Processes of Forest Landscapes in Ontario; Perera, A.H., Euler, D.L., Thompson, I.D., Eds.; UBC Press: Vancouver, BC, Canada, 2000; pp. 30–53+336. [Google Scholar]
- Rowe, J.S. Forest Regions of Canada. Canadian Forestry Service Publication 1300; Department of Environment: Ottawa, ON, Canada, 1972; 172p.
- [OMNR] Ontario Ministry of Natural Resources and Forestry Growth and Yield Program. PSP and PGP Reference Manual; Sault Ste.: Marie, ON, Canada, 2016; 677p. [Google Scholar]
- Strub, M.R.; Burkhart, H.E. A class-interval-free method for obtaining expected yields from diameter distributions. For. Sci. 1975, 21, 67–69. [Google Scholar]
- Zhang, L.; Packard, K.C.; Liu, C. A comparison of estimation methods for Fitting Weibull and Johnson’s SB distributions to mixed spruce–fir stands in northeastern North America. Can. J. For. Res. 2003, 33, 1340–1347. [Google Scholar] [CrossRef]
- Bliss, C.I.; Reinker, K.A. A lognormal approach to diameter distributions in even-aged stands. For. Sci. 1964, 10, 350–360. [Google Scholar]
- Nelson, T.C. Diameter distribution and growth of loblolly pine. For. Sci. 1964, 10, 105–114. [Google Scholar]
- Bailey, R.L.; Dell, T.R. Quantifying diameter distributions with the Weibull function. For. Sci. 1973, 19, 97–104. [Google Scholar]
- Cao, Q.V. Predicting parameters of a Weibull function for modeling diameter distribution. For. Sci. 2004, 50, 682–685. [Google Scholar] [CrossRef]
- Poudel, K.P.; Cao, Q.V. Evaluation of methods to predict Weibull parameters for characterizing diameter distributions. For. Sci. 2013, 59, 243–252. [Google Scholar] [CrossRef]
- Gorgoso-Varela, J.J.; Adedapo, S.M.; Ogana, F.N. A Comparison of Probability Density Functions Fitted by Moments and Maximum Likelihood Estimation Methods Used for Diameter Distribution Estimation. Forests 2024, 15, 425. [Google Scholar] [CrossRef]
- Paradis, G.; Lebel, L. Diameter Distribution Models for Quebec, Canada; CIRRELT, Centre interuniversitaire de recherche sur les réseaux d’entreprise, la logistique et le transport; Interuniversity Research Centre on Enterprise Networks, Logistics and Transportation: Quebec, QC, Canada, 2017. [Google Scholar]
- Delignette-Muller, M.L.; Dutang, C. Fitdistrplus: An R package for fitting distributions. J. Stat. Softw. 2015, 64, 1–34. [Google Scholar] [CrossRef]
- R Core Team. R: A Language and Environment for Statistical Computing; R Foundation for Statistical Computing: Vienna, Austria, 2020; Available online: https://www.R-project.org/ (accessed on 7 August 2023).
- Hasselman, B. Nleqslv: Solve Systems of Nonlinear Equations_R Package, Version 3.3.4; R Foundation for Statistical Computing: Vienna, Austria, 2023.
- Subedi, N.; Sharma, M. Climate-diameter growth relationships of black spruce and jack pine trees in boreal Ontario. Canada. Glob. Change Biol. 2013, 19, 505–516. [Google Scholar] [CrossRef]
- McCullagh, P.; Nelder, J.A. Generalized Linear Models, 2nd ed.; Chapman & Hall/CRC Press: Boca Raton, FL, USA, 1989. [Google Scholar]
- Schwarz, G. Estimating the dimension of a model. Ann. Stat. 1978, 6, 461–464. [Google Scholar] [CrossRef]
- O’Brien, R.M. A caution regarding rules of thumb for variance inflation factors. Qual. Quant. 2007, 41, 673–690. [Google Scholar] [CrossRef]
- Belsley, D.A.; Kuh, E.; Welsch, R.E. Regression Diagnostics: Identifying Influential Data and Sources of Collinearity; John Wiley & Sons: Hoboken, NJ, USA, 2005; Volume 571. [Google Scholar]
- Brooks, M.E.; Kristensen, K.; van Benthem, K.J.; Magnusson, A.; Berg, C.W.; Nielsen, A.; Skaug, H.J.; Maechler, M.L.; Bolker, B.M. glmmTMB Balances Speed and Flexibility Among Packages for Zero-inflated Generalized Linear Mixed Modeling. R. J. 2017, 9, 378–400. [Google Scholar] [CrossRef]
- Stone, M. Cross-validatory choice and assessment of statistical predictions. J. R. Stat. Soc. Ser. B (Methodol.) 1974, 36, 111–133. [Google Scholar] [CrossRef]
- Yadav, S.; Shukla, S. Analysis of k-fold cross-validation over hold-out validation on colossal datasets for quality classification. In Proceedings of the 2016 IEEE 6th International Conference on Advanced Computing (IACC), Bhimavaram, India, 27–28 February 2016; pp. 78–83. [Google Scholar]
- Weiskittel, A.R.; Hann, D.W.; Kershaw, J.A., Jr.; Vanclay, J.K. Forest Growth and Yield Modelling; John Wiley & Sons, Ltd.: Chichester, UK, 2011. [Google Scholar]
- Qin, J.; Cao, Q.V. Using disaggregation to link individual-tree and whole-stand growth models. Can. J. For. Res. 2006, 36, 953–960. [Google Scholar] [CrossRef]
- Maltamo, M.; Eerikäinen, K.; Pitkänen, J.; Hyyppä, J.; Vehmas, M. Estimation of timber volume and stem density based on scanning laser altimetry and expected tree size distribution functions. Remote Sens. Environ. 2004, 90, 319–330. [Google Scholar] [CrossRef]
- Sheykholeslami, A.; Pasha, K.; Lashaki, K. A study of tree distribution in diameter classes in natural forests of Iran (case study: Liresara forest). Ann. Biol. Res. 2011, 2, 283–290. [Google Scholar]
- Ibrahim, A.D. Evaluation of probability distribution functions for modeling forest tree diameters on agricultural landscapes in Ogun State, Nigeria. Open J. For. 2022, 12, 432–442. [Google Scholar] [CrossRef]
- Rouvinen, S.; Kuuluvainen, T. Tree diameter distributions in natural and managed old Pinus sylvestris-dominated forests. For. Ecol. Manag. 2005, 208, 45–61. [Google Scholar] [CrossRef]
- Rijal, B.; Power, H.; Auger, I.; Guillemette, F.; Bedard, S.; Schneider, R. Development of tree recruitment models for 10 species groups in the sugar maple-dominated mixed forests of eastern Canada. Can. J. For. Res. 2023, 53, 134–150. [Google Scholar] [CrossRef]

Disclaimer/Publisher’s Note: The statements, opinions and data contained in all publications are solely those of the individual author(s) and contributor(s) and not of MDPI and/or the editor(s). MDPI and/or the editor(s) disclaim responsibility for any injury to people or property resulting from any ideas, methods, instructions or products referred to in the content. |
© 2024 by the authors. Licensee MDPI, Basel, Switzerland. This article is an open access article distributed under the terms and conditions of the Creative Commons Attribution (CC BY) license (https://creativecommons.org/licenses/by/4.0/).