Article

Prediction of Potential Suitable Distribution of Liriodendron chinense (Hemsl.) Sarg. in China Based on Future Climate Change Using the Optimized MaxEnt Model

Department of Landscape Architecture, College of Architecture, Tianjin University, Tianjin 300072, China
*
Author to whom correspondence should be addressed.
Forests 2024, 15(6), 988; https://doi.org/10.3390/f15060988
Submission received: 11 April 2024 / Revised: 22 May 2024 / Accepted: 30 May 2024 / Published: 5 June 2024
(This article belongs to the Section Forest Meteorology and Climate Change)

Abstract

:
Liriodendron chinense (Hemsl.) Sarg. (Magnoliales: Magnoliaceae), valued for its medicinal properties and timber and as an ornamental plant, is now classified as an endangered species. Investigating how future climate-change scenarios might affect the potential geographic distribution of L. chinense will provide a crucial scientific basis for its protection and management strategies. The MaxEnt model was calibrated using the ENMeval optimization package, and then it was coupled with ArcGIS 10.8 to forecast the possible distribution areas of L. chinense in China, utilizing elevation data, bioclimatic factors, and human footprint as environmental variables. The results indicate: (1) The optimal model parameters were set as follows: FC = LQ, RM = 0.5, the MaxEnt model demonstrated high predictive accuracy and minimal overfitting; (2) The total suitable habitat area for the potential geographical distribution of L. chinense during the current period is estimated at 151.55 × 10⁴ km2, predominantly located in central, eastern, and southwestern regions of China; (3) The minimum temperature of the coldest month (bio6), precipitation of the driest month (bio14), precipitation of the driest quarter (bio17), precipitation of the warmest quarter (bio18), elevation (alt), and human footprint (hf) are the main environmental variables determining the suitable habitat distribution of L. chinense; (4) During the period from 2041 to 2060, under the carbon emission scenarios of SSP126, SSP245, and SSP370, the suitable habitat for L. chinense shows varying degrees of increase compared to the current period. However, under the highest concentration scenario of SSP585, the suitable habitat area decreases to some extent; (5) The distribution of L. chinense is likely to move towards higher latitudes and elevations in the future due to changes in the climate. This research provides a comprehensive analysis of the potential impacts of climate change on L. chinense, offering valuable information for its protection and management under future climatic conditions.

1. Introduction

According to the Intergovernmental Panel on Climate Change’s Sixth Assessment Report (IPCC AR6), the global average surface temperature from 2011 to 2020 was 1.09 °C higher than that from 1850 to 1900 [1]. In terms of global warming, the rate of warming in China over the past century has slightly surpassed the global average [2]. Climate change is identified as a pivotal driver of accelerated biodiversity loss across both regional and global scales [3]. Changes in rainfall patterns and rising temperatures have impacted the health of American Populus forests and resulted in a decline in their population numbers [4]. The rising temperatures and shifts in precipitation patterns, as a consequence of climate change, extend beyond influencing plant growth and development; they are likely to profoundly affect the geographic distribution and population sizes of various species [5,6]. Plants are inclined to recalibrate their ecological distributions, notably migrating to higher latitudes or elevations in search of optimal survival conditions to evade the threat of extinction [7,8]. Meanwhile, human activities of varying scopes, modes, and intensities have shaped diverse land use types, directly impacting the distribution and diversity of plants [9]. Investigating the adaptive responses of plants to climate change, along with their potential habitat distributions under diverse carbon emission scenarios over varying time frames, enriches our comprehension of the dynamics driving shifts in plants’ viable habitats [10]. This knowledge empowers researchers and decision-makers to devise and implement more effective strategies for mitigation and preservation.
Species Distribution Models (SDMs) serve as crucial tools for examining the impact of environmental changes on the suitable habitats of species [11,12]. Currently, models used to study the suitability of species distribution include the Bioclimatic Prediction System (BIOCLIM), Artificial Neural Networks (ANN), Support Vector Machines (SVM), Gower Distance-Based Domain Mode (Domain), Environmental Distance (ED), Climatic Envelope (CE), Genetic Algorithm for Rule-set Prediction (GARP) and the Maximum Entropy Algorithm (MaxEnt) [13,14]. Wang et al. [15] compared the predictive accuracy of four SDMs—GARP, Bioclim, Domain, and MaxEnt—for predicting the potential habitat of Pseudolarix amabilis. The results indicated that MaxEnt had the highest predictive accuracy and provided the most objective predictions. Ashraf et al. [16] employed seven SDMs (MaxEnt, GARP, BIOCLIM, ANN, SVM, CE, and ED) to predict the geographical distribution changes in Olea europaea in Asia. The results showed that MaxEnt and SVM had better accuracy, and MaxEnt stands out for its user-friendly interface, minimal distortion, high stability, and exemplary simulation performance. Remarkably, it requires only a modest amount of data to deliver precise predictions, establishing it as a preferred choice among predictive models. At present, it ranks as one of the most widely utilized models for species distribution. The MaxEnt model, frequently utilized in conjunction with ArcGIS, plays a pivotal role in forecasting shifts in the habitats suitable for endangered species. Ye et al. [17] used MaxEnt and ArcGIS to study the impact of climate change on the distribution pattern of the endangered plant Semiliquidambar cathayensis after the last interglacial period. Similarly, Liu et al. [18] utilized MaxEnt and ArcGIS to forecast the global ecological suitability areas for the endangered Japanese species, Pyrus calleryana, under various climate conditions. Such research endeavors have significantly contributed to laying a scientific groundwork for the protection and conservation of endangered tree varieties.
Liriodendron chinense (Hemsl.) Sarg. (Magnoliales: Magnoliaceae), a rare species within the Magnoliaceae family and the Liriodendron genus, is a Tertiary relic plant that holds an important position in the history of biological evolution. Due to its significant ornamental value, it is frequently used in current urban landscape and garden greening projects [19]. Additionally, L. chinense is valued for its high-quality timber and possesses notable medicinal properties [20]. In recent years, L. chinense has seen a significant decline in its natural populations, a situation exacerbated by human-induced habitat degradation and inherent reproductive biological constraints [21]. The International Union for Conservation of Nature (IUCN) underscores that global warming poses a threat to at least 10,967 species listed on the IUCN Red List of Threatened Species, elevating their likelihood of extinction [22]. Against this backdrop, L. chinense has been designated as a Near Threatened species on the IUCN Red List [23], signaling the urgency for conservation measures. Under the current and projected impacts of climate change, the distribution range and growth conditions of L. chinense could face significant challenges. Simulations predicting the suitable habitats of L. chinense are crucial for understanding future distribution patterns and identifying the key environmental variables affecting its distribution. Previous studies on the geographical distribution patterns of L. chinense has utilized the MaxEnt model with default settings [24,25], leading to overfitting and sampling bias, which directly impairs the transferability of species predictions. Moreover, these studies have relied on climate data from the CMIP5 model, and there is still a lack of clear understanding based on the latest CMIP6 model. Additionally, existing research lacks an analysis of the impact of human activities on the growth of L. chinense.
As global temperatures continue to rise, L. chinense is predominantly cultivated in southern China, yet projections suggest a potential northward expansion of its distribution. Winters in northern China are markedly influenced by the cold northern currents, which are effectively blocked by the Qinling, Zhongtiao, and Dabie mountains. These geographical barriers establish the northern limit of this species distribution in southern China. It is hypothesized that with future increases in average annual temperatures and a diminished influence from northern cold currents, L. chinense may find suitable climatic conditions extending into some northern regions. This research leverages the ArcGIS software and an optimized MaxEnt model to address several key questions: (1) Investigating the distribution pattern of the potentially suitable areas for L. chinense under current climate conditions in China and classifying them into different suitability grades; (2) Identifying the primary environmental variables that limit its geographic distribution; (3) Forecasting the trends of potential geographical distribution shifts under future climate scenarios; (4) Mapping the trajectories of its centroid migration across different carbon emission scenarios. The findings from these analyses are intended to underpin the introduction and cultivation strategies for L. chinense, facilitating the expansion of its viable habitat range with a scientific foundation.

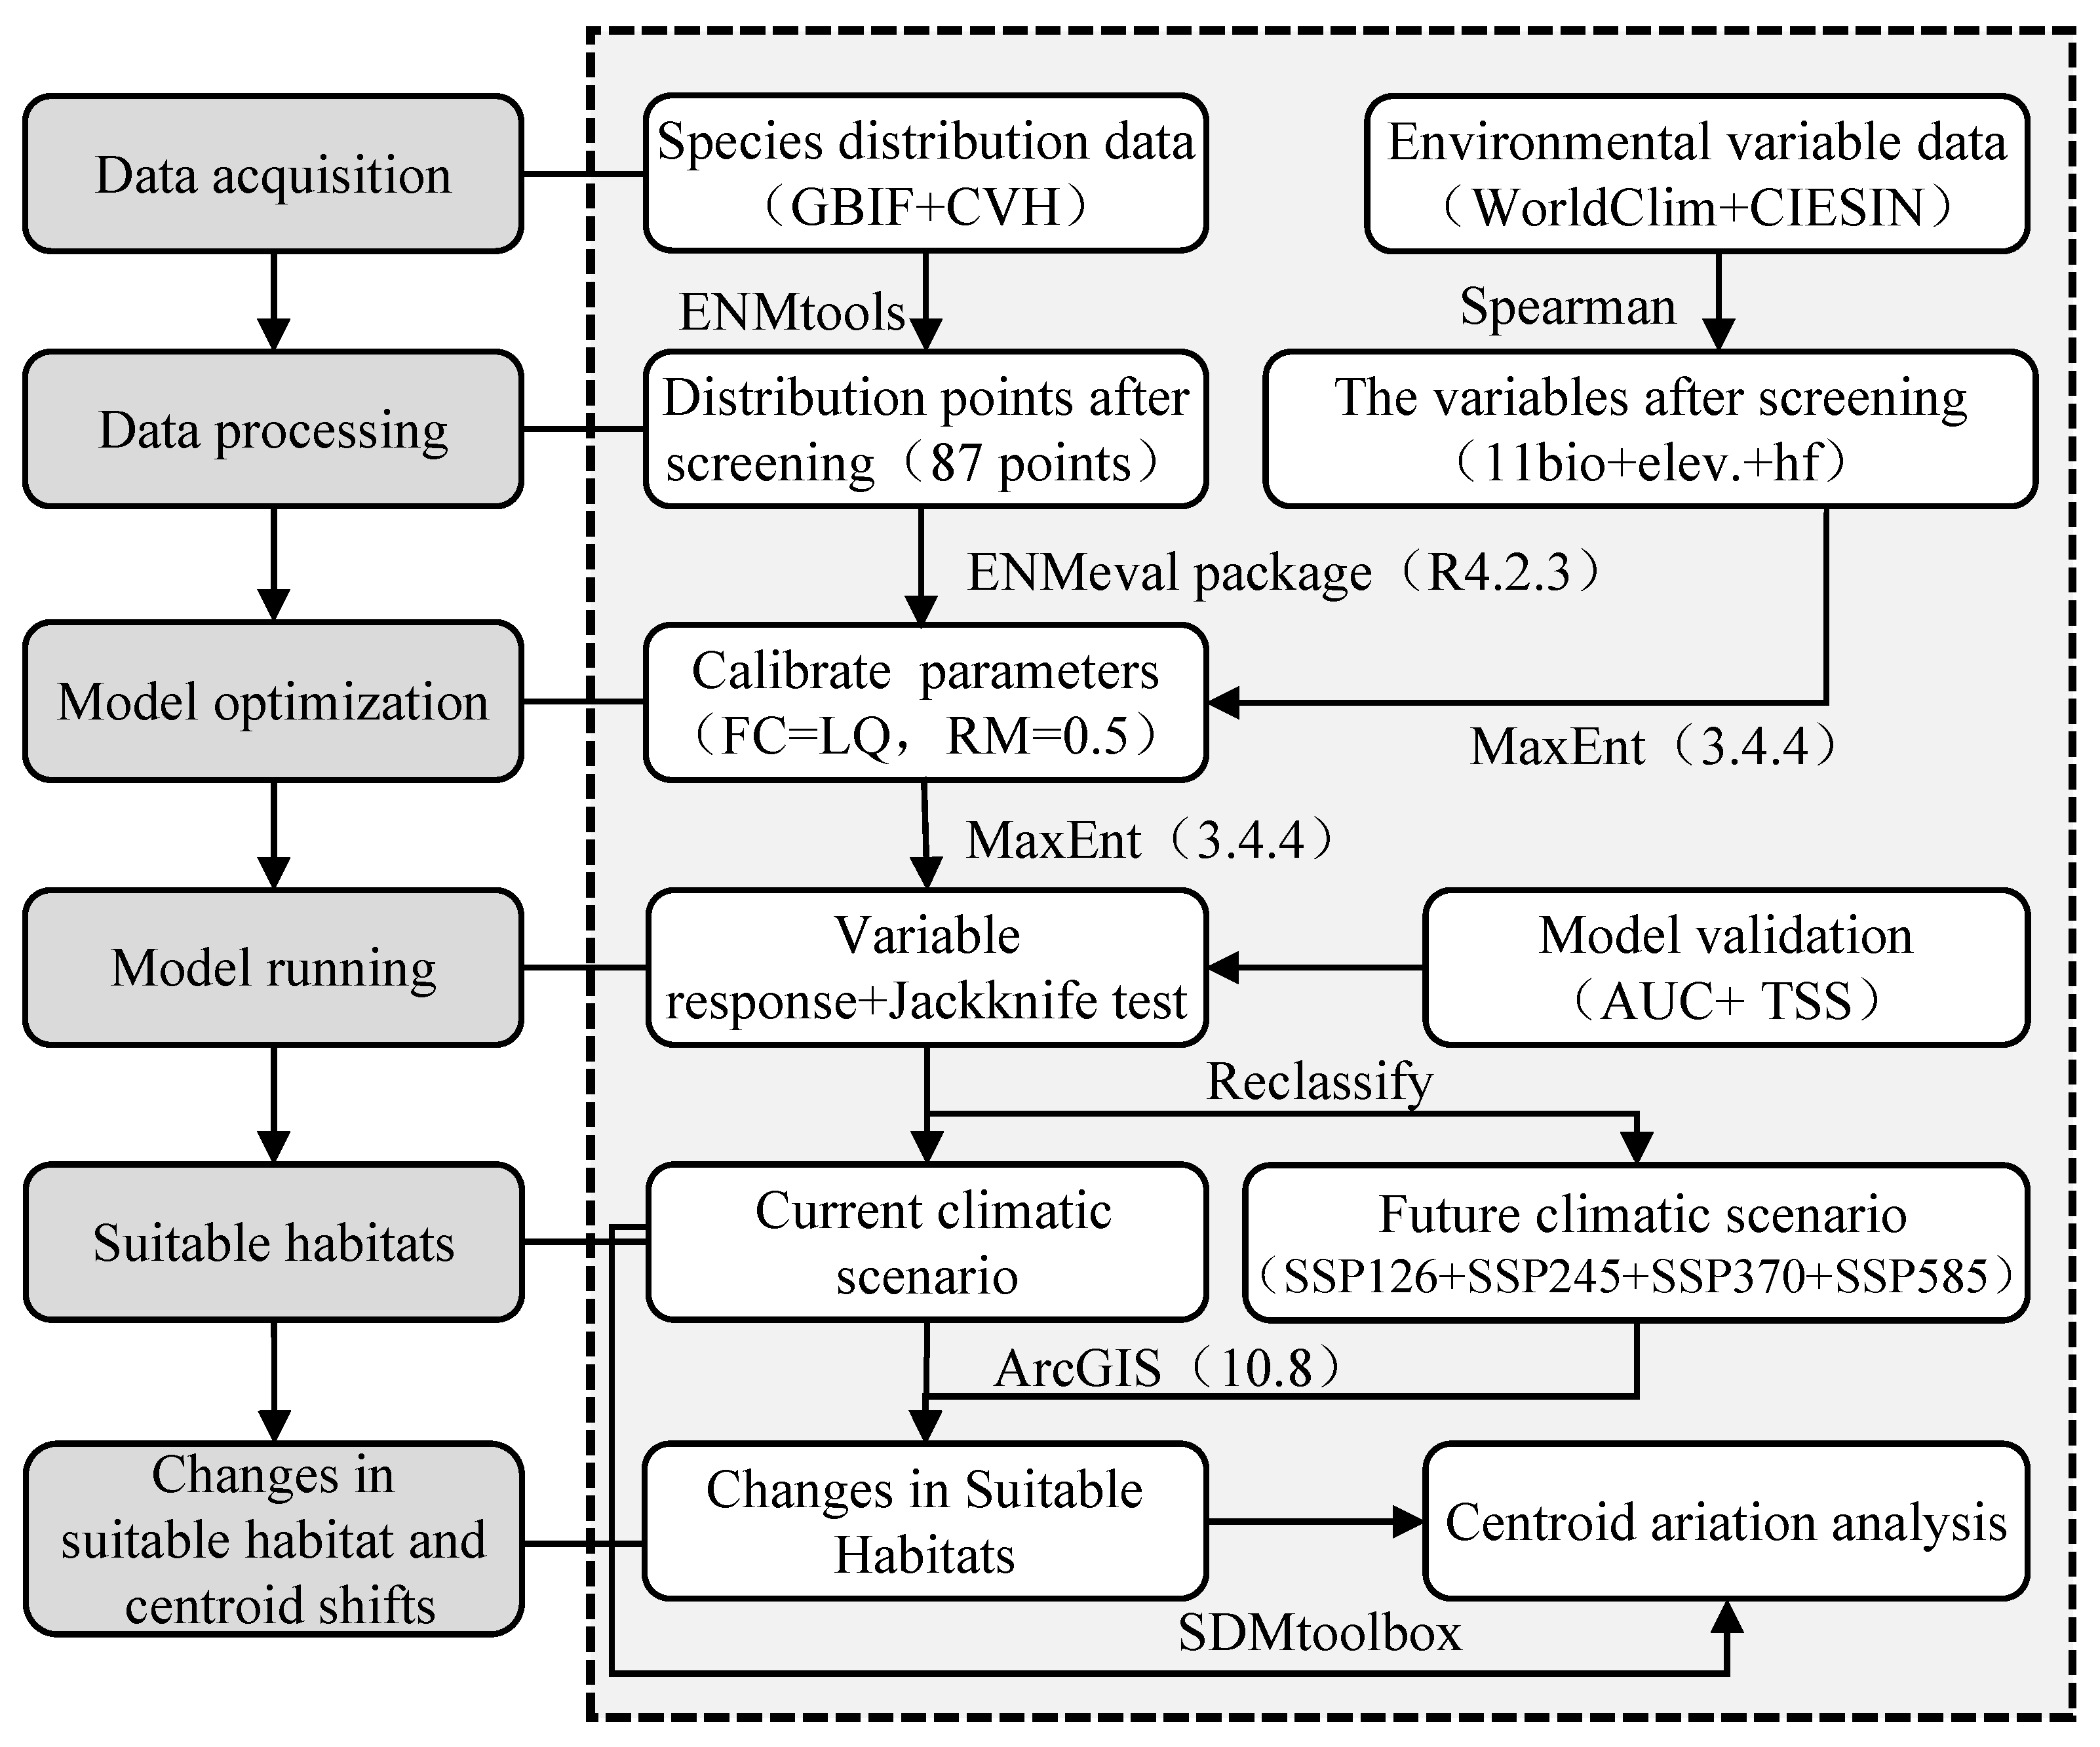
2. Materials and Methods

This study follows the methodology of data acquisition, data processing, model optimization, model operation, species geographic distribution, suitable habitat change, and centroid analysis. The specific research workflow is presented in Figure 1.

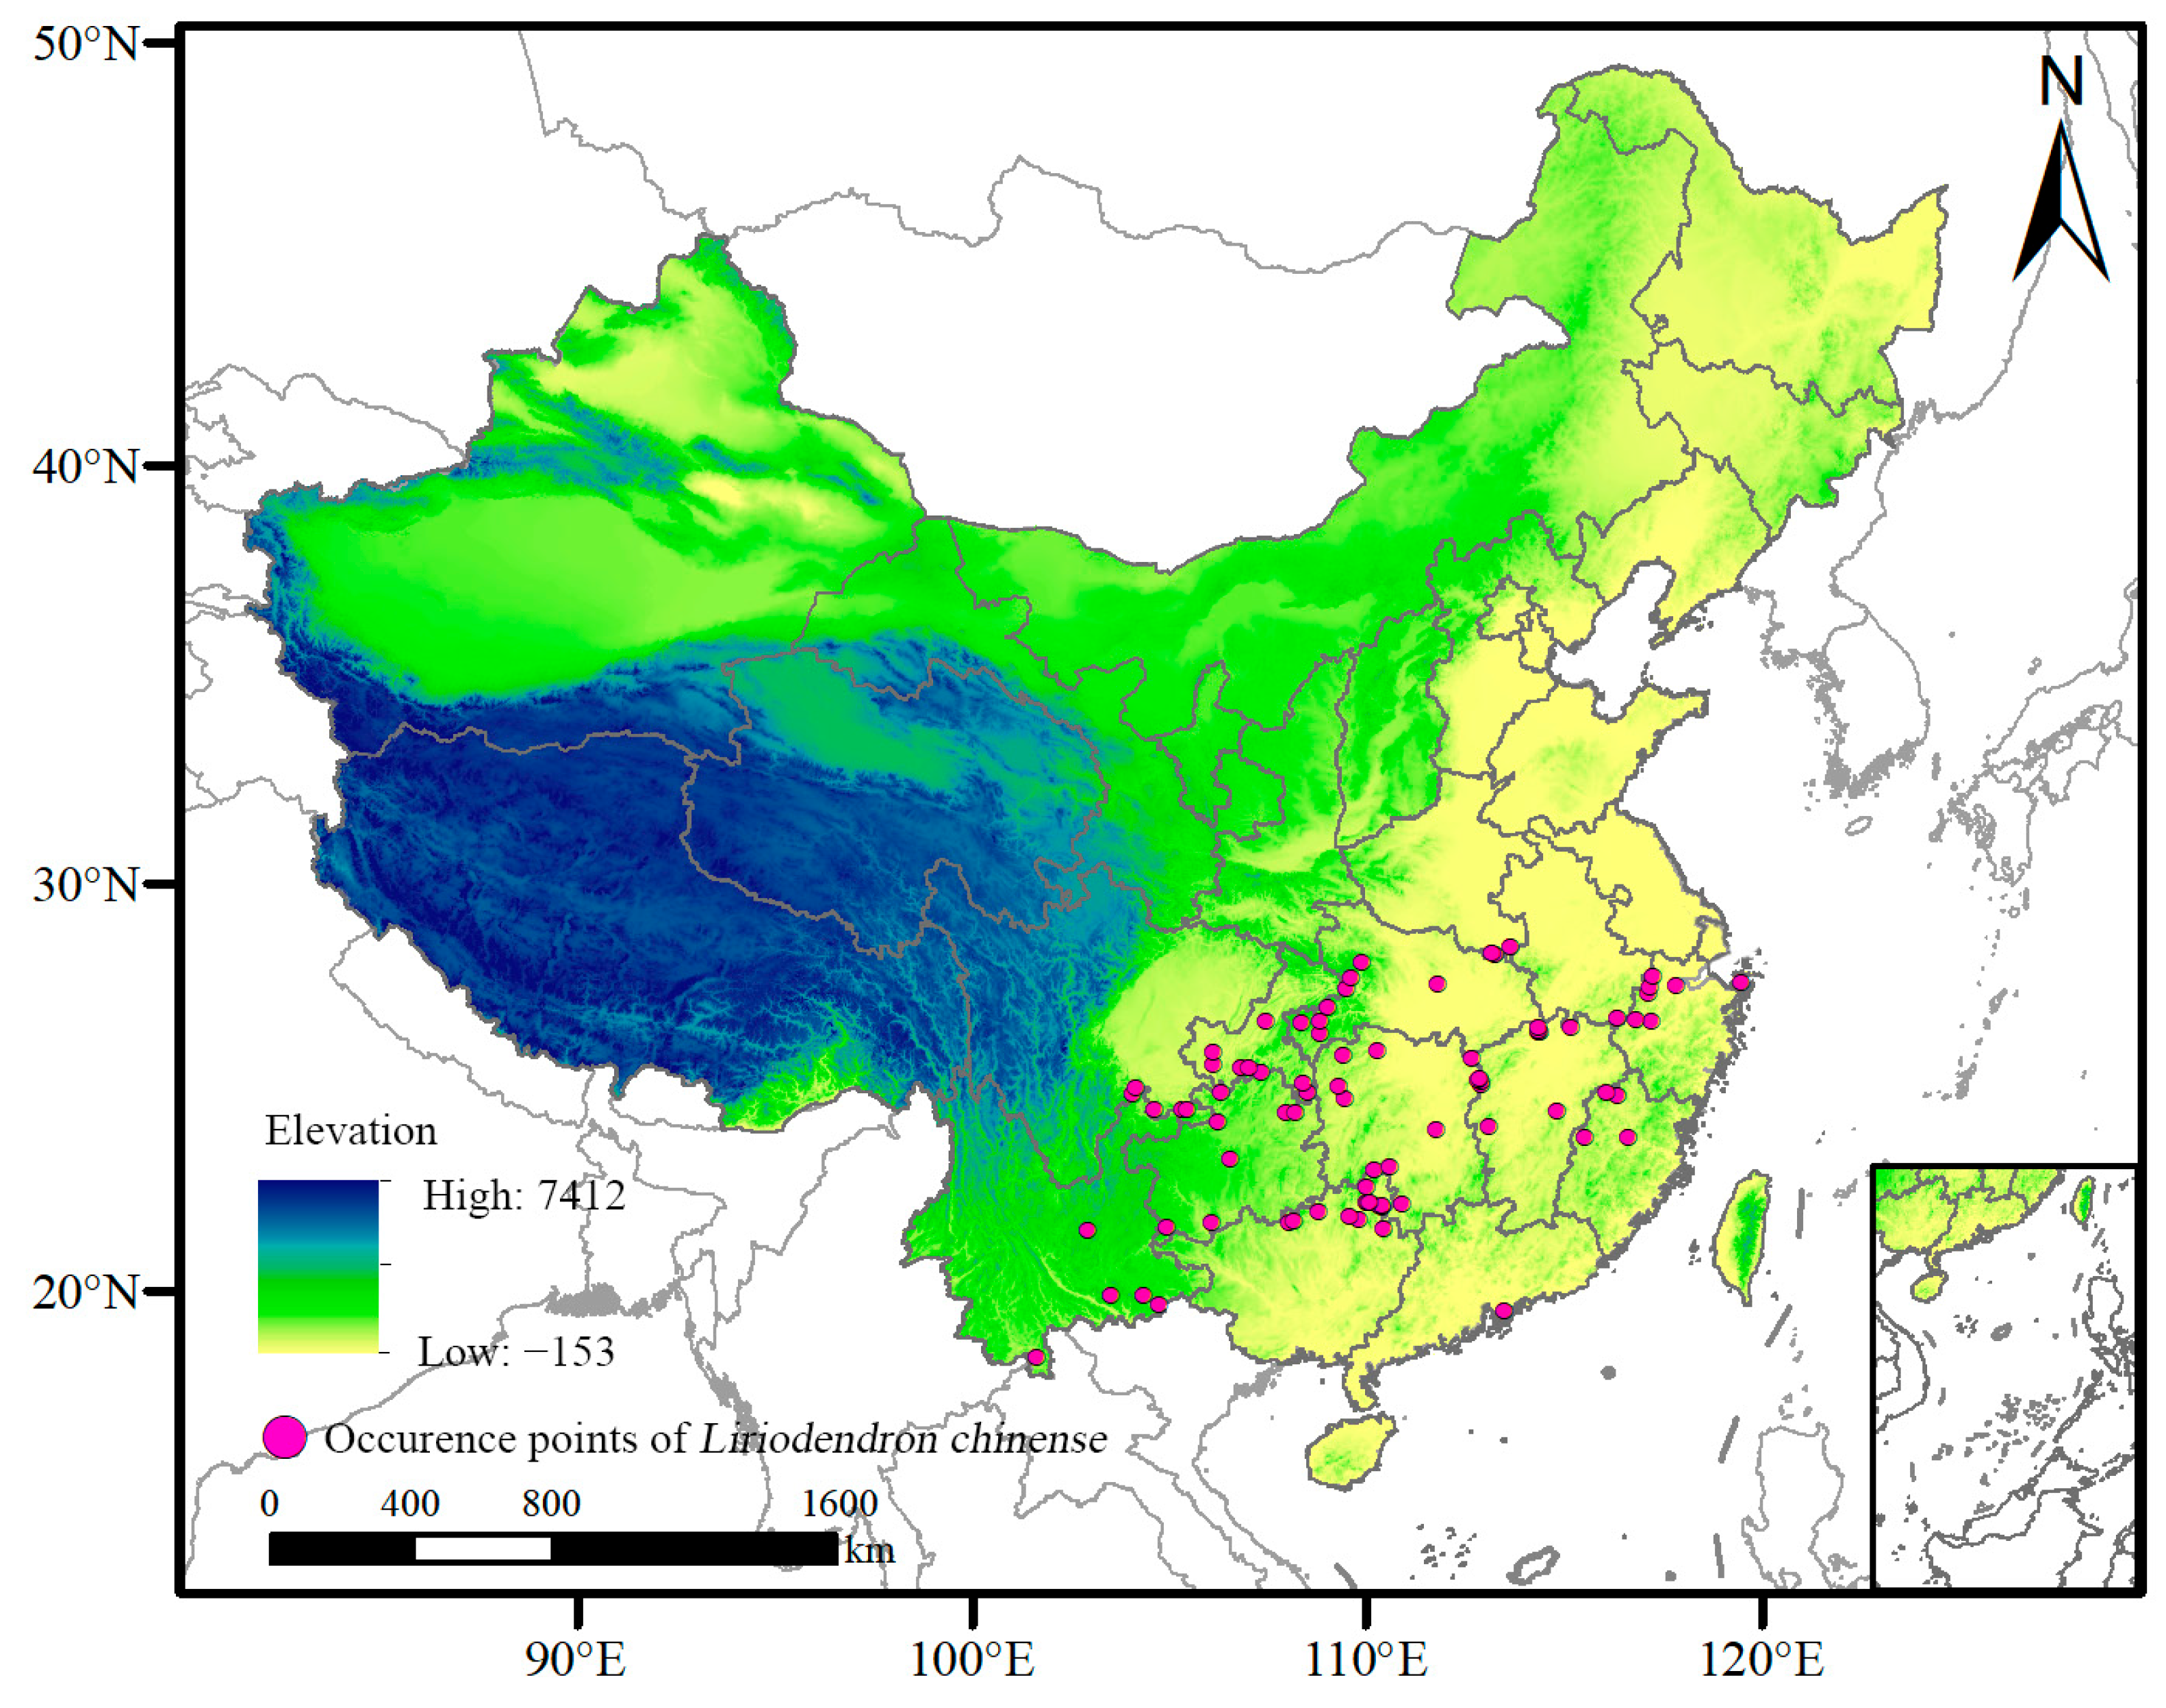
2.1. Sources and Processing of Species Distribution Data

The distribution data of L. chinense were obtained from the Global Biodiversity Information Facility (GBIF, https://www.gbif.org/, accessed on 21 August 2023) and the Chinese Virtual Herbarium (CVH, https://www.cvh.ac.cn/, accessed on 22 August 2023). The time period was limited to 1970–2020, when precise geographic coordinates were unavailable for occurrence records. We utilized Google Maps to ascertain longitude, latitude, and altitude information. Then, we removed duplicate and ambiguous data and confirmed that the coordinate information matched the distribution data. A total of 273 natural occurrence records were obtained across China. To mitigate sampling bias caused by the clustering effect and eliminate redundant data to prevent overfitting, the ENMTools v1.3 software was utilized for filtering distribution data. ENMTools can automatically match the grid size of environmental factors, eliminate redundant data within the same grid, and ensure that each grid retains only one valid distribution point [26]. Within identical grid cells (5 km× 5 km), only a single distribution point was retained, and the data were converted into .csv format for the development of the MaxEnt model. This process yielded a refined and accurate dataset comprising 87 distribution records (Figure 2).

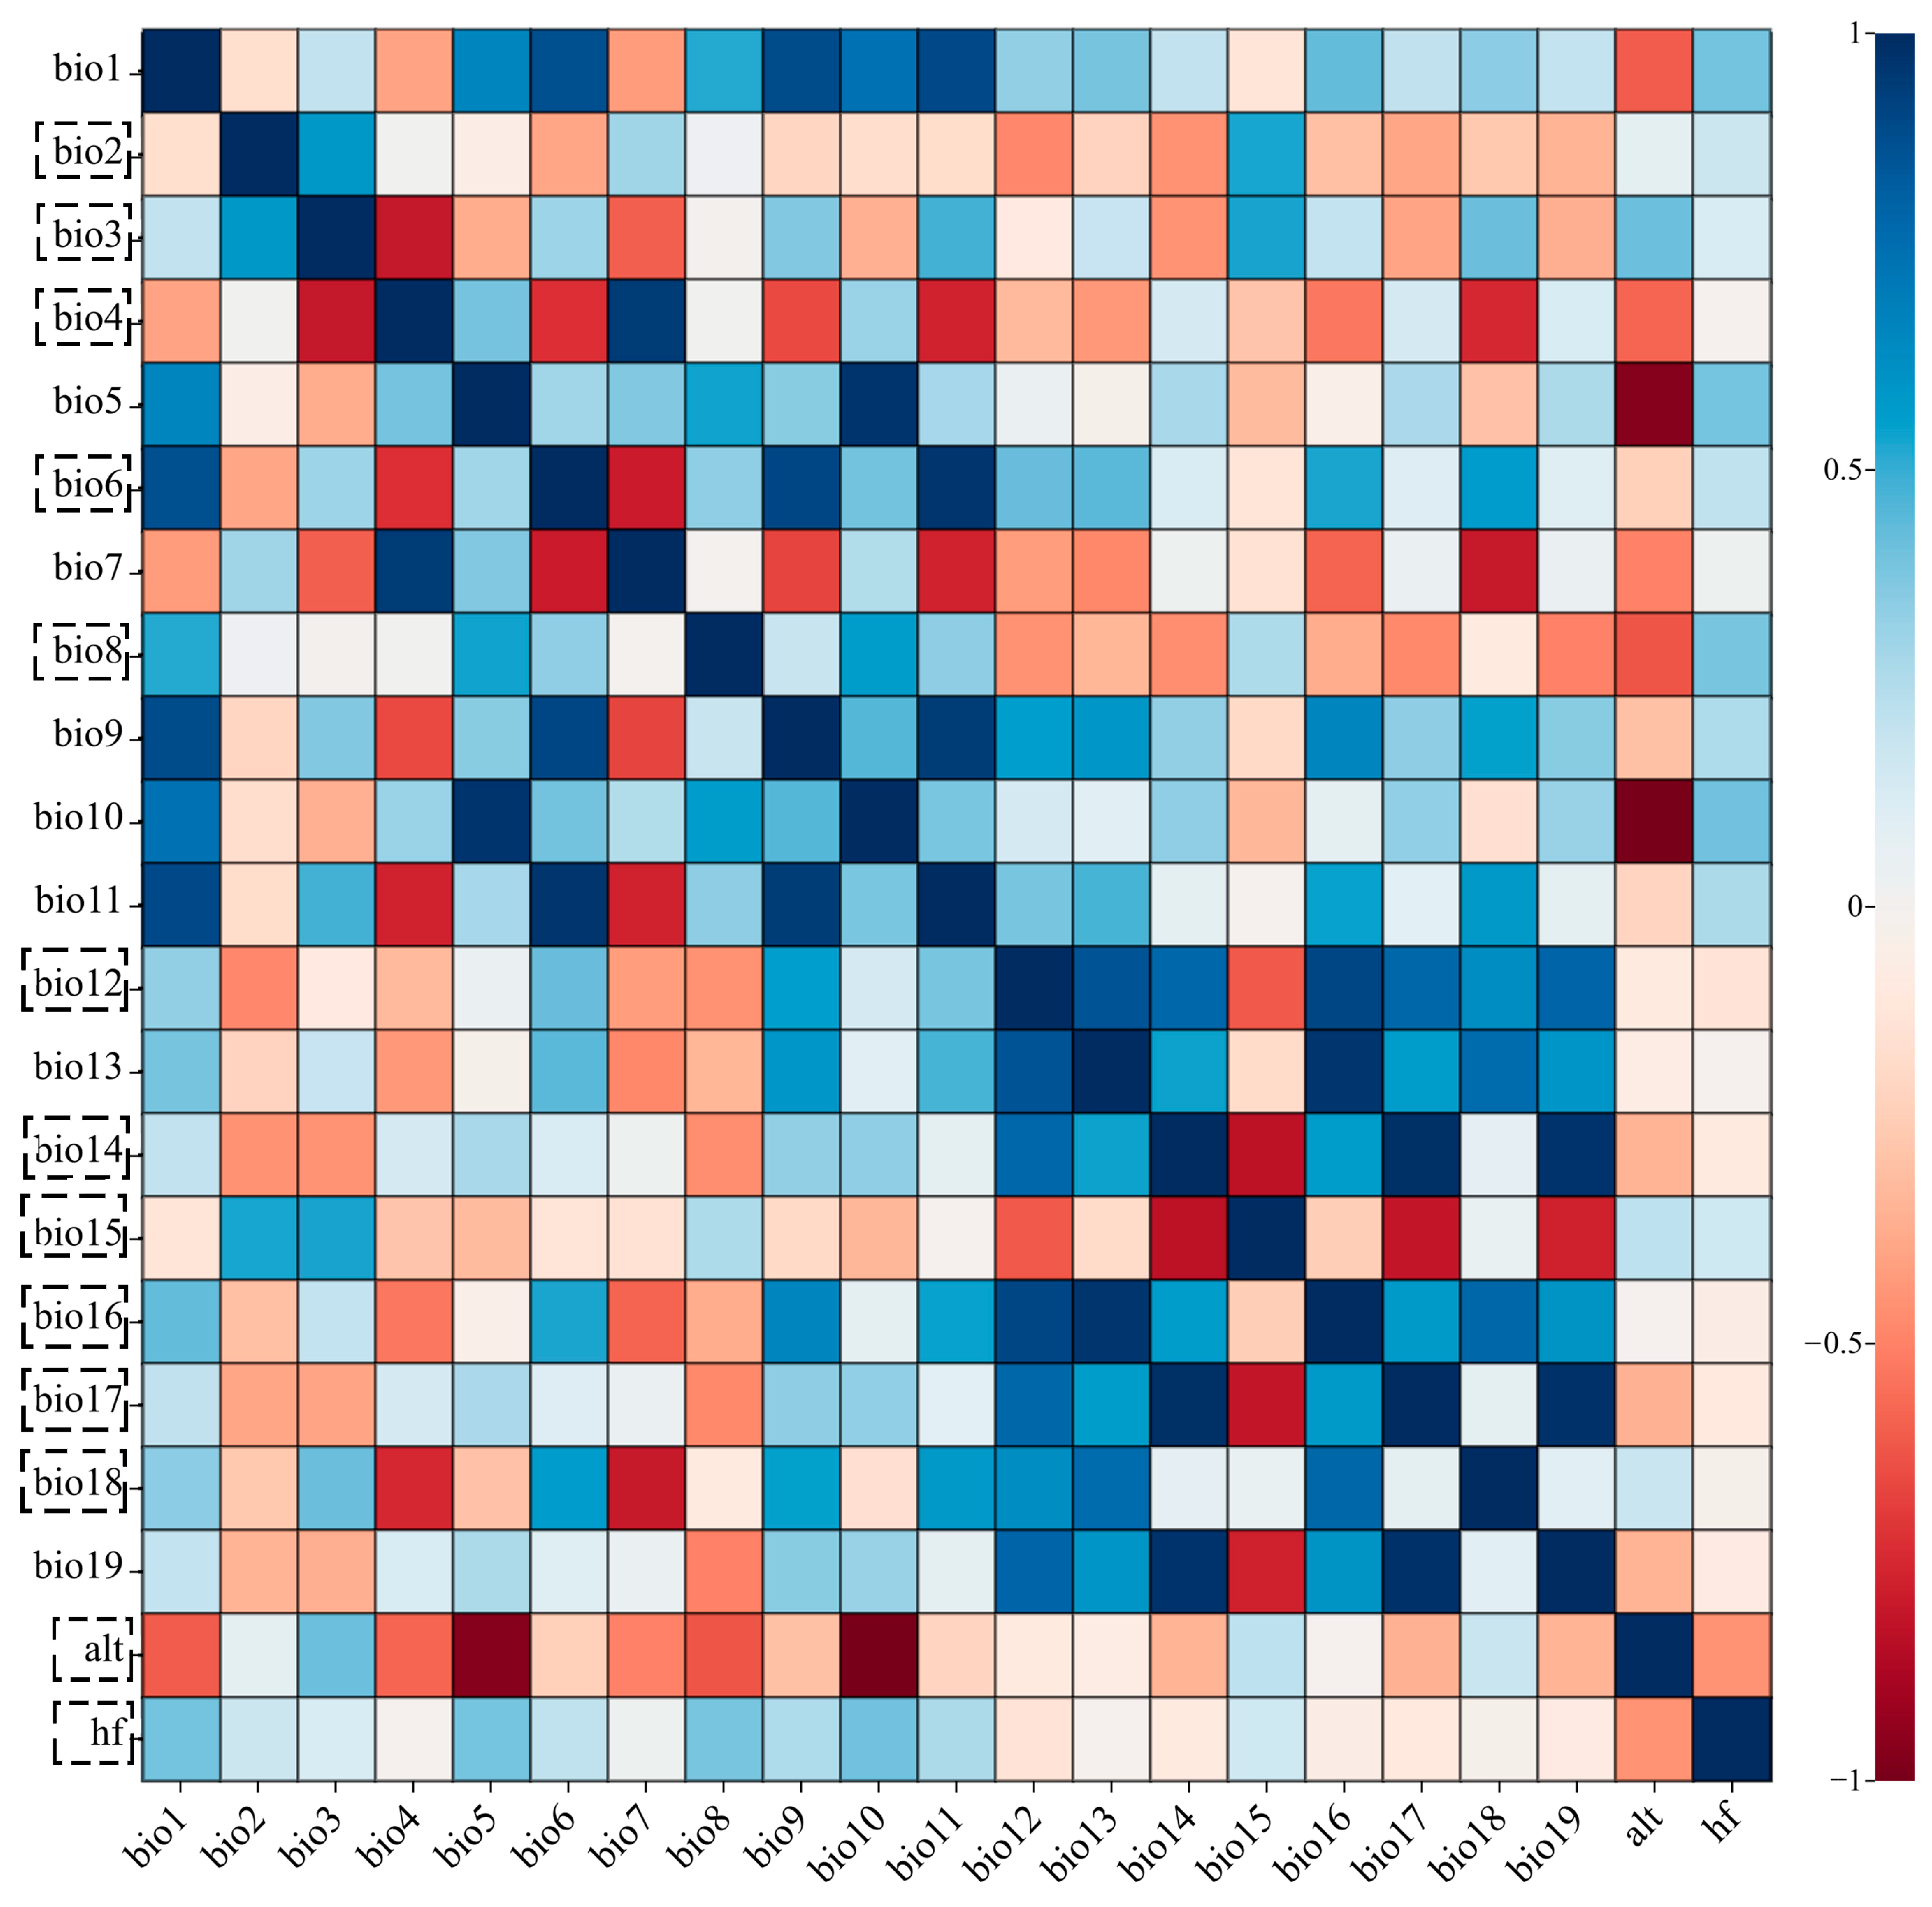
2.2. Collection and Processing of Environmental Variable Data

As shown in Table 1, the environmental variables selected for this study encompass 19 climate data points, one elevation variable, and one human footprint. Bioclimatic and elevation data were sourced from the WorldClim database (https://worldclim.org/, accessed on 23 August 2023), with a spatial resolution of 2.5 min [27]. The human footprint (hf) data were obtained from the third edition of the Global Human Disturbance dataset (http://www.ciesin.columbia.edu/wild_areas, accessed on 23 August 2023) [28], hosted by the Center for International Earth Science Information Network (CIESIN) at Columbia University [28] (2016). This dataset includes comprehensive annual records from 1993 to 2009, capturing a range of human activities such as population density, railroads, highways, power infrastructure, cropland, and grazing. These data provide a detailed characterization of human activity disturbances, which is crucial for understanding how urbanization and infrastructure development could alter habitats and influence the geographical distribution of L. chinense. The data were weighted and standardized, resulting in a spatial resolution of 5 km. Administrative boundary data for China were sourced from the Resource Environment Science and Data Center (https://www.resdc.cn/, accessed on 24 August 2023).
This study utilized current bioclimatic data spanning from 1970 to 2000 and projected bioclimatic data for the 2050s (2041–2060). Compared to the BCC-CMS 1.1 m model (in terms of advantages over RCP scenarios), the BCC-CMS2-MR global circulation model (GCM) under the CMIP6 scenario, released by IPCC6, has demonstrated improved simulations in the evolution of global temperatures and the spatial distribution of annual average precipitation across China [29]. Consequently, we have chosen this model to forecast the suitable habitats for L. chinense in China. This model includes four carbon emission scenarios: SSP126, SSP245 and SSP370, and SSP585 [30]. SSP126 represents a low carbon emission pathway, envisioning a more environmentally friendly future that mitigates the impacts of global warming and climate change while also supporting sustainable economic and social development. SSP245 and SSP370 are medium emission reduction pathways, representing a relatively stable future that can lessen the impacts of global warming and climate change, though they may impose some limitations on economic and social factors. SSP585 is a high-emission pathway, depicting a more unstable and unsustainable future. This scenario could lead to more severe climate change and environmental challenges, adversely affecting economic and social development.
For regional studies within China, a resolution of 2.5 min is generally considered sufficient [31]. In global or macro-ecological research, using an excessively fine resolution typically does not yield significant improvements in model performance [32]. All environmental variables were processed through ArcGIS 10.8 software, standardized to a 2.5 min resolution, with the coordinate system set to Albers. In species distribution modeling (SDM), the multicollinearity among environmental variables can lead to model overfitting, reducing the precision of prediction outcomes [32]. To address this, a Spearman rank correlation analysis was conducted to examine the interrelationships among variables, generating a correlation coefficient matrix using R 3.6.3, and variables with an absolute correlation coefficient value of less than 0.8 were retained [33,34]. Based on this, the contribution of 21 influencing factors was determined using the Jackknife test method in MaxEnt 3.4.4 software. Based on their levels of contribution, 13 variables (Figure 3, the variables enclosed in black dashed boxes) were ultimately selected for predicting the potential geographic distribution of L. chinense.

2.3. Model Optimization and Accuracy Evaluation

To approximate a normal distribution for the likelihood of occurrence of L. chinense, 75% of the data were designated for model training, with the remaining data set aside for model testing, keeping other values at their defaults [35]. The regularization multiplier (RM) and feature classes (FCs) are key parameters affecting the predictive accuracy of the MaxEnt model [36]. The default settings in MaxEnt often lead to overfitting and are usually not the most optimal configuration. The ENMeval package in R version 4.2.3 was utilized to optimize and fine-tune the MaxEnt model [37]. The optimization process involved testing eight different values of the regularization multiplier (RM), ranging from 0.5 to 4 with a step of 0.5, and six types of feature combinations (Feature combination, FC)—L, LQ, LQH, H, LQHP, and LQHPT, where L stands for linear, H for hinge, Q for quadratic, P for product, and T for threshold. These were cross-combined in a comprehensive evaluation. The ENMeval package was employed to test the 48 resulting combinations, selecting the optimal parameter combination based on the lowest delta Akaike Information Criterion (Δ.AICc = 0).
The filtered geographic distribution data and environmental variables were imported into the MaxEnt software for modeling calculations. The predictive performance of the model was evaluated using the receiver operating characteristic curve (ROC) [38]. In ROC analysis, the false positive rate (1-specificity) is plotted on the x-axis, and the true positive rate (sensitivity) is plotted on the y-axis, while the area under the curve (AUC value) is used to measure the accuracy of the predictions. An AUC value ranging between 0.70 and 0.80 indicates the predictions are fairly accurate; if the AUC value falls between 0.80 and 0.90, the predictions are considered quite accurate; and an AUC value exceeding 0.90 signifies that the predictions are highly accurate [39,40]. Furthermore, True Skill Statistic (TSS = Sensitivity + Specificity − 1) is a straightforward and intuitive statistic used to evaluate the performance of species distribution models [41]. The range of TSS spans from −1 to 1 and is categorized as follows: poor (−1 to 0.4), fair (0.4 to 0.5), good (0.5 to 0.7), very good (0.7 to 0.85), excellent (0.85 to 0.9), and almost perfect (0.9 to 1) [42]. Therefore, in this study, both AUC and TSS are employed to demonstrate the predictive performance of the MaxEnt model.

2.4. Suitability Classification and Analysis of Dominant Environmental Variables

Result files generated by MaxEnt software (in .asc format) were imported into ArcGIS. Utilizing the Reclassify command within the Spatial Analyst Tools of ArcGIS and adopting Jenks’ natural breaks method, the potential suitable habitats for L. chinense across China were categorized into four distinct levels [18]: non-suitable areas (0 ≤ p ≤ 0.1), low-suitability areas (0.1 < p ≤ 0.2), moderate suitability areas (0.2 < p ≤ 0.4), and high-suitability areas (p ≥ 0.4) [43]. The dominant environmental variables influencing the suitable distribution of L. chinense were identified by integrating the Jackknife test, percent contribution, and permutation importance analysis [44]. The influence thresholds of these dominant environmental variables were determined by analyzing the response curves to various environmental factors, revealing the potential distribution probabilities.

2.5. Centroid Analysis of Suitable Areas

Using the SDM toolbox in ArcGIS, we computed the trends in changes in current and future suitable areas and compared the quality centers of these suitable areas. The coordinates change and migration distance of the quality centers of L. chinense were described using ArcGIS [45].

3. Results

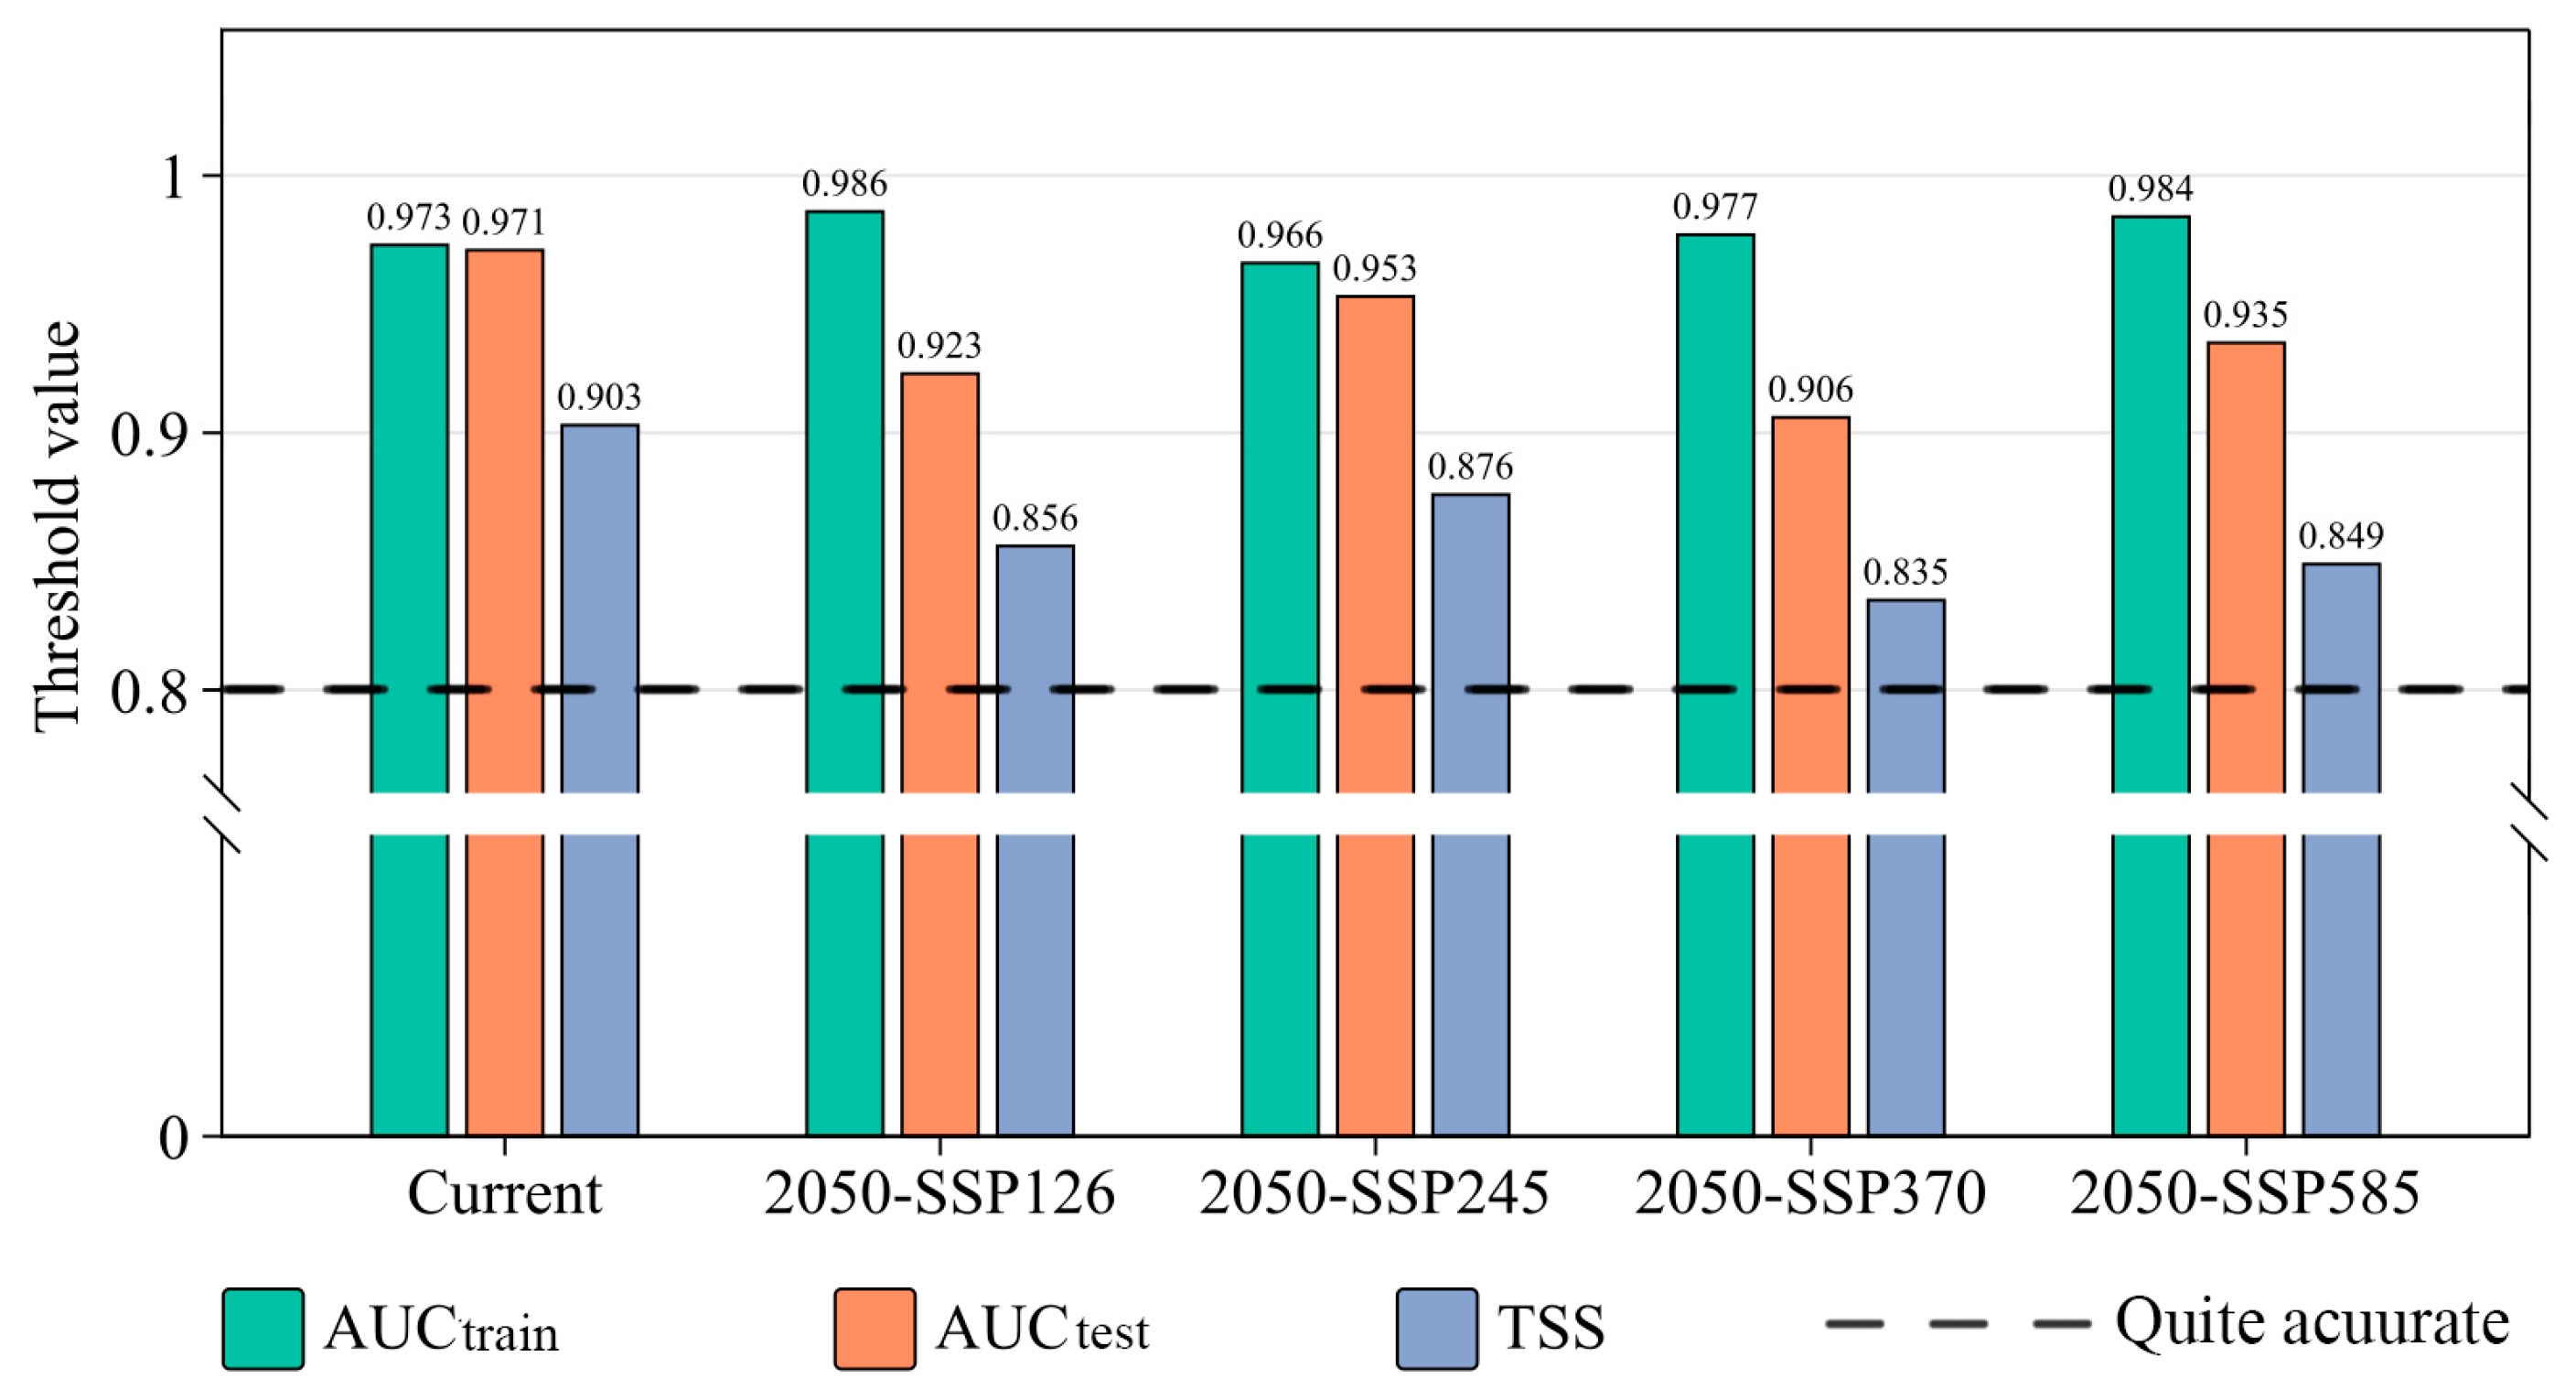
3.1. Optimization and Accuracy Evaluation of the MaxEnt Model

As illustrated in Figure 4, the AUCtrain and AUCtest values for the MaxEnt models developed under various climate scenarios all exceed 0.9, satisfying the criteria for “high accuracy” [46]. Additionally, the TSS values are greater than 0.8, classifying them within the “very good” category [47]. These metrics indicate that the model effectively captures the distribution patterns of Liriodendron chinense, ensuring a high level of confidence in its predictive accuracy.
As shown in Table 2, the default feature combination (FC) of the MaxEnt model shows FC = LQHPT, RM = 1, delta.AICc = 153.929412. After optimization using the ENMeval package, the feature combination of the MaxEnt model was adjusted to FC = LQ, RM = 0.5, delta.AICc = 0, indicating that the model with these parameters is the most optimal.

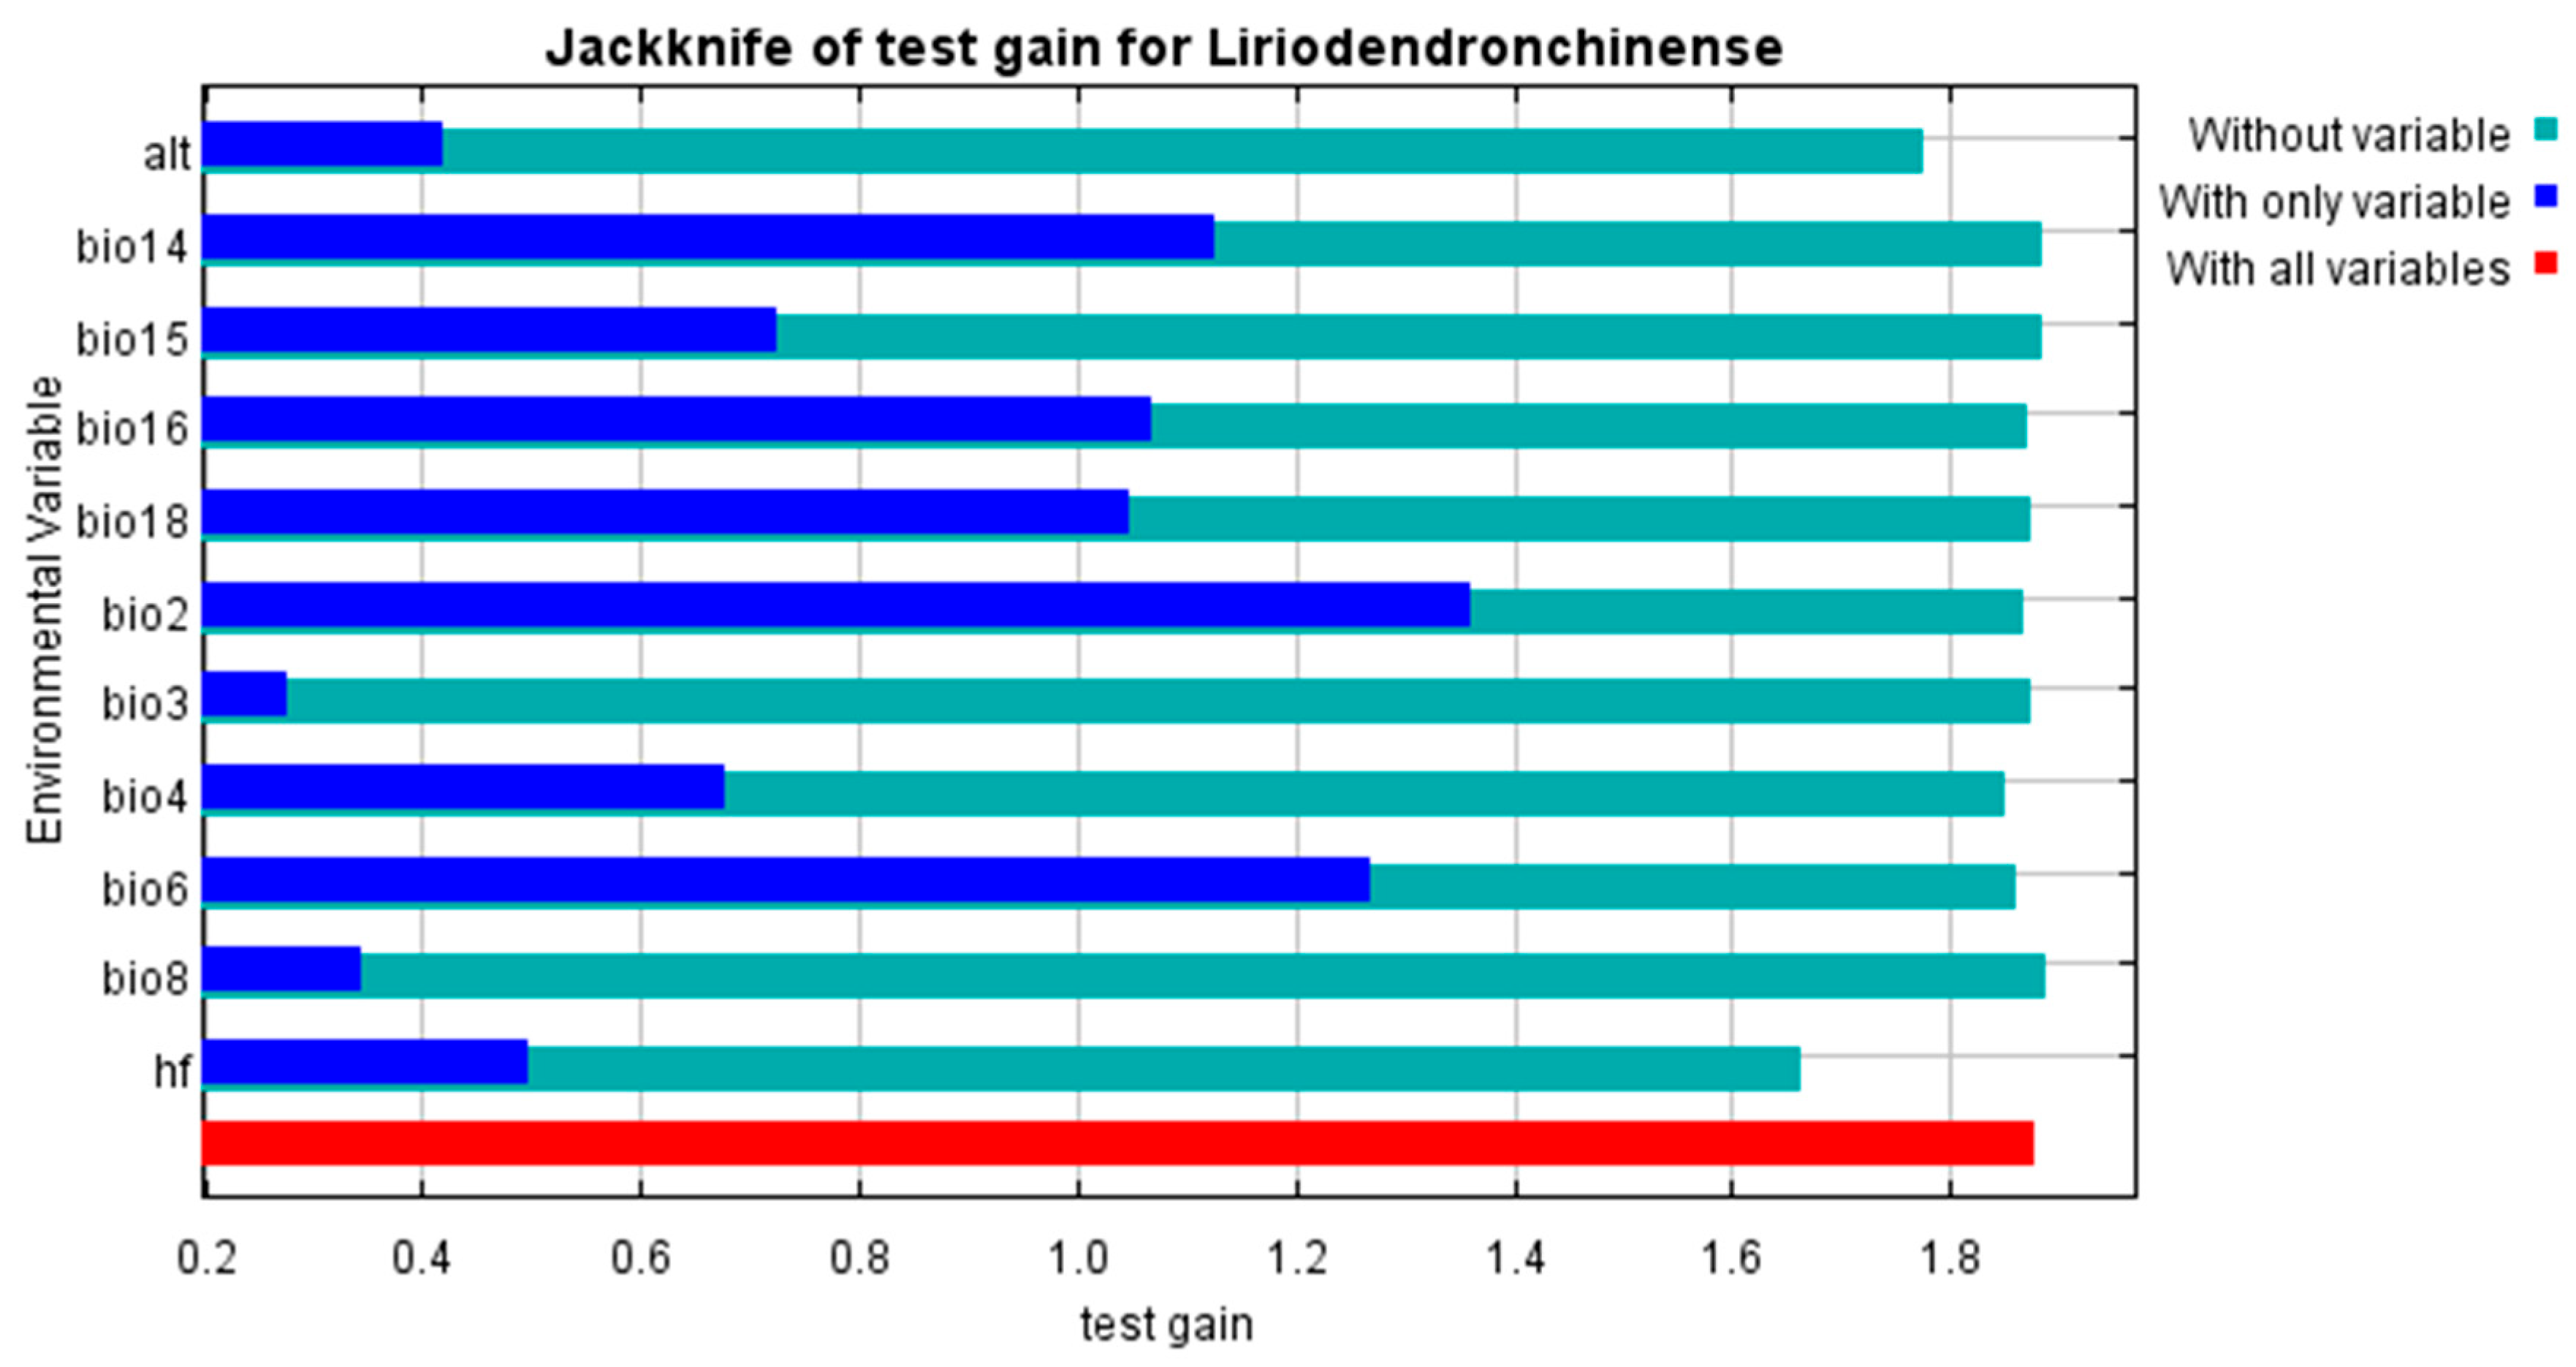
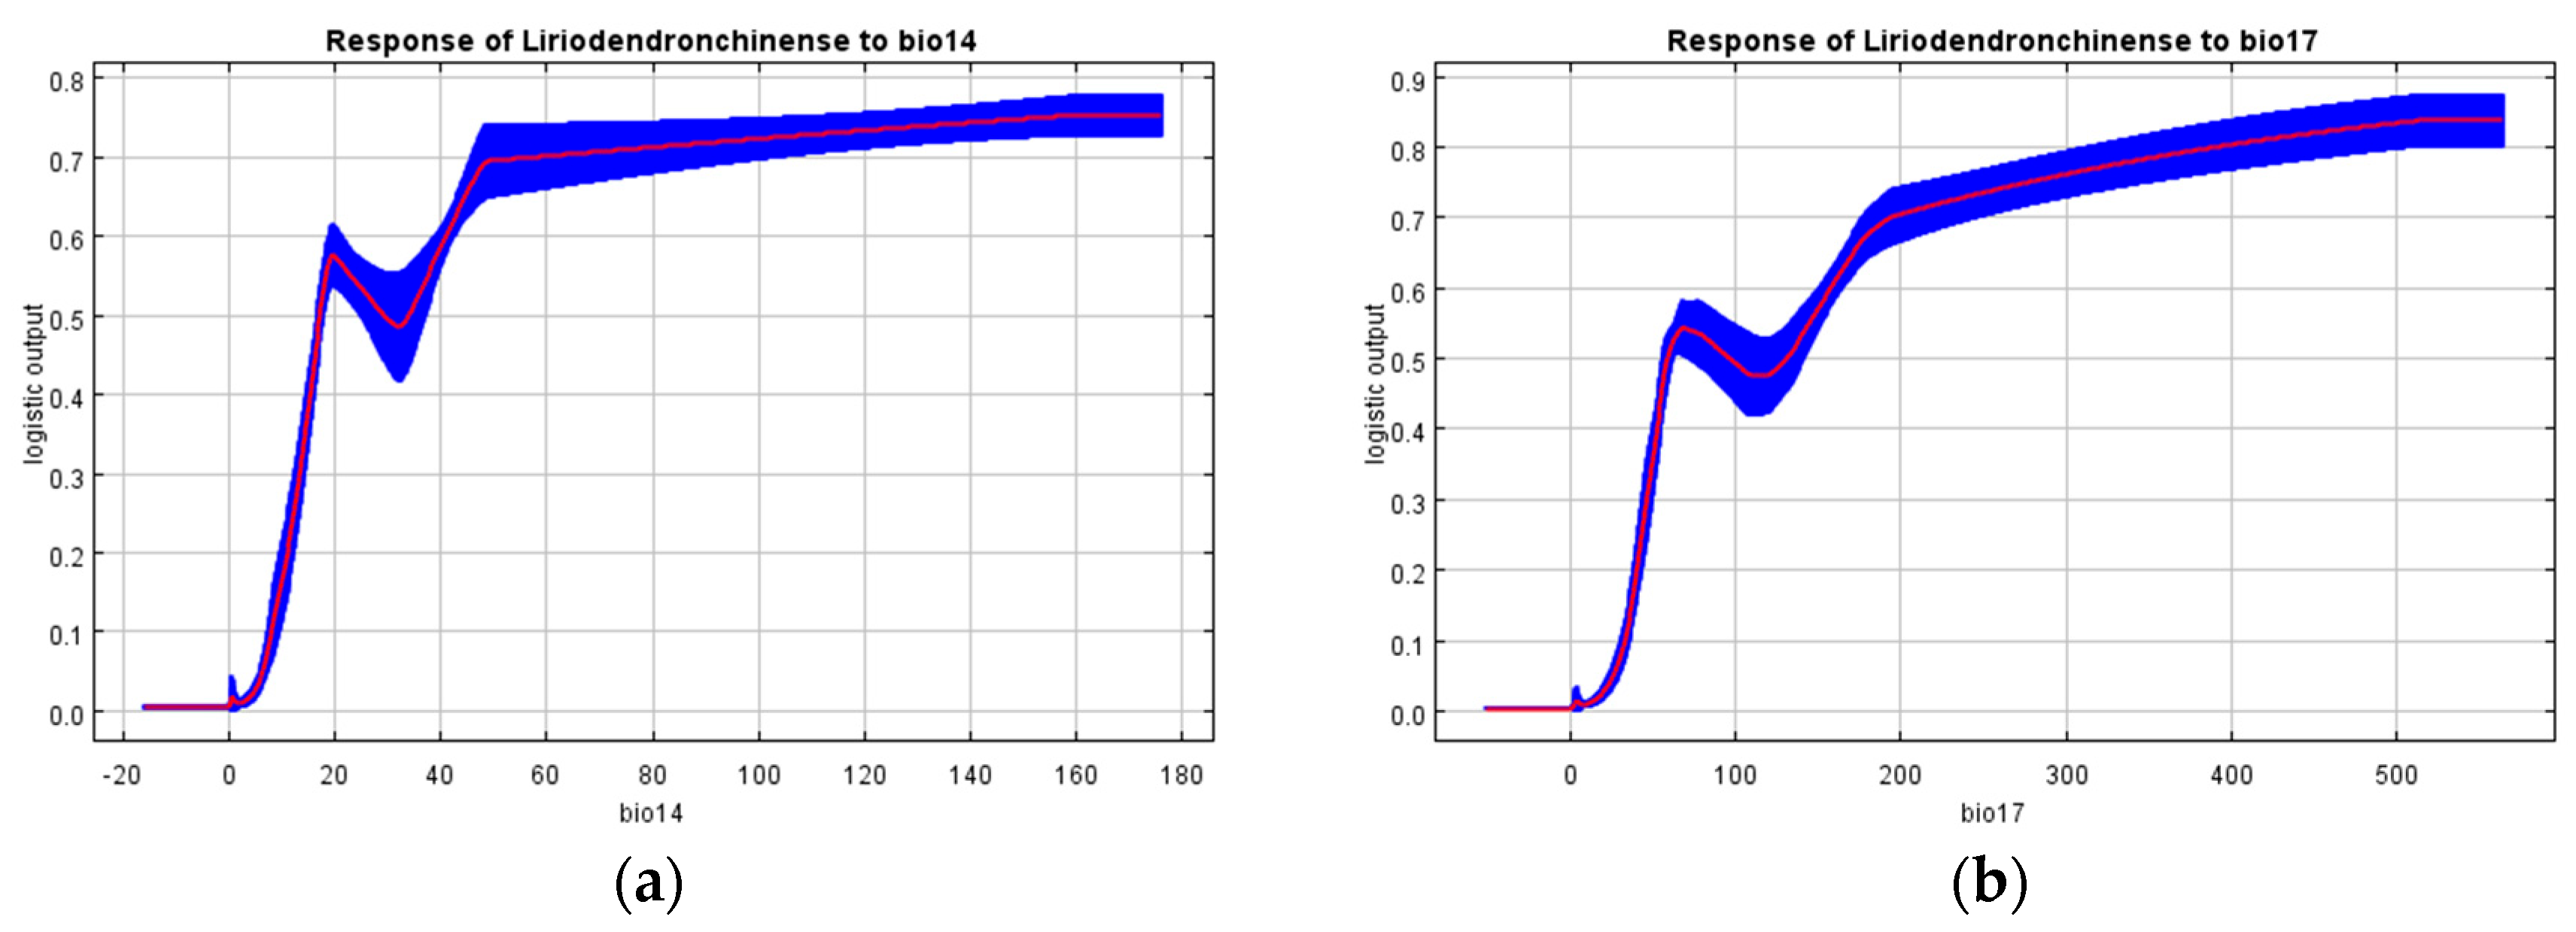
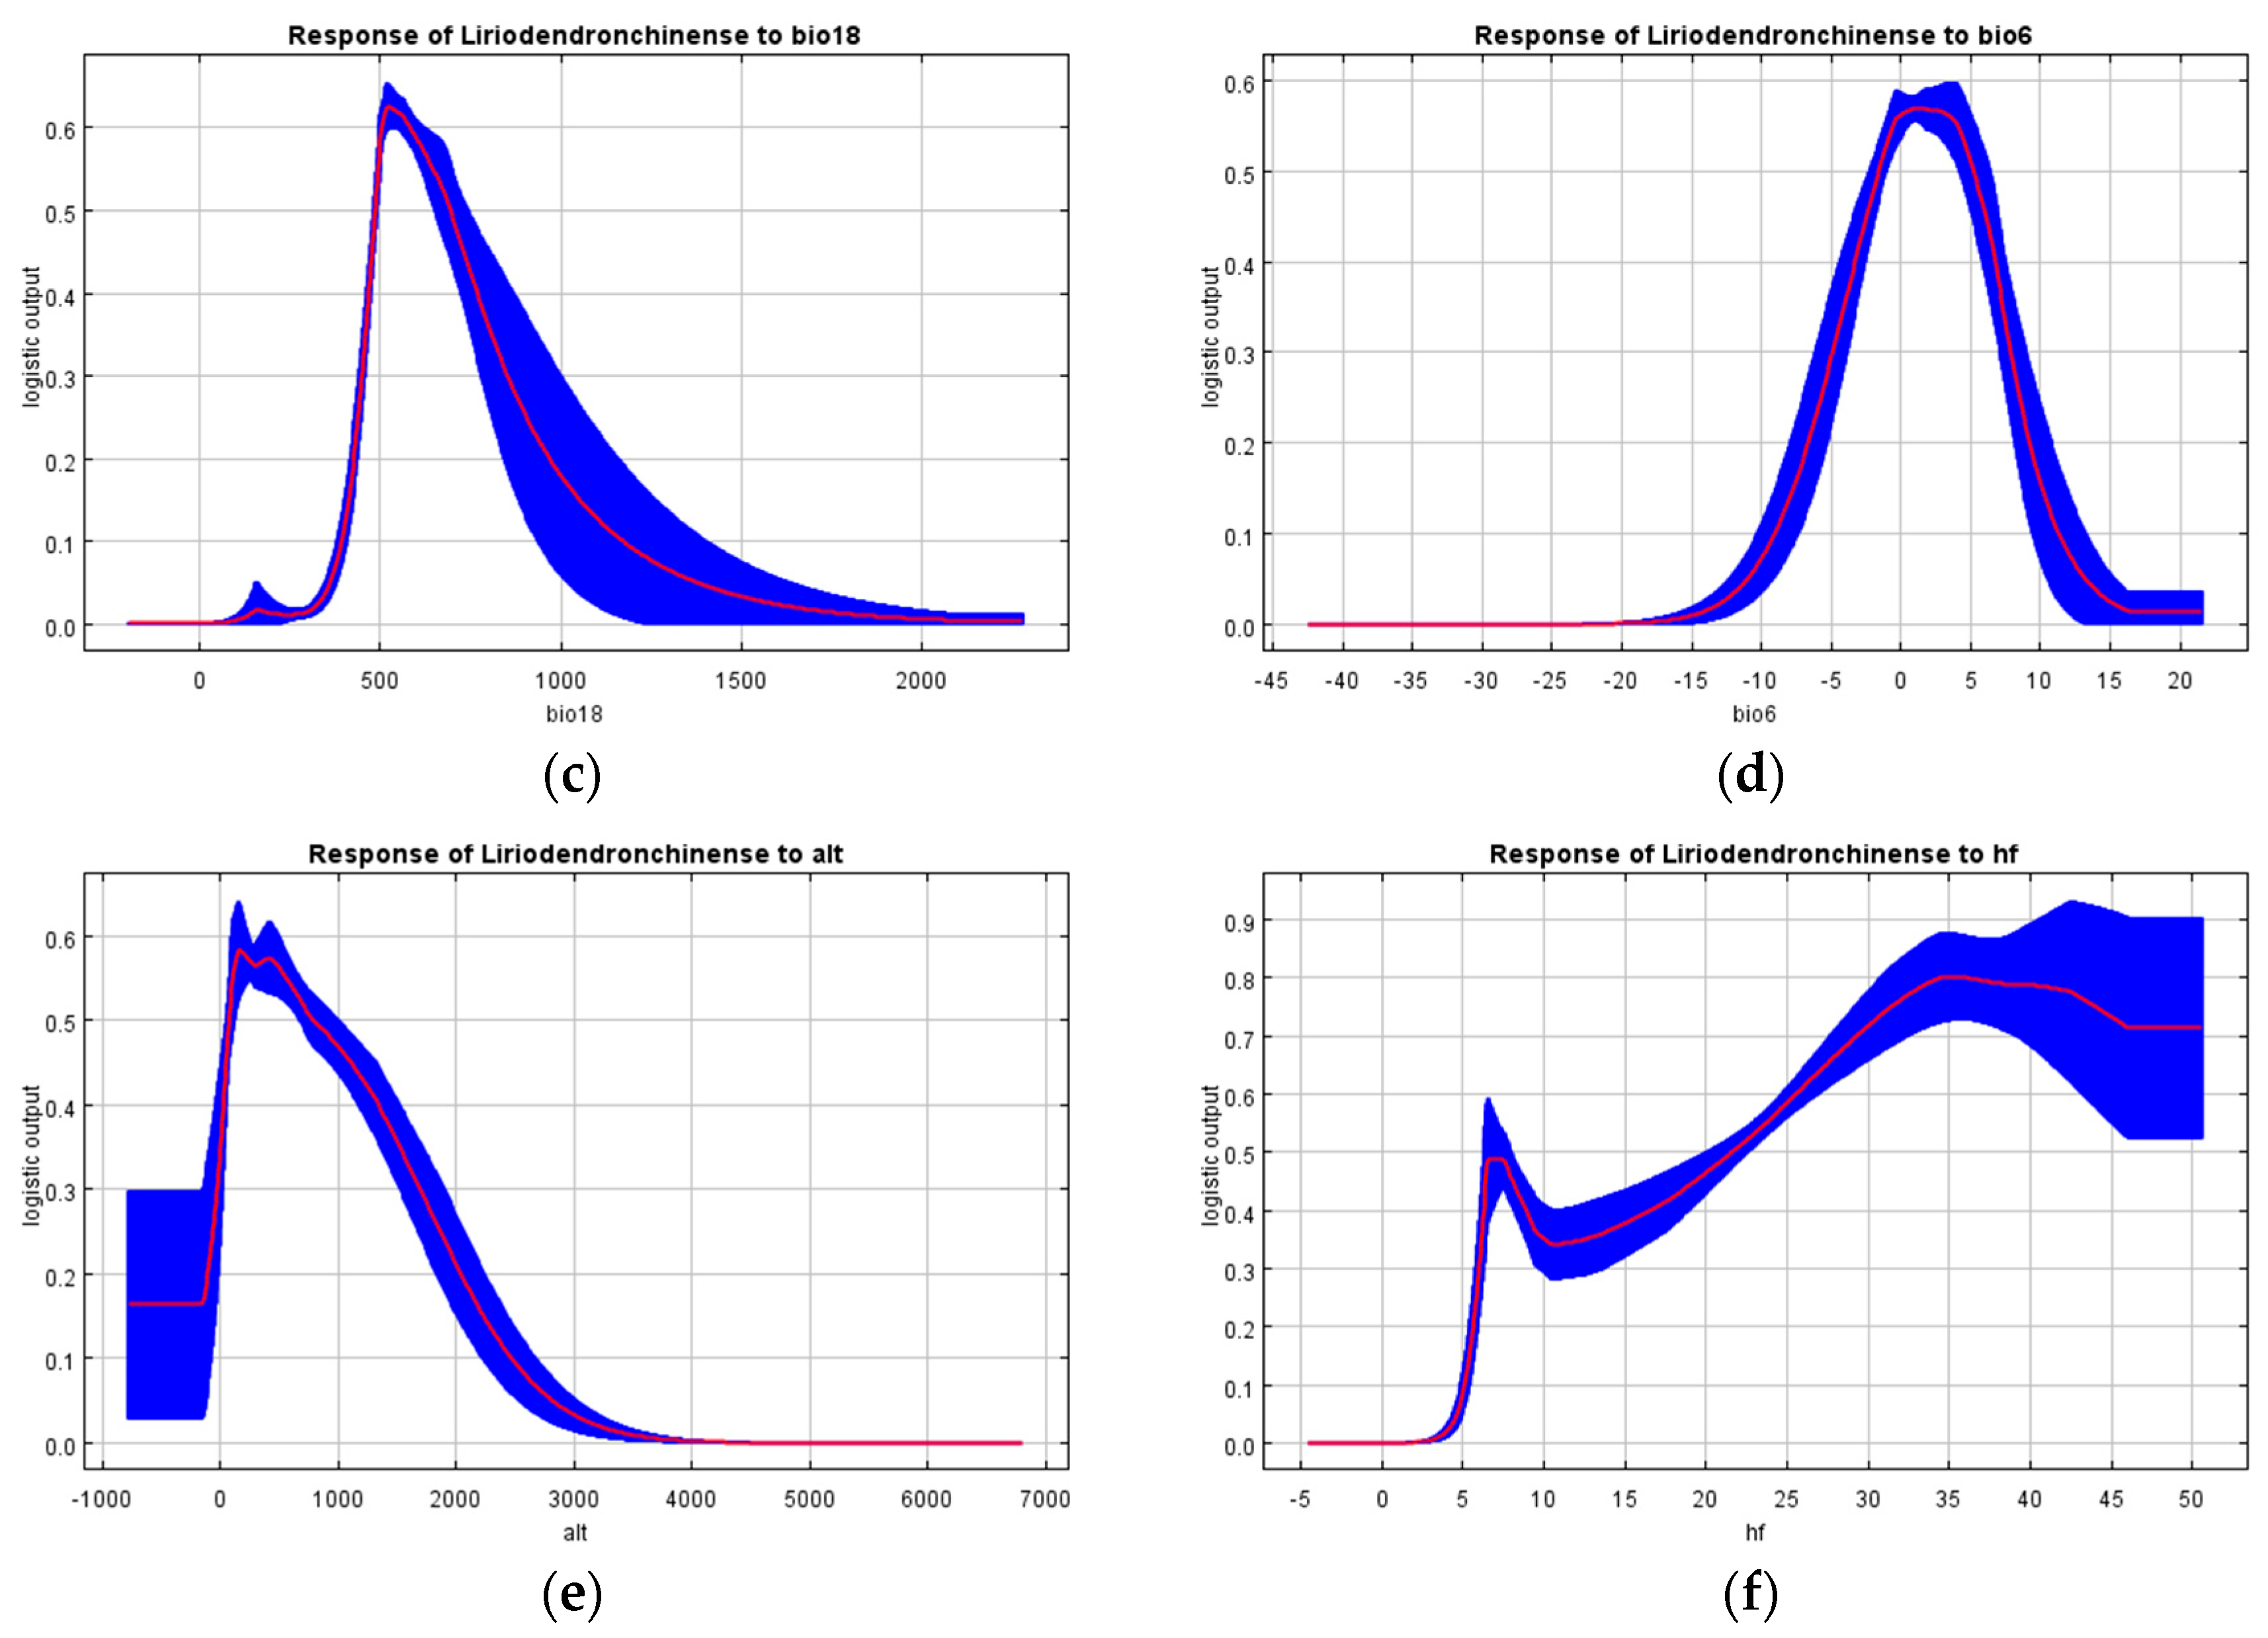
3.2. Dominant Environmental Variables Influencing the Distribution of L. chinense

As indicated in Table 3, among the 13 environmental variables used in the MaxEnt model to predict the suitable distribution areas for L. chinense, the top three contributing factors are precipitation of the driest month (bio14, 34.9%), precipitation of the driest quarter (bio17, 21%), and human footprint (hf, 10.3%), with a cumulative contribution rate of 66.2%. The top three environmental variables by permutation importance are precipitation of the warmest quarter (bio18, 23.8%), minimum temperature of the coldest month (bio6, 21.8%), and elevation (alt, 10.1%).
The Jackknife test results (Figure 5) reveal that when only a single environmental variable is used, the three variables that have the greatest impact on the regularized training gain are human footprint (hf), elevation (alt), and precipitation of the warmest quarter (bio18), indicating that these variables contain unique information not present in others. Taken together, the dominant environmental variables influencing the contemporary geographic distribution of L. chinense in China are temperature variables (minimum temperature of the coldest month), precipitation variables (precipitation of the driest month, precipitation of the driest quarter, and precipitation of the warmest quarter), elevation, and human footprint. It is generally considered that the environmental variable ranges corresponding to a logistic output greater than 0.5 are the thresholds for species-suitable distribution. The response curves for the dominant environmental variables affecting the distribution of L. chinense are shown in Figure 6, with other environmental variable ranges suitable for the growth of L. chinense presented in Table 3.

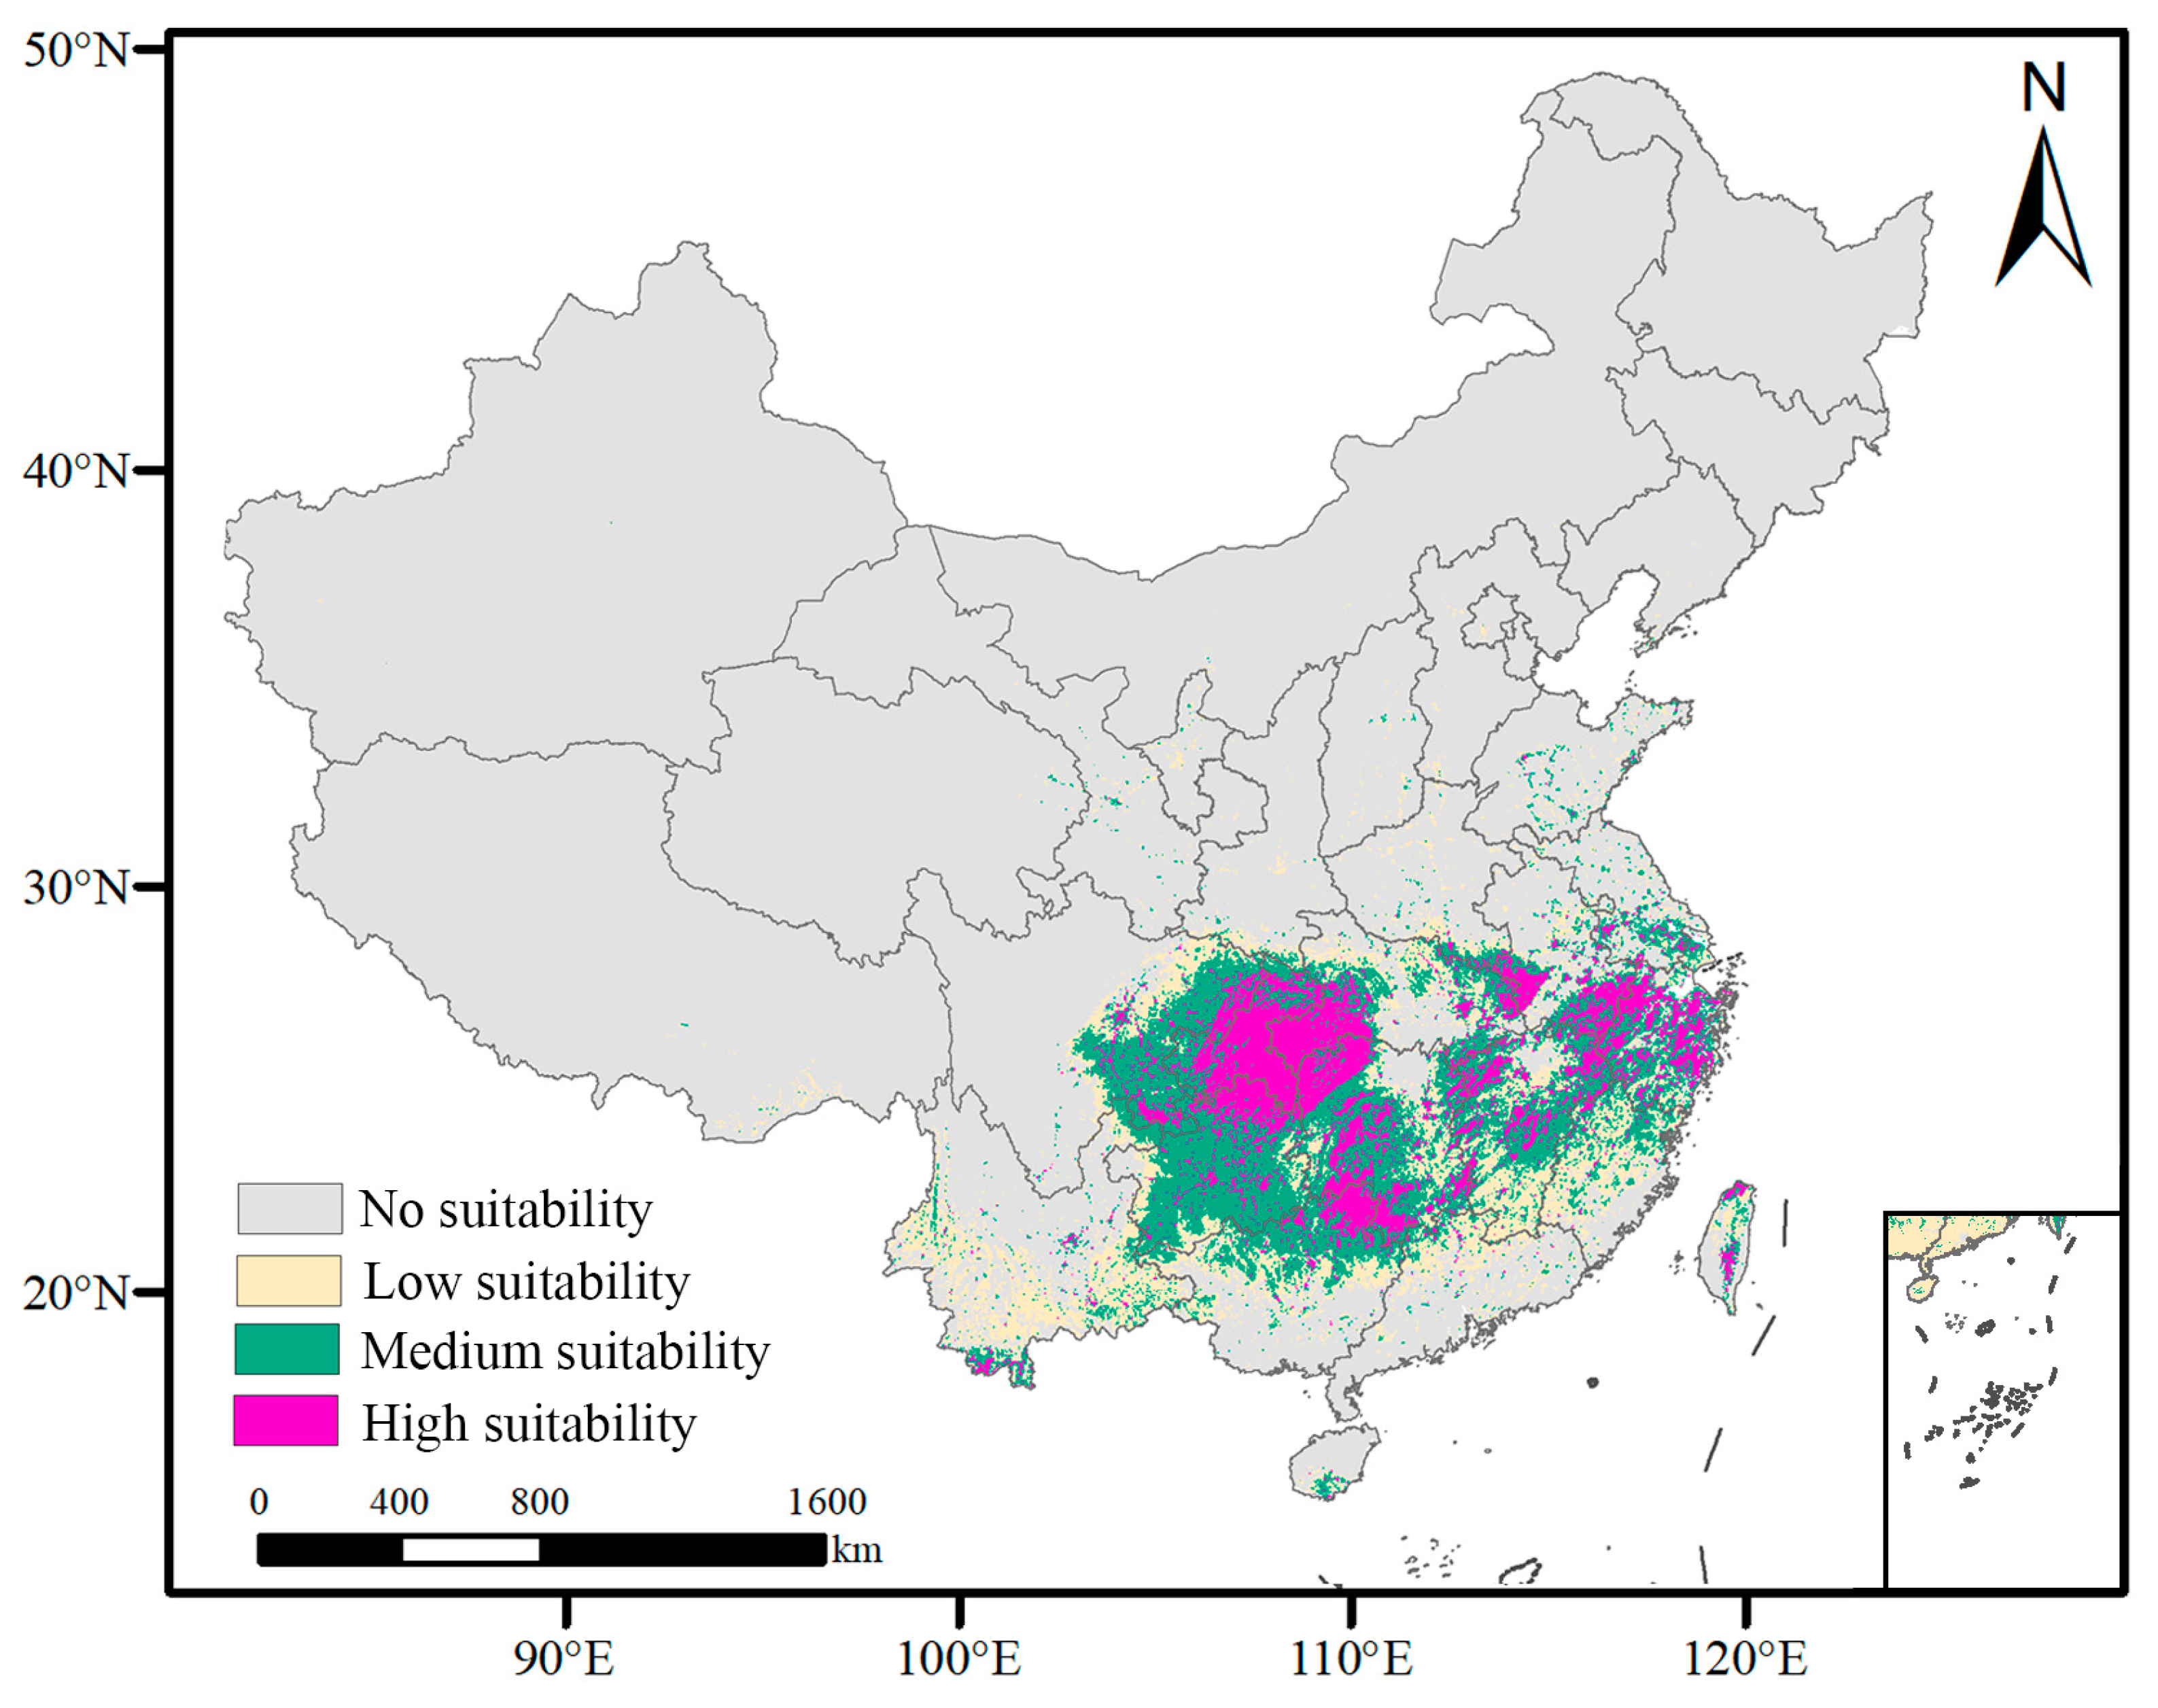
3.3. Potential Suitable Distribution Areas of L. chinense under Current Climate Conditions

Climate scenarios typically refer to projections about future climate conditions based on various assumptions about how factors such as greenhouse gas emissions, land use, and other drivers of climate change might evolve. These scenarios are used to model and analyze potential future climates to understand how changes in climate could affect the Earth’s systems, ecosystems, and human societies. They play a critical role in climate research. Utilizing the MaxEnt model alongside ArcGIS, the potential suitable habitats for L. chinense under the prevailing climate conditions were mapped (Figure 7). Among the refined set of 87 valid distribution records of L. chinense, the highest logistic probability location is Lushan, Jiujiang City, Jiangxi Province (0.91), and the lowest is in Gaolan County, Lanzhou City (0.01), with an average logistic probability of 0.52. According to Table 4, L. chinense’s total suitable habitat area under current climate conditions spans approximately 151.55 × 10⁴ km2, constituting 15.73% of China’s landmass. This habitat is predominantly located in the central, southeastern, and some southwestern parts of China, extending from Shaanxi and Anhui provinces southwards, west to Sichuan and Yunnan, and south to Hainan, including suitable cultivation zones in Taiwan Province. The high-suitability areas, covering about 35.52 × 10⁴ km2, 3.70% of China’s total area, are chiefly found in Chongqing, the southwestern regions of Hubei Province, and the northwestern parts of Hunan Province.

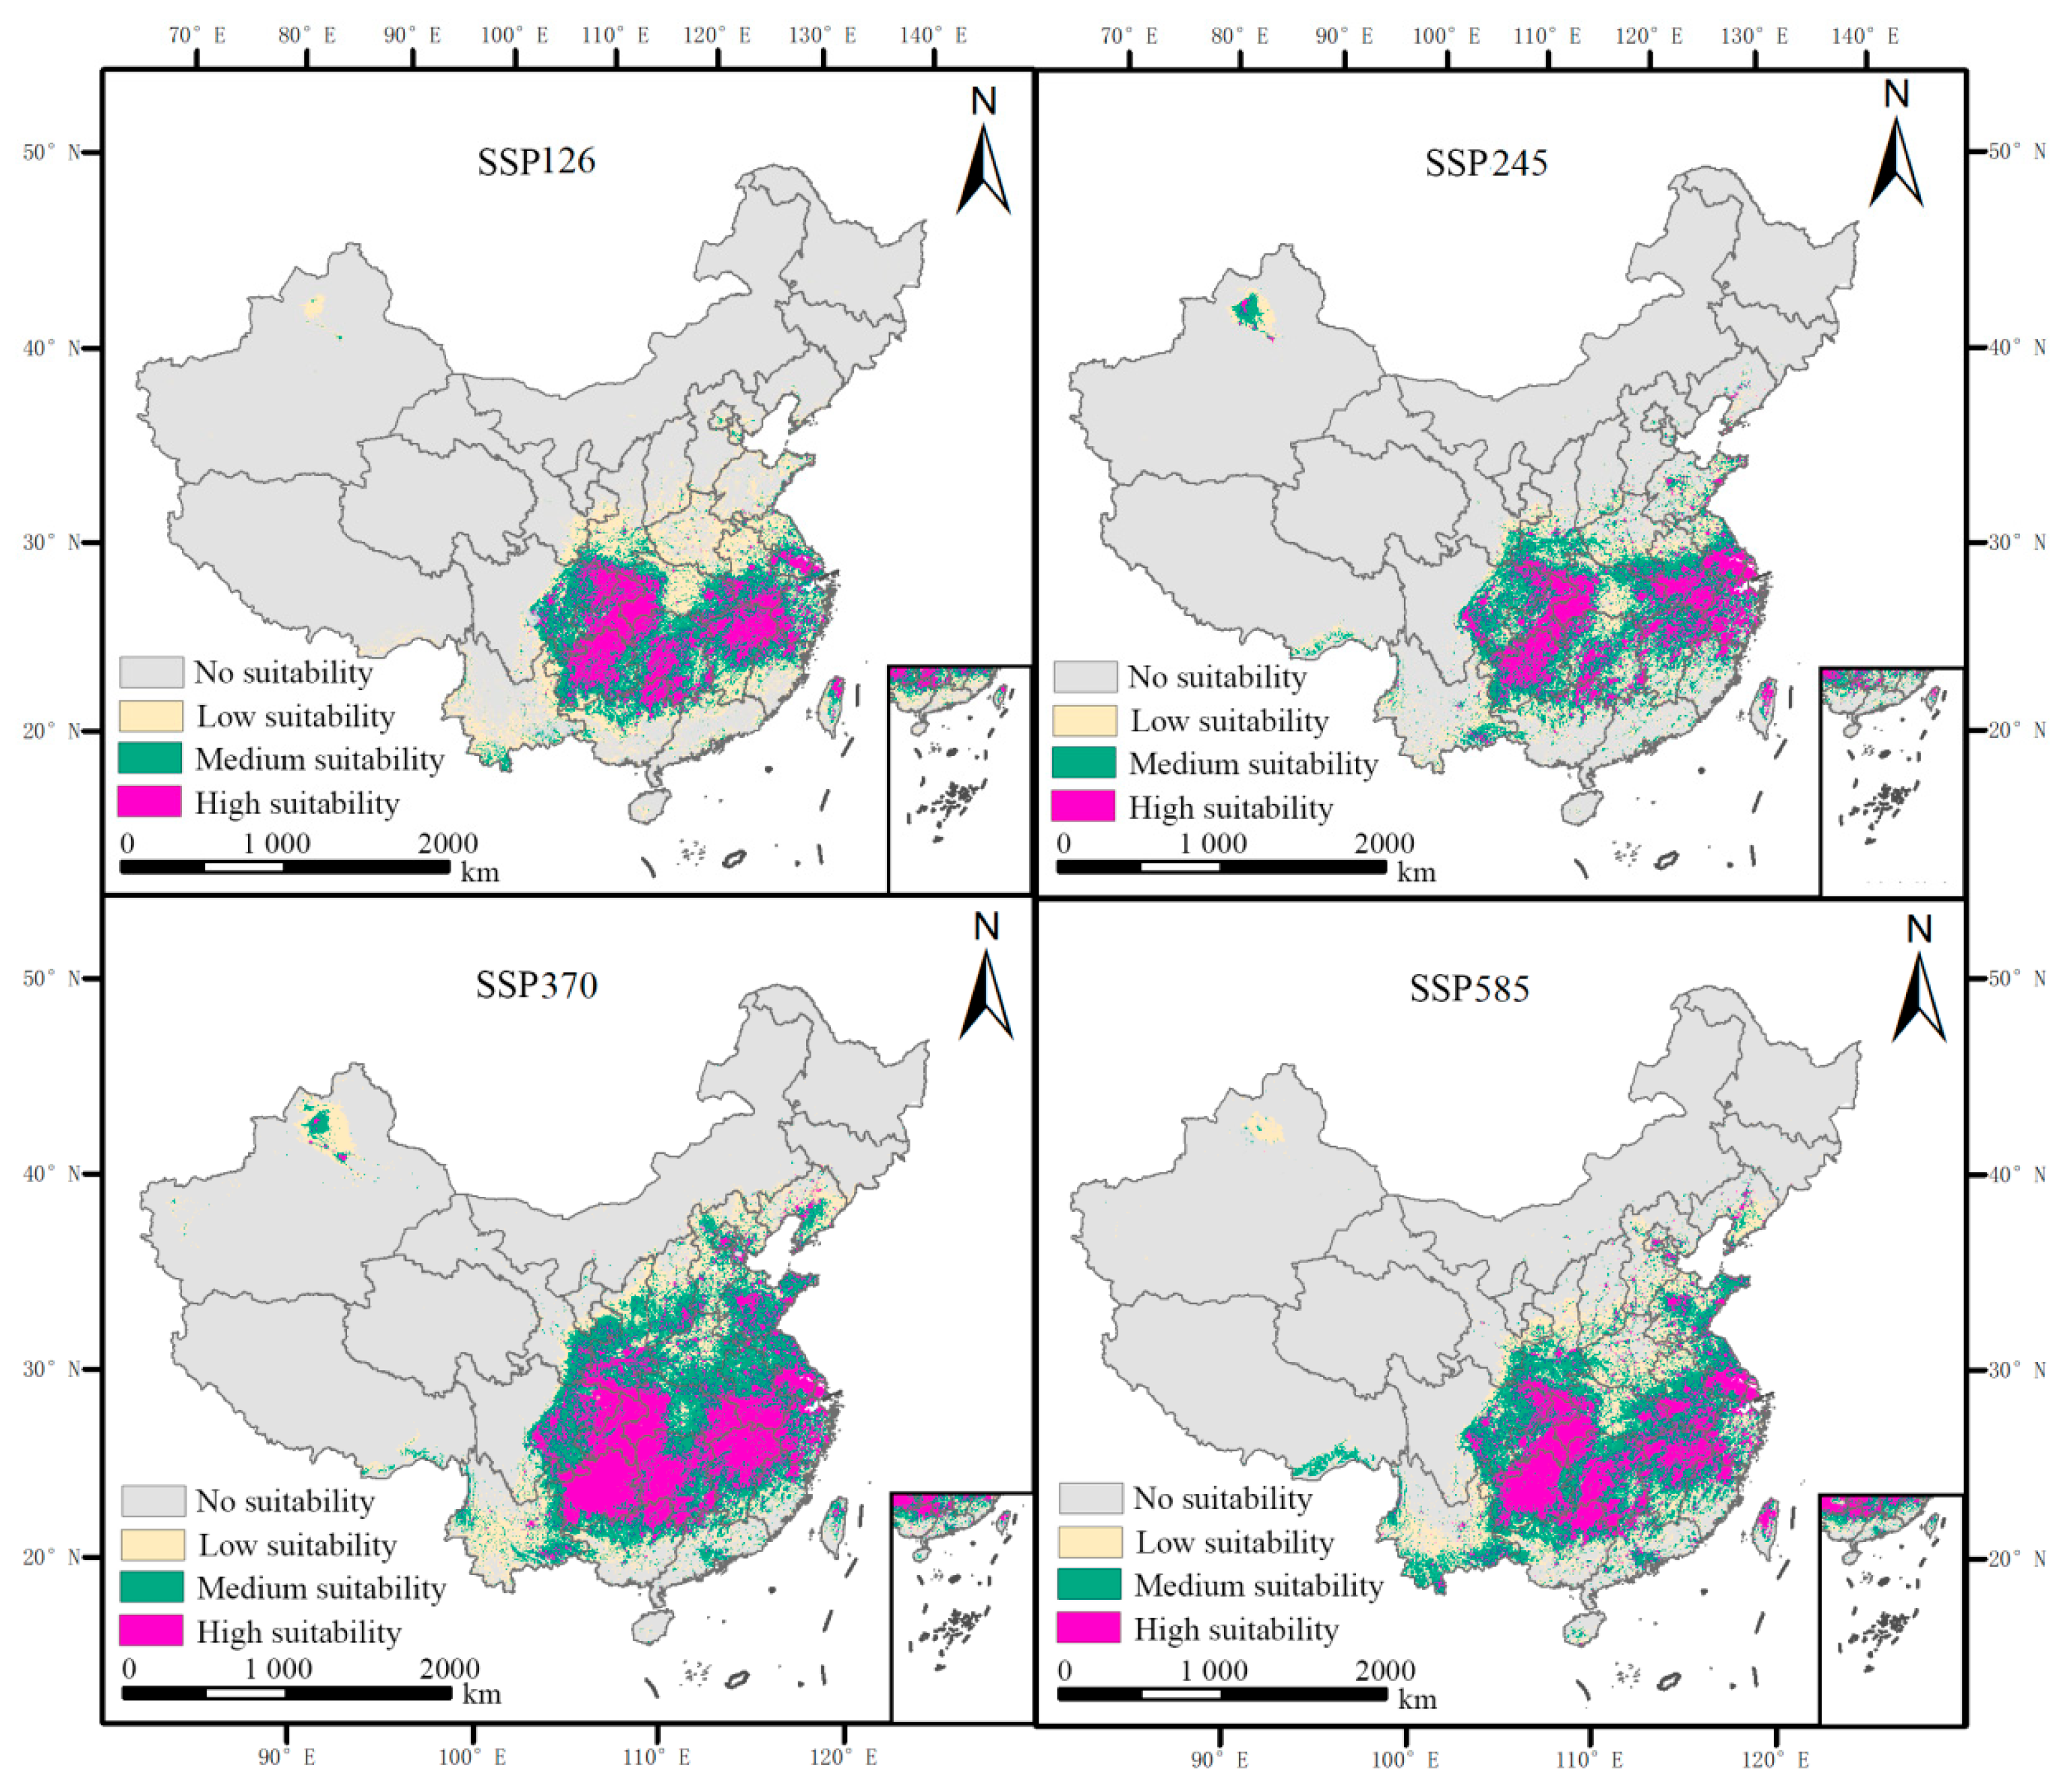
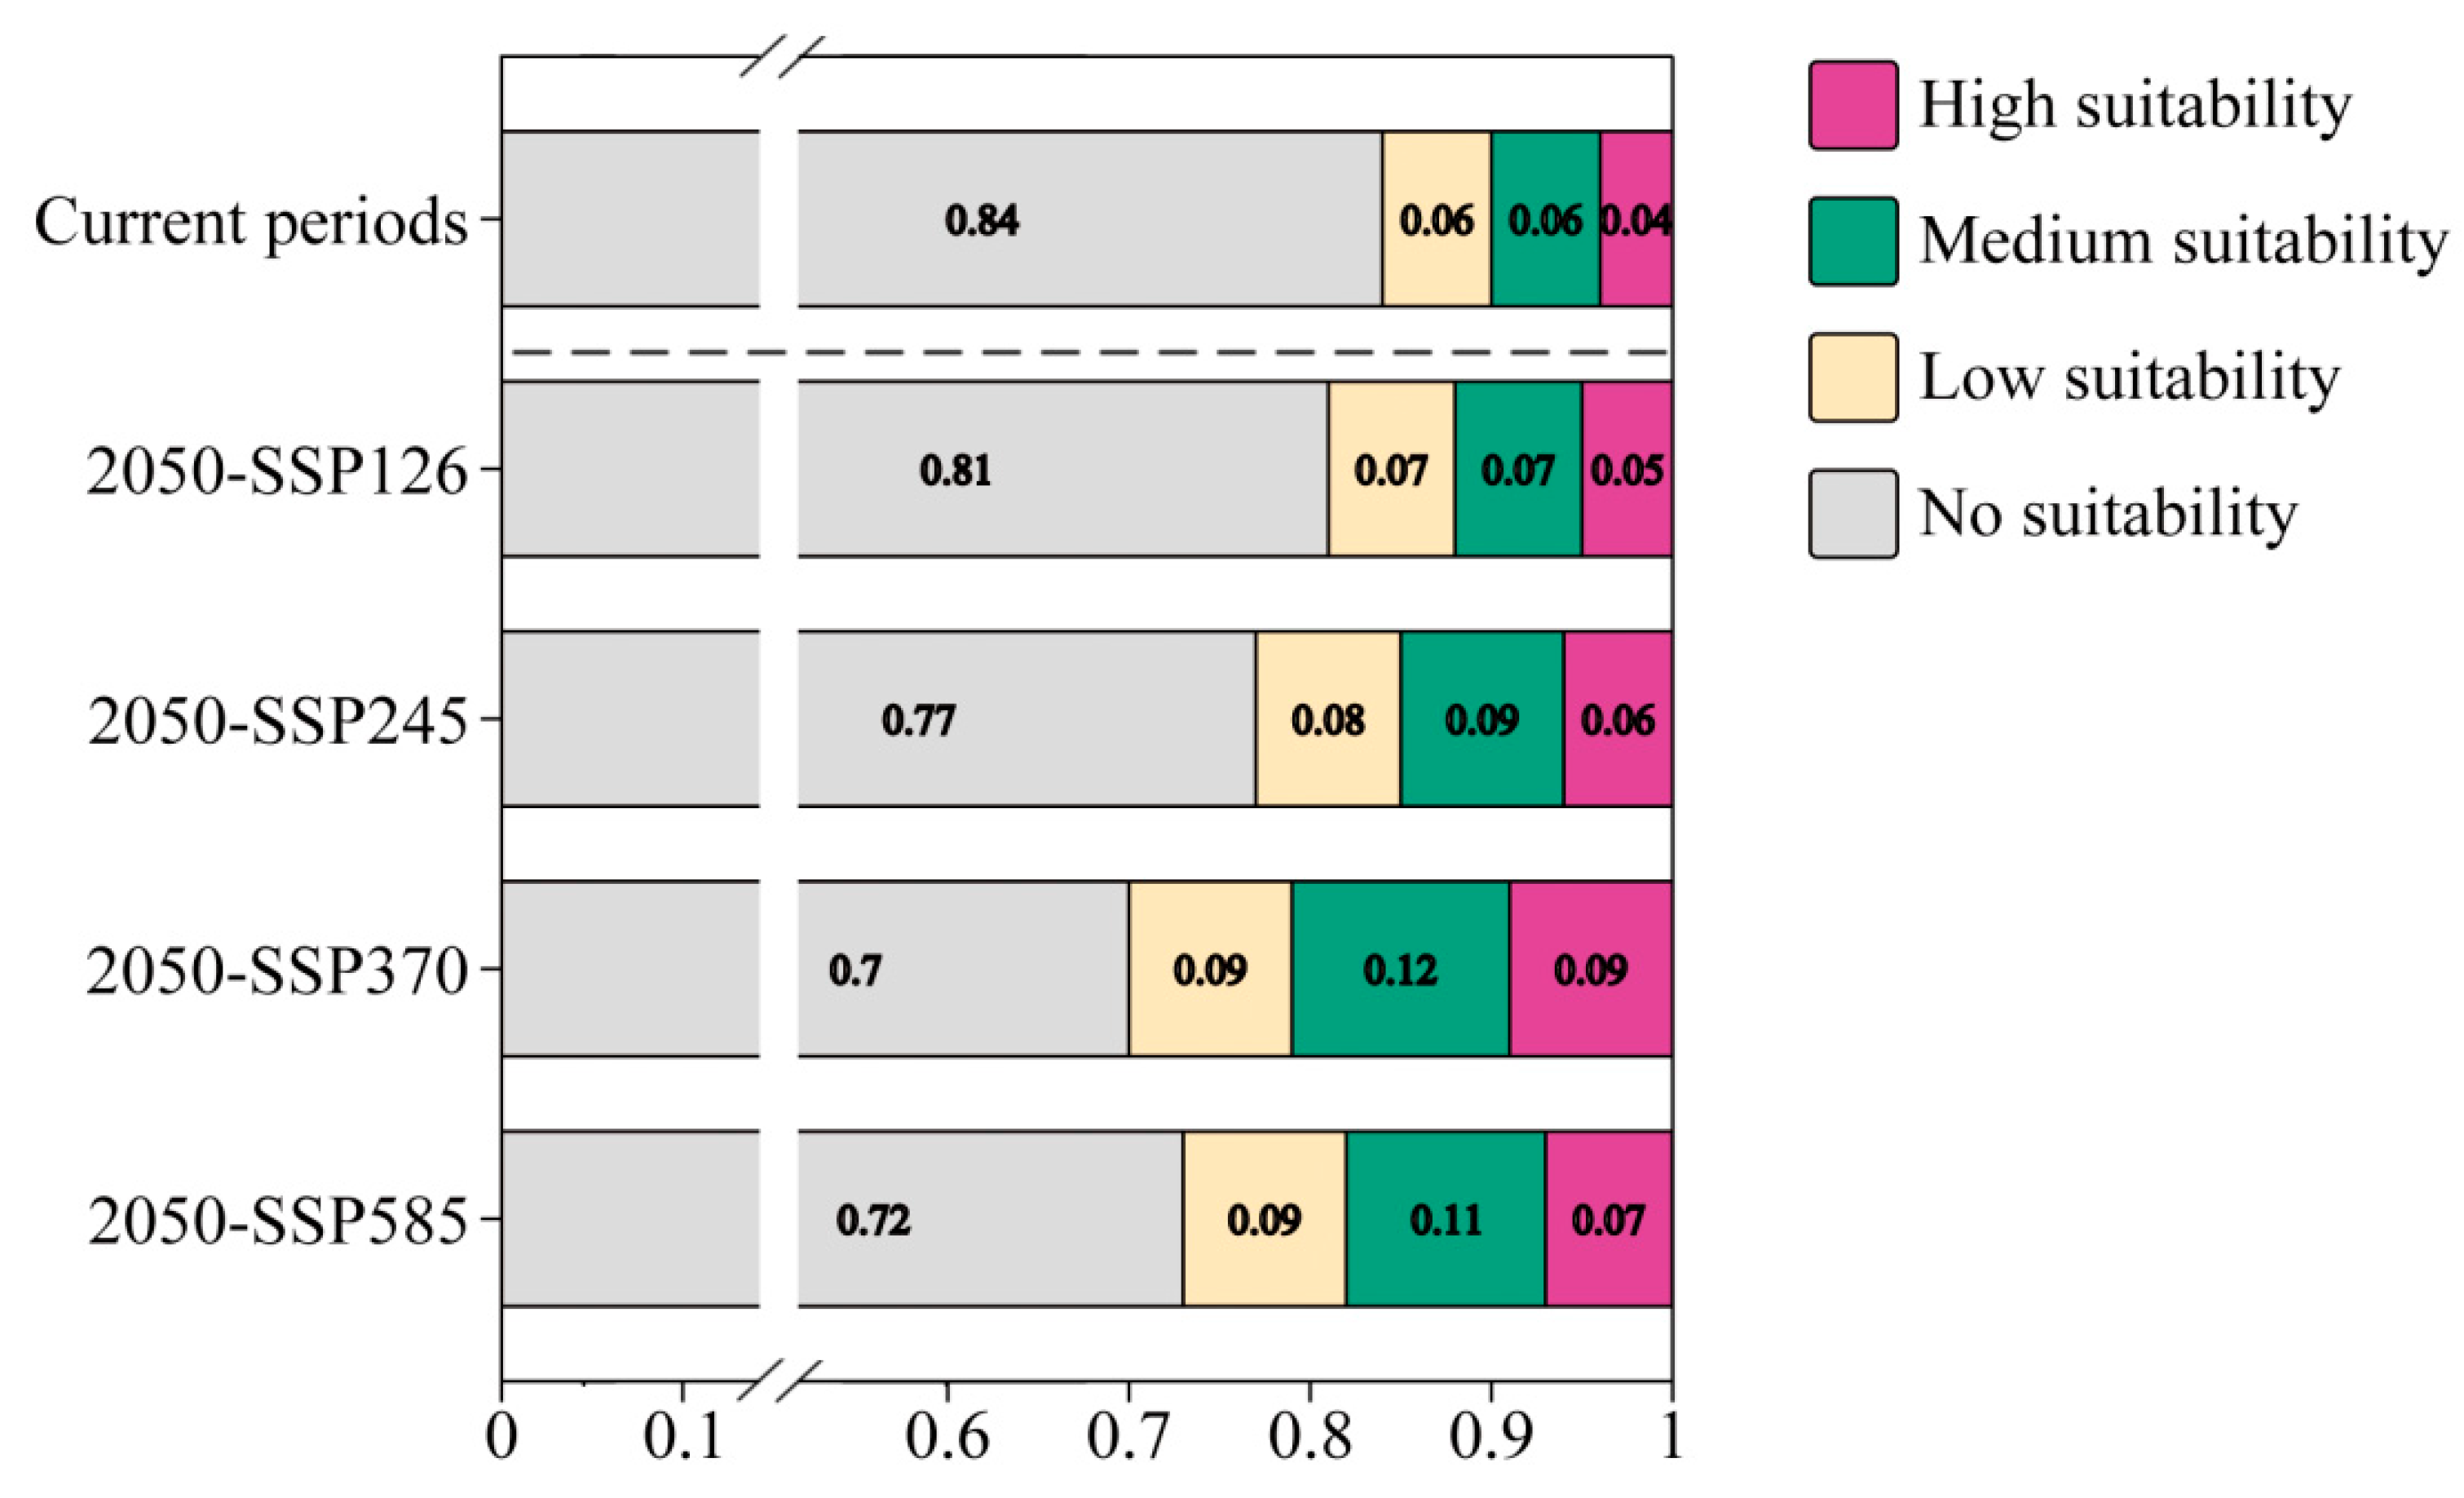
3.4. Forecasting the Impact of Future Climate Change on the Potential Geographic Distribution of L. chinense

The MaxEnt model was utilized to predict changes in the potential suitable distribution of L. chinense in China under four emission pathways for 2050: SSP126, SSP245, SSP370, and SSP585, as depicted in future climate scenarios (Figure 8).
As presented in Table 4 and Figure 8, within the context of the SSP126 carbon emission scenario by 2050, the habitat area highly suitable for L. chinense is projected to expand by 15.82 × 10⁴ km2 beyond current climatic conditions. The area of medium-suitable habitat is expected to increase by 10.79 × 10⁴ km2 and that of low-suitability habitat by 7.49 × 10⁴ km2, cumulatively enhancing the overall suitable habitat by 34.10 × 10⁴ km2. In scenario SSP245 for 2050, the expansion in highly suitable habitat areas for L. chinense is forecasted at 19.83 × 10⁴ km2, with medium-suitability areas growing by 26.85 × 10⁴ km2 and low-suitability areas by 19.02 × 10⁴ km2, totaling a significant habitat increase of 65.69 × 10⁴ km2. Under the SSP370 emission trajectory for 2050, the increase in highly suitable habitats is anticipated to be an impressive 50.51 × 10⁴ km2, with medium and low-suitability habitats expanding by 52.90 × 10⁴ km2 and 31.92 × 10⁴ km2, respectively, aggregating a substantial total habitat growth of 135.33 × 10⁴ km2. In the case of the SSP585 emission scenario for the same year, the highly suitable habitats are expected to grow by 33.52 × 10⁴ km2, with medium and low-suitability habitats seeing increases of 48.14 × 10⁴ km2 and 32.36 × 10⁴ km2, respectively, leading to an overall habitat expansion of 114.02 × 10⁴ km2.
As illustrated in Figure 9, a comparative analysis against current climatic conditions reveals that for 2050, the areas designated as suitable habitats for L. chinense under the SSP126, SSP245, SSP370, and SSP585 climate scenarios demonstrate a trend of initial expansion followed by a subsequent contraction. Specifically, the SSP370 scenario indicates the most pronounced augmentation in habitat suitability, with both high and medium-suitable regions experiencing an approximate 30% increase in area. This scenario culminates in the zenith of overall habitat suitability. Conversely, under the SSP585 scenario, characterized by the highest concentration of emissions, there is a reduction in habitat suitability areas.

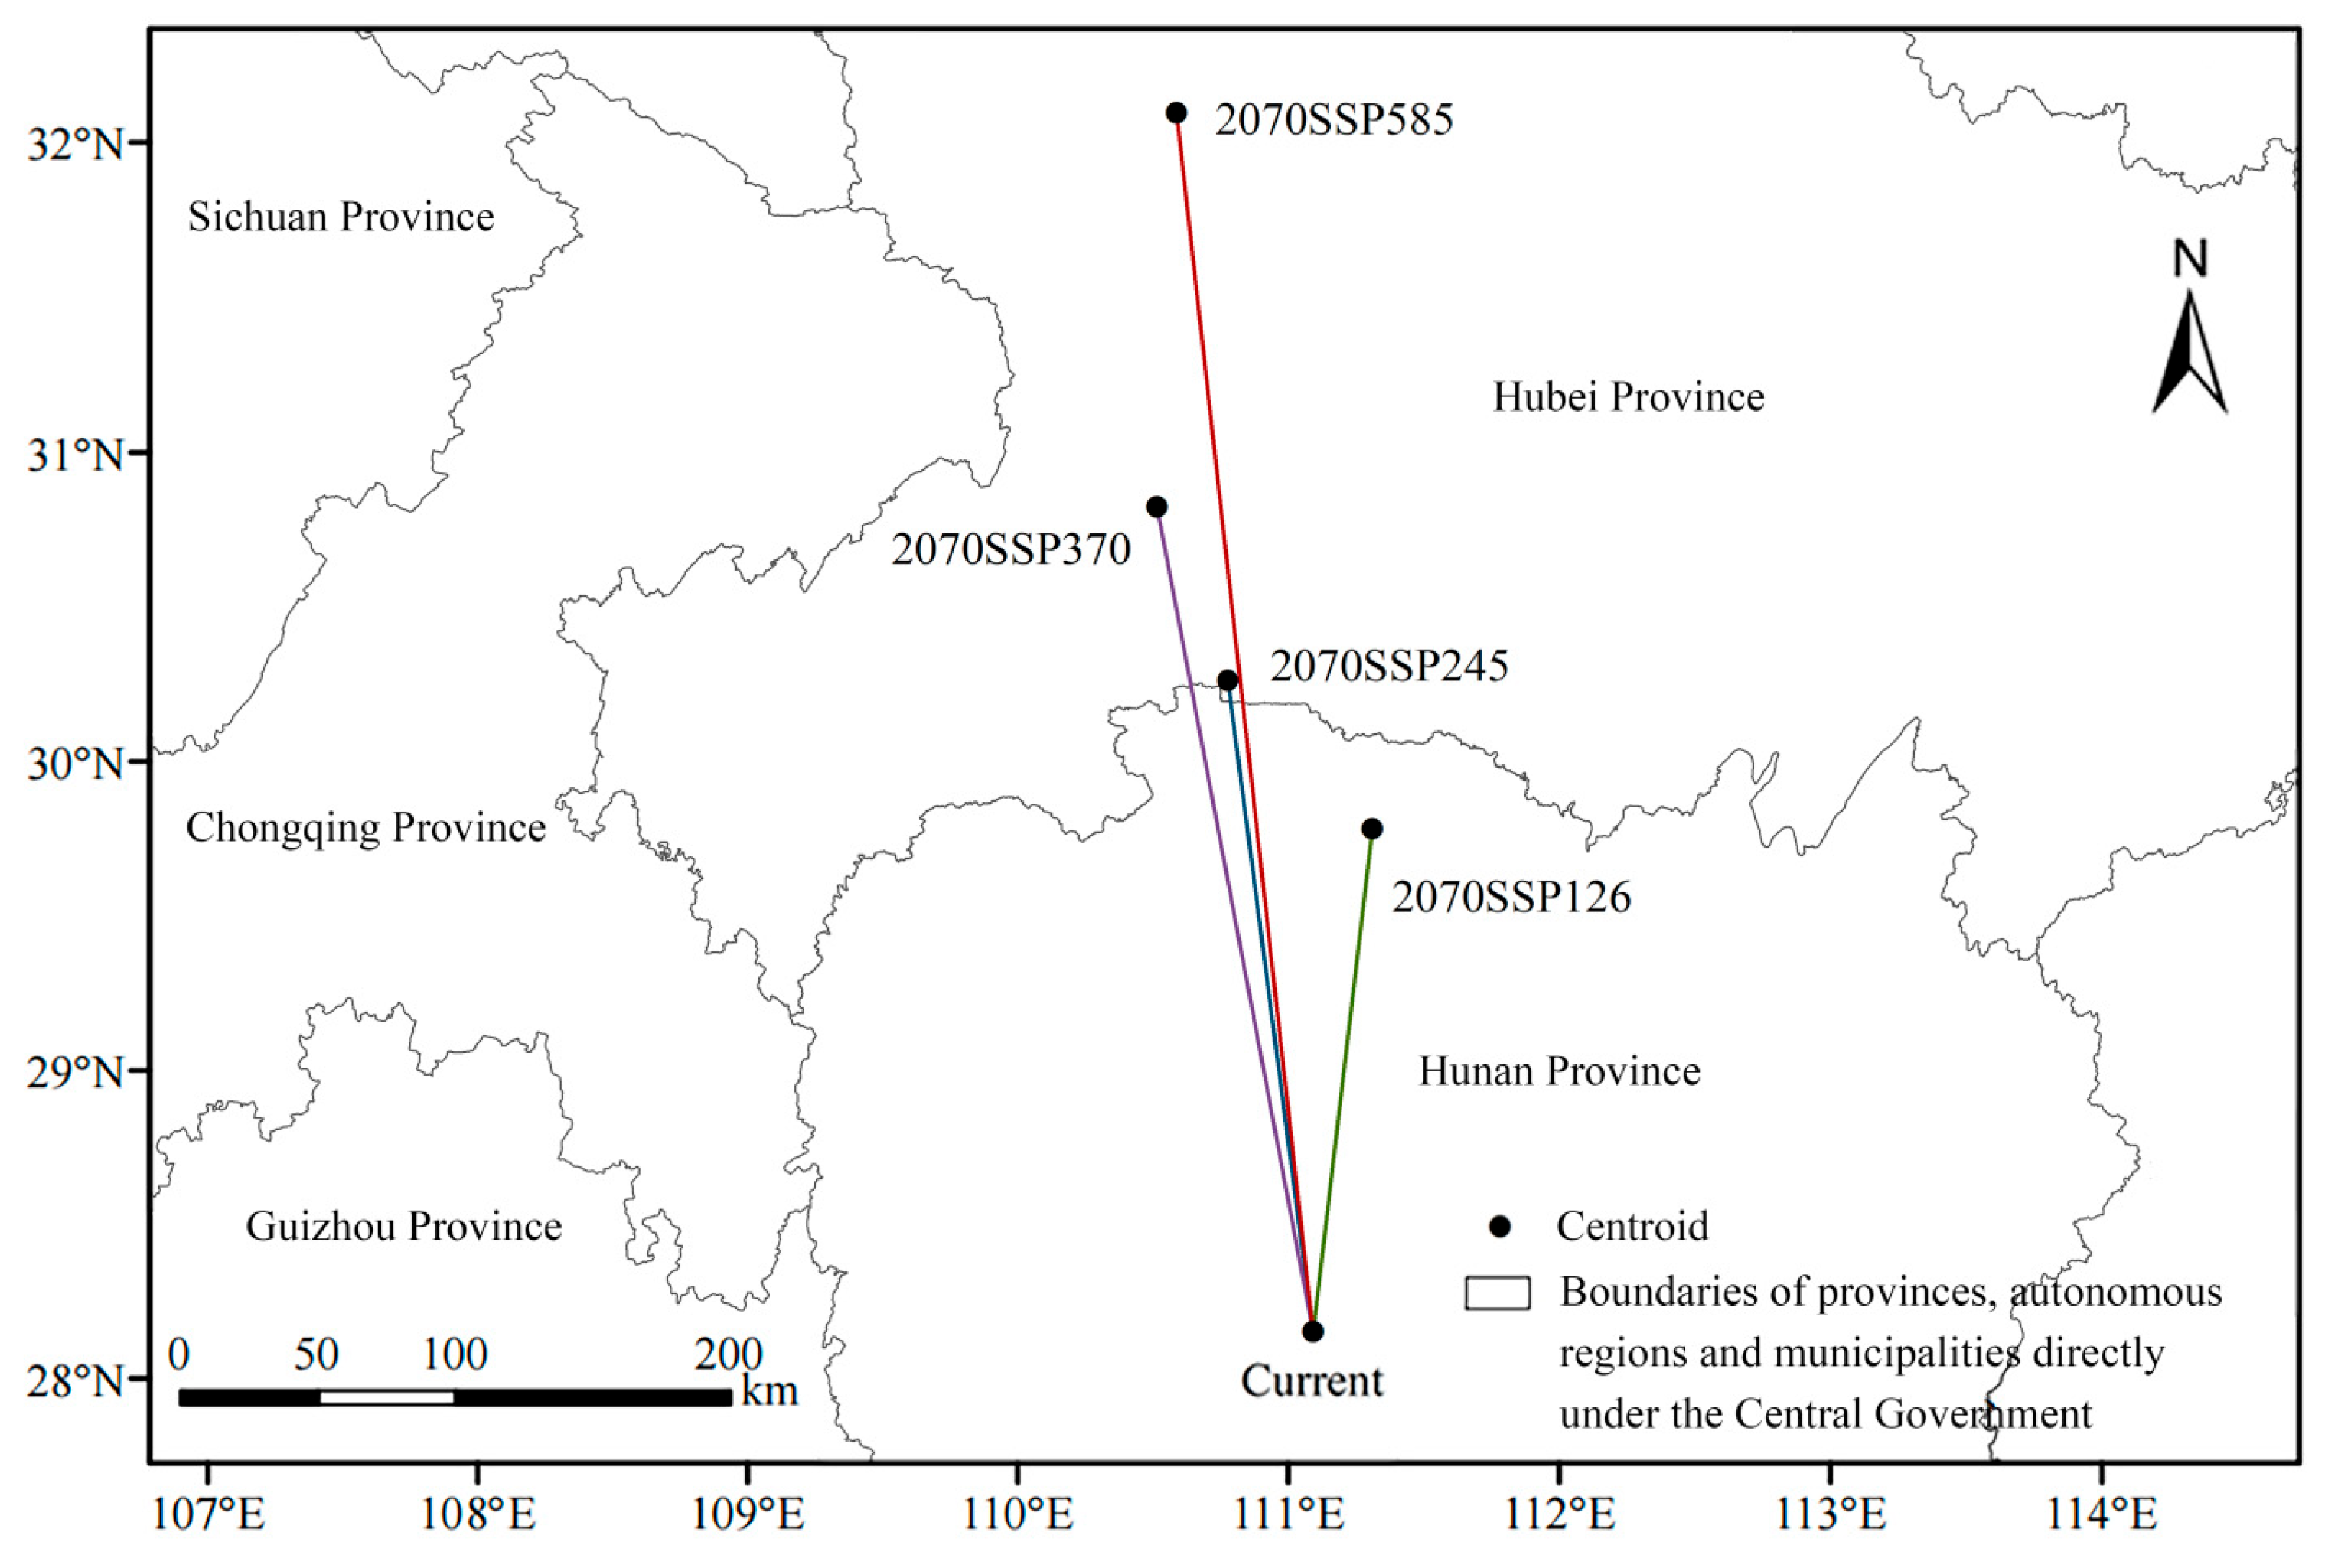
3.5. Shift in the Centroid of L. chinense’s Suitable Distribution Area

The geometric centroid results of the suitable habitats for L. chinense under four climate scenarios indicate that the centroid coordinates are located within Wufeng Tujia Autonomous County, Zigui County, and Fang County in Hubei Province, as well as Shimen County in Hunan Province, which borders Hubei. As illustrated in Table 5 and Figure 10, over time, the centroid of L. chinense’s suitable distribution areas under all four carbon emission scenarios tends to shift gradually towards the north and to higher elevation areas. Specifically, under the SSP370 carbon emission scenario, the centroid shifts the furthest distance from the current position by 446.49 km, and under the SSP585 climate scenario, it reaches the highest elevation, at 1165 m.

4. Discussion

4.1. The Influence of Environmental Variables on the Modern Potential Geographic Distribution of L. chinense

Plant survival is intimately connected with environmental conditions, with climate—encompassing both temperature and precipitation—serving as the critical determinant of plant regeneration and geographic distribution [48]. The results demonstrate that, under the prevailing climate conditions, L. chinense predominantly thrives in the transitional regions between China’s subtropical monsoon and temperate climates. The gentle and humid climate of these regions promotes the growth of L. chinense, reflecting its preference for moisture and capacity to withstand high temperatures. In the study on the distribution patterns of endemic plant groups, López-Pujol et al. [49] discovered that many relict plants, including L. chinense, have a preference for surviving in mild climatic conditions. Our research findings align with their observations.
Among the 13 environmental variables selected to influence the geographic distribution of L. chinense, precipitation of driest month(bio14) stands out as having the most significant impact, aligning with the findings of Cao et al. [24]. The overall suitability probability for L. chinense increases with greater precipitation of driest month (bio14) and quarter(bio17), consistent with the research by Elliott et al. [50]., which suggested that drought significantly affects the growth of L. chinense.
While precipitation variables play a primary role in influencing the potential geographic distribution of L. chinense, changes in temperature also represent a critical factor that cannot be overlooked. When considering the impact of climate change on vegetation distribution, the effects of temperature fluctuations on plant latitudinal migration are significant. Particularly against the backdrop of intensifying global greenhouse effects, regions limited by heat will gradually expand if natural precipitation factors are not considered, implying shifts in plant growth areas. Low temperatures significantly reduce the fluidity of cell membrane lipids, which can restrict the function of membrane proteins [51]. This restriction impacts the controlled import and export of substances, potentially leading to metabolic disorders in plants [52]. Although L. chinense has some degree of cold tolerance, the lowest temperature of the coldest month still significantly impacts its growth. Normal growth may be affected when the minimum temperature(bio6) drops below −1.38 °C or rises above 6.7 °C, closely aligning with the findings of Qiu Haojie et al. [25].
Within the multitude of factors influencing the habitat of L. chinense, elevation and human footprint emerge as significant, contributing 9.0% and 10.3%, respectively, to its distribution. Human footprint, a pivotal determinant of plant distribution dynamics, exerts both facilitative [53] and inhibitory [9] effects on the distributional shifts across different plant species. As human societies have evolved, diverse human actions—including land use alterations, deforestation, and urban expansion—have resulted in varied land use types. The study’s analysis reveals a trend in response to human footprint: an initial positive influence on the growth of L. chinense is observed, which diminishes and turns negative with increasing disturbance. This suggests an optimal threshold of human interaction beyond which the environmental stress adversely impacts the species’ survival.
Furthermore, the response curve for elevation suggests that L. chinense is more suited to grow in higher elevation areas. Consequently, the interplay of these factors, coupled with climate variables, orchestrates a complex and fragmented distribution pattern of L. chinense’s potential geographic spread.

4.2. Changes in the Geographic Distribution of L. chinense under Different Climate-Change Scenarios

Climate change has altered the structure and function of terrestrial ecosystems, therefore changing the habitats and geographic distribution of species [54,55]. Using the MaxEnt model, predictions were made regarding changes in the potential geographic distribution of L. chinense in China under future climate-change scenarios (Figure 11). The predictions indicate that by 2050, compared to current climate conditions, the range of suitable habitats for L. chinense will show characteristics of continuous expansion under low and medium-concentration pathways while slightly contracting under high-concentration pathways. The expansion areas are mainly distributed in higher latitude provinces such as Shaanxi, Henan, Shanxi, Shandong, Jiangsu, and Anhui, while suitability decreases or disappears in potential geographic distribution areas located in lower latitude regions. Guan et al. [52] suggest that global warming may facilitate the growth of certain species [56], a finding that aligns with this study’s indication of an overall increase in suitable habitat areas for L. chinense under future climate conditions. This could be related to L. chinense’s leaf heat resistance and the plant’s ability to tolerate mild drought and high temperatures [57].
However, L. chinense’s suitable ranges for temperature and precipitation are within specific limits, suggesting that continued high concentrations of greenhouse gases leading to climate change could potentially reduce or eliminate its suitable habitats, ultimately threatening the species with extinction. This highlights that increased precipitation under certain carbon emission pathways could mitigate or resolve the limitations precipitation places on the distribution of L. chinense. In contrast, the continuously rising temperatures under high-emission pathways could hinder the healthy growth of L. chinense, leading to a potential loss of geographic distribution in lower latitude areas. This aligns with Liu et al.’s [58] findings on the potential suitable habitats for Triadica sebifera in China, demonstrating a trend where the habitats slightly increase before declining as carbon emissions rise. Jiang et al. (2008) [59] reported that China’s climate in the 21st century is likely to be warmer and wetter. Warming by the end of this century is expected to range between 1.6 °C and 5 °C, with an annual precipitation increase of 1.5% to 20%. Global warming may alter the distribution patterns of soil microbial activity, therefore accelerating the decomposition of soil organic matter [60]. These factors contribute to providing suitable living conditions for plant growth. These studies collectively suggest that future climate change aligns with the species characteristics of Liriodendron chinense and its preference for warm and moist conditions, and the potentially suitable area for Liriodendron chinense is expected to expand further in the future.
Climate simulation results for the modern era indicate a predominant distribution of L. chinense in areas located in the southern part of China. In contrast, the northern regions of China, which are primarily characterized by temperate continental and monsoon climates, exhibit lower annual precipitation and cold, dry winters [61]. These climatic conditions are less conducive to the growth of L. chinense, resulting in lower habitat suitability within these areas. Intriguingly, despite the absence of natural geographic distribution data for Taiwan Province in existing records, climate simulations for the current period have identified the climatic conditions of Taiwan Province as falling within the suitable environmental range for L. chinense. This discovery opens up future prospects for the introduction and cultivation of the species in Taiwan, underscoring the potential for expanding its distribution in response to favorable climatic conditions.
Compared to its potential geographic distribution under current climate conditions, the suitable habitats for L. chinense in 2050, under four emission scenarios, exhibit a trend of shifting towards higher latitudes and elevations. This movement aligns with the findings of Zhang et al. [62], who observed a similar trend towards higher elevations in the potential geographic distribution of Populus euphratica under future climate-change scenarios. In addition, Prevey et al. [63] predicted that in the future, the distribution of Vaccinium membranaceum will decrease in the southern low-elevation areas and expand in the high-elevation and high-latitude areas. Consequently, the cultivation and maintenance of L. chinense will continue to necessitate sustained human support, both now and in the future, highlighting the importance of adaptive management practices in response to changing climatic conditions.
The results of centroids suggest that the diversity center of L. chinense’s natural distribution is within Hubei Province. This is consistent with the findings of Qiu et al. [25], who identified Hubei Province as a major potential distribution area for L. chinense. Therefore, Hubei Province could be prioritized for the relocation and conservation efforts of L. chinense in the future. China is in the East Asian monsoon region, adjacent to the Pacific Ocean. Studies have indicated that due to future global climate changes, temperatures in China’s coastal areas are expected to rise significantly. Consequently, vegetation is projected to migrate northward [61]. The centroids show a trend of moving northward and toward higher elevations, aligning with previous research findings that centroids migrate with climate warming [64].

4.3. Methodological Limitation

(1)
Data collection: This study only collected and analyzed distribution data within China. Hence, the environmental factor response curves may not fully reflect the response of L. chinense to environmental changes. Moreover, the species distribution data covers the years 1970–2020, which does not completely synchronize with the climate data spanning from 1970 to 2000. This temporal mismatch is particularly relevant given that L. chinense, as a woody plant, exhibits a longer growth cycle, necessitating a broader time range to gather a comprehensive dataset. Although such temporal discrepancies are common in ecological research and generally do not significantly alter the analytical outcomes—especially in studies focused on long-term climatic effects [65]—they could potentially limit the precision of our findings. For future studies, expanding the data collection to include global distribution data of L. chinense would enhance our understanding of its responses to diverse environmental conditions. Additionally, ensuring tighter temporal alignment between species distribution and climate data will improve the accuracy of our response curve analyses and make our conclusions more robust.
(2)
Temporal scope and forecasting limits: The future of climate change holds many uncertainties, and this study only utilizes the BCC-CMS2-MR GCM to simulate the potentially suitable habitats for L. chinense, which increases the instability of the MaxEnt model’s predictions and leads to certain errors in geographic distribution and area occurrence. This can affect decision-makers’ ability to formulate ecological protection measures. Previous studies have demonstrated that employing multiple GCMs significantly diminishes uncertainties and errors in predictions [66,67]. Future research on predicting the potential suitable habitats for L. chinense should also adopt this approach. Furthermore, our study only utilized climate scenario data for 2050, which may not adequately reflect changes in the suitable habitat of L. chinense over different future time periods. While we acknowledge that there are high-quality climate datasets available for nearer periods, such as 2020–2040, our choice was guided by the need to provide insights into future climatic conditions that match the time frames most relevant to policy and decision-making processes. Using the 2041–2060 period provides a balance between near-term forecasting and long-term strategic planning. To more accurately predict the potential geographic distribution changes in L. chinense, it is recommended that future research employs dynamic analysis and comparison at multiple time points.
(3)
Consideration of ecological factors: In predicting the potential suitable areas for L. chinense, this study primarily focused on factors such as climate, altitude, and human footprint without fully considering biological factors like interspecies interactions. Given the existence of interactions and dependencies between species [68], these complex ecological relationships could impact the actual climate adaptability and survival conditions of species [69]. Therefore, the predicted potentially suitable areas might deviate from actual conditions. Future research should explore a wider range of ecological factors, including soils, land cover, and interspecies interactions, in greater detail to enhance the accuracy of predictions regarding the potentially suitable areas for L. chinense.
Despite the aforementioned limitations, this study is the first time to employ the ENMeval package to optimize the MaxEnt model to predict with high reliability the potentially suitable areas for L. chinense, providing an important scientific basis for its conservation and introduction. There are many powerful methods based on machine learning and statistical data, such as information gain, the Gini index, random forest, relief, ANOVA, and Chi-square, which have shown good performance in optimizing MaxEnt models [70]. It would be worthwhile to explore the application of these methods for model optimization and parameter tuning in future studies. We will address these limitations with adjustments and improvements, further refining the future study of the potential distribution of L. chinense to more accurately guide its conservation and introduction efforts.

5. Conclusions

This research utilizes the MaxEnt model, enhanced by the ENMeval package, to forecast the potential habitats and distribution patterns of the endangered species, L. chinense, both in the current periods and under future 2050s climate scenarios, across four carbon emission pathways. The study yields the following conclusions:
(1)
Under current climate conditions, the potential suitable habitat area for L. chinense spans 147.55 × 10⁴ km2, accounting for 15.01% of China’s land area. It is primarily distributed in central, southern, and southwestern China, with cultivation also present in Taiwan Province.
(2)
Precipitation in the driest month, precipitation in the driest quarter, precipitation in the warmest quarter, minimum temperature of the coldest month, altitude, and human footprint are the dominant factors influencing the suitable habitat distribution of L. chinense. Among these, precipitation in the driest month (bio14) is the most critical determinant of the suitable environment for L. chinense.
(3)
Under future climate scenarios, with increasing carbon concentrations, the distribution range of L. chinense is expected to initially expand and then contract, reaching its maximum expansion under the SSP370 emission scenario.
(4)
In the future 2050s climate scenarios, the centroid of L. chinense’s distribution is predicted to shift from lower latitudes to higher latitudes in the north and from lower to higher elevations.

Author Contributions

Conceptualization, J.B., H.W. and Y.H.; methodology, J.B.; software, J.B.; validation, J.B., H.W. and Y.H.; formal analysis, J.B.; investigation, J.B.; resources, J.B.; data curation, J.B.; writing—original draft preparation, J.B.; writing—review and editing, J.B., H.W. and Y.H.; visualization, J.B.; supervision, H.W.; project administration, H.W.; funding acquisition, Y.H. All authors have read and agreed to the published version of the manuscript.

Funding

This research was funded by the National Natural Science Foundation of China Key Program (Grant No. 52038007).

Data Availability Statement

Data are contained within the article.

Acknowledgments

We appreciate the valuable feedback of reviewers and editors on the manuscript.

Conflicts of Interest

The authors declare no conflicts of interest.

References

  1. IPCC. Climate Change 2021: The Physical Science Basis. Contribution of Working Group I to the Sixth Assessment Report of the Intergovernmental Panel on Climate Change; Cambridge University Press: Cambridge, UK; New York, NY, USA, 2021. [Google Scholar]
  2. Xiang, J.; Zhang, L.; Deng, Y.; She, D.; Zhang, Q. Projection and evaluation of extreme temperature and precipitation in major regions of China by CMIP6 models. Eng. J. Wuhan Univ. 2021, 54, 46–57. [Google Scholar]
  3. Ostad-Ali-Askar, K.; Su, R.; Liu, L. Editorial: Water resources and climate change. J. Water Clim. Change 2018, 9, 239. [Google Scholar] [CrossRef]
  4. Anderegg, W.R.L.; Berry, J.A.; Smith, D.D.; Sperry, J.S.; Anderegg, L.D.L.; Field, C.B. The roles of hydraulic and carbon stress in a widespread climate-induced forest die-off. Proc. Natl. Acad. Sci. USA 2012, 109, 233–237. [Google Scholar] [CrossRef]
  5. Scholze, M.; Knorr, W.; Arnell, N.W.; Prentice, I.C. A climate-change risk analysis for world ecosystems. Proc. Natl. Acad. Sci. USA 2006, 103, 13116–13120. [Google Scholar] [CrossRef]
  6. Vermeiren, P.; Reichert, P.; Schuwirth, N. Integrating uncertain prior knowledge regarding ecological preferences into multi-species distribution models: Effects of model complexity on predictive performance. Ecol. Model. 2020, 420, 108956. [Google Scholar] [CrossRef]
  7. Chen, W.; Wei, J.; Zhu, K.; Lu, Y.; Cai, Y.; Wu, Q.; Huang, Z.; Wang, Y. Predicting potential distribution of Emmenopterys henryi in Southwest China based on the Maxent model and influencing factors. Trop. Ecol. 2022, 63, 572–583. [Google Scholar] [CrossRef]
  8. He, Y.; Ma, J.; Chen, G. Potential geographical distribution and its multi-factor analysis of Pinus massoniana in China based on the maxent model. Ecol. Indic. 2023, 154, 110790. [Google Scholar] [CrossRef]
  9. Xu, L.; Fan, Y.; Zheng, J.; Guan, J.; Lin, J.; Wu, J.; Liu, L.; Wu, R.; Liu, Y. Impacts of climate change and human activity on the potential distribution of Aconitum leucostomum in China. Sci. Total Environ. 2024, 912, 168829. [Google Scholar] [CrossRef]
  10. Parmesan, C. Ecological and evolutionary responses to recent climate change. Annu. Rev. Ecol. Evol. Syst. 2006, 37, 637–669. [Google Scholar] [CrossRef]
  11. Wiens, J.A.; Stralberg, D.; Jongsomjit, D.; Howell, C.A.; Snyder, M.A. Niches, models, and climate change: Assessing the assumptions and uncertainties. Proc. Natl. Acad. Sci. USA 2009, 106, 19729–19736. [Google Scholar] [CrossRef]
  12. Zhao, X.; Lei, M.; Wei, C.; Guo, X. Assessing the suitable regions and the key factors for three Cd-accumulating plants (Sedum alfredii, Phytolacca americana, and Hylotelephium spectabile) in China using MaxEnt model. Sci. Total Environ. 2022, 852, 158202. [Google Scholar] [CrossRef]
  13. Booth, T.H.; Nix, H.A.; Busby, J.R.; Hutchinson, M.F. BIOCLIM: The first species distribution modelling package, its early applications and relevance to most current MAXENT studies. Divers Distrib 2014, 20, 1–9. [Google Scholar] [CrossRef]
  14. Qin, X.; Li, M. Predicting the Potential Distribution of Oxalis debilis Kunth, an Invasive Species in China with a Maximum Entropy Model. Plants 2023, 12, 3999. [Google Scholar] [CrossRef]
  15. Wang, G.; Geng, Q.; Xiao, M.; Zhang, M.; Wang, Z. Predicting Pseudolarix amabilis potential habitat based on four Niche models. Acta Ecol. Sin. 2020, 40, 6096–6104. [Google Scholar]
  16. Ashraf, U.; Peterson, A.T.; Chaudhry, M.N.; Ashraf, I.; Saqib, Z.; Ahmad, S.R.; Ali, H. Ecological niche model comparison under different climate scenarios: A case study of Olea spp. in Asia. Ecosphere 2017, 8, e01825. [Google Scholar] [CrossRef]
  17. Ye, X.; Zhao, G.; Zhang, M.; Cui, X.; Fan, H.; Liu, B. Distribution Pattern of Endangered Plant Semiliquidambar cathayensis (Hamamelidaceae) in Response to Climate Change after the Last Interglacial Period. Forests 2020, 11, 434. [Google Scholar] [CrossRef]
  18. Liu, C.; Huo, H.; Tian, L.; Dong, X.; Qi, D.; Zhang, Y.; Xu, J.; Cao, Y. Potential geographical distribution of Pyrus calleryana under different climate change scena-rios based on the MaxEnt model. Chin. J. Appl. Ecol. 2018, 29, 3696–3704. [Google Scholar]
  19. Dirr, M.A. Manual of Woody Landscape Plants: Their Identification, Ornamental Characteristics, Culture, Propagation and Uses; Stipes Publishing CoS: Champaign, IL, USA, 1990; p. 1007. [Google Scholar]
  20. Wei, P.; Jia, C.; Zhou, Y.; Gu, Y.; Luo, J. A study of wood physical and mechanical properties and vertical variation characteristics of natural Liriodendron. J. Sichuan For. Sci. Technol. 2018, 39, 27–31. [Google Scholar]
  21. Xue, W.; LI, C.; Ai, X.; Yao, L.; Guo, Q.; Zhu, J. Niche and interspecific association of dominant tree species in Liriodendron chinense natural forest. J. For. Environ. 2023, 43, 26–34. [Google Scholar]
  22. IUCN Species and Climate Change. Available online: https://www.iucn.org/resources/issues-brief/species-and-climate-change (accessed on 2 April 2024).
  23. IUCN The IUCN Red List of Threatened Species. Available online: https://www.iucnredlist.org/ (accessed on 1 January 2024).
  24. Cao, Y.; Feng, J.; Hwarari, D.; Ahmad, B.; Wu, H.; Chen, J.; Yang, L. Alterations in Population Distribution of Liriodendron chinense (Hemsl.) Sarg. and Liriodendron tulipifera Linn. Caused by Climate Change. Forests 2022, 13, 488. [Google Scholar] [CrossRef]
  25. Qiu, H.; Sun, J.; Xu, D.; Shen, A.; Jiang, B.; Yuan, W.; Li, S. MaxEnt model-based prediction of potential distribution of Liriodendron chinense in China. J. Zhejiang A F Univ. 2020, 37, 1–8. [Google Scholar]
  26. Li, D.; Li, Z.; Liu, Z.; Yang, Y.; Khoso, A.G.; Wang, L.; Liu, D. Climate change simulations revealed potentially drastic shifts in insect community structure and crop yields in China’s farmland. J. Pest Sci. 2023, 96, 55–69. [Google Scholar] [CrossRef]
  27. Fick, S.E.; Hijmans, R.J. WorldClim 2: New 1-km spatial resolution climate surfaces for global land areas. Int. J. Clim. 2017, 37, 4302–4315. [Google Scholar] [CrossRef]
  28. Venter, O.; Sanderson, E.W.; Magrach, A.; Allan, J.R.; Beher, J.; Jones, K.R.; Possingham, H.P.; Laurance, W.F.; Wood, P.; Fekete, B.M.; et al. Global terrestrial Human Footprint maps for 1993 and 2009. Sci. Data 2016, 3, 160067. [Google Scholar] [CrossRef] [PubMed]
  29. Eyring, V.; Bony, S.; Meehl, G.A.; Senior, C.A.; Stevens, B.; Stouffer, R.J.; Taylor, K.E. Overview of the Coupled Model Intercomparison Project Phase 6 (CMIP6) experimental design and organization. Geosci. Model Dev. 2024, 9, 1937–1958. [Google Scholar] [CrossRef]
  30. Lee, H.; Calvin, K.; Dasgupta, D. Climate Change 2023: Synthesis Report; Contribution of Working Groups I, II and III to the Sixth Assessment Report of the Intergovernmental Panel on Climate Change; The Australian National University: Canberra, ACT, Australia, 2023. [Google Scholar]
  31. Shi, X.; Wang, J.; Zhang, L.; Chen, S.; Zhao, A.; Ning, X.; Fan, G.; Wu, N.; Zhang, L.; Wang, Z. Prediction of the potentially suitable areas of Litsea cubeba in China based on future climate change using the optimized MaxEnt model. Ecol. Indic. 2023, 148, 110093. [Google Scholar] [CrossRef]
  32. Jarnevich, C.S.; Stohlgren, T.J.; Kumar, S.; Morisette, J.T.; Holcombe, T.R. Caveats for correlative species distribution modeling. Ecol. Inf. 2015, 29, 6–15. [Google Scholar] [CrossRef]
  33. Li, Y.; Shao, W.; Jiang, J. Predicting the potential global distribution of Sapindus mukorossi under climate change based on MaxEnt modelling. Environ. Sci. Pollut. Res. 2022, 29, 21751–21768. [Google Scholar] [CrossRef] [PubMed]
  34. Li, J.; Deng, C.; Duan, G.; Wang, Z.; Zhang, Y.; Fan, G. Potentially suitable habitats of Daodi goji berry in China under climate change. Front. Plant Sci. 2024, 14, 1279019. [Google Scholar] [CrossRef]
  35. Zhang, S.; Liu, X.; Li, R.; Wang, X.; Cheng, J.; Yang, Q.; Kong, H. AHP-GIS and MaxEnt for delineation of potential distribution of Arabica coffee plantation under future climate in Yunnan, China. Ecol. Indic. 2021, 132, 108339. [Google Scholar] [CrossRef]
  36. Kass, J.M.; Muscarella, R.; Galante, P.J.; Bohl, C.L.; Pinilla-Buitrago, G.E.; Boria, R.A.; Soley-Guardia, M.; Anderson, R.P. ENMeval 2.0: Redesigned for customizable and reproducible modelling of species’ niches and distributions. Methods Ecol. Evol. 2021, 12, 1602–1608. [Google Scholar] [CrossRef]
  37. Muscarella, R.; Galante, P.J.; Soley-Guardia, M.; Boria, R.A.; Kass, J.M.; Uriarte, M.; Anderson, R.P. ENMeval: An R package for conducting spatially independent evaluations and estimating optimal model complexity for MAXENT ecological niche models. Methods Ecol. Evol. 2014, 5, 1198–1205. [Google Scholar] [CrossRef]
  38. Wan, G.; Wang, L.; Jin, L.; Chen, J. Evaluation of environmental factors affecting the quality of Codonopsis pilosula based on chromatographic fingerprint and MaxEnt model. Ind. Crop. Prod. 2021, 170, 113783. [Google Scholar] [CrossRef]
  39. Hou, J.; Xiang, J.; Li, D.; Liu, X. Prediction of Potential Suitable Distribution Areas of Quasipaa spinosa in China Based on MaxEnt Optimization Model. Biology 2023, 12, 366. [Google Scholar] [CrossRef] [PubMed]
  40. Franco, A.C.S.; Lorini, M.L.; Minsky, E.M.C.; Figueiredo, M.S.L.; Santos, L.N. Far beyond the Amazon: Global distribution, environmental suitability, and invasive potential of the two most introduced peacock bass. Biol. Invasions 2022, 24, 2851–2872. [Google Scholar] [CrossRef]
  41. Allouche, O.; Tsoar, A.; Kadmon, R. Assessing the accuracy of species distribution models: Prevalence, kappa and the true skill statistic (TSS). J. Appl. Ecol. 2006, 43, 1223–1232. [Google Scholar] [CrossRef]
  42. Preau, C.; Trochet, A.; Bertrand, R.; Isselin-Nondedeu, F. Modeling Potential Distributions of Three European Amphibian Species Comparing ENFA and Maxent. Herpetol. Conserv. Biol. 2018, 13, 91–104. [Google Scholar]
  43. Xu, Z.; Ding, G.; Liu, B.; Chi, C.; Xiao, W.; JIn, X.; Li, C. Geographic distribution and predicton of potential suitable regions of Iva xanthifolia. Acta Pratacult. Sin. 2012, 21, 75–83. [Google Scholar]
  44. Yang, J.; Huang, Y.; Jiang, X.; Chen, H.; Liu, M.; Wang, R. Potential geographical distribution of the edangred plant Isoetes under human activities using MaxEnt and GARP. Glob. Ecol. Conserv. 2022, 38, e02186. [Google Scholar] [CrossRef]
  45. Zhang, K.; Yao, L.; Meng, J.; Tao, J. Maxent modeling for predicting the potential geographical distribution of two peony species under climate change. Sci. Total Environ. 2018, 634, 1326–1334. [Google Scholar] [CrossRef]
  46. Phillips, S.J.; Anderson, R.P.; Schapire, R.E. Maximum entropy modeling of species geographic distributions. Ecol. Model. 2006, 190, 231–259. [Google Scholar] [CrossRef]
  47. Roberts, D.R.; Bahn, V.; Ciuti, S.; Boyce, M.S.; Elith, J.; Guillera-Arroita, G.; Hauenstein, S.; Lahoz-Monfort, J.J.; Schroeder, B.; Thuiller, W.; et al. Cross-validation strategies for data with temporal, spatial, hierarchical, or phylogenetic structure. Ecography 2017, 40, 913–929. [Google Scholar] [CrossRef]
  48. Thuiller, W. Biodiversity-Climate change and the ecologist. Nature 2007, 448, 550–552. [Google Scholar] [CrossRef]
  49. Lopez-Pujol, J.; Zhang, F.; Sun, H.; Ying, T.; Ge, S. Centres of plant endemism in China: Places for survival or for speciation ? J. Biogeogr. 2011, 38, 1267–1280. [Google Scholar] [CrossRef]
  50. Elliott, K.J.; Miniat, C.F.; Pederson, N.; Laseter, S.H. Forest tree growth response to hydroclimate variability in the southern Appalachians. Glob. Change Biol. 2015, 21, 4627–4641. [Google Scholar] [CrossRef]
  51. Wang, Y.; Wang, J.; Sarwar, R.; Zhang, W.; Geng, R.; Zhu, K.; Tan, X. Research progress on the physiological response and molecular mechanism of cold response in plants. Front. Plant Sci. 2024, 15, 1334913. [Google Scholar] [CrossRef] [PubMed]
  52. Cano-Ramirez, D.L.; Carmona-Salazar, L.; Morales-Cedillo, F.; Ramirez-Salcedo, J.; Cahoon, E.B.; Gavilanes-Ruiz, M. Plasma Membrane Fluidity: An Environment Thermal Detector in Plants. Cells 2021, 10, 2778. [Google Scholar] [CrossRef]
  53. Amat, M.E.; Vargas, P.; Gomez, J.M. Effects of human activity on the distribution and abundance of an endangered Mediterranean high-mountain plant (Erysimum penyalarense). J. Nat. Conserv. 2013, 21, 262–271. [Google Scholar] [CrossRef]
  54. Ghini, R.; Hamada, E.; Angelotti, F.; Costa, L.B.; Bettiol, W. Research approaches, adaptation strategies, and knowledge gaps concerning the impacts of climate change on plant diseases. Trop. Plant Pathol. 2012, 37, 5–24. [Google Scholar]
  55. Jo, W.S.; Kim, H.; Kim, B.J. Climate change alters diffusion of forest pest: A model study. J. Korean Phys. Soc. 2017, 70, 108–115. [Google Scholar] [CrossRef]
  56. Guan, X.; Shi, W.; Cao, K. Effect of Climate Change in Future on Geographical Distribution of Widespread Quercus acutissima and Analysis of Dominant Climatic Factors. J. Trop. Subtrop. Bot. 2018, 26, 661–668. [Google Scholar]
  57. Kim, G.N.; Han, S. Effects on Growth, Photosynthesis and Pigment Contents of Liriodendron tulipifera under Elevated Temperature and Drought. Korean J. Agric. For. Meteorol. 2015, 1, 75–84. [Google Scholar] [CrossRef]
  58. Liu, M.; Yang, L.; Su, M.; Gong, W.; Liu, Y.; Yang, J.; Huang, Y.; Zhao, C. Modeling the potential distribution of the energy tree species Triadica sebifera in response to climate change in China. Sci. Rep. 2024, 14, 1220. [Google Scholar] [CrossRef] [PubMed]
  59. Jiang, Z.; Zhang, X.; Wang, J. IPCC-AR4 Model Projections of Climate Change Scenarios for China in the 21st Century. Geogr. Res.-Aust. 2008; 7, 787–799. [Google Scholar]
  60. Schaufler, G.; Kitzler, B.; Schindlbacher, A.; Skiba, U.; Sutton, M.A.; Zechmeister-Boltenstern, S. Greenhouse gas emissions from European soils under different land use: Effects of soil moisture and temperature. Eur. J. Soil Sci. 2010, 61, 683–696. [Google Scholar] [CrossRef]
  61. Li, X.Z.; Lilt, X.D. Numerical Simulations of Extreme Precipitation in Eastern China under A1B Scenario. J. Trop. Meteorol. 2014, 20, 121–134. [Google Scholar]
  62. Zhang, H.; Zhao, H.; Wang, H. Potential geographical distribution of Populus euphratica in China under future climate change scenarios based on Maxent model. Acta Ecol. Sin. 2020, 40, 6552–6563. [Google Scholar]
  63. Prevey, J.S.; Parker, L.E.; Harrington, C.A.; Lamb, C.T.; Proctor, M.F. Climate change shifts in habitat suitability and phenology of huckleberry (Vaccinium membranaceum). Agric. For. Meteorol. 2020, 280, 107803. [Google Scholar] [CrossRef]
  64. Yu, D.; Fan, Z.; Ma, C. Distribution of Suitable Areas of Torreya yunnanensis under Different Carbon Emission Mode. J. Northwest For. Univ. 2023, 38, 40–46. [Google Scholar]
  65. Esperon-Rodriguez, M.; Power, S.A.; Tjoelker, M.G.; Beaumont, L.J.; Burley, H.; Caballero-Rodriguez, D.; Rymer, P.D. Assessing the vulnerability of Australia’s urban forests to climate extremes. Plants People Planet 2019, 1, 387–397. [Google Scholar] [CrossRef]
  66. Guan, J.; Li, M.; Ju, X.; Lin, J.; Wu, J.; Zheng, J. The potential habitat of desert locusts is contracting: Predictions under climate change scenarios. Peerj 2021, 9, e12311. [Google Scholar] [CrossRef]
  67. Li, J.; Chang, H.; Liu, T.; Zhang, C. The potential geographical distribution of Haloxylon across Central Asia under climate change in the 21st century. Agric. For. Meteorol. 2019, 275, 243–254. [Google Scholar] [CrossRef]
  68. Faeth, S.H.; Warren, P.S.; Shochat, E.; Marussich, W.A. Trophic dynamics in urban communities. Bioscience 2005, 55, 399–407. [Google Scholar] [CrossRef]
  69. Jenerette, G.D.; Clarke, L.W.; Avolio, M.L.; Pataki, D.E.; Gillespie, T.W.; Pincetl, S.; Nowak, D.J.; Hutyra, L.R.; McHale, M.; McFadden, J.P.; et al. Climate tolerances and trait choices shape continental patterns of urban tree biodiversity. Glob. Ecol. Biogeogr. 2016, 25, 1367–1376. [Google Scholar] [CrossRef]
  70. Zhao, Z.; Xiao, N.; Shen, M.; Li, J. Comparison between optimized MaxEnt and random forest modeling in predicting potential distribution: A case study with Quasipaa boulengeri in China. Sci. Total Environ. 2022, 842, 156867. [Google Scholar] [CrossRef]
Figure 1. Study framework diagram.
Forests 15 00988 g001
Figure 2. Map of distribution data of Liriodendron chinense. The pink dots represent the 87 distribution points of L. chinense within China, after removing instances of high spatial autocorrelation and duplicate records.
Forests 15 00988 g002
Figure 3. Heat map of correlation between 21 environmental variables.
Forests 15 00988 g003
Figure 4. MaxEnt model accuracy evaluation.
Forests 15 00988 g004
Figure 5. The Jackknife test result of environmental factor for L. chinense.
Forests 15 00988 g005
Figure 6. Response curve of 6 main environmental variables. (a) Response of bio14; (b) Response of bio17; (c) Response of bio18; (d) Response of bio6; (e) Response of alt; (f) Response of hf. Red line, the mean response of the 10 replicate Maxent runs. Blue part, the mean +/− one standard deviation.
Forests 15 00988 g006aForests 15 00988 g006b
Figure 7. Potential geographical distribution of L. chinense under current climate conditions.
Forests 15 00988 g007
Figure 8. Potential geographical distribution of L. chinense under future climate scenarios.
Forests 15 00988 g008
Figure 9. Proportion of suitable habitats for L. chinense under different climate-change scenarios.
Forests 15 00988 g009
Figure 10. Centroid migration distance of L. chinense under different climate scenarios.
Forests 15 00988 g010
Figure 11. Changes in potential geographical distribution of L. chinense under climate-change scenarios in the future.
Forests 15 00988 g011
Table 1. Environmental variables used for MaxEnt model prediction.
Variable DescriptionAbbreviationUnit
Annual mean temperaturebio1°C
Mean diurnal rangebio2°C
Isothermality (×100)bio3-
Temperature seasonalitybio4-
Max temperature of warmest monthbio5°C
Min temperature of coldest monthbio6°C
Temperature annual rangebio7°C
Mean temperature of wettest quarterbio8°C
Mean temperature of driest quarterbio9°C
Mean temperature of warmest quarterbio10°C
Mean temperature of coldest quarterbio11°C
Annual precipitationbio12mm
Precipitation of wettest monthbio13mm
Precipitation of driest monthbio14mm
Precipitation seasonalitybio15mm
Precipitation of wettest quarterbio16mm
Precipitation of driest quarterbio17mm
Precipitation of warmest quarterbio18mm
Precipitation of coldest quarterbio19mm
Elevationelev.m
Human footprinthf-
Note: The variables isothermality (bio3), temperature seasonality (bio4), and human footprint are expressed as dimensionless indices or percentages. Given their nature as ratios or standardized scales, they are presented without physical units in this table.
Table 2. Evaluation metrics of MaxEnt model generated by ENMeval.
Parameter SettingsRegularization MultiplierFeature CombinationΔ.AICcauc.diff.avgor.10p.avg
Default1LQPHT153.9294120.0530081060.321969697
Optimized0.5LQ00.0590193510.207251082
Table 3. Environmental variables and their contributions and suitable value ranges.
Environment VariablesPercent Contribution (%)Permutation Importance (%)Total Suitable Range
bio21.41.65.96–7.93 °C
bio34.52.423.07%–26.76%, 52.33%–56.78%
bio43.13.7678–843, 200–377
bio65.021.8−1.38–6.70 °C
bio80.91.220.52–25.60 °C
bio128.24.41140.55–2175.97 mm
bio1434.97.118.18–177.02 mm
bio150.91.244.34%–67.94%
bio160.44.4510.45–966.62 mm
bio17219.4127.22–564.30 mm
bio181.223.8520.37–718.70 mm
Elev.9.010.180–900 m
Hf10.39.822.45–49.44
Table 4. Suitable areas for L. chinense under different climate-change scenarios (×104 km2).
Climate PeriodsHighly Suitable AreaMedium-Suitable AreaLow Suitable AreaTotal Suitable Area
Current35.5261.0355.00151.55
2050-SSP12651.3471.8262.49185.65
2050-SSP24555.3587.8874.02217.24
2050-SSP37086.03113.9386.92286.88
2050-SSP58569.04109.1787.36265.57
Table 5. Location of the centroid shift and migration distance of L. chinense under different climate scenarios.
Climate ScenariosMigration Distance of
Centroid Shift (m)
Latitude
(°)
Longitude
(°)
Elevation
(m)
Current111.12328828.000177189
2050-SSP126184,214.8732111.46643629.61939657
2050-SSP245239,097.4455110.95157330.130432983
2050-SSP370446,488.6247110.88337031.975295731
2050-SSP585305,669.3452110.71842230.7063101165
Disclaimer/Publisher’s Note: The statements, opinions and data contained in all publications are solely those of the individual author(s) and contributor(s) and not of MDPI and/or the editor(s). MDPI and/or the editor(s) disclaim responsibility for any injury to people or property resulting from any ideas, methods, instructions or products referred to in the content.

