Article

Site-Level Modelling Comparison of Carbon Capture by Mixed-Species Forest and Woodland Reforestation in Australia

by
Koen Kramer
1,*,
Lauren T. Bennett
2,
Remi Borelle
1,
Patrick Byrne
2,
Paul Dettman
3,
Jacqueline R. England
4,
Hielke Heida
1,
Ysbrand Galama
1,
Josephine Haas
1,
Marco van der Heijden
1,
Anna Pykoulas
2,
Rodney Keenan
2,
Vithya Krishnan
1,
Helena Lindorff
1,
Keryn I. Paul
5,
Veronica Nooijen
1,
Jeroen van Veen
1,
Quinten Versmissen
1 and
Arnout Asjes
1
1
Land Life, Mauritskade 63, 1092 AD Amsterdam, The Netherlands
2
School of Agriculture, Food and Ecosystem Sciences, University of Melbourne, Parkville, VIC 3010, Australia
3
Cassinia Environmental, 86 Mollison St., Kyneton, VIC 3444, Australia
4
CSIRO Environment, Private Bag 10, Clayton South, VIC 3169, Australia
5
CSIRO Environment, GPO Box 1700, Canberra, ACT 2601, Australia
*
Author to whom correspondence should be addressed.
Forests 2024, 15(6), 990; https://doi.org/10.3390/f15060990
Submission received: 30 April 2024 / Revised: 28 May 2024 / Accepted: 3 June 2024 / Published: 5 June 2024
(This article belongs to the Special Issue Planted Forests: A Path towards Sustainable Development)

Abstract

:
Large areas of Australia’s natural woodlands have been cleared over the last two centuries, and remaining woodlands have experienced degradation from human interventions and anthropogenic climate change. Restoration of woodlands is thus of high priority both for government and society. Revegetation of deforested woodlands is increasingly funded by carbon markets, with accurate predictions of site-level carbon capture an essential step in the decision making to restore. We compared predictions of carbon in above-ground biomass using both the IPCC Tier 2 modelling approach and Australia’s carbon accounting model, FullCAM, to independent validation data from ground-based measurements. The IPCC Tier 2 approach, here referred to as the FastTrack model, was adjusted to simulate carbon capture by mixed-species forests for three planting configurations: direct seeding, tubestock planting, and a mix thereof. For model validation, we collected data on above-ground biomass, crown radius, and canopy cover covering an age range of 9–35 years from 20 plantings (n = 6044 trees). Across the three planting configurations, the FastTrack model showed a bias of 2.4 tC/ha (+4.2% of the observed mean AGB), whilst FullCAM had a bias of −24.6 tC/ha (−42.9% of the observed mean AGB). About two-thirds of the error was partitioned to unsystematic error in FastTrack and about one-quarter in FullCAM, depending on the goodness-of-fit metric assessed. Model bias differed strongly between planting configurations. For the FastTrack model, we found that additional canopy cover data estimated from satellite images obtained at different years can improve the carbon capture projections. To attain the highest accuracy of carbon projection at the site level, we recommend using a model with parameters calibrated for the specific planting configuration using local representative data.

1. Introduction

Human-induced habitat loss and degradation are the main threats to the decline and loss of terrestrial biodiversity globally, e.g., [1], and modification of natural ecosystems also has negative consequences for natural capital, e.g., [2]. Concurrently, demand for ecosystem services to provide a variety of environmental, social, and economic benefits to humans is increasing. There is a growing need to manage degraded landscapes for improved ecosystem services and biodiversity.
Forest biodiversity is crucial to providing ecosystem services [3,4]. Australia, a globally recognized biodiversity hotspot, hosts 85% of its species endemically, reflecting a distinctive evolutionary history shaped by the continent’s isolation and aridification over millions of years [5,6]. Since European colonization, Australia’s ecosystems, particularly woodlands, have been widely cleared for cropping and intensive grazing, and uncleared woodlands have been degraded through livestock grazing and other uses [7,8,9]. Consequently, habitat loss and degradation are some of the main threats to Australia’s rich biodiversity, with nearly 70% of threatened taxa impacted and 60% of listed threatened species seriously affected [10]. Further, exotic species introductions [11], and altered fire regimes [12], have had significant impacts on Australia’s biodiversity.
Reforestation of agricultural land with mixed-species environmental plantings (native trees and shrubs) has been commonly used in Australia since the 1980s in response to growing recognition of the costs of environmental degradation in cleared landscapes. Mixed-species environmental plantings in south-eastern Australia have typically involved an initial seeding (‘direct seeding’) or planting (‘tubestock planting’) of the dominant woody species, often identified from a reference condition representing the local native vegetation [13]. Establishment and growth of local species in environmental plantings is assumed to promote chances of conserving local plant species and associated fauna, and of re-instating a native-dominated ecosystem suited to the local growth conditions and to the reliable provision of ecosystem services. Environmental plantings are increasingly being recognized for the potential dual benefits of enhancing biodiversity and sequestering carbon, e.g., [14,15]. Establishment and management (e.g., configuration) of these plantings are often overlooked but are important in determining their potential to sequester carbon and enhance biodiversity [16]. Reforestation with the right species mixtures in the right places is thus of great importance to combat global and local climate change, and to restore biodiversity.
The commitment of restoring Australia’s degraded land is evident through initiatives such as the National Landcare Program and the Carbon Farming Initiative (Campbell, Alexandra, and Curtis, 2017) and continues to be so through recently adopted Nature Repair Market Bill [17] and the ‘30 by 30’ commitment set by the Kunming–Montreal Global Biodiversity Framework [18]. Consistent with growing international interest in nature-based solutions to mitigate climate change, environmental plantings are now recognized not only for their capacity to support biodiversity but also for their potential to store carbon, e.g., [16,19]. This carbon sequestration potential is included in eligible methods under the Australian Government’s Australian Carbon Credit Unit (ACCU) Scheme [20]. Ongoing reforestation activities under this scheme are consistent with Australia’s requirements to meet international commitments for carbon reporting and accounting, recognizing the importance of nature-based removals to offset carbon emissions [17,18,21,22,23,24,25,26,27].
Investment in establishing and maintaining mixed-species environmental plantings relies on having a cost-effective modelling approach to providing accurate, unbiased estimates of carbon sequestration rates. Next to accuracy—the level of agreement between the prediction and observation—are realism—the extended responses caused by processes represented by measurable state variables and parameters—and generality—the scope in space and time at which the model is applicable—important criteria for model assessment [28,29,30]. A range of models to predict growth and carbon sequestration in forests have been developed over the past couple of decades, reflecting a diversity of users and objectives, e.g., [31,32,33]. The aim of this study was to assess two alternative modelling approaches on their accuracy, realism, and generality of the carbon capture forecasts by mixed-species reforestation at the site level through comparison with on-ground observations. The two modelling approaches were (i) an implementation of the much-used Intergovernmental Panel on Climate Change (IPCC) Tier 2 approach [34,35] including crown competition, here referred to as the FastTrack model, enabling simulation of mixed-species forests and representing both direct seeding and tubestock planting configurations; and (ii) Australia’s Full Carbon Accounting Model (FullCAM) developed for national greenhouse gas accounting from the land sector [36], with calibrated parameters for mixed-species environmental plantings [37].

2. Materials and Methods

For model validation, we collected and analyzed three independent data sources and compared these with the model outputs. For model calibration, a database referred to as the Stem Diameter Database (SDD) [38], was used for both FastTrack and FullCAM. Below, we describe the data sources used for validation and calibration and present the two modelling approaches.

2.1. Data

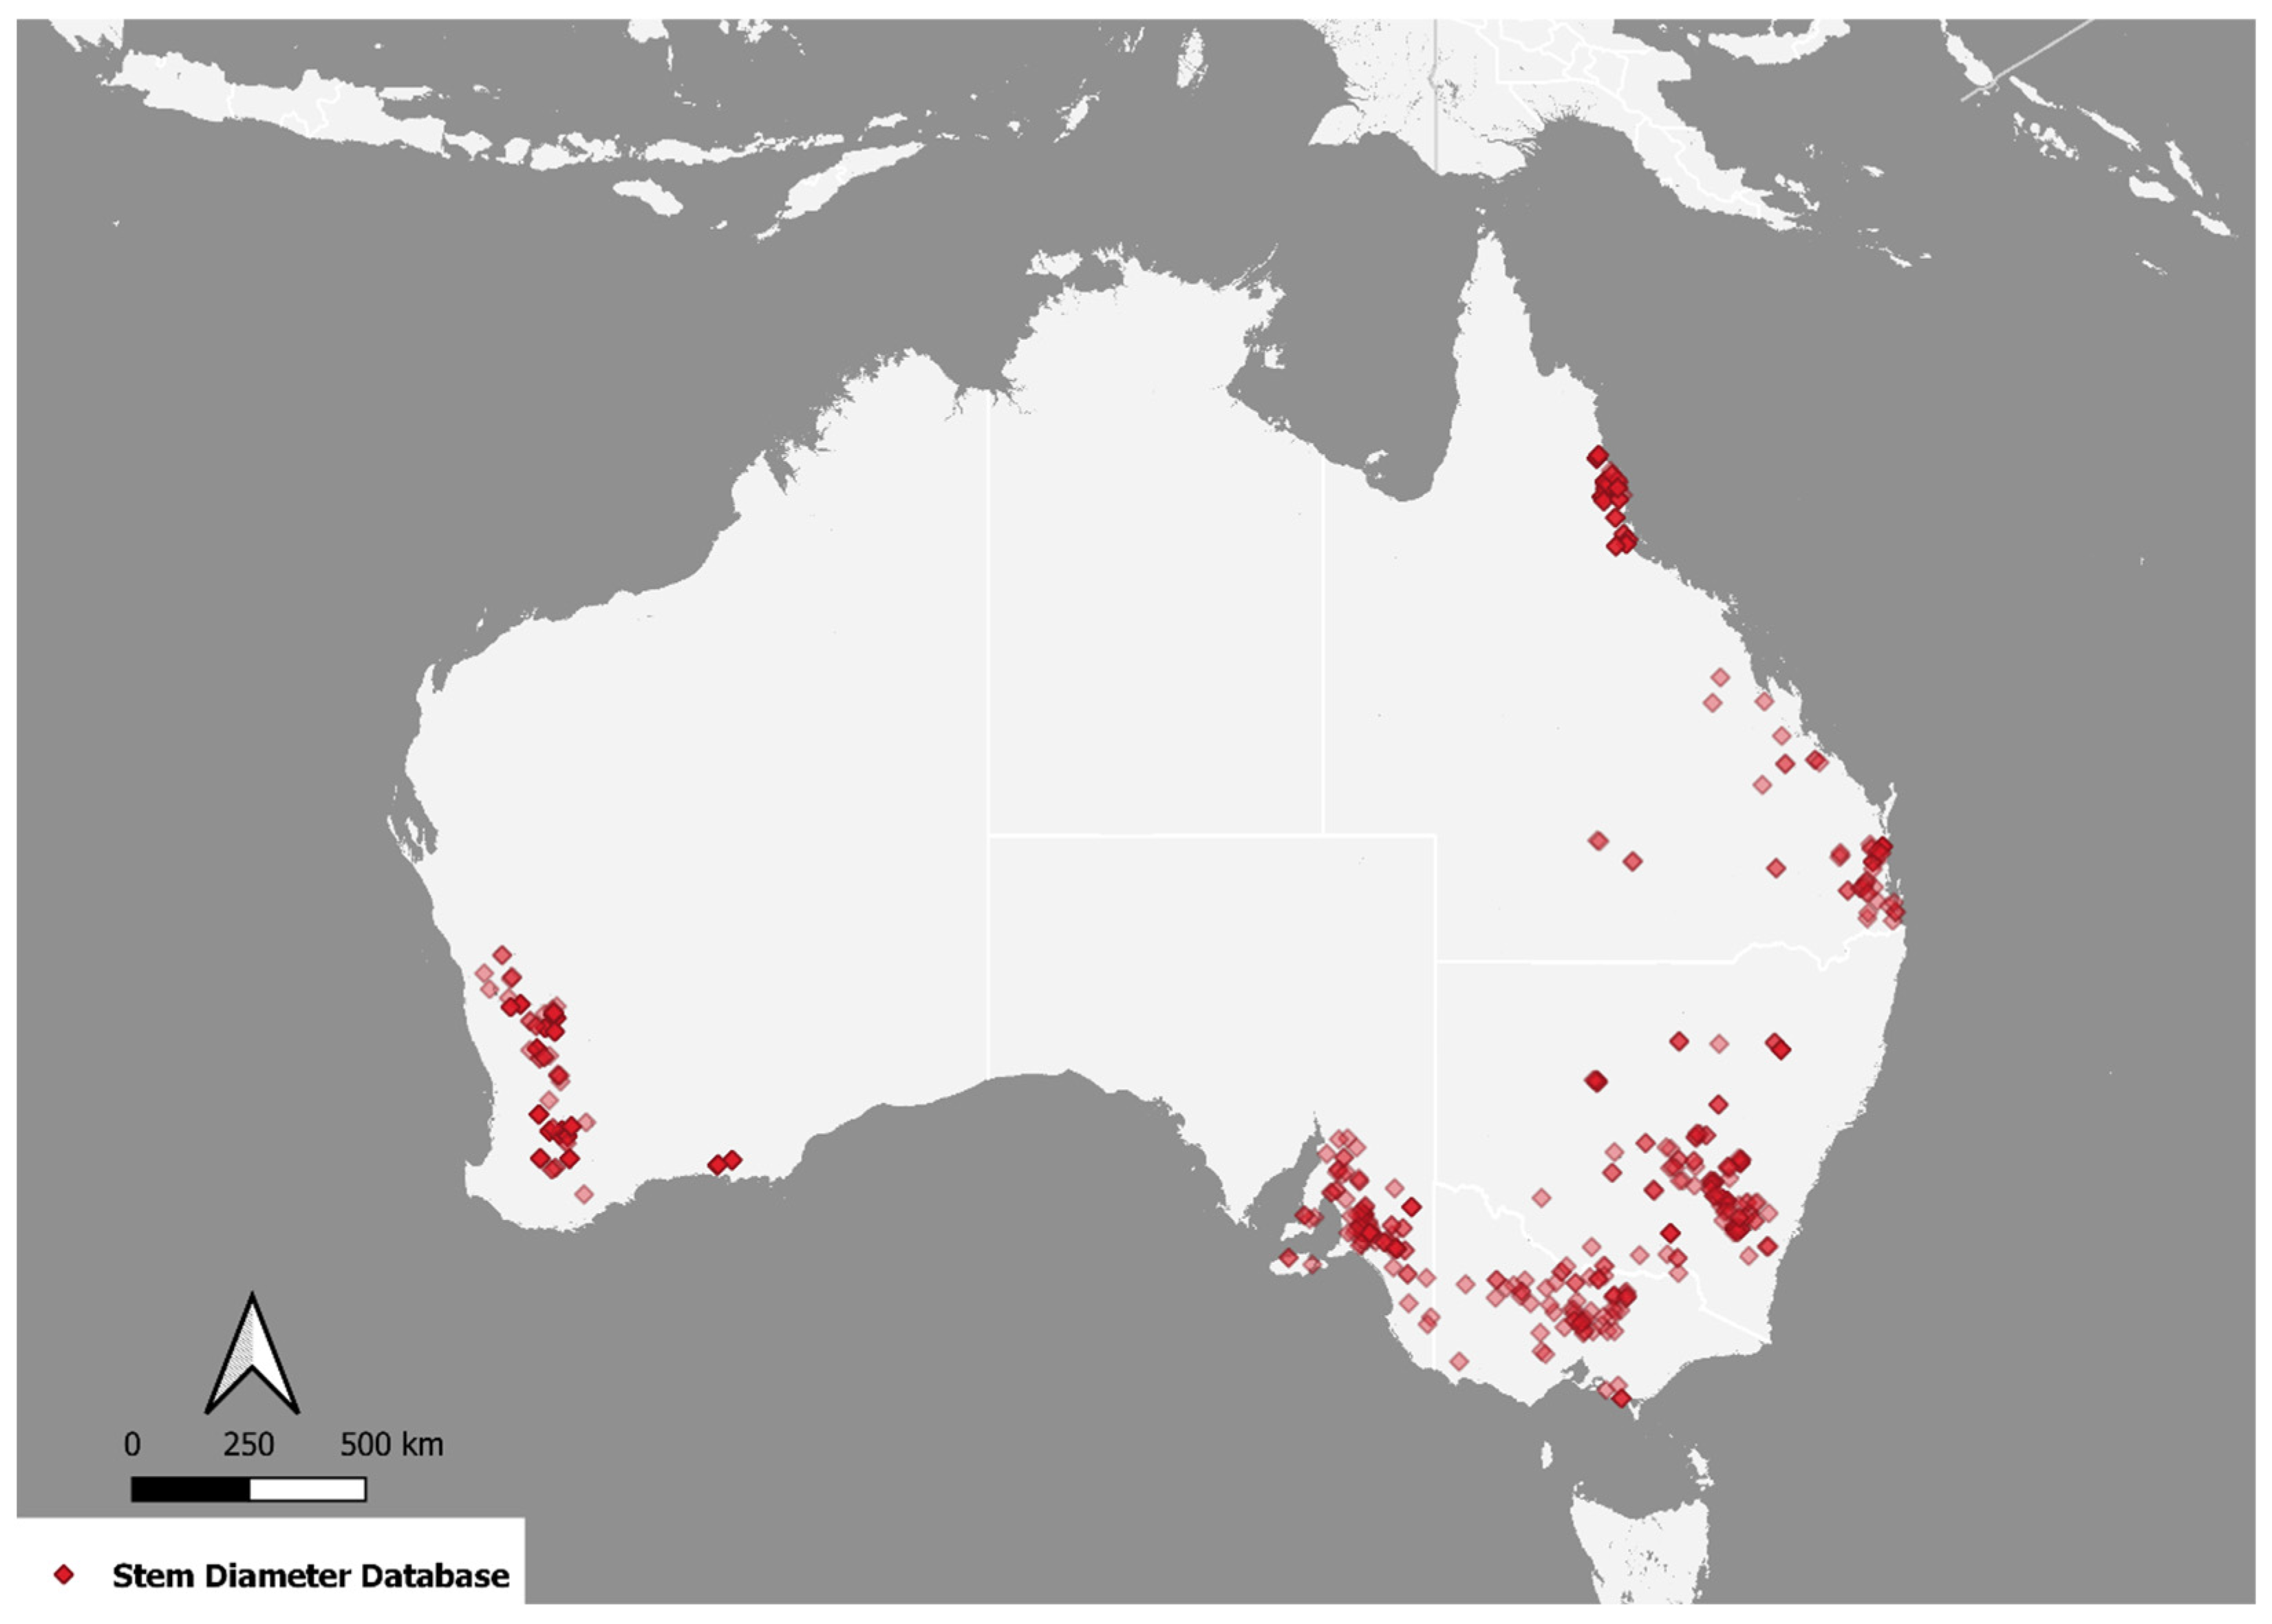
2.1.1. Validation Data

We collected new data on above-ground biomass, crown radius, and canopy cover from 14 sites in Victoria, Australia. The sites were selected from the SDD based on the following criteria: (1) plantings were at least 20 years old (representing the oldest environmental plantings in south-eastern Australia); (2) the planted species assemblages were consistent with widespread woodland assemblages in inland south-eastern Australia (i.e., mixes of box–ironbark–gum Eucalyptus and/or Acacia species, and (3) the plantings had been previously measured [39,40,41,42], providing scope for examining carbon-stock trends. Figure 1 presents the location of the sites where these data were collected. Table 1 presents an overview of the field sites and the measurements.
Reforestation approaches considered here involved establishing either a mixed-species environmental planting or a mallee eucalypt planting. Plantings can be established using tubestock and/or seeds in blocks or belts. Belt geometry can be of two types: a narrow or wide linear planting geometry. Block planting geometry is any shape other than a single row, which meets the spacing requirements given in the Carbon Farming Initiative (CFI) mapping guidelines [43]. For mixed-species environmental plantings, narrow plantings are either rows or random planting up to 20 m wide, whilst wide planting are rows random plantings of 20–40 m.
Above-ground biomass (AGB) was determined at 13 of the mixed-species environmental planting SDD sites and on one additional site in 2022 (n = 14) to expand the age range of the observations, as these sites were last sampled over a decade ago. No mallee eucalypt plantings were assessed. The assessed sites ranged in age from 21 to 35 years and in locations where environmental conditions were representative of box–ironbark–gum with acacia native vegetation in north-central Victoria. Within each planting, the sampling area was defined as a well-stocked area of ≤3 ha (i.e., providing the best indication of carbon potential for that site, avoiding areas of poor survival due to local conditions including competition with large remnant trees) and encompassing any earlier assessment plots (where known). To ensure representative coverage, the sampling area was divided into equally sized sectors and within each sector a random transect of 0.05 ha (100 m length by 5 m width) was laid out based on a restricted random sampling design. Two to five transects were measured per site, depended on either sampling 10% of the area [44] or meeting Australian recommendations for minimum stem numbers for the planting configuration [45]. In total, 48 transects were assessed across the 14 AGB sites. Woody above-ground carbon stocks in trees and shrubs (n = 3449) were measured according to previously established protocols for comparable species groups [46]. All stems per 0.05 ha transect were assessed for diameter, status (live or dead), species and plant functional type (PFT). Typically, trees classified as Eucalyptus or Other were measured for diameter at breast height (130 cm above ground), whereas those classified as Acacia, Mallee, or Shrub were measured at 10 cm height [46]. In addition, a subset of woody plants within the transects were measured for height and canopy width based on the diameter class range in the transect. To estimate above-ground biomass, allometric scaling was used based on the PFT and the stem diameter measurements as per the method and equations of [46]. Unique allometric equations were used to estimate biomass in dead stems, to account for the absence of leaves and small twigs [47]. Stand above-ground biomass (tDM/ha) was calculated summing all individual biomass estimates per plot and dividing by the plot area (adjusted for slope). Above-ground biomass was then converted to carbon assuming carbon concentration was 50% of biomass, as recommended for national application [48].
Crown radius was measured at an additional six sites with known age, established either by direct seeding in lines, regular tubestock planting, or direct seeding in combination with tubestock planting. We used the time since planting as the age of the trees, thus assuming the absence of regeneration unless this was recorded. The planting geometry was a block design for all sites. In total, 108 transects with a length of 20 m were sampled, containing in total 1341 trees and shrubs, from which height (n = 1337) and crown radius (n = 1261) was measured. The crown radius was measured in two directions under the assumption that the crown expansion rate in the direction of seeding line would be less than the crown expansion rate perpendicular to the seeding line due to differences in crown competition in these two directions. It was furthermore recorded if the trees were alive or dead. Only the crown radius of living trees was used in the model validation.
The canopy cover was determined using historical high-resolution (0.5–0.8 m) satellite images (Kompsat-3 and Pleiades) at four above-ground biomass sites and three crown radius sites, in plantings established by direct seeding. Each satellite image consisted of four bands (RGB and NIR). For performance improvement in accurately detecting the canopy, a fifth band (NDVI) was added to the data. Unsupervised machine learning algorithm K-means clustering was applied to help detect the canopy.

2.1.2. Calibration Data

The Stem Diameter Database is an inventory for mixed-species environmental plantings, mallee plantings, and stands of natural regeneration to estimate biomass in stands of woody vegetation [38]. The dataset was derived through collation of data over the period 1970–2019 from several projects, the majority of these funded by the Australian Government and/or State Governments. The reforestation approaches represented in SDD include mixed-species environmental planting and mallee eucalypt planting [37].
The SDD version used in this study stores the stem diameter data of 189,572 trees, observed on 2518 plots at 744 sites (Figure 2). Of the sites, 325 represent block plantings, 347 belt plantings, 22 natural regeneration from seed, and 50 either belt or block planting with water access additional to rainfall. Of the belt plantings, 151 sites are considered mixed-species environmental plantings, and 196 sites are monoculture mallee eucalypt plantings; 251 sites represent high-density plantings vs. 96 low density plantings; 178 sites narrow belts vs. 169 wide belts. Of the block plantings, 282 sites are considered mixed-species environmental plantings, 27 sites are monoculture mallee Eucalyptus, and 16 sites are natural regeneration. In addition to stem diameter data, there are 33,814 height measurements. Above- and below-ground biomass were calculated based on stem diameter using allometric equations for different PFTs. To calculate above-ground biomass, species were grouped into five PFTs: multi-stemmed or highly branched shrubs or small trees less than 2 m height (Fshrub); multi-stemmed hardwoods, including Eucalyptus and Acacia mallees (Fmulti); single-stemmed hardwood trees for Eucalyptus, Corymbia, and Angophora (FEuc); other single-stem species with high wood density (Fother_H); and other single-stemmed tree species with low wood density (Fother_L) [46]. To calculate below-ground biomass, species were grouped into three PFTs: shrubs and small multi-stemmed trees including Acacia (FShrub&Ac); multi-stemmed (mallee) trees from the genus Eucalyptus, which commonly have a lignotuber and relatively high wood density (FMallee); and single-stemmed trees of relatively high wood density (FTree) [49]. In the SDD, it is not possible to discriminate between direct seeding and tubestock planting, so the models were not specifically calibrated on these planting configurations.

2.2. Models

2.2.1. FastTrack

The FastTrack model was developed to provide locally accurate CO2 accumulation forecasts of mixed-species planted reforestation projects applicable to planted reforestation projects globally. The model is an extension of the IPCC Tier 2 approach [34] with crown competition and tree density dynamics allowing forecasting of carbon capture of planting configurations including direct seeding, tubestock planting, and combinations thereof.
The Tier 2 approach is presented with the following extensions: a. crown competition to simulate mixed-species reforestation sites, and b. the direct seeding method as reforestation approach used in Australia. The calibration approach is presented to determine site-dependent, species-specific parameter values. The calibration is based on a subset of the SDD data that are representative of tree growth based on temperature, precipitation, elevation, and distance between SDD plots of the reforestation site.
The Tier 2 methodology used in FastTrack to calculate CO2 capture is performed by sequentially multiplying stem volume increment with wood density to obtain stem biomass increment (Equation (1)), stem biomass increment with shoot-to-stem ratio to obtain above-ground woody tree biomass increment (Equation (2)), above-ground woody tree biomass increment with root-to-shoot ratio to obtain below-ground woody tree biomass increment (Equation (3)), and tree weight increment with wood carbon fraction to obtain tree carbon increment and tree carbon increment with CO2-to-carbon ratio to obtain CO2 capture (Equation (4)). Finally, tree density was divided by 1000 kg/ton and summed over the tree species to obtain total CO2 capture in tons per hectare (Equation (5)). The different tree components are calculated in FastTrack to compare them with observations in the calibration process.
d W g h S t t d t = W D t ·   d V l m S t t d t
d W g h S h t d t = B E F D t · d W g h S t t d t  
d W g h R t t d t = R t · d W g h S h t d t
d C O 2 t d t = 44 12 · C F t · d W g h T r t d t
C O 2 T o t = t C O 2 t · D n s T r t / 1000
With:
d W g h T r t d t = d W g h S h t d t + d W g h R t t d t
The subscript t indicates tree or shrub species, i.e., each species is represented by a set of state variables. See Table 2 for the explanation of the state variables and Table 3 for the explanation of the parameters.
As crown competition was added to the IPCC Tier 2 approach, the assumptions in FastTrack are that (1) the maximum individual tree stem volume growth is attained when a species reaches its full canopy size, (2) maximum stand growth is reached when full canopy closure is attained. These assumptions can mathematically be described as follows:
d R d s C n t d t = m a x _ d R d s C r _ d t t · 1 R d s C n t m a x _ R d s C r t · 1 C v r C r T o t m a x _ C v r C r   · R d s C n t
d V l m S t t d t = m a x _ d V l m S t _ d t t · r e l _ S r f C n t
d D n s T r t d t = 1 f M r t t · D n s T r t
With:
S r f C n t = π · R d s C n t 2
m a x _ S r f C n t = π · m a x _ R d s C n t 2
r e l _ S r f C n t = S r f C n t m a x _ S r f C n t
C v r C n t = S r f C n t · D n s T r t / P l o t S i z e
C v r C n T o t = t C v r C n t
The term 1 R d s C n t m a x _ R d s C n t guarantees that the crown expansion does not exceed the maximum crown radius, whereas the term 1 C v r C n T o t m a x _ C v r C n guarantees that the total canopy cover does not exceed the maximum canopy cover of the site. The term 1 R d s C n t m a x _ R d s C n t describes that the maximum individual tree stem volume growth is attained when a species reaches full canopy size, i.e., R d s C n t = m a x _ R d s C n t , as at that moment r e l _ S r f C n t = 1 and d V l m S t t d t = m a x _ d V l m S t _ d t t (assumption (1)).
The term 1 C v r C r T o t m a x _ C v r C r describes that maximum stand growth is reached when full canopy closure is attained (assumption (2)). The mechanism is as follows: if C v r C n t declines due to mortality and R d s C n t < m a x _ R d s C n t , then d R d s C n t d t > 0. That is, the crown radius can expand if space becomes available to do so due to mortality. Consequently, canopy surface S r f C n t expands and individual-tree stem volume increases, d V l m S t t d t , up to m a x _ d V l m S t _ d t t . Whole-stand productivity starts to decline when C v r C n t continues to decrease due to mortality and individual-tree stem volume increment is at maximum, m a x _ d V l m S t _ d t t , at R d s C n t = m a x _ R d s C n t . The decline in stand growth is expressed as current annual increment, C A I = d V l m S t t d t   · D n s T r t , over age is the consequence of mortality from the moment the crown size has reached its maximum and the canopy cover decreases due to mortality. Therefore, the highest value of CAI is attained when C v r C n T o t = m a x _ C v r C n T o t . This value is attained for a particular planting depending on the planting density and the maximum crown radii of the selected tree species. Planting trees with small maximum crowns at low density results in an underperformance of the planting relative to its carbon capture potential.
To apply FastTrack to Australia, direct seeding as a planting method was modelled. We refer to the resulting vegetation as hedge, which is a row of single- or multi-stemmed trees and shrubs. This is modelled by representing the crowns as ellipses rather than circles as in regular even-spaced plantings. The radius of the crown in the direction of the hedge (RdsCn2) is thus distinguished from the radius of the crown perpendicular to the direction of the hedge (RdsCn, as above for regularly planted trees). The length of the hedge is the sum of the crown diameter in the direction of the hedge, and has a maximum of 100 m, i.e., the length of the 1 hectare simulated. The initial length of the hedge is determined by the overall emergence fraction irrespective of species (Equation (15)). The distance between seeding lines yields the number of hedges per hectare. The initial tree density per species per hectare is based on the initial RdsCn2 multiplied by the number of hedges per hectare. For example, an initial crown radius of 5 cm that is set at an emergence rate of 80% with 5 m between seedling lines results in 20 hedges per hectare with an average length of 80 m. Thus, the initial tree density is 800 trees per hedge or 16,000 trees per hectare.
L n g H d g t 0 = 2 · R d s C n 2 t 0 · D n s T r t 0 n h e d g e s · f e m e r g e n c e
The length of the hedge is driven by mortality and crown expansion. The number of trees that die multiplied by the crown diameter at that time results in a decrease due to mortality (first term of Equation (8)), whilst the length of the hedge increases due to crown expansion of the trees that remain after mortality (second term of Equation (16)). The change in radius of the crown in the direction of the hedge is like Equation (7), with the difference that the maximum hedge length constraints the expansion (Equation (17)) instead of the maximum crown cover.
d L n g H d g t d t = 2 · R d s C n 2 t · d D n s T r t d t n h e d g e s + d R d s C n 2 t d t · D n s T r + d D n s T r t d t n h e d g e s
d R d s C n 2 t d t = m a x _ d R d s C r _ d t t · 1 R d s C n 2 t m a x _ R d s C r t · 1 L n g H d g T o t m a x _ L n g H d g   · R d s C n 2 t
With:
L n g H d g T o t = t L n g H d g t

Calibration of Growth Parameters of the FastTrack Model

The site-dependent, species-specific parameter values are estimated through calibration. See Table 3 for the literature sources of parameters that are not determined by calibration. The aim of the calibration was to determine parameter values such that unbiased forest growth is projected by FastTrack. These parameters are max_dVlmSt_dt, max_RdsCn, and max_dRdsCn_dt. If above-ground biomass (WghSh) and below-ground biomass (WghRt) are available, we additionally calibrate the parameters BEFD and R. Thereby implicitly applying the same shoot-to-stem and shoot-to-root ratios as used in the SDD to determine WghSh and WghRt, without needing to insert the locally derived allometric equations per species in FastTrack. In Australia, we calibrated BEFD and R on the allometric equations derived by Paul et al. (2016, 2019), which are used to calculate WghSh and WghRt from stem diameter data.
Below, we introduce FastTrack in mathematical terms and describe the goodness of fitness functions used to minimize error. Then, we present the minimization methods that were tested and selected in our modelling. Mathematically, FastTrack is an initial-value problem, which takes the following general form:
X t = 0 = X 0 d X d t = f X , p
with X a state variable vector, and initial values X 0 at time = 0. The rate of change of X , d X d t , is a function of X and the parameter vector, p . d X d t is the vector ordinary differential equation (ODE), of which the right-hand side, f Y , p , is solved by numerical integration of d X d t over time, up to t = 40:
X t = t = 1 t = 40 d X d t
X is a time x state variable matrix, of which the rows represent time (t = 1…40) and the columns contain the state variables for each species (Table 2). Each state variable has a function f X , p , as presented in Section 2.2.2.
m i n g X Y | p + ε
with X : simulated data, Y : observed data, and ε ~N (0, sd) the distribution of the residuals.
For g (see Equation (21)), often the mean square error (MSE, Equation (22)) or the mean absolute error (MAE, Equation (23)) is used. These metrics provide insights into the goodness of fit of the model concerning the data. Gauch et al. [54] decomposes the MSE into squared bias, non-unity slope, and lack of correlation. Based on this, alternative models can be assessed on their accuracy, realism, and general applicability [30]. Willmott (Willmott, 1981, 1982) decomposes MSE in a systematic (MSEs) and unsystematic component (MSEu). MSEs can be interpreted as an over- or under-prediction of the observations by the model. Robeson and Willmott (2023) decompose MAE into a bias, proportionality, and unsystematic error. The bias error reflects that the mean of the prediction is systematically higher or lower than the observed mean, whereas the proportionality error indicates if the model systematically under- or over predicts either low or high observations.
M S E = X Y 2 n
M A E = X Y n
Minimizing the systematic components of MSE or MAE results in unbiased predictions as the remaining variation of deviances is attributed to unsystematic components. These unsystematic components are the lack of correlation in Gauch [54], MSEu in Willmot [55,56], and unsystematic error of MAE in Robeson and Willmot [57]. Following Mahnken et al. [30], MSE and MAE are scaled by the variance of the observations because state variables differ in their units. The key difference between MSE and MAE metrics is the weighting of the deviances. In MSE, the deviances are squared; therefore, a heavier emphasis is put on outliers than in MAE.
We tested several minimization algorithms including downhill simplex [58], Powell’s conjugate method [59], and sequential least-squares programming, SLSPQ [60]. These algorithms differ in computational intensity to meet their convergence criteria and efficiency to assess and set the upper and lower boundaries on the parameters. All scaled goodness-of-fit metrics and the minimization algorithms described above are implemented in FastTrack. Depending on the data and initial results, alternative metrics and algorithms can be used for the model assessment to improve the overall goodness of fit and reduce bias between prediction and observation.
The model is embedded in a graphical user interface (GUI) that allows for the selection of representative SDD sites, and subsequent calibration and projection. The selection process is based on both geographic and environmental distance between the SDD site and the planting site. The calibration interface allows for selecting alternative goodness of fit metrics (MSE, MAE and its components; to attain the optimal parameter set given the selected calibration data. The projection interface allows for multiple runs per site and parameter set to assess the projection uncertainty expressed as ranges around the mean (Figures S1 and S2).

2.2.2. FullCAM

The Full Carbon Accounting Model (FullCAM) is a calculation tool for modelling Australia’s greenhouse gas emissions from the land sector. FullCAM is used in Australia’s National Greenhouse Gas Accounts for the land use, land use change, and forestry sectors. FullCAM is also used to generate abatement estimates for vegetation under the Australian Carbon Credit Units Scheme [20].
FullCAM takes a hybrid, process-empirical approach to simulate forest growth [61] (Equation (24)). With a process-based model, both the annual forest productivity index ( P a ) and 37-year average forest productivity index ( P ¯ ) were determined based on climate, soil type, and fertility [37,62]. Values of P a and P ¯ for each stand were made available via DoEE [63,64]. The annual variability in productivity in the empirical model is then determined by the ratio P a P ¯ (Equation (24)). Based on P ¯ , both the potential above-ground biomass, M (Equation (25)), and the modifier of M , r (Equation (26)), are empirically derived. An exponential curve is used to simulate above-ground biomass over time (Equation (24)). The parameter k determines the shape of above-ground biomass curve, which is adjusted to local conditions based on the parameter G (Equation (27)). G is approximately the inflection point of the above-ground biomass response curve, thus representing the age at which the growth rate attains a peak value. G is assumed to decline linearly with M (Equation (28)), so that peak growth is attained earlier with increasing M . The empirical model parameters M , r, G, and k all depend on the process-based parameter P ¯ , so that the free model parameters are ar, br, ag, and bg.
M a = r · M · e k a · P a P ¯
with
M = 6.011 · P ¯ 5.291 2
r = a r · P ¯   b r
k = 2 · G 1.25
G = a g + b g · M
To calculate above-ground biomass growth, Ia, the difference in the above-ground biomass between two consecutive years is taken (Equation (29)). Thus, Ma, the integral of Ia, is numerically solved with a fixed time step of 1 year. Ia is also referred to as the tree yield formula [65].
I a = M a M a 1 = r · M · e k a e k a 1 · P a P ¯
Whole-tree biomass is determined by root-to-shoot ratios, which is based on allometric equations for the different plant functional types found in environmental plantings [45,46,49]. The empirical parameters of the model from Waterworth et al. [61] were recalibrated by Roxburgh et al. [65], who derived regional- and species-specific parameter values. In that recalibration, upper and lower limits were set on the empirical parameters r and G. Moreover, Equation (25) to determine M was replaced by a machine learning algorithm [66]. In this study, we used the 2020 public release of FullCAM with the recalibrated parameter values [36].

3. Results

3.1. Above-Ground Biomass
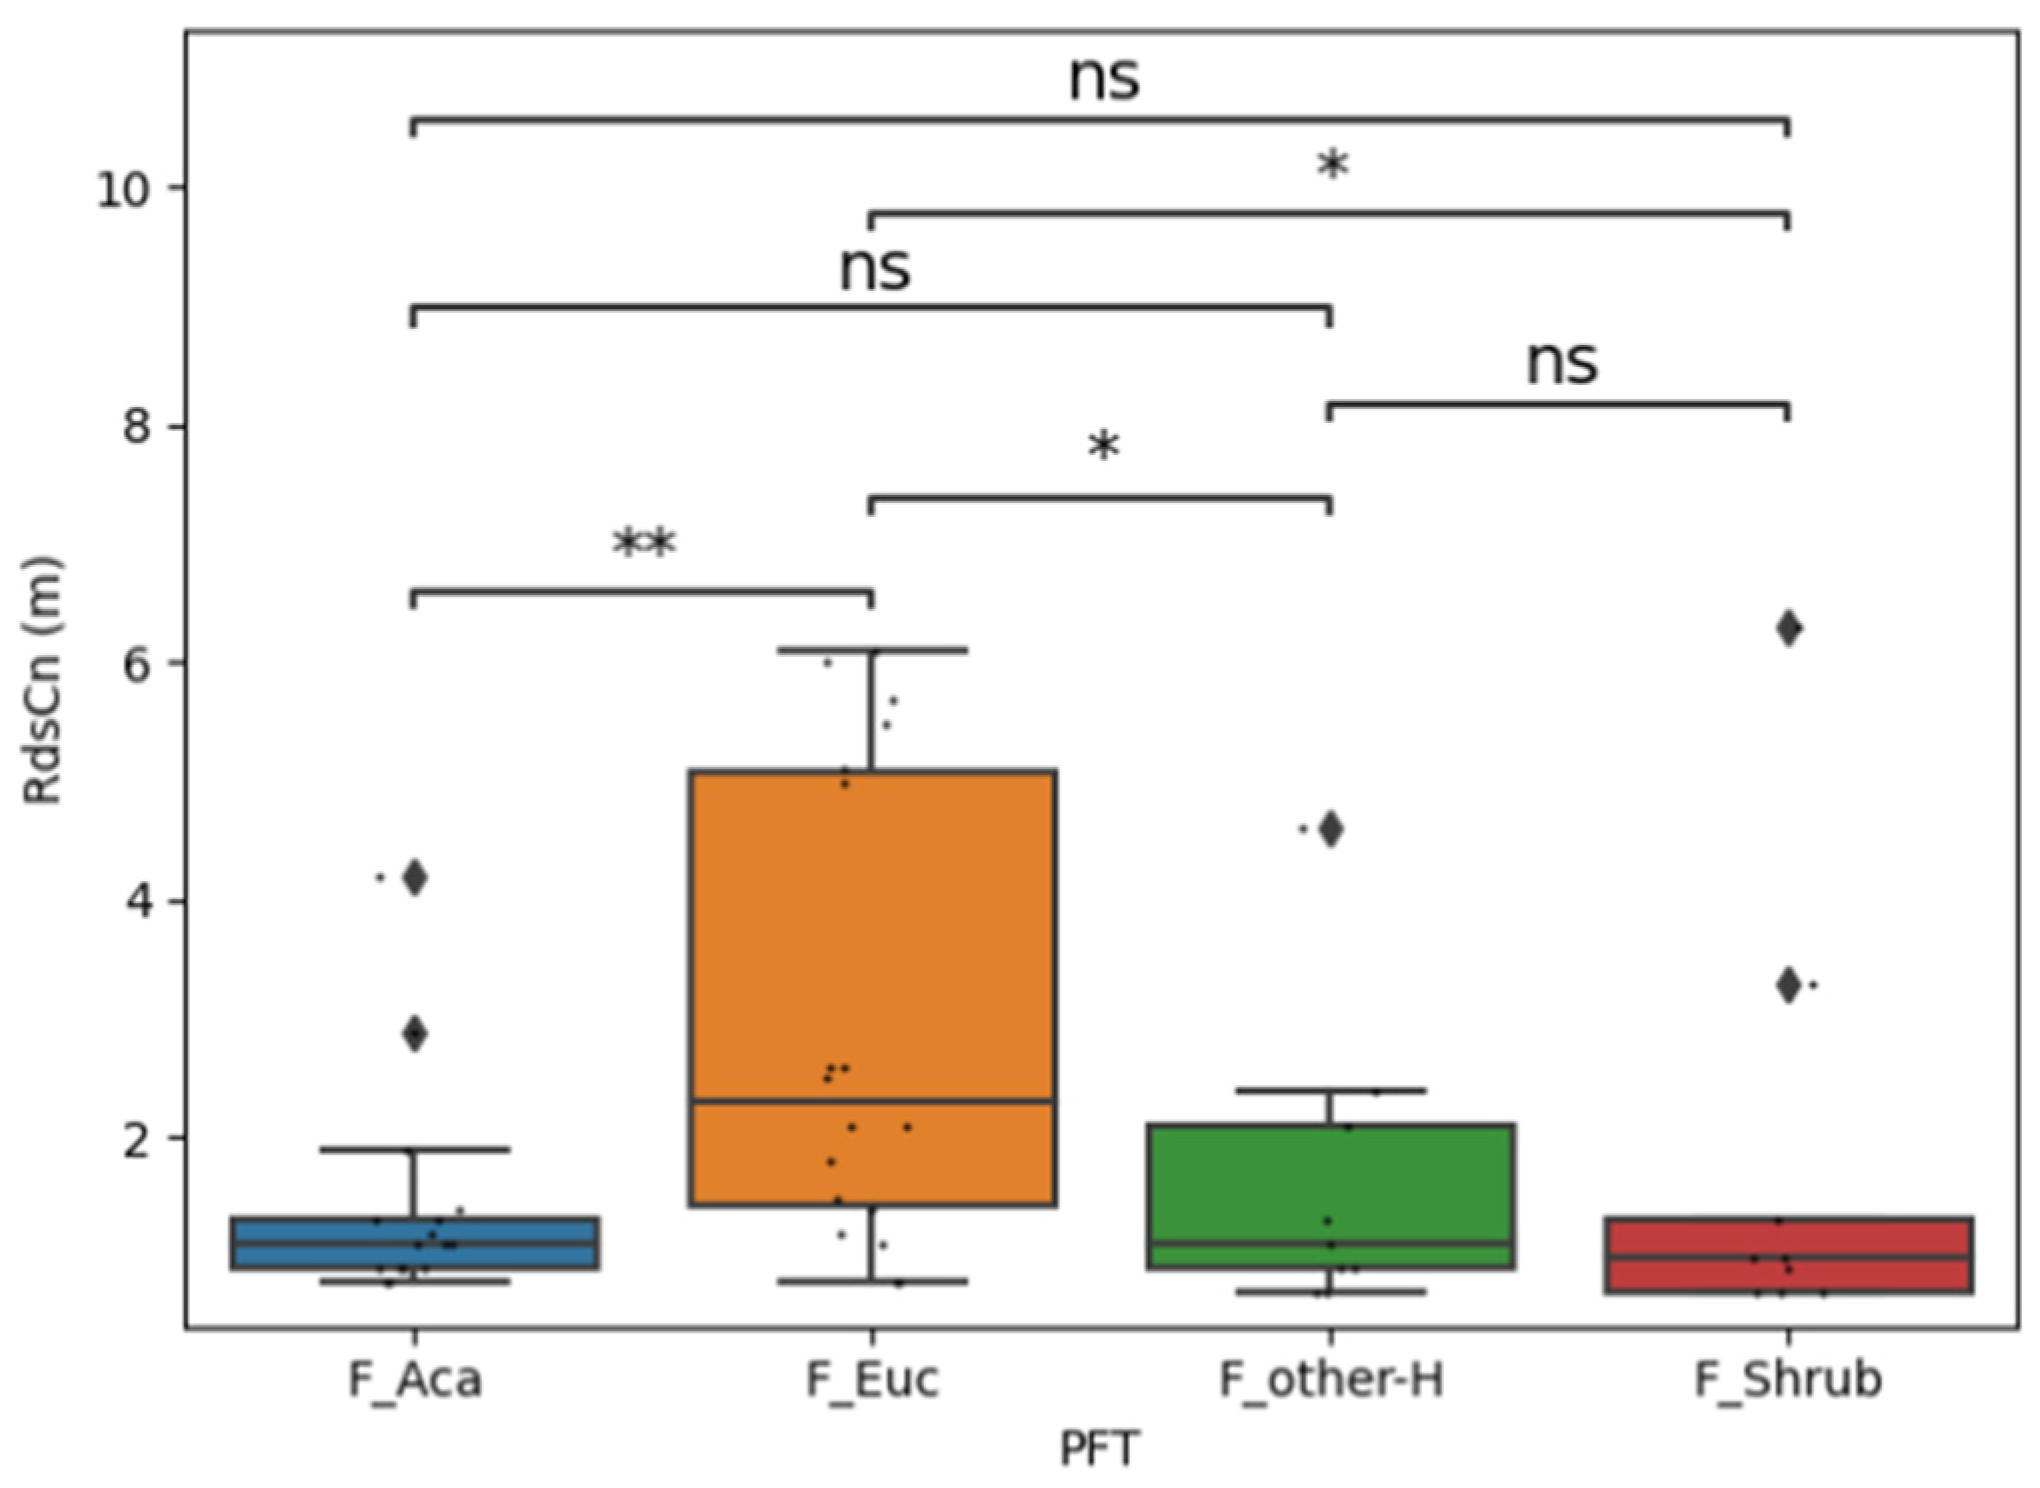
The results of the above-ground biomass (AGB) measurements are presented in Table 4. FEuc is by far the most productive PFT at all sites and is highly variable (e.g., 12.47–88.81 tC/ha in the age range of 21–35 years). On average, 96% of the total AGB is stored in FEuc, 2% in FAca, and 1% in both the Fother-H and the Fshrub. Only the sites S06_DS-TS_21 and S13_TS_25 have a significant AGB in FAca, 15% and 9%, respectively. Fother-H makes a very small contribution to the AGB at all ages. Fshrub contributes up to 3% to the AGB, except for the youngest site, where it can attain a contribution of up to 10% (S06_DS-TS_21 at age 21).
Based on the allometric equations for below-ground biomass (BGB) from Paul et al. [49], total biomass is about 30% higher than above-ground biomass. The mean annual increment (MAI) of total biomass varies from 1.06 to 4.91 tC/ha/yr between year 21 and 26 and declines to about 2.4 tC/ha/yr at a stand age above 30 years (Table 4).
Observations of above-ground biomass at the 14 sites were used as independent validation data for the model predictions (Figure 3). As 13 of the sites were resampled, the observations of the first sampling campaign are also presented in Figure 3 but not used in the validation metrics (Table 5). See Figures S1 and S2 for the results of both models for each site. Both models show good agreement with the observations that are included in their calibration (grey dots in Figure 3). When using MAE as a goodness-of-fit metric in the calibration process, the total bias (difference between average observed and average predicted) of FastTrack was 2.4 tC/ha, i.e., 4.2% of the observed average (57.3 tC/ha, Table 5). On average, FastTrack underestimated above-ground biomass at direct seeded sites by 16 tC/ha and overestimated above-ground biomass at planted tubestock and mixed direct seeded and planted tubestock sites by 14 tC/ha and 5.5 tC/ha, respectively.
The total error (mean of RMSE and MAE) is around 22 tC/ha (24.5 tC/ha RMSE, 19.2 tC/ha MAE). Overall, most of this error is partitioned to the unsystematic error (76% MSEu, 64% MAEu). However, for each planting configuration the bias and partitioning of the error over the systematic and unsystematic parts deviates quite strongly from this overall pattern (see Table 5). When using MSE as goodness of fit metric in the calibration, the total bias is 19.3 tC/ha, the total error about 29 tC/ha (31.6 tC/ha RMSE, 26.6 tC/ha MAE), but less than half of that error is partitioned to the unsystematic error (52% MSEu, 42% MAEu). Thus, MAE as goodness of fit metric in the calibration performed better than MSE, probably because very high and very low observations have more effect on the value of MSE than on MAE.
The total bias by FullCAM is −24.6 tC/ha in all planting configurations (−42.9% of the observed mean AGB), while the total error is 33 tC/ha (35.2 tC/ha RMSE, 30.5 tC/ha MAE). About one quarter of this error is partitioned to unsystematic error (28% MSEu, 19% MAEu). These numbers deviate quite strongly between the planting configurations (Table 5). However, both models find that at sites containing a mix of direct seeding and tubestock planting, the errors are fully attributable to the systematic component.
With respect to planting configuration, FastTrack overestimates above-ground biomass at sites established by tubestock planting and underestimates above-ground biomass at direct seeded sites. When using MSE as goodness of fit metric for the direct seeded sites, the bias is 1.5 tC/ha, whilst when using MAE this bias is 24 tC/ha. FullCAM underestimates all three planting configurations and predicts a carbon capture of around 30 tC/ha for all sites, except for S12_TS_25, despite quite large variability in the value of M (Table 1). The reason that S12_TS_31 deviates from the other sites is likely because the M is much higher for this site than any other site (Table 1).

3.2. Crown Radius

Differences in crown radius oriented parallel and perpendicular to the seeding line were small for all PFTs (Table S1). For FAca the crown radius perpendicular to the seeding line was on average 6 cm larger than in parallel to the seeding line, and 5 cm for FEuc, whilst for Fother-H, the crown radius in parallel to the seeding line was on average 15 cm larger than that perpendicular to the seeding line, and 11 cm for FShrub. None of the differences in crown radii in these two directions within PFTs was statistically significant based on a paired Student’s t test with α = 0.05. Testing on differences of pooled crown radii between PFTs up to an age of 23 years old showed that FEuc deviates from all other PFTs while the three other PFTs do not differ from each other (Figure 4).
FastTrack underestimated all crown radii except for the early growth of Acacia spp. (Figure 5). In the case of direct seeding, this underestimation could be because FastTrack takes a fixed distance between hedges of 5 m, so that the maximum crown radius can only be half this value. In the case of tubestock plantings, the planted tree density may be lower than the simulated density so that in the simulation, less space is available per tree. Another mechanism is that FastTrack does not allow for overlapping crowns or asymmetric crown competition. The large crowns of FEuc could be because they are much stronger competitors for space than the other PFTs. It is important to note that the SDD does not include information on crown radius or canopy cover. The values of the parameters associated to crown radii (max_RdsCn, max_dRdsCn_dt, Table 3) are thus inferred during the calibration process from the data by inverse modelling (see Discussion Section) and are not calibrated with observed crown radii.

3.3. Canopy Cover

We obtained 11 satellite images of which three sites (S05_DS-TS_17, S08_DS-TS_23, and S17_DS_27) had repeat observations, and five sites had measurements of above-ground biomass (Table 6). For all planting configurations we assume by default a maximum canopy cover of 80%, as this type of woodland never reaches 100% canopy closure [67,68]. This value was assumed to be attained after about 20 years (Table 6). As all five sites modelled are older than this age, the observed and predicted canopy cover values are in quite good agreement.

4. Discussion

Mathematical models are simplified representations of reality [69,70]. Their performance can be assessed based on their accuracy, reality, and generality; however, at best, two of these performance criteria can be met, not all three [28,29]. Thus, trade-off decisions need to be made during model building depending on the purpose for which the model is developed [71].
The FastTrack model was developed to attain the highest accuracy at the site level. The most important performance criterion is thus the fit to ideally independent local observations. Using this approach, the FastTrack model showed a positive bias across the three planting configurations of 2.4 tC/ha when using MAE, with about two-thirds of the error partitioned to unsystematic error (Table 5). However, these numbers differ quite strongly between the three planting configurations explored and the goodness-of-fit metrics applied, thus testing multiple metrics is advisable. FastTrack’s realism is that all model parameters and state variables have physical units that can be measured in the field and thus used for model calibration and validation. We undertook a preliminary test to improve model fit by adding canopy cover as calibration data using leave-one-out cross-validation, which resulted in an improved projection of both canopy cover and carbon capture (Figure S3). Currently, field measurement of canopy cover is a time-consuming process; therefore, we aim to automate both the analyses of satellite images and the use of leave-one-out cross-validation in the calibration process in a future version of FastTrack’s GUI. However, no causal processes representing growth are included in the model. Growth rates are based on the selection of representative SDD sites with observed biomass data. To include climate change impacts on growth in the future, SDD sites with a current climate that is representative of the future climate at the planting site needs to be selected. Climate projections are currently not included in the model GUI on SDD selection. Even then, environmental factors like a rise in atmospheric CO2 concentration are not represented in the observed productivity data at SDD sites and would need to be added to the model, e.g., as a growth modifier. The FastTrack model is based on the IPCC Tier 2 approach, which is globally applicable [34]. The IPCC model parameters BEFD, CF, R, and WD (Table 3) are widely measured, made available in global databases for many PFTs [50,53,72,73,74], and are relevant to extensive studies on allometric equations on the partitioning of above- and below-ground biomass, e.g., [46,49,75,76]. This makes the IPCC model very general, whilst allowing for accommodation to local conditions to include mixed-species forests, established by seeding and planting.
The FullCAM model was developed as national carbon accounting model for Australia [36]. The lack of bias of different modes of environmental plantings at the continental scale was thus the most important performance criterion [65], whilst accuracy on the local scale was an additional performance criterion after the model was developed. The recalibrated tree yield equation [37] performed well to the calibration data (grey dots in Figure 3). The total bias to this data was 5.8 tC/ha, with 65% of the MSE partitioned to unsystematic error. However, for the validation data, FullCAM had a bias of −24.6 tC/ha across configurations, with only one-quarter of the error partitioned as unsystematic. This is most likely due to the coarse resolution of the M layer (250 m), resulting in input values of M for a given location that are often not accurate. Further, it could be because the validation dataset has an older age range than the calibration data. Considering FullCAM’s realism, the free parameters of the tree yield equation (Equation (29)) do not have physical units and are therefore calibrated. However, the annual forest productivity index ( P a ), and its long-term average value thereof ( P ¯ ), are derived from a process-based model that includes causal relationships between tree growth and climate, soil type, and fertility [37,62]. Considering FullCAM’s generality, it is not designed to be applicable in countries other than Australia and is thus not general in space. However, the process-based approach to determine Pa allows for FullCAM to yield responses to climate change scenarios and fertilization so that the model is general in time.
For both FastTrack and FullCAM, calibration is an essential step to arrive at the most accurate prediction at the site level. In FastTrack, this is performed at the site level for each individual planting project as this model was developed for carbon capture projections at the planting project level. In FullCAM, this is performed at a multi-year cycle, as this model is developed for carbon capture projections at the continental scale. As stated by Paul and Roxburgh (2020) regarding the most recent FullCAM calibrations for mixed-species environmental plantings, although predictions were unbiased overall, they may nonetheless provide erroneous predictions at a given site [36]. However, given the absence of bias, individual over- and under-predictions will tend to cancel out for carbon accounting at the national scale.
Above-ground biomass is the most important data source, which should be available for the range at which model projections are performed. In the case of FastTrack, initial analysis suggests that satellite derived estimates of canopy cover have potential to enhance both the projected canopy cover and carbon capture. The advantage of using satellite images is that these can be retrospectively compiled, as satellite imaging has a history of decades. However, spatial resolution and therefore accuracy has improved over time. Although FastTrack can realistically project canopy cover (see Suplementary Material Figure S3), it does not do so for crown radius (Figure 5). The FastTrack model assumes an even-aged forest without overlapping crowns and with symmetrical competition. This was not the case in the six sites where we collected crown radius data, as at several sites a multilayered hedge developed. Moreover, FEuc was much more competitive than the other PFTs and could expand its crown well beyond the next hedge. Asymmetric crown competition coefficients can be calculated based on the newly collected data on crown radius; however, a multilayered canopy is beyond the scope of the FastTrack model.
For both FastTrack and FullCAM, calibration is performed by inverse modelling [77,78,79]. This approach allows for parameter values to be determined even if data for associated state variables are missing, e.g., canopy cover for FastTrack. However, inverse modelling is sensitive to the choice of the goodness-of-fit metric (see Table 5). For FastTrack, we applied MSE and MAE, which give different weights on outliers. Thus, the quality of the available data determines which goodness-of-fit metric performs best. Currently, that is determined in FastTrack by applying both metrics and selecting the metric that provides the most accurate calibration. Based on these results, we aim to test for a statistical metric of the quality of the fit [80] in the next version of the FastTrack model. The choice of both goodness-of-fit metric and the minimization algorithm determines the optimal set of parameter values. In the current study, we used the SLSPQ algorithm [60] for all sites. Automated testing of different metrics and algorithms could improve the accuracy of the calibration of local data for both FastTrack and FullCAM.
The weighting of data points could improve the prediction of both models. For reforestation projects funded by the carbon markets, an unbiased prediction at older ages (typically 40 years) is more important than a high goodness-of-fit over the entire age range of the simulation. Moreover, the SDD contains many observations for plantings less than 20 years old and very few observations for plantings older than 30 years. The leverage of the older data points could be increased by assigning the data points close to this age with higher weights, e.g., by using a normally distributed weighting factor [81], thereby making prediction at older ages more accurate.
The need to restore Australia’s deforested lands is broadly recognized by the government, the public, and the private sector. This is a huge effort that requires extensive funding. Existing voluntary and compliance carbon markets could play a role in funding forest and woodland restoration. Accurate carbon projections performed by transparent models play a key role in the decision making by parties that operate in these markets. FastTrack’s transparency is based on a full reporting of the SDD selection, calibration, and projection for each reforestation project, in a so-called ‘carbon capture projection report’. FullCAM’s transparency is based on scientific publications on the model structure [36,61], extensive field work to determine key model parameters [40,45,49,66], and model calibration [65,66].

5. Conclusions

To attain the highest accuracy of carbon capture projection at the site level, we recommend using a modelling environment that allows calibration of a model’s growth parameters using locally representative data for the specific planting, and whose generic species parameters can be obtained from open-source scientific databases. The choice of goodness-of-fit metric and minimization algorithm will both affect the model’s site level accuracy so that multiple alternatives of these two aspects need to be evaluated for a new planting.
Increasing the availability of representative data over the full simulated time horizon is key to improving the accuracy of carbon capture projection at the site level. Canopy cover data estimated from satellite images obtained in different years can further improve carbon capture projections. Future developments to include the impacts of climate change on data-driven carbon capture projection could use a data selection approach such that, for model calibration and validation, SDD sites where trees have grown under climatic conditions expected for the planting site under future climates are used.

Supplementary Materials

The following supporting information can be downloaded at: https://www.mdpi.com/article/10.3390/f15060990/s1, Figure S1. Time series of observed and predicted above-ground biomass (tC/ha) by the FastTrack model. Colored dots: data from 2022 sampling sites used in the validation. Grey dots: data from earlier sampling at SDD sites used in calibration, not used in the validation. Figure S2. Time series of observed and predicted above-ground biomass (tC/ha) by the FullCAM model. Colored dots: data from 2022 sampling sites used in the validation. Grey dots: data from earlier sampling at SDD sites used in calibration, not used in the validation [82].

Author Contributions

Conceptualization, K.K.; methodology, K.K., R.B., M.v.d.H., H.L., L.T.B., R.K., J.R.E., K.I.P. and J.H.; software, K.K., Y.G., R.B. and M.v.d.H.; validation, R.B., V.N. and Y.G.; formal analysis, K.K., R.B. and Y.G.; investigation, P.B., A.P., H.L., J.v.V. and Q.V.; resources, A.A., P.D. and H.H.; data curation, L.T.B., A.P., P.B., R.B. and M.v.d.H.; writing—original draft preparation, K.K., J.H., R.B. and V.N.; writing—review and editing, L.T.B., P.B., P.D., J.R.E., A.P., R.K., V.K., H.L., K.I.P., J.v.V. and Q.V.; visualization, Y.G., K.K. and R.B.; supervision, K.K.; funding acquisition, A.A. All authors have read and agreed to the published version of the manuscript.

Funding

This research received no external funding.

Data Availability Statement

Data is contained within the article.

Acknowledgments

We are grateful for the use of the TRY Plant Trait Database, the Biomass and Allometry Database, and the Global Wood Density Database. K.K. and R.B. are members of the IUFRO Task Force Resilient Planted Forests Serving Society & Bioeconomy.

Conflicts of Interest

K.K., R.B., H.H., Y.G., J.H., M.H., V.K., H.L., V.N., P.R, J.V., Q.V., and A.A. were at the time of writing employed by Land Life Company, and P.D. by Cassinia Environmental. The remaining authors declare that the research was conducted in the absence of any commercial or financial relationships that could be construed as a potential conflict of interest.

References

  1. Butchart, S.H.M.; Walpole, M.; Collen, B.; Van Strien, A.; Scharlemann, J.P.W.; Almond, R.E.A.; Baillie, J.E.M.; Bomhard, B.; Brown, C.; Bruno, J. Global Biodiversity: Indicators of Recent Declines. Science 2010, 328, 1164–1168. [Google Scholar] [CrossRef]
  2. Foley, J.A.; DeFries, R.; Asner, G.P.; Barford, C.; Bonan, G.; Carpenter, S.R.; Chapin, F.S.; Coe, M.T.; Daily, G.C.; Gibbs, H.K. Global Consequences of Land Use. Science 2005, 309, 570–574. [Google Scholar] [CrossRef]
  3. Portillo-Quintero, C.; Sanchez-Azofeifa, A.; Calvo-Alvarado, J.; Quesada, M.; do Espirito Santo, M.M. The Role of Tropical Dry Forests for Biodiversity, Carbon and Water Conservation in the Neotropics: Lessons Learned and Opportunities for Its Sustainable Management. Reg. Environ. Chang. 2015, 15, 1039–1049. [Google Scholar] [CrossRef]
  4. Quijas, S.; Romero-Duque, L.P.; Trilleras, J.M.; Conti, G.; Kolb, M.; Brignone, E.; Dellafiore, C. Linking Biodiversity, Ecosystem Services, and Beneficiaries of Tropical Dry Forests of Latin America: Review and New Perspectives. Ecosyst. Serv. 2019, 36, 100909. [Google Scholar] [CrossRef]
  5. FAO. Forests and Land Use in Drylands: The First Global Assessment—Full Report; FAO Forestry Paper No. 184; FAO: Rome, Italy, 2019; Volume 184, p. 193. [Google Scholar]
  6. Morton, S.; Lonsdale, M.; Sheppard, A. Biodiversity: Science and Solutions for Australia; Csiro Publishing: Clayton, VIC, Australia, 2014; ISBN 1486302076. [Google Scholar]
  7. Yates, C.J.; Hobbs, R.J. Temperate Eucalypt Woodlands: A Review of Their Status, Processes Threatening Their Persistence and Techniques for Restoration. Aust. J. Bot. 1997, 45, 949–973. [Google Scholar] [CrossRef]
  8. Lunt, I.D.; Eldridge, D.J.; Morgan, J.W.; Witt, G.B. A Framework to Predict the Effects of Livestock Grazing and Grazing Exclusion on Conservation Values in Natural Ecosystems in Australia. Aust. J. Bot. 2007, 55, 401–415. [Google Scholar] [CrossRef]
  9. Lindenmayer, D.; Bennett, A.F.; Hobbs, R. An Overview of the Ecology, Management and Conservation of Australia’s Temperate Woodlands. Ecol. Manag. Restor. 2010, 11, 201–209. [Google Scholar] [CrossRef]
  10. Murphy, H.; van Leeuwen, S. Australia State of the Environment 2021: Biodiversity; Independent Report to the Australian Government Minister for the Environment; Canberra, ACT, Autralia, 2021. [Google Scholar]
  11. Leishman, M.R.; Gallagher, R.V.; Catford, J.A.; Morgan, J.W.; Grice, A.C.; Setterfield, S.A. Invasive Plants and Pathogens in Australia. In Australian Vegetation; Cambridge University Press: Cambridge, UK, 2017; pp. 207–229. [Google Scholar]
  12. Gill, A.M. Fire and the Australian Flora: A Review. Aust. For. 1975, 38, 4–25. [Google Scholar] [CrossRef]
  13. DEECA Services. Bioregions and EVC Benchmarks. Available online: https://www.environment.vic.gov.au/biodiversity/bioregions-and-evc-benchmarks (accessed on 1 February 2024).
  14. Bryan, B.A.; Nolan, M.; Harwood, T.D.; Connor, J.D.; Navarro-Garcia, J.; King, D.; Summers, D.M.; Newth, D.; Cai, Y.; Grigg, N. Supply of Carbon Sequestration and Biodiversity Services from Australia’s Agricultural Land under Global Change. Glob. Environ. Chang. 2014, 28, 166–181. [Google Scholar] [CrossRef]
  15. Bekessy, S.A.; Wintle, B.A. Using Carbon Investment to Grow the Biodiversity Bank. Conserv. Biol. 2008, 22, 510–513. [Google Scholar] [CrossRef]
  16. Paul, K.I.; Roxburgh, S.H.; England, J.R.; de Ligt, R.; Larmour, J.S.; Brooksbank, K.; Murphy, S.; Ritson, P.; Hobbs, T.; Lewis, T.; et al. Improved Models for Estimating Temporal Changes in Carbon Sequestration in Above-Ground Biomass of Mixed-Species Environmental Plantings. For. Ecol. Manag. 2015, 338, 208–218. [Google Scholar] [CrossRef]
  17. Environmental Defender Office. Nature Repair. Market Bill. Submission. 2023. Available online: https://www.edo.org.au/wp-content/uploads/2023/03/230303-Nature-Repair-Market-Bill-EDO-submission.pdf (accessed on 1 February 2024).
  18. CBD. Kunming-Montreal Global Biodiversity Framework, Montreal. 2022. Available online: https://unctad.org/topic/trade-and-environment/biotrade/kunming-montreal-global-biodiversity-framework (accessed on 1 February 2024).
  19. Paul, K.I.; Cunningham, S.C.; England, J.R.; Roxburgh, S.H.; Preece, N.D.; Lewis, T.; Brooksbank, K.; Crawford, D.F.; Polglase, P.J. Managing Reforestation to Sequester Carbon, Increase Biodiversity Potential and Minimize Loss of Agricultural Land. Land. Use Policy 2016, 51, 135–149. [Google Scholar] [CrossRef]
  20. Chubb, I.; Bennett, A.; Gorring, A.; Hatfield-Dodds, S. Independent Review of Australian Carbon Credit Units. 2023. Available online: https://apo.org.au/node/321347 (accessed on 1 February 2024).
  21. Standish, R.J.; Hulvey, K.B. Co-benefits of Planting Species Mixes in Carbon Projects. Ecol. Manag. Restor. 2014, 15, 26–29. [Google Scholar] [CrossRef]
  22. Liang, J.; Crowther, T.W.; Picard, N.; Wiser, S.; Zhou, M.; Alberti, G.; Schulze, E.-D.; McGuire, A.D.; Bozzato, F.; Pretzsch, H. Positive Biodiversity-Productivity Relationship Predominant in Global Forests. Science 2016, 354, aaf8957. [Google Scholar] [CrossRef]
  23. Marron, N.; Epron, D. Are Mixed-Tree Plantations Including a Nitrogen-Fixing Species More Productive than Monocultures? For. Ecol. Manag. 2019, 441, 242–252. [Google Scholar] [CrossRef]
  24. Warner, E.; Cook-Patton, S.C.; Lewis, O.T.; Brown, N.; Koricheva, J.; Eisenhauer, N.; Ferlian, O.; Gravel, D.; Hall, J.S.; Jactel, H. Young Mixed Planted Forests Store More Carbon than Monocultures—A Meta-Analysis. Front. For. Glob. Chang. 2023, 6, 1226514. [Google Scholar] [CrossRef]
  25. Lada, H.; Yen, J.D.L.; Cunningham, S.C.; Selwood, K.E.; Falcke, P.; Hodgson, J.C.; Mac Nally, R. Influence of Climate on Individual Tree Growth and Carbon Sequestration in Native-tree Plantings. Austral Ecol. 2019, 44, 859–867. [Google Scholar] [CrossRef]
  26. Bauhus, J.; Khanna, P.K.; Menden, N. Aboveground and Belowground Interactions in Mixed Plantations of Eucalyptus Globulus and Acacia Mearnsii. Can. J. For. Res. 2000, 30, 1886–1894. [Google Scholar] [CrossRef]
  27. Forrester, D.I.; Bauhus, J.; Cowie, A.L. Carbon Allocation in a Mixed-Species Plantation of Eucalyptus Globulus and Acacia Mearnsii. For. Ecol. Manag. 2006, 233, 275–284. [Google Scholar] [CrossRef]
  28. Levins, R. The Strategy of Model Building in Population Biology. Am. Sci. 1966, 54, 421–431. [Google Scholar]
  29. Sharpe, P.J.H. Forest Modeling Approaches: Compromises between Generality and Precision. Process Modeling of Forest Growth Responses to Environmental Stress; Timber Press: Portland, OR, USA, 1990; pp. 180–190. [Google Scholar]
  30. Mahnken, M.; Cailleret, M.; Collalti, A.; Trotta, C.; Biondo, C.; d’Andrea, E.; Dalmonech, D.; Marano, G.; Mäkelä, A.; Minunno, F. Accuracy, Realism and General Applicability of European Forest Models. Glob. Chang. Biol. 2022, 28, 6921–6943. [Google Scholar] [CrossRef]
  31. Fontes, L.; Bontemps, J.-D.; Bugmann, H.; van Oijen, M.; Gracia, C.; Kramer, K.; Lindner, M.; Rötzer, T.; Skovsgaard, J.P. Models for Supporting Forest Management in a Changing. For. Syst. 2010, 19, 8–29. [Google Scholar] [CrossRef]
  32. Pretzsch, H.; Forrester, D.I.; Rötzer, T. Representation of Species Mixing in Forest Growth Models. A Review and Perspective. Ecol. Modell. 2015, 313, 276–292. [Google Scholar] [CrossRef]
  33. Battaglia, M.; Sands, P.J. Process-Based Forest Productivity Models and Their Application in Forest Management. For. Ecol. Manage 1998, 102, 13–32. [Google Scholar] [CrossRef]
  34. Eggleston, H.S.; Buendia, L.; Miwa, K.; Ngara, T.; Tanabe, K. IPCC Guidelines for National Greenhouse Gas Inventories. Volume 4: Agriculture, Forestry and Other Land Use; Institute for Global Environmental Strategies: Hayama, Japan, 2006; Volume 4. [Google Scholar]
  35. Requena Suarez, D.; Rozendaal, D.M.A.; De Sy, V.; Phillips, O.L.; Alvarez-Dávila, E.; Anderson-Teixeira, K.; Araujo-Murakami, A.; Arroyo, L.; Baker, T.R.; Bongers, F. Estimating Aboveground Net Biomass Change for Tropical and Subtropical Forests: Refinement of IPCC Default Rates Using Forest Plot Data. Glob. Chang. Biol. 2019, 25, 3609–3624. [Google Scholar] [CrossRef]
  36. FullCAM. Full Carbon Accounting Model (FullCAM). Available online: https://www.dcceew.gov.au/climate-change/publications/full-carbon-accounting-model-fullcam (accessed on 1 February 2024).
  37. Paul, K.I.; Roxburgh, S.H. Predicting Carbon Sequestration of Woody Biomass Following Land Restoration. For. Ecol. Manage 2020, 460, 117838. [Google Scholar] [CrossRef]
  38. Paul, K.I.; Roxburgh, S.; Larmour, J.; Davies, M.; England, J.; Peck, A.; Hagger, V.; Perring, M.; Lowson, C.; Read, Z.; et al. Stem Diameter Inventories within Stands of Environmental or Mallee Plantings or Natural Regeneration. Available online: https://ouci.dntb.gov.ua/en/works/7WoaOXL7/ (accessed on 1 February 2024).
  39. England, J.R.; Theiveyanathan, S.; Paul, K.I.; Polglase, P.; Koul, V.; Larmour, J.; Smith, J.; Stewart, L. Water Use, Growth, and Carbon Sequestration of Environmental Plantings; Final Report, Commercial Environmental Forestry Project; CSIRO: Canberra, ACT, Australia, 2006. [Google Scholar]
  40. Paul, K.; Roxburgh, S.; Raison, J.; Larmour, J.; England, J.; Murphy, S.; Norris, J.; Ritson, P.; Brooksbank, K.; Hobbs, M. Improved Estimation of Biomass Accumulation by Environmental Plantings and Mallee Plantings Using FullCAM; CSIRO; Department of the Environment: Canberra, ACT, Australia, 2013. [Google Scholar]
  41. England, J.R.; Paul, K.I.; Cunningham, S.C.; Madhavan, D.B.; Baker, T.G.; Read, Z.; Wilson, B.R.; Cavagnaro, T.R.; Lewis, T.; Perring, M.P. Previous Land Use and Climate Influence Differences in Soil Organic Carbon Following Reforestation of Agricultural Land with Mixed-Species Plantings. Agric. Ecosyst. Environ. 2016, 227, 61–72. [Google Scholar] [CrossRef]
  42. Paul, K.I.; England, J.R.; Baker, T.G.; Cunningham, S.C.; Perring, M.P.; Polglase, P.J.; Wilson, B.; Cavagnaro, T.R.; Lewis, T.; Read, Z. Using Measured Stocks of Biomass and Litter Carbon to Constrain Modelled Estimates of Sequestration of Soil Organic Carbon under Contrasting Mixed-Species Environmental Plantings. Sci. Total Environ. 2018, 615, 348–359. [Google Scholar] [CrossRef]
  43. Verschuuren, J. Towards a Regulatory Design for Reducing Emissions from Agriculture: Lessons from Australia’s Carbon Farming Initiative. Climate Law. 2017, 7, 1–51. [Google Scholar] [CrossRef]
  44. UNFCCC. A/R Methodological Tool “Calculation of the Number of Sample Plots for Measurements within A/R CDM Project Activities”; (EB 58 Report, Version 02.1.0, Annex 19); UNFCCC: Bonn, Germany, 2010. [Google Scholar]
  45. Paul, K.I.; Roxburgh, S.H.; England, J.R.; Ritson, P.; Hobbs, T.; Brooksbank, K.; Raison, R.J.; Larmour, J.S.; Murphy, S.; Norris, J. Development and Testing of Allometric Equations for Estimating Above-Ground Biomass of Mixed-Species Environmental Plantings. For. Ecol. Manag. 2013, 310, 483–494. [Google Scholar] [CrossRef]
  46. Paul, K.I.; Roxburgh, S.H.; Chave, J.; England, J.R.; Zerihun, A.; Specht, A.; Lewis, T.; Bennett, L.T.; Baker, T.G.; Adams, M.A.; et al. Testing the Generality of Above-Ground Biomass Allometry across Plant Functional Types at the Continent Scale. Glob. Chang. Biol. 2016, 22, 2106–2124. [Google Scholar] [CrossRef]
  47. Paul, K.I.; Roxburgh, S.H. A National Accounting Framework for Fire and Carbon Dynamics in Australian Savannas. Int. J. Wildland Fire 2024, 33, WF23104. [Google Scholar] [CrossRef]
  48. Gifford, R.M. Carbon Contents of Above-Ground Tissues of Forest and Woodland Trees; Australian Greenhouse Office: Canberra, ACT, Australia, 2000. [Google Scholar]
  49. Paul, K.I.; Larmour, J.; Specht, A.; Zerihun, A.; Ritson, P.; Roxburgh, S.H.; Sochacki, S.; Lewis, T.; Barton, C.V.M.; England, J.R. Testing the Generality of Below-Ground Biomass Allometry across Plant Functional Types. For. Ecol. Manag. 2019, 432, 102–114. [Google Scholar] [CrossRef]
  50. Falster, D.S.; Duursma, R.A.; Ishihara, M.I.; Barneche, D.R.; FitzJohn, R.G.; Vårhammar, A.; Aiba, M.; Ando, M.; Anten, N.; Aspinwall, M.J.; et al. BAAD: A Biomass and Allometry Database for Woody Plants. Ecology 2015, 96, 1445. [Google Scholar] [CrossRef]
  51. Martin, A.R.; Doraisami, M.; Thomas, S.C. Global Patterns in Wood Carbon Concentration across the World’s Trees and Forests. Nat. Geosci. 2018, 11, 915–920. [Google Scholar] [CrossRef]
  52. Zanne, A.E. Global Wood Density Database. Dryad 2009. Available online: https://www.scirp.org/reference/referencespapers?referenceid=1998611 (accessed on 1 February 2024).
  53. Kattge, J.; Bönisch, G.; Díaz, S.; Lavorel, S.; Prentice, I.C.; Leadley, P.; Tautenhahn, S.; Werner, G.D.A.; Aakala, T.; Abedi, M. TRY Plant Trait Database–Enhanced Coverage and Open Access. Glob. Chang. Biol. 2020, 26, 119–188. [Google Scholar] [CrossRef]
  54. Gauch, H.G.; Hwang, J.T.G.; Fick, G.W. Model Evaluation by Comparison of Model-based Predictions and Measured Values. Agron. J. 2003, 95, 1442–1446. [Google Scholar] [CrossRef]
  55. Willmott, C.J. On the Validation of Models. Phys. Geogr. 1981, 2, 184–194. [Google Scholar] [CrossRef]
  56. Willmott, C.J. Some Comments on the Evaluation of Model Performance. Bull. Am. Meteorol. Soc. 1982, 63, 1309–1313. [Google Scholar] [CrossRef]
  57. Robeson, S.M.; Willmott, C.J. Decomposition of the Mean Absolute Error (MAE) into Systematic and Unsystematic Components. PLoS ONE 2023, 18, e0279774. [Google Scholar] [CrossRef]
  58. Nelder, J.A.; Mead, R. A Simplex Method for Function Minimization. Comput. J. 1965, 7, 308–313. [Google Scholar] [CrossRef]
  59. Powell, M.J.D. An Efficient Method for Finding the Minimum of a Function of Several Variables without Calculating Derivatives. Comput. J. 1964, 7, 155–162. [Google Scholar] [CrossRef]
  60. Pfeiffer, K.; Kheddar, A. Sequential Hierarchical Least-Squares Programming for Prioritized Non-Linear Optimal Control. Optim. Methods Softw. 2024, 1–39. [Google Scholar] [CrossRef]
  61. Waterworth, R.M.; Richards, G.P.; Brack, C.L.; Evans, D.M.W. A Generalised Hybrid Process-Empirical Model for Predicting Plantation Forest Growth. For. Ecol. Manag. 2007, 238, 231–243. [Google Scholar] [CrossRef]
  62. Kesteven, J.L.; Landsberg, J.J. Developing a National Forest Productivity Model; Australian Greenhouse Office: Canberra, ACT, Australia, 2004. [Google Scholar]
  63. Paul, K.I.; Roxburgh, S.H.; Larmour, J.; Davies, M.; England, J.; Peck, A.; Hagger, V.; Perring, M.; Lowson, C.; Read, Z.; et al. Secondment with DoEE NISIR. Available online: https://data.csiro.au/categories/pt/Secondment%20with%20DoEE%20NISIR (accessed on 1 February 2024).
  64. DoEE. National Inventory Report 2017 Volume 2. 2017. Available online: https://www.dcceew.gov.au/sites/default/files/documents/national-inventory-report-2017-volume-2.pdf (accessed on 1 February 2024).
  65. Roxburgh, S.; England, J.R.; Paul, K.I. Recalibration of the Tree Yield Formula in FullCAM for Plantations. 2020. Available online: https://publications.csiro.au/publications/publication/PIcsiro:EP197723 (accessed on 1 February 2024).
  66. Roxburgh, S.H.; Karunaratne, S.B.; Paul, K.I.; Lucas, R.M.; Armston, J.D.; Sun, J. A Revised Above-Ground Maximum Biomass Layer for the Australian Continent. For. Ecol. Manag. 2019, 432, 264–275. [Google Scholar] [CrossRef]
  67. Prober, S.M.; Gosper, C.R.; Gilfedder, L.; Harwood, T.D.; Thiele, K.R.; Williams, K.J.; Yates, C.J.; Keith, D.A. Temperate Eucalypt Woodlands. In Australian Vegetation; Cambridge University Press: Cambridge, UK, 2017; pp. 410–437. [Google Scholar]
  68. Yates, C.J.; Gosper, C.R.; Hopper, S.D.; Keith, D.A.; Prober, S.M.; Tozer, M.G. Mallee Woodlands and Shrublands: The Mallee, Muruk/Muert and Maalok Vegetation of Southern Australia. In Australian Vegetation; Cambridge University Press: Cambridge, UK, 2017; pp. 570–598. [Google Scholar]
  69. Giere, R.N. How Models Are Used to Represent Reality. Philos. Sci. 2004, 71, 742–752. [Google Scholar] [CrossRef]
  70. Wartofsky, M.W. Models: Representation and the Scientific Understanding; Springer Science & Business Media: Berlin/Heidelberg, Germany, 2012; Volume 48, ISBN 9400993579. [Google Scholar]
  71. Matthewson, J. Trade-Offs in Model-Building: A More Target-Oriented Approach. Stud. Hist. Philos. Sci. Part A 2011, 42, 324–333. [Google Scholar] [CrossRef]
  72. Díaz, S.; Kattge, J.; Cornelissen, J.H.C.; Wright, I.J.; Lavorel, S.; Dray, S.; Reu, B.; Kleyer, M.; Wirth, C.; Colin Prentice, I.; et al. The Global Spectrum of Plant Form and Function. Nature 2016, 529, 167–171. [Google Scholar] [CrossRef]
  73. Zanne, A.E.; Westoby, M.; Falster, D.S.; Ackerly, D.D.; Loarie, S.R.; Arnold, S.E.J.; Coomes, D.A. Angiosperm Wood Structure: Global Patterns in Vessel Anatomy and Their Relation to Wood Density and Potential Conductivity. Am. J. Bot. 2010, 97, 207–215. [Google Scholar] [CrossRef]
  74. Chave, J.; Coomes, D.; Jansen, S.; Lewis, S.L.; Swenson, N.G.; Zanne, A.E. Towards a Worldwide Wood Economics Spectrum. Ecol. Lett. 2009, 12, 351–366. [Google Scholar] [CrossRef]
  75. Conti, G.; Gorne, L.D.; Zeballos, S.R.; Lipoma, M.L.; Gatica, G.; Kowaljow, E.; Whitworth-Hulse, J.I.; Cuchietti, A.; Poca, M.; Pestoni, S. Developing Allometric Models to Predict the Individual Aboveground Biomass of Shrubs Worldwide. Glob. Ecol. Biogeogr. 2019, 28, 961–975. [Google Scholar] [CrossRef]
  76. Ma, H.; Mo, L.; Crowther, T.W.; Maynard, D.S.; van den Hoogen, J.; Stocker, B.D.; Terrer, C.; Zohner, C.M. The Global Distribution and Environmental Drivers of Aboveground versus Belowground Plant Biomass. Nat. Ecol. Evol. 2021, 5, 1110–1122. [Google Scholar] [CrossRef]
  77. Hartig, F.; Dyke, J.; Hickler, T.; Higgins, S.I.; O’Hara, R.B.; Scheiter, S.; Huth, A. Connecting Dynamic Vegetation Models to Data–an Inverse Perspective. J. Biogeogr. 2012, 39, 2240–2252. [Google Scholar] [CrossRef]
  78. Hartig, F.; Calabrese, J.M.; Reineking, B.; Wiegand, T.; Huth, A. Statistical Inference for Stochastic Simulation Models–Theory and Application. Ecol. Lett. 2011, 14, 816–827. [Google Scholar] [CrossRef]
  79. Berzaghi, F.; Wright, I.J.; Kramer, K.; Oddou-Muratorio, S.; Bohn, F.J.; Reyer, C.P.O.; Sabaté, S.; Sanders, T.G.M.; Hartig, F. Towards a New Generation of Trait-Flexible Vegetation Models. Trends Ecol. Evol. 2020, 35, 191–205. [Google Scholar] [CrossRef]
  80. Gelman, A.; Carlin, J.B.; Stern, H.S.; Rubin, D.B. Bayesian Data Analysis, 2nd ed.; Chapman and Hall/CRC: Boca Raton, FL, USA, 2003; ISBN 0429258410. [Google Scholar]
  81. Kalton, G.; Flores-Cervantes, I. Weighting Methods. J. Off. Stat. 2003, 19, 81. [Google Scholar]
  82. Vehtari, A.; Gelman, A.; Gabry, J. Practical Bayesian Model Evaluation Using Leave-One-out Cross-Validation and WAIC. Stat. Comput. 2017, 27, 1413–1432. [Google Scholar] [CrossRef]
Figure 1. Location of the sites where data on crown radius, canopy over, and productivity were collected for the validation of FastTrack and FullCAM predictions.
Forests 15 00990 g001
Figure 2. Location of sites in the Stem Diameter Database used for the calibration of both FastTrack and FullCAM.
Forests 15 00990 g002
Figure 3. Observed vs. predicted above-ground biomass (tC/ha) for FastTrack and FullCAM models. Colored dots: above-ground matter data from 2022 sampling sites used validation. Purple: DS; orange: TS; green: DS + TS. Grey dots: above-ground biomass observation from earlier sampling at SDD sites used in calibration of both FastTrack and FullCAM, not used in the validation metrics of Table 4. Horizontal error bars depict 1σ based on the variation in observed data. Vertical error bars depict both 1σ (thick) and the extremum (thin) of the uncertainty for the FastTrack model.
Forests 15 00990 g003
Figure 4. Test of differences in crown radius (RdsCn) between PFTs at sites less than 24 years old. A Mann–Whitney-U test was used as the distribution of crown radii of FEuc and Fother-H was right-skewed. Crown radius data parallel and perpendicular to the seeding line were pooled. ns—not significant (p > 0.05), *—p < 0.05, **—p < 0.01.
Forests 15 00990 g004
Figure 5. Observed vs. predicted by the FastTrack model crown radius (m) both parallel and perpendicular to the seeding line. Purple: direct seeded; orange: tubestock planted.
Forests 15 00990 g005
Table 1. Characteristics of the sites where validation data were collected. Explanation of abbreviations: planting configurations: DS—direct seeding; TS-tubestock. Validation type: AGB-above-ground biomass; CR-crown radius; CC-canopy cover. MAT-mean annual temperature (°C). MAP-mean annual precipitation (mm/yr) in the period 1991–2021. ASP-elevation above sea level (m). n trees-number of trees measured per site. n sites-number of SDD sites selected for the calibration of FastTrack (see Section 2.2.1). M -potential above-ground biomass (tDM/ha) used in FullCAM (see Section 2.2.2).
Site IDAgen
Trees
Planting MethodPlanting Config.Validation Type(s)latlonMATMAPASLn
Sites
M
S01_DS_44210blockDSCR−36.29143.6515.8454181
S02_DS_88245blockDSCR−36.77143.2014.5505263
S03_DS-TS_99184blockDS + TSCR + CC−35.92141.8616.334981
S04_DS_1212250blockDSCR−36.42143.7715.7484171
S05_DS-TS_1717203blockDSCR + CC−36.15141.6815.8373131
S06_DS-TS_2121702blockDS + TSAGB + CR−36.25141.8115.63701162023
S07_TS_2323425beltTSAGB + CR−36.56146.0914.67262102281
S08_DS-TS_2323249blockDS + TSCR + CC−36.25141.8115.6378119
S09_DS-TS_2323336blockDS + TSAGB + CR−36.54142.6115.44271363229
S10_DS_2424602beltDSAGB + CR−36.82145.1714.85831322568
S11_DS_2525189beltDSAGB + CR−36.42146.0914.86881702565
S12_TS_2525573beltTSAGB + CR−36.53146.1214.375921837215
S13_TS_2525272blockTSAGB + CR + CC−37.25144.9913.06052775094
S14_TS_2525305blockTSAGB + CR−36.50146.1414.572619439115
S15_TS_2626165beltTSAGB + CR−36.49145.8115.16491662180
S16_DS_2727272beltDSAGB + CR−36.42146.1314.66981702548
S17_DS_2727515blockDSAGB + CR + CC−37.07144.9113.756932682103
S18_DS_3131160beltDSAGB + CR−37.02144.9413.95872424489
S19_TS_3131134blockTSAGB + CR + CC−37.05144.9313.75892783994
S20_TS_353553blockTSAGB + CR + CC−37.24145.0013.06172953295
Table 2. State variables of the FastTrack model.
Variable UnitVariable Description
CvrCnf/haCrown cover
CO2kgCO2/treeCarbon stock
DnsTr#/haTree density per hectares
LngHdgmLength of the hedge in case of direct seeding
RdsCnmRadius of the crown perpendicular to the hedge in case of direct seeding
RdsCn2mRadius of the crown in the direction of the hedge in case of Direct seeding
RdsStcmRadius of the stem at breast height
SrfCnm2Crown surface area
VlmStm3/haVolume of the stem
WghRtkg/haRoot weight
WghShkg/haShoot weight
WghStkg/haStem weight
WghTrkg/haTree weight
Table 3. Parameters of the FastTrack model.
Parameter UnitParameter DescriptionSource
BEFDkg/kgBiomass expansion factor on a dry weight base, i.e., shoot-to-stem ratio.Biomass And Allometry Database (BAAD) [50] or calibrated on AGB
CFkgC/kgDMWood carbon concentration[51]
fMrtyr-1Fraction of mortalityDefault mortality rates: first 3 years since planting: 5% Mortality, year 4–40: 2% mortality
max_dVlmSt_dtm3/ha/yrMaximum current annual stem volume incrementCalibrated
max_RdsCnmMaximum crown radiusCalibrated
max_dRdsCn_dtyr-1Maximal relative increase in crown radiusCalibrated
Rkg/kgShoot-to-root ratioBiomass And Allometry Database [50], or calibrated on BGB
WDkg/m3Wood densityGlobal Wood Density Database [52], TRY database [53]
Table 4. Above-ground biomass carbon (tC/ha) for the different plant functional types (PFTs) within the 14 plantings measured in 2022. Total biomass (AGB+BGB) across PFTs per site (tC/ha) and mean annual increment (MAI, tC/ha/yr, calculated as total biomass/age).
Above-GroundTotal
FAcaFEucFotherFShrub
Site IdAgeBiomassstdnBiomassstdnBiomassstdnBiomassstdnBiomassMAI
S06_DS-TS_21212.551.32412.473.5040.200.3641.620.73422.331.06
S07_TS_23230.110.09363.6111.8432.051.6130.150.07386.093.74
S09_DS-TS_23230.020.03318.075.8030.860.5530.370.17325.711.12
S10_DS_24241.451.40388.3379.984 00.540.694117.784.91
S11_DS_25250.410.52288.8123.1320.05 10.250.152115.794.63
S12_TS_25250.020.02449.5314.1041.310.4230.020.03366.032.64
S13_TS_25254.883.55449.9218.6340.080.0920.090.13270.552.82
S14_TS_25250.100.08452.100.984 0.000.00367.872.71
S15_TS_26260.040.02458.4210.064 0.030.05476.462.94
S16_DS_27270.520.12273.4314.3530.21 10.200.28297.023.59
S17_DS_27270.070.06242.829.652 0.230.22257.732.14
S18_DS_31310.13 153.894.5920.070.102 71.132.29
S19_TS_31310.01 159.0315.4751.352.0030.00 178.042.52
S20_TS_3535 73.6119.264 94.992.71
Table 5. Validation metrics when applying FastTrack and FullCAM to the 14 sites. FastTrack MAE indicates calibration performed by minimizing MAE (Equation (23)), FastTrack MSE indicates calibration performed by minimizing MSE (Equation (22)). DS-direct seeding; TS-tubestock. RMSE-root mean square error; MSE-mean square error; MAE-mean absolute error. Subscripts: _s-systematic; _u-unsystematic; _b-bias; _p-proportionality. See Calibration of Growth Parameters of the FastTrack Model for further explanation.
Model GoF ConfigurationAvg. obsAvg. predRMSEMSEu/MSEMSEs/MSEMAEMAEu/MAEMAEb/MAEMAEp/MAE
tC/hatC/hatC/ha%%tC/ha%%%
FastTrack MAE
DS70.154.130.379326.794151
DS and TS18.125.611.601008.804654
TS59.473.422.6574316.7424513
total57.359.724.5762419.264828
FastTrack MSE
DS70.168.622.4277319.230565
DS and TS18.148.730.7010030.70982
TS59.490.237.0158530.8235721
total57.376.631.6524826.6424316
FullCAM
DS70.131.345.429838.876429
DS and TS18.17.210.9010010.90973
TS59.44131.2356530.2284329
Total57.332.735.2287230.5195525
Table 6. Observed and predicted (by the FastTrack model) canopy cover (%). Observed values determined by analyses of satellite images of field sites at different years. Age-stand age at image capture; year-year of image capture.
Site IdAgeObserved Canopy Cover (%)Predicted Canopy Cover (%)Year
S03_DS-TS_9925.2 2021
S05_DS-TS_171028.9 2016
S08_DS-TS_231643.1 2016
S05_DS-TS_171771.3 2023
S08_DS-TS_232172.8 2021
S08_DS-TS_232383.4 2023
S13_TS_252571.178.6 ± 0.22022
S17_DS_272787.280.4 ± 0.72022
S17_DS_272984.280.5 ± 0.82024
S19_TS_313180.178.4 ± 0.32022
S20_TS_353572.578.1 ± 0.42022
Disclaimer/Publisher’s Note: The statements, opinions and data contained in all publications are solely those of the individual author(s) and contributor(s) and not of MDPI and/or the editor(s). MDPI and/or the editor(s) disclaim responsibility for any injury to people or property resulting from any ideas, methods, instructions or products referred to in the content.

