Chloroplast Spacer DNA Analysis Revealed Insights into Phylogeographical Structure of Phoebe chekiangensis

 , and
, and
Abstract
:1. Introduction
2. Materials and Methods
2.1. Plant Materials and DNA Extraction
2.2. Chloroplast DNA, Amplification, Sequencing, and Sequence Alignment
2.3. Genetic Diversity, Haplotype Network Construction, and Haplotype Distribution
2.4. Population Genetic Structure
2.5. Phylogenetic Analyses and Divergence Time Estimation
2.6. Tests of Expansion
3. Results
3.1. Sequence Variation and Haplotype Frequency
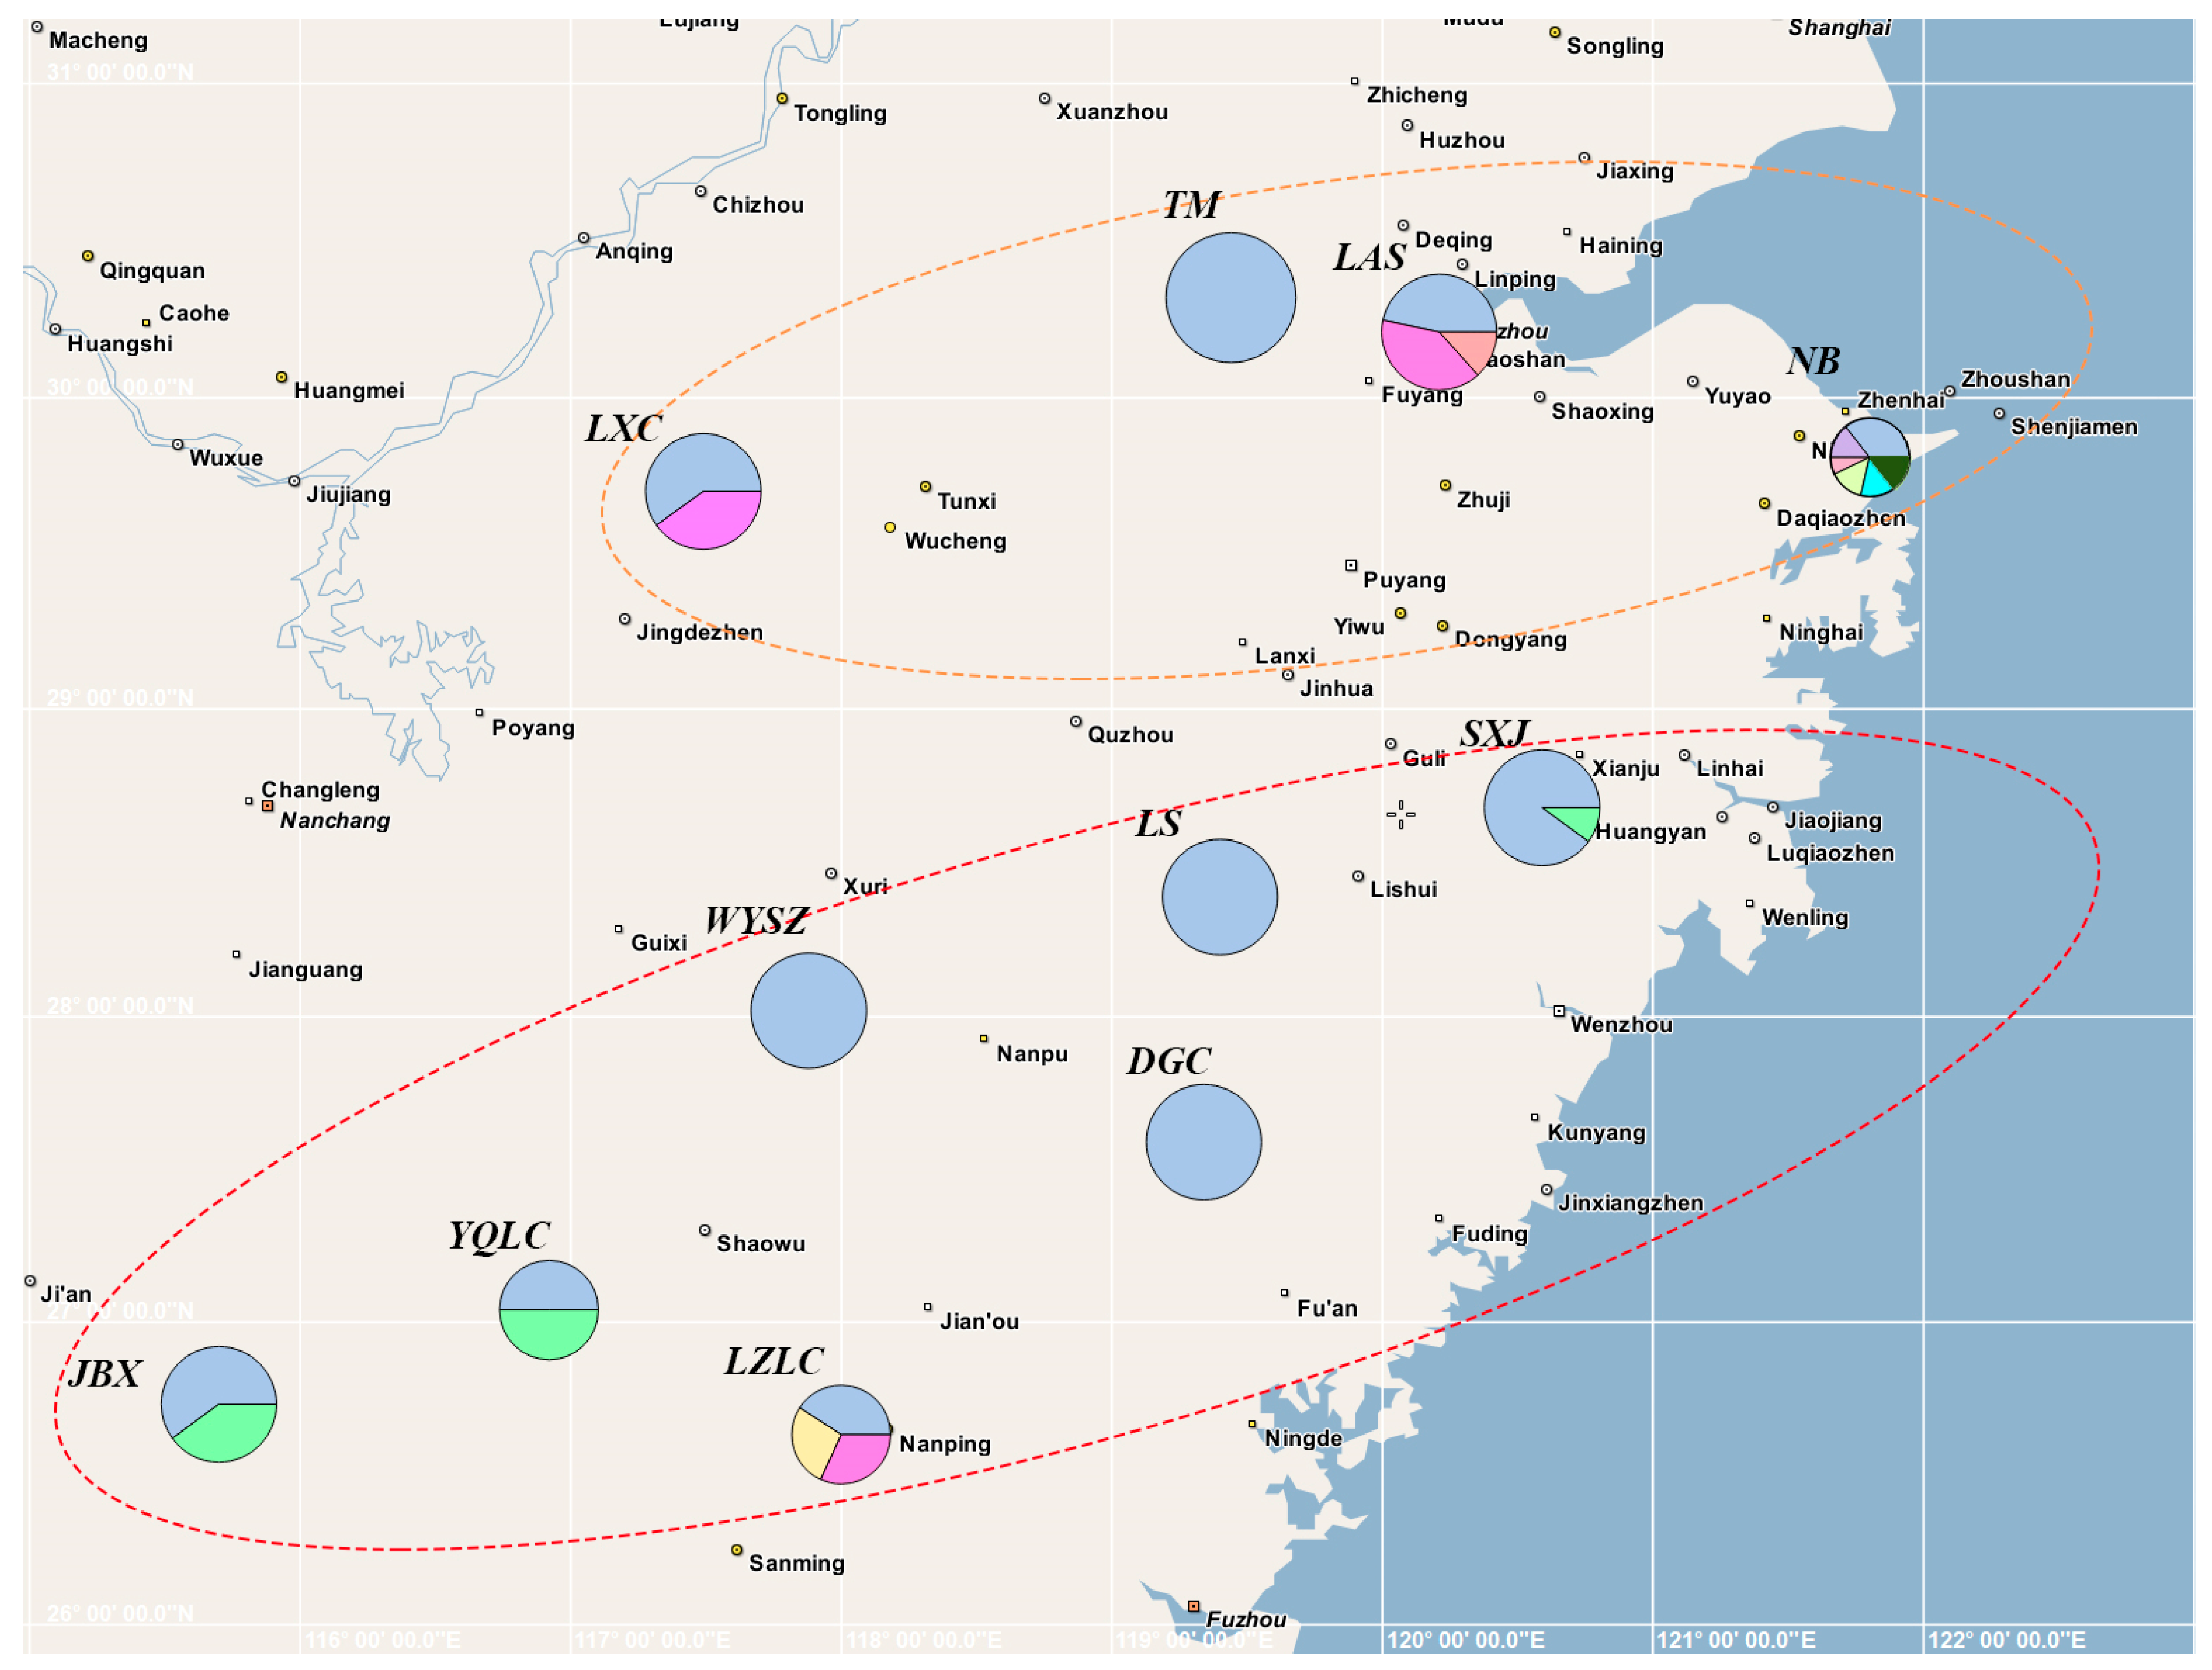
3.2. Haplotype Distribution and Geographical Distribution Pattern
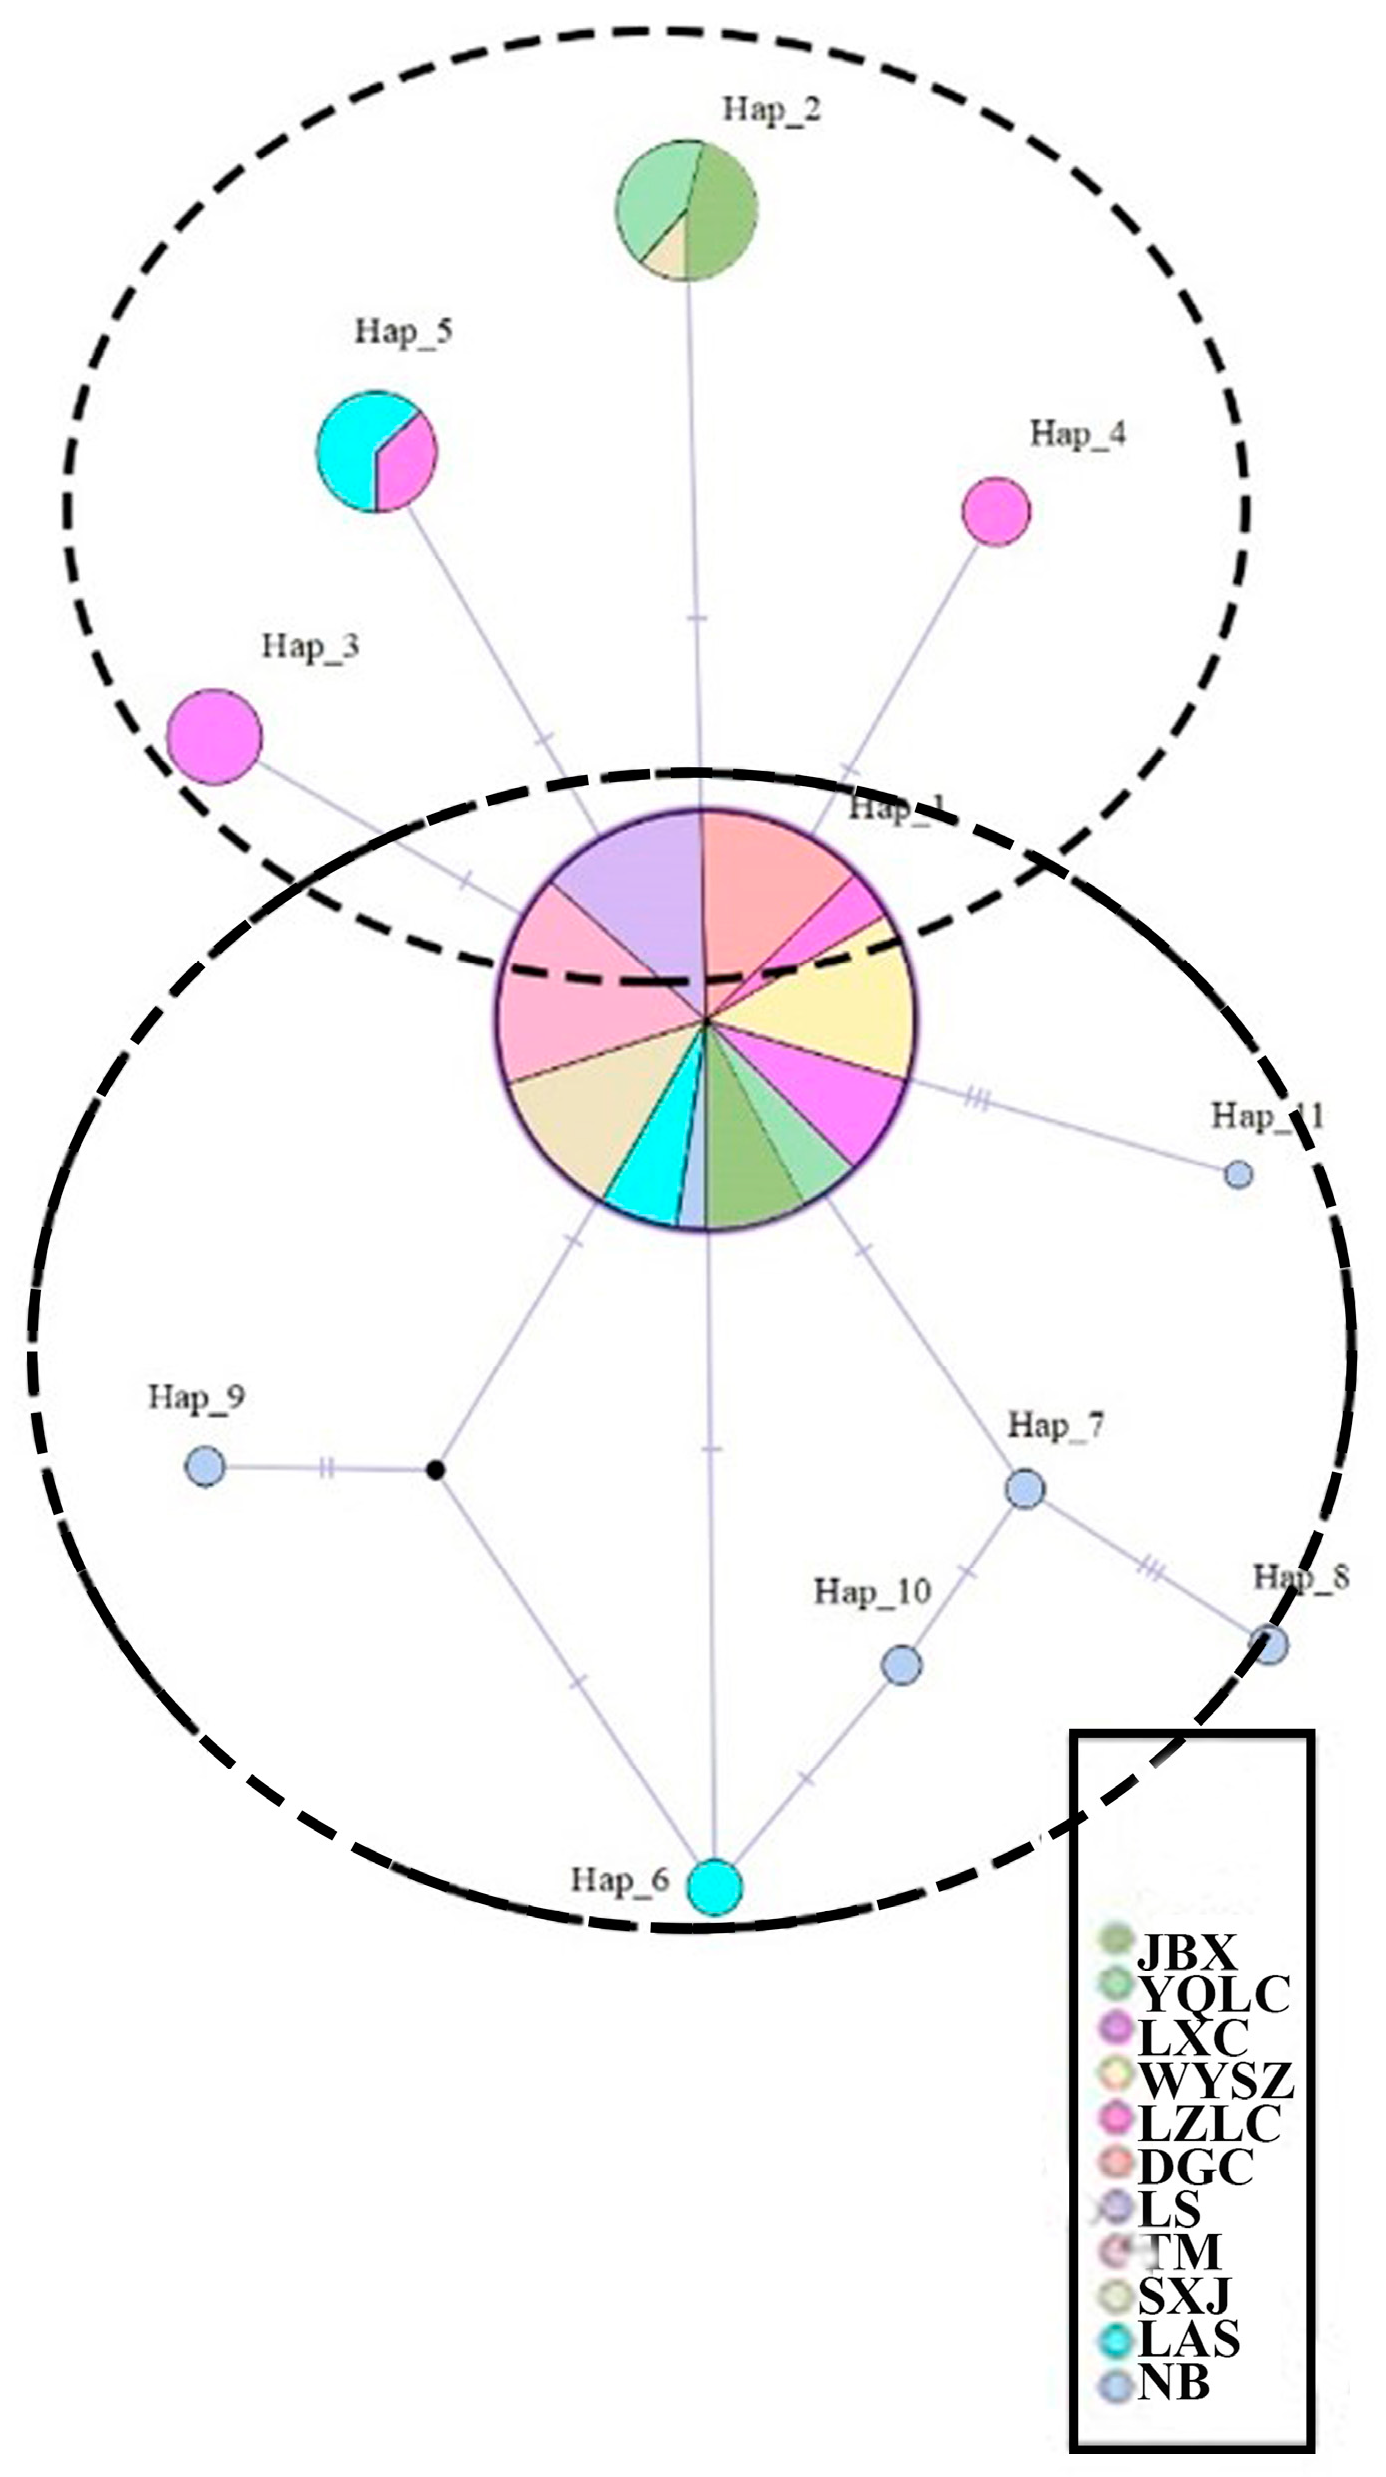
3.3. Haplotype Network
3.4. Spacer Regions of cpDNA Population Genetic Structure
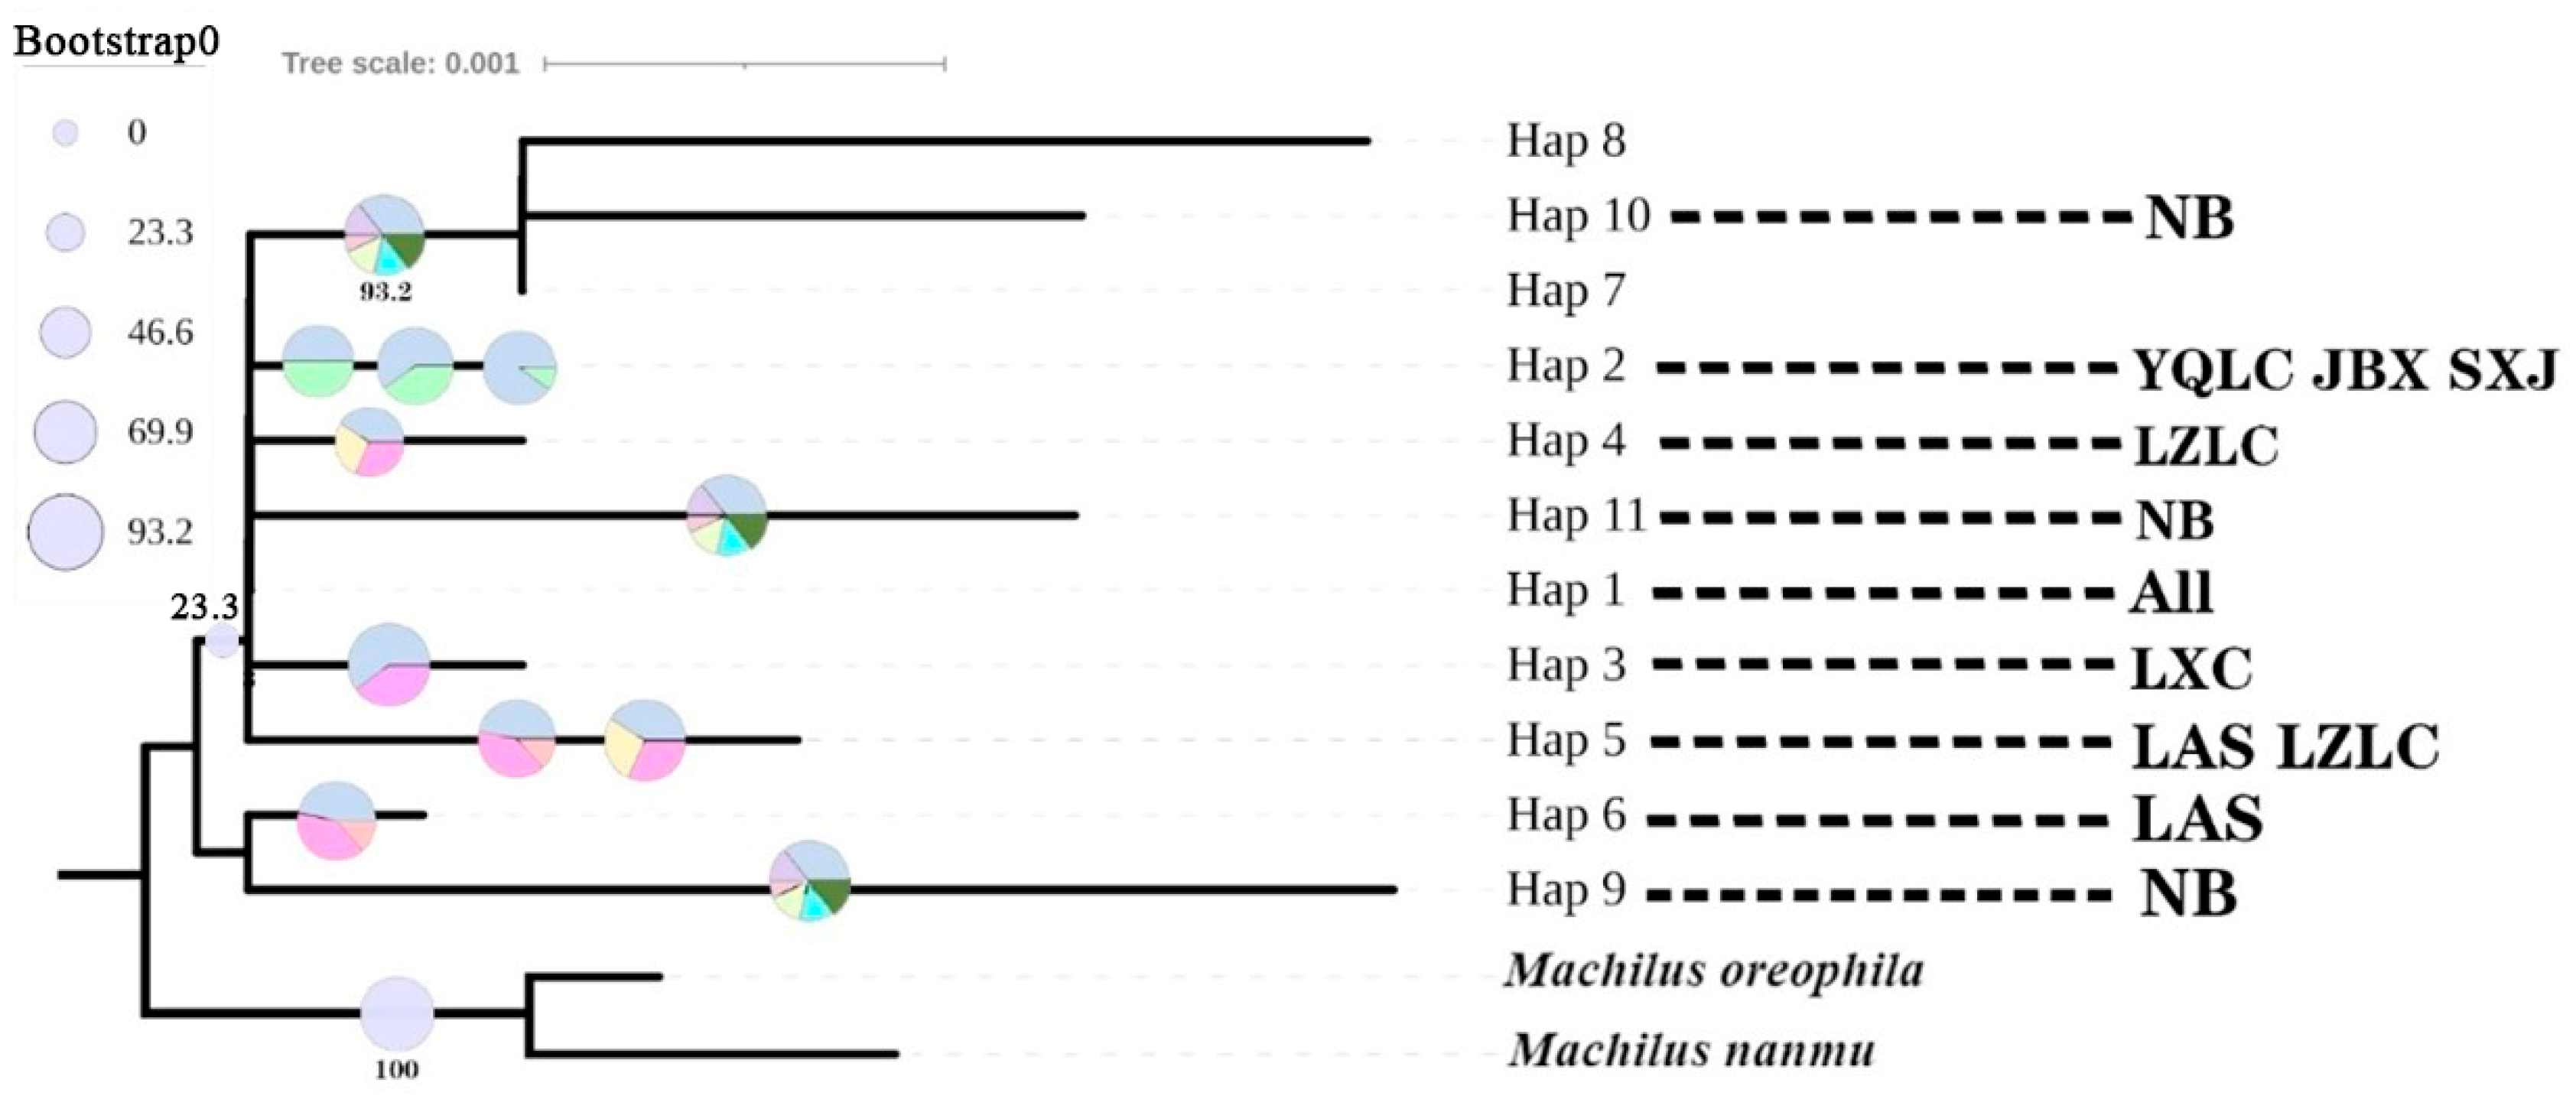
3.5. Analysis of Spacer Regions of cpDNA Haplotype Phylogeny and Evolutionary Time
3.6. Population History Dynamic Analysis
4. Discussion
4.1. Genetic Diversity and Genetic Differentiation
4.2. Phylogeographic Structure
4.3. Historical Dynamics of the Population
5. Conclusions
Supplementary Materials
Author Contributions
Funding
Data Availability Statement
Acknowledgments
Conflicts of Interest
References
- Li, S.; Li, X.W.; Li, J.; Huang, P.H.; Wei, F.N.; Cui, H.B.; van der Werff, H. Lauraceae. In Flora of China; Wu, Z.Y., Raven, P.H., Hong, D.Y., Eds.; Science Press: Beijing, China; Missorui Botanical Garden Press: St. Louis, MO, USA, 2008; Volume 7, pp. 102–254. [Google Scholar]
- Gao, J.H.; Zhang, W.; Li, J.Y.; Long, H.L.; He, W.; Li, X.Q. Amplified fragment length polymorphism analysis of the population structure and genetic diversity of Phoebe zhennan (Lauraceae), a native species to China. Biochem. Syst. Ecol. 2016, 64, 149–155. [Google Scholar] [CrossRef]
- Li, Y.G.; Liu, X.H.; Ma, J.W.; Shi, C.G.; Zhu, G.Q. Phenotypic variations in populations of Phoebe chekiangensis. Chin. J. Plant Ecol. 2014, 38, 1315–1324. [Google Scholar] [CrossRef]
- Hong, C.; Shi, W.; Wu, S.; He, Y.; Ying, Y. The inferior root plasticity of Phoebe chekiangensis and Torreya grandis seedlings intercropped with Phyllostachys edulis leads to worse plant performance than monocultures under shade conditions. Plant Soil 2023, 488, 305–324. [Google Scholar] [CrossRef]
- Jump, A.S.; Marchant, R.; Peñuelas, J. Environmental change and the option value of genetic diversity. Trends Plant. Sci. 2009, 14, 51–58. [Google Scholar] [CrossRef]
- Hoban, S.; Bruford, M.; D’Urban Jackson, J.; Lopes-Fernandes, M.; Heuertz, M.; Hohenlohe, P.A.; Paz-Vinas, I.; Sjögren-Gulve, P.; Segelbacher, G.; Vernesi, C.; et al. Genetic diversity targets and indicators in the CBD post-2020 Global Biodiversity Framework must be improved. Biol. Conserv. 2020, 248, 108654. [Google Scholar] [CrossRef]
- Birky, C.W. Uniparental Inheritance of Mitochondrial and Chloroplast Genes-Mechanisms and Evolution. Proc. Natl. Acad. Sci. USA 1995, 92, 11331–11338. [Google Scholar] [CrossRef]
- Jansen, R.K.; Cai, Z.; Raubeson, L.A.; Daniell, H.; Depamphilis, C.W.; Leebens-Mack, J.; Müller, K.F.; Guisinger-Bellian, M.; Haberle, R.C.; Hansen, A.K.; et al. Analysis of 81 Genes from 64 Plastid Genomes Resolves Relationships in Angiosperms and Identifes Genome-Scale Evolutionary Patterns. Proc. Natl. Acad. Sci. USA 2007, 104, 19369–19374. [Google Scholar] [CrossRef]
- Avise, J.C.; Arnold, J.; Ball, R.M.; Bermingham, E.; Lamb, T.; Neigel, J.E.; Reeb, C.A.; Saunders, N.C. Intraspecific phylogeography: The mitochondrial DNA bridge between population genetics and systematics. Annu. Rev. Ecol. Syst. 1987, 18, 489–522. [Google Scholar] [CrossRef]
- Li, S.; Liu, S.; Pei, S.; Ning, M.; Tang, S. Genetic diversity and population structure of Camellia huana (Theaceae), a limestone species with narrow geographic range, based on chloroplast DNA sequence and microsatellite markers. Plant. Divers. 2020, 42, 343–350. [Google Scholar] [CrossRef]
- Kavaliauskas, D.; Danusevičius, D.; Baliuckas, V. New Insight into Genetic Structure and Diversity of Scots Pine (Pinus sylvestris L.) Populations in Lithuania Based on Nuclear, Chloroplast and Mitochondrial DNA Markers. Forests 2022, 13, 1179. [Google Scholar] [CrossRef]
- Dong, J.; Yi, X.; Wang, X.; Li, M.; Chen, X.; Gao, S.; Fu, W.; Qian, S.; Zeng, X.; Yun, Y. Population Variation and Phylogeography of Cherry Blossom (Prunus conradinae) in China. Plants 2024, 13, 974. [Google Scholar] [CrossRef]
- Phumichai, C.; Phumichai, T.; Wongkaew, A. Novel Chloroplast Microsatellite (cpSSR) Markers for Genetic Diversity Assessment of Cultivated and Wild Hevea Rubber. Plant Mol. Biol. Rep. 2015, 33, 1486–1498. [Google Scholar] [CrossRef]
- Petit, R.J.; Duminil, J.; Fineschi, S.; Hampe, A.; Salvini, D.; Vendramin, G.G. INVITED REVIEW: Comparative organization of chloroplast, mitochondrial and nuclear diversity in plant populations. Mol. Ecol. 2005, 14, 689–701. [Google Scholar] [CrossRef]
- Ribeiro, R.A.; Lemos-Filho, J.P.; Ramos, A.C.S.; Lovato, M.B. Phylogeography of the endangered rosewood Dalbergia nigra (Fabaceae): Insights into the evolutionary history and conservation of the Brazilian Atlantic Forest. Heredity 2011, 106, 46–57. [Google Scholar] [CrossRef]
- Young, A.; Boyle, T.; Brow, T. The population genetic consequences of habitat fragmentation for plants. Trends Ecol. Evol. 1996, 11, 413–418. [Google Scholar] [CrossRef]
- Pironon, S.; Villellas, J.; Morris, W.F.; Doak, D.F.; García, M.B. Do geographic, climatic or historical ranges differentiate the performance of central versus peripheral populations? Glob. Ecol. Biogeogr. 2015, 24, 611–620. [Google Scholar] [CrossRef]
- Makhmudjanov, D.; Abdullaev, D.; Juramurodov, I.; Tuychiev, S.; Yusupov, Z.; Sun, H.; Tojibaev, K.; Deng, T. Comparative Analysis and Characterization of Ten Complete Chloroplast Genomes of Eremurus Species (Asphodelaceae). Forests 2023, 14, 1709. [Google Scholar] [CrossRef]
- Gapare, W.J.; Aitken, S.N. Strong spatial genetic structure in peripheral but not core populations of Sitka spruce [Picea sitchensis (Bong.) Carr.]. Mol. Ecol. 2005, 14, 2659–2667. [Google Scholar] [CrossRef]
- Alawfi, M.S.; Albokhari, E.J. Comparative Chloroplast Genomics Reveals a Unique Gene Inversion in Two Cordia Trees (Cordiaceae). Forests 2023, 14, 1778. [Google Scholar] [CrossRef]
- Zhu, H.; Liu, J.; Li, H.; Yue, C.; Gao, M. Complete Chloroplast Genome Structural Characterization and Comparative Analysis of Viburnum japonicum (Adoxaceae). Forests 2023, 14, 1819. [Google Scholar] [CrossRef]
- Castro, J.C.; Rodríguez, H.N.; Maddox, J.D.; Jiu, B.; Petterman, J.B.; Marapara, J.L.; Cobos, M. A simple and efficient method for high-quality total RNA isolation from Oleaginous microalgae. Plant Cell Biotechnol. Mol. Biol. 2017, 18, 15–21. [Google Scholar]
- Qiao, M.; Chen, B.; Fu, Y. Identification of Five Wood Species of Phoebe and Machilus based on DNA. Genom. Appl. Biol. 2018, 37, 4013–4021. [Google Scholar]
- Tang, B.; Han, M.; Xu, Q.Q.; Jin, J.H. Leaf cuticle microstructure of Machilus maomingensis sp. nov. (Lauraceae) from the Eocene of the Maoming Basin, South China. Acta Geol. Sin. 2016, 90, 1561–1571. [Google Scholar] [CrossRef]
- Katoh, K.; Standley, D.M. MAFFT multiple sequence alignment software version 7: Improvements in performance and usability. Mol. Biol. Evol. 2013, 30, 772–780. [Google Scholar] [CrossRef] [PubMed]
- Bandelt, H.J.; Forster, P.; Rohl, A. Median-joining networks for inferring intraspecific phylogenies. Mol. Biol. Evol. 1999, 16, 37–48. [Google Scholar] [CrossRef] [PubMed]
- Excoffier, L.; Lischer, H.E. Arlequin suite version 3.5: A new series of programs to perform population genetics analyses under Linux and Windows. Mol. Ecol. Resour. 2010, 10, 564–567. [Google Scholar] [CrossRef] [PubMed]
- Swofford, D.L. PAUP: Phylogenetic Analysis Using Parsimony (and Other Methods) 4.0 Beta; Sinauer Associates: Sunderland, MA, USA, 2002. [Google Scholar]
- Ronquist, F.; Huelsenbeck, J.P. MrBayes 3: Bayesian phylogenetic inference under mixed models. Bioinformatics 2003, 19, 1572–1574. [Google Scholar] [CrossRef] [PubMed]
- Rambaut, A. FigTree v1. 4.0. A Graphical Viewer of Phylogenetic Trees; Institute of Evolutionary Biology, University of Edinburgh: Edinburgh, UK, 2012. [Google Scholar]
- Drummond, A.J.; Suchard, M.A.; Xie, D.; Rambaut, A. Bayesian phylogenetics with BEAUti and the BEAST 1.7. Mol. Biol. Evol. 2012, 29, 1969–1973. [Google Scholar] [CrossRef] [PubMed]
- Rambaut, A.; Suchard, M.A.; Xie, D.; Drummond, A.J. Tracer v1.6. 2014. Available online: http://beast.bio.ed.ac.uk/Tracer (accessed on 31 January 2017).
- Reid, E.M.; Chandler, M.E.J. The London Clay Flora; British Museum (Natural History): London, UK, 1933; p. 200. [Google Scholar]
- Li, J.Z.; Qiu, J.; Liao, W.B.; Jin, J.H. Eocene fossil Alseodaphne from Hainan Island of China and its paleoclimatic implications. Sci. China Ser. D Earth Sci. 2009, 52, 1537–1542. [Google Scholar] [CrossRef]
- Li, H.; Liu, B.; Davis, C.C.; Yang, Y. Plastome phylogenomics, systematics, and divergence time estimation of the Beilschmiedia group (Lauraceae). Mol. Phylogenetics Evol. 2020, 151, 106901. [Google Scholar] [CrossRef] [PubMed]
- Li, L.; Madriñán, S.; Li, J. Phylogeny and biogeography of Caryodaphnopsis (Lauraceae) inferred from low-copy nuclear gene and ITS equences. Taxon 2016, 65, 433–443. [Google Scholar] [CrossRef]
- Pilkington, M.M.; Wilder, J.A.; Mendez, F.L.; Cox, M.P.; Woerner, A.; Angui, T.; Kingan, S.; Mobasher, Z.; Batini, C.; Destro-Bisol, G.; et al. Contrasting signatures of population growth for mitochondrial DNA and Y chromosomes among human populations in Africa. Mol. Biol. Evol. 2008, 25, 517–525. [Google Scholar] [CrossRef] [PubMed]
- Hamrick, J.L.; Godt, M.J.W. Effects of Life History Traits on Genetic Diversity in Plant Species. Philos. Trans. Biol. Sci. 1996, 351, 1291–1298. [Google Scholar]
- Varvio, S.L.; Chakraborty, R.; Nei, M. Genetic variation in subdivided populations and conservation genetics. Heredity 1986, 57, 189–198. [Google Scholar] [CrossRef] [PubMed]
- Qiu, Y.X.; Guan, B.C.; Fu, C.X.; Comes, H.P. Did glacials and/or interglacials promote allopatric incipient speciation in East Asian temperate plants? Phylogeographic and coalescent analyses on refugial isolation and divergence in Dysosma versipellis. Mol. Phylogenetics Evol. 2009, 51, 281–293. [Google Scholar] [CrossRef] [PubMed]
- Zhang, R.; Zhou, Z.; Jin, G.; Wang, S.; Wang, X. Genetic diversity and differentiation within three species of the family Lauraceae in southeast China. Biochem. Syst. Ecol. 2012, 44, 317–324. [Google Scholar] [CrossRef]
- Ding, Y.; Zhang, J.; Lu, Y.F.; Lin, E.; Lou, L.; Tong, Z. Development of EST-SSR markers and analysis of genetic diversity in natural populations of endemic and endangered plant Phoebe chekiangensis. Biochem. Syst. Ecology. 2015, 63, 183–189. [Google Scholar] [CrossRef]
- Jiang, X.; Wen, Q.; Ye, J.; Xiao, F.; Jiang, M. RAPD analysis on genetic diversity in eight natural populations of Phoebe bournei from Fujian and Jiangxi Province, China. Acta Ecol. Sin. 2009, 29, 438–444. [Google Scholar]
- Chen, S.P.; Sun, W.H.; Xiong, Y.F.; Jiang, Y.T.; Liu, X.D.; Liao, X.Y.; Zhang, D.Y.; Jiang, S.Z.; Li, Y.; Liu, B.; et al. The Phoebe genome sheds light on the evolution of magnoliids. Hortic. Res. 2020, 7, 146. [Google Scholar] [CrossRef] [PubMed]
- Chen, L.; Pan, T.; Qian, H.; Zhang, M.; Yang, G.; Wang, X. Genetic Diversity and Population Structure Revealed by SSR Markers on Endemic Species Osmanthusserrulatus Rehder from Southwestern Sichuan Basin, China. Forests 2021, 12, 1365. [Google Scholar] [CrossRef]
- Wang, Y.H.; Jiang, W.M.; Comes, H.P.; Hu, F.S.; Qiu, Y.X.; Fu, C.X. Molecular phylogeography and ecological niche modelling of a widespread herbaceous climber, Tetrastigma hemsleyanum (Vitaceae): Insights into Plio-Pleistocene range dynamics of evergreen forest in subtropical China. New Phytol. 2015, 206, 852–867. [Google Scholar] [CrossRef] [PubMed]
- Leng, X.; Wang, Z.S.; An, S.Q.; Wang, G.M.; Zheng, J.W.; Feng, J. The Influence of Insular Geographical Isolation on Population Genetic Structure of Machilus thunbergii. J. Nanjing For. Univ. 2006, 30, 20–24. [Google Scholar]
- Stuart, Y.E.; Losos, J.B.; Algar, A.C. The island–mainland species turnover relationship. Proc. R. Soc. B Biol. Sci. 2012, 279, 4071–4077. [Google Scholar] [CrossRef] [PubMed]
- Wan, L.Q.; Ding, B.Y.; Guo, S.L. Difference of spermatophyte flora among main islands of Zhoushan archipelago and its influencing factors. J. Zhejiang Univ. 2008, 34, 677–683. [Google Scholar] [CrossRef]
- Lu, L.M.; Mao, L.F.; Yang, T.; Ye, J.F.; Liu, B.; Li, H.L.; Sun, M.; Miller, J.T.; Mathews, S.; Hu, H.H.; et al. Evolutionary history of the angiosperm flora of China. Nature 2018, 554, 234–238. [Google Scholar] [CrossRef] [PubMed]
- Zhang, Q.; Chiang, T.; George, M.; Liu, J.Q.; Abbott, R.J. Phylogeography of the Qinghai-Tibetan Plateau endemic Juniperus przewalskii (Cupressaceae) inferred from chloroplast DNA sequence variation. Mol. Ecol. 2010, 14, 3513–3524. [Google Scholar] [CrossRef] [PubMed]
- Mona, S.; Ray, N.; Arenas, M.; Excoffier, L. Genetic consequences of habitat fragmentation during a range expansion. Heredity 2014, 112, 291–299. [Google Scholar] [CrossRef] [PubMed]
- Xu, J.; Deng, M.; Jiang, X.L.; Westwood, M.; Song, Y.G.; Turkington, R. Phylogeography of Quercus glauca (Fagaceae), a dominant tree of East Asian subtropical evergreen forests, based on three chloroplast DNA interspace sequences. Tree Genet. Genomes 2015, 11, 805. [Google Scholar] [CrossRef]
- Royden, L.H.; Burchfiel, B.C.; Van Der Hilst, R.D. The geological evolution of the Tibetan Plateau. Science 2008, 321, 1054–1058. [Google Scholar] [CrossRef] [PubMed]
- Zhang, H.J.; Feng, T.; Landis, J.B.; Deng, T.; Zhang, X.; Meng, A.P.; Sun, H.; Wang, H.C.; Sun, Y.X. Molecular phylogeography and ecological niche modeling of Sibbaldia procumbens s.l. (Rosaceae). Front. Genet. 2019, 10, 201. [Google Scholar] [CrossRef] [PubMed]
- Gao, Y.D.; Zhang, Y.; Gao, X.F.; Zhu, Z.M. Pleistocene glaciations, demographic expansion and subsequent isolation promoted morphological heterogeneity: A phylogeographic study of the alpine Rosa sericea complex (Rosaceae). Sci. Rep. 2015, 5, 11698. [Google Scholar] [CrossRef] [PubMed]
- He, H.; Gao, H.; Xue, X.; Ren, J.; Chen, X.; Niu, B. Variation of sugar compounds in Phoebe chekiangensis seeds during natural desiccation. PLoS ONE 2024, 19, e0299669. [Google Scholar] [CrossRef] [PubMed]


| NO. | Pop. Label | Location | Longitude/E | Latitude/N | Altitude/m | Pop. Size |
|---|---|---|---|---|---|---|
| 1 | JBX | Junbu Township, Yongfeng, Jiangxi Province | 115.696 | 26.727 | 230 | 30 |
| 2 | YQLC | Yanquan Forest farm, Fuzhou, Jiangxi Province | 116.927 | 27.043 | 308 | 22 |
| 3 | WYSZ | Wuyishan town, Shangrao, Jiangxi Province | 117.875 | 28.018 | 434 | 30 |
| 4 | LXC | Luxi village, Huangshan, Anhui Province | 117.489 | 29.698 | 86 | 30 |
| 5 | LZLC | Laizhou experimental forest farm, Fujian Province | 118.002 | 26.638 | 210 | 22 |
| 6 | TM | Tianmu Mountain, Hangzhou, Zhejiang Province | 119.443 | 30.322 | 342 | 38 |
| 7 | DGC | Qingyuan, Zhejiang Province, Zuoxi Daigen village | 119.345 | 27.593 | 652 | 30 |
| 8 | LS | Songyang Pankeng village, Qingyuan, Zhejiang Province | 119.400 | 28.395 | 329 | 30 |
| 9 | SXJ | Zhejiang Taizhou Shenxian Residence (cultivation) | 120.590 | 28.680 | 208 | 30 |
| 10 | LAS | Li’an Mountain, Hangzhou, Zhejiang Province | 120.109 | 30.209 | 56 | 30 |
| 11 | NB | Tiantong Mountain, Ningbo, Zhejiang Province | 121.792 | 29.801 | 115 | 14 |
| Total | 306 |
| Primer | Primer Sequence | References | |
|---|---|---|---|
| psbC-trnS | F: | GCAGCTGCAGCAGGATTTG | Qiao et al., 2019 [23] |
| R: | GGAGAGATGGCCGAGTGGTT | ||
| trnL-Intro | F: | CGAAATCGGTAGACGCTACG | Qiao et al., 2019 [23] |
| R: | GGGGATAGAGGGACTTGAAC | ||
| Ycf3 | F: | AGAACCGTACTTGAGAGTTTCC | Makhmudjanov et al., 2023 [18,23] |
| R: | CTGTCATTACGTGCGRCTATCT | ||
| Haplotype | 0 | 0 | 0 | 0 | 0 | 0 | 0 | 0 | 0 | 1 | 1 | 1 | 1 | 1 | Distribution Quantity (No.) |
|---|---|---|---|---|---|---|---|---|---|---|---|---|---|---|---|
| 0 | 5 | 5 | 5 | 7 | 8 | 8 | 9 | 9 | 0 | 0 | 4 | 4 | 4 | ||
| 1 | 1 | 1 | 2 | 0 | 7 | 8 | 0 | 8 | 8 | 9 | 4 | 5 | 5 | ||
| 9 | 6 | 7 | 5 | 5 | 0 | 9 | 3 | 3 | 9 | 8 | 7 | 0 | 1 | ||
| trnL-Intro | Ycf3 | psbC-trnS | |||||||||||||
| Hap1 | C | A | A | G | A | C | C | C | C | G | G | G | A | G | 230 |
| Hap2 | · | · | · | · | · | · | · | · | · | · | A | · | · | · | 26 |
| Hap3 | G | · | · | · | · | · | · | · | · | · | · | · | · | · | 12 |
| Hap4 | · | · | · | · | · | · | · | · | · | A | · | · | · | · | 6 |
| Hap5 | · | · | · | C | · | · | · | · | · | · | · | · | · | 19 | |
| Hap6 | · | · | · | · | · | T | · | · | · | · | · | · | · | · | 4 |
| Hap7 | · | · | · | · | · | · | · | · | T | · | · | · | · | · | 2 |
| Hap8 | · | G | G | T | · | · | · | · | T | · | · | · | · | · | 2 |
| Hap9 | · | · | · | · | · | A | A | A | · | · | · | · | · | · | 2 |
| Hap10 | · | · | · | · | · | T | · | · | T | · | · | · | · | · | 2 |
| Hap11 | · | · | · | · | · | · | · | · | · | · | · | A | G | A | 1 |
| Population Code | Pop. Size | Hd | Pi × 10−3 | K | Haplotypes/Ribotypes (No. of Individuals) | |
|---|---|---|---|---|---|---|
| 1 | JBX | 30 | 0.524 | 0.360 | 0.497 | H1 (18), H2 (12) |
| 2 | YQLC | 22 | 0.524 | H1 (11), H2 (11) | ||
| 3 | WYSZ | 30 | 0.186 | 0.130 | 0.186 | H1 (30) |
| 4 | LS | 30 | 0.331 | 0.230 | 0.331 | H1 (30) |
| 5 | DGC | 30 | 0.186 | 0.130 | 0.186 | H1 (30) |
| 6 | SXJ | 30 | 0.186 | 0.130 | 0.186 | H1 (27), H2 (3) |
| 7 | LZLC | 22 | 0.714 | 0.660 | 0.961 | H1 (9), H4 (6), H5 (7) |
| 8 | LXC | 30 | 0.497 | 0.340 | 0.497 | H1 (18), H3 (12) |
| 9 | TM | 38 | 0.000 | 0.000 | 0.000 | H1 (38) |
| 10 | LAS | 30 | 0.625 | 0.510 | 0.736 | H1 (14), H5 (12), H6 (4) |
| 11 | NB | 14 | 0.846 | 1.910 | 2.758 | H1 (5), H7 (2), H8 (2), H9 (2), H10 (2), H11 (1) |
| Northern region (LXC, TM, LAS, NB) | 112 | 0.551 | 0.640 | 0.652 | H1 (75), H3 (12), H5 (12), H6 (4), H7 (2), H8 (2), H9 (2), H10 (2), H11 (1) | |
| Southern region (JBX, YQLC, WYSZ, LZLC, DGC, LS, SXJ) | 194 | 0.295 | 0.330 | 0.473 | H1 (155), H2 (26), H4 (6), H5 (7) | |
| All | 306 | 0.423 | 0.400 | 0.562 | ||
| Source of Variation | d.f. | Sum of Squares | Variance Components | Percentage of Variation | Fixation Indices | Nm | Gst/Nst |
|---|---|---|---|---|---|---|---|
| All populations | |||||||
| Between populations | 10 | 25.329 | 0.08409 | 29.14 | Fst = 0.25610 | 0.73 | 0.28379/0.25597 |
| Within populations | 295 | 60.332 | 0.20451 | 70.86 | (p < 0.05) | ||
| Southern populations | |||||||
| Between populations | 4 | 13.307 | 0.11635 | 34.08 | Fst = 0.32531 | 0.52 | 0.22590/0.32536 |
| Within populations | 129 | 29.036 | 0.22509 | 65.92 | (p < 0.05) | ||
| Northern populations | |||||||
| Between populations | 5 | 9.170 | 0.05813 | 23.57 | Fst = 0.18753 | 1.08 | 0.28466/0.18725 |
| Within populations | 166 | 31.295 | 0.18853 | 76.43 | (p < 0.05) | ||
| Southern regions and Northern regions | |||||||
| Between regions | 1 | 2.852 | 0.00172 | 0.59 | FSC = 0.28907 | ||
| Within regions | 9 | 22.477 | 0.08316 | 28.74 | FST = 0.29328 | ||
| Within populations | 295 | 60.332 | 0.20451 | 70.67 | FCT = 0.00593 | ||
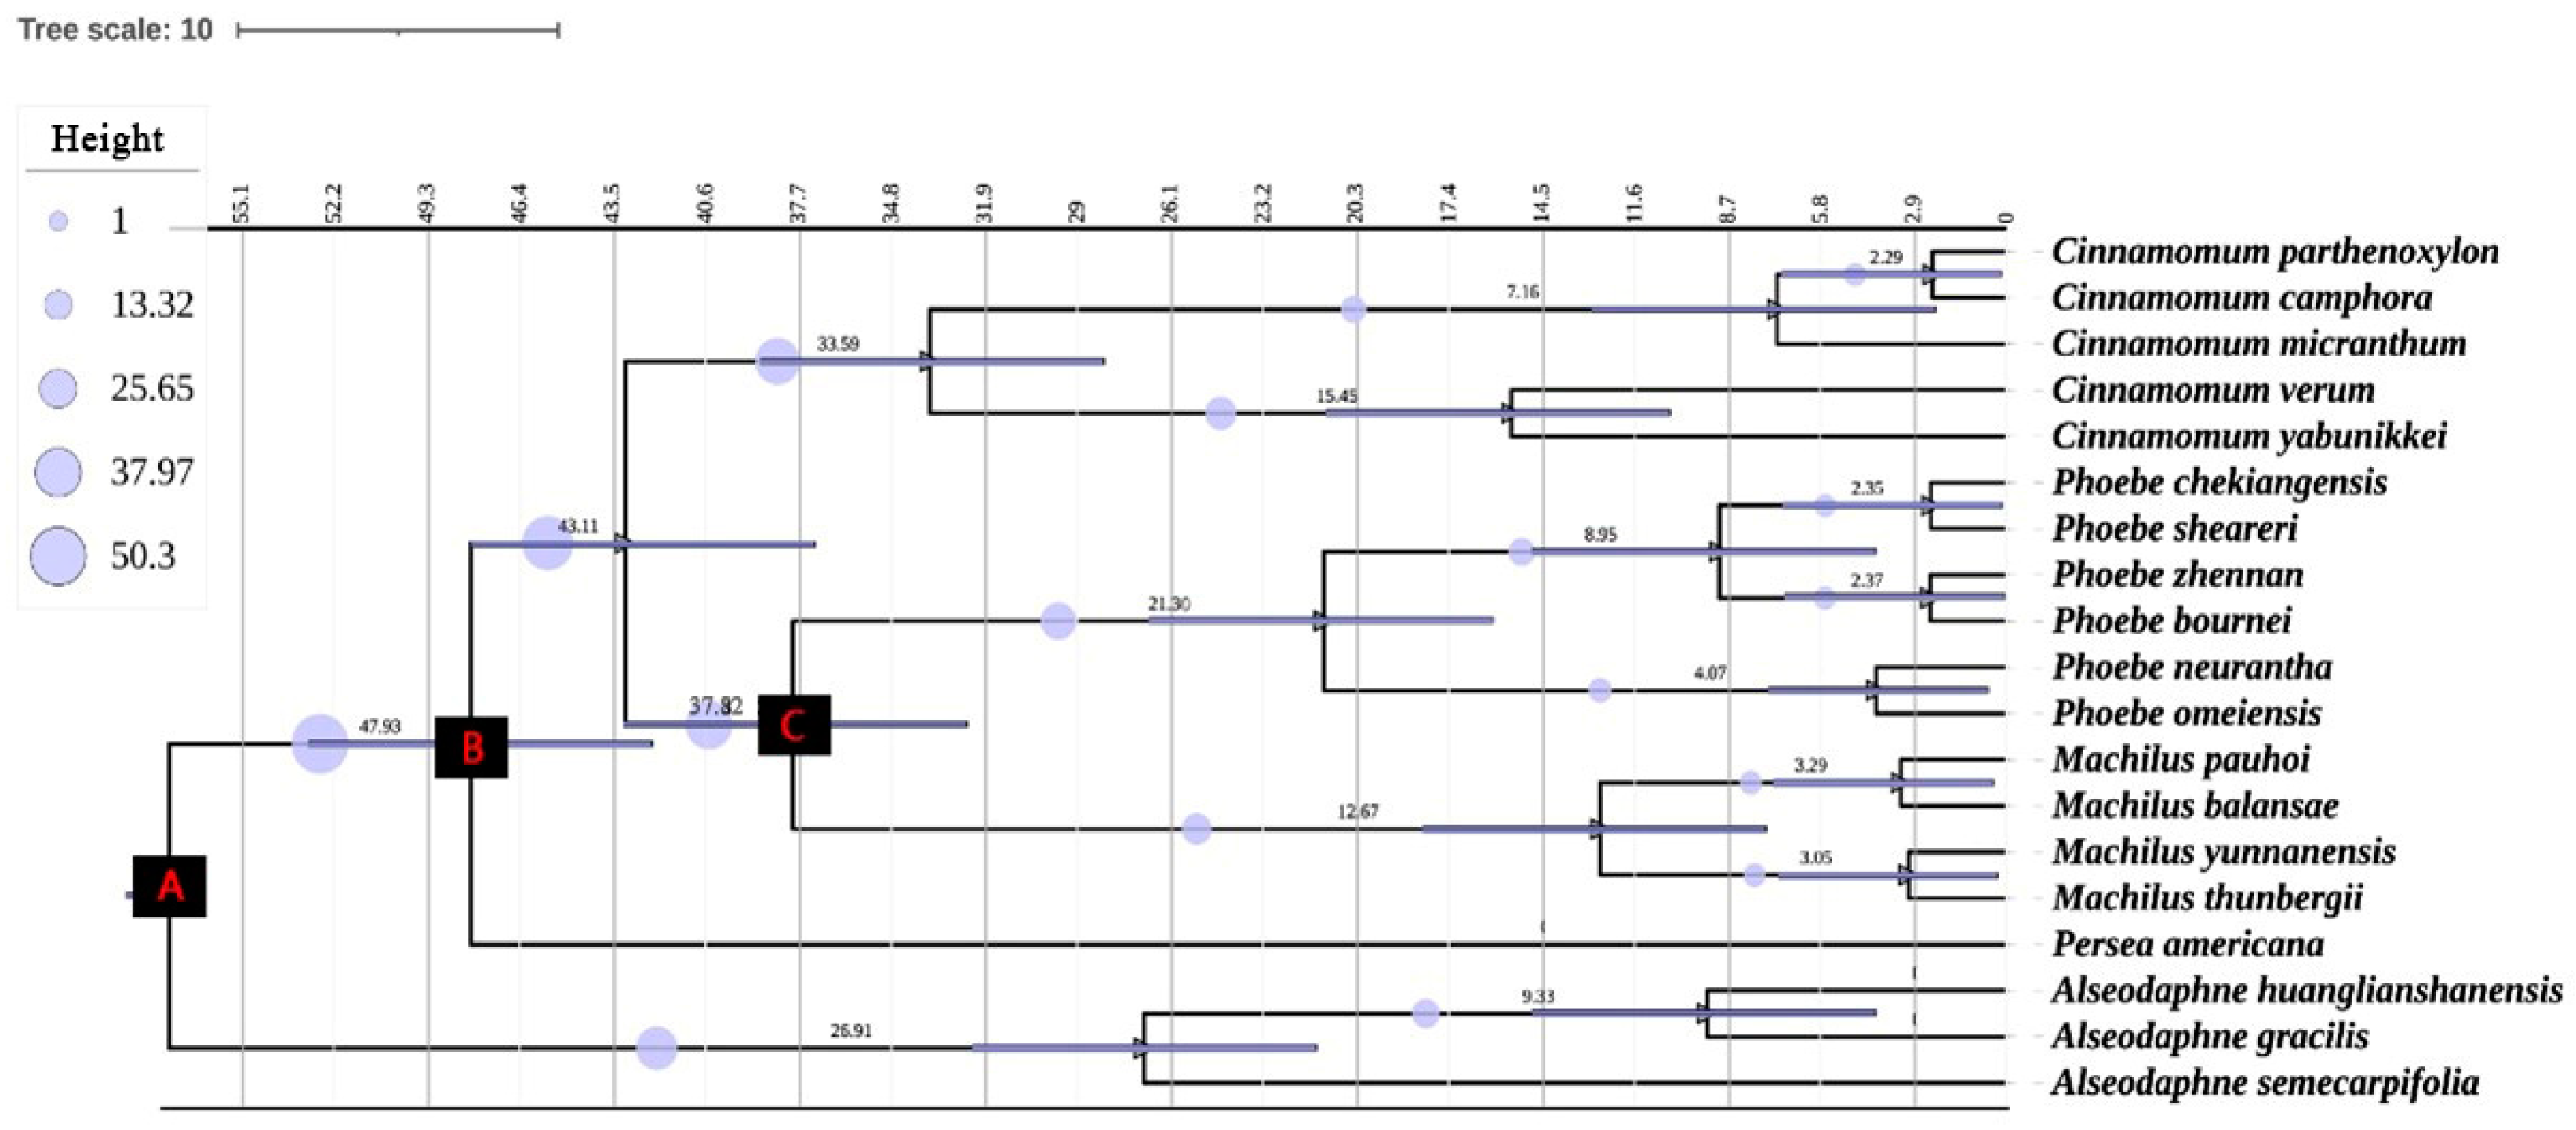
| Node | Fossil References | Minimum Age (mya) | Mean Ages (mya) | |
|---|---|---|---|---|
| A: | Divergence between Laureae and Cinnamomeae | Reid, E.M. et al., 1933 [33] | 52 | 57.33 (41.63, 85.76) |
| B: | Crown node of the Persea group | Li et al., 2009 [34]; Li, H., 2020 [35] | 43 | 47.93 (42.25, 66.42) |
| C: | Stem node of Machilus | Li et al., 2016a [36]; Tang et al., 2016 [24] | 33.7 | 37.87 (25.63, 44.54) |
| 1: | Phoebe chekiangensis | 7.85 | ||
| 2: | H7 + H8 + H10 | 1.90 | ||
Disclaimer/Publisher’s Note: The statements, opinions and data contained in all publications are solely those of the individual author(s) and contributor(s) and not of MDPI and/or the editor(s). MDPI and/or the editor(s) disclaim responsibility for any injury to people or property resulting from any ideas, methods, instructions or products referred to in the content. |
© 2024 by the authors. Licensee MDPI, Basel, Switzerland. This article is an open access article distributed under the terms and conditions of the Creative Commons Attribution (CC BY) license (https://creativecommons.org/licenses/by/4.0/).
Share and Cite
Wu, X.; Chen, Y.; Nan, C.; Gao, S.; Chen, X.; Yi, X. Chloroplast Spacer DNA Analysis Revealed Insights into Phylogeographical Structure of Phoebe chekiangensis. Forests 2024, 15, 1073. https://doi.org/10.3390/f15071073
Wu X, Chen Y, Nan C, Gao S, Chen X, Yi X. Chloroplast Spacer DNA Analysis Revealed Insights into Phylogeographical Structure of Phoebe chekiangensis. Forests. 2024; 15(7):1073. https://doi.org/10.3390/f15071073
Chicago/Turabian StyleWu, Xiankun, Yan Chen, Chenhui Nan, Shucheng Gao, Xiangzhen Chen, and Xiangui Yi. 2024. "Chloroplast Spacer DNA Analysis Revealed Insights into Phylogeographical Structure of Phoebe chekiangensis" Forests 15, no. 7: 1073. https://doi.org/10.3390/f15071073
APA StyleWu, X., Chen, Y., Nan, C., Gao, S., Chen, X., & Yi, X. (2024). Chloroplast Spacer DNA Analysis Revealed Insights into Phylogeographical Structure of Phoebe chekiangensis. Forests, 15(7), 1073. https://doi.org/10.3390/f15071073