Abstract
Landscape elements are crucial to the quality of the built environment. Thermal comfort is one of the important paths through which landscape elements affect the quality of the built environment. Most studies investigate the impacts of the landscape on the outdoor thermal environment, while ignoring the impacts on the indoor environment. A residential area in Chenzhou, a typical city having a hot summer and cold winter climate, was taken as an example to reveal the effect on the indoor thermal environment of landscapes. The annual distribution of the indoor thermal environment was analyzed with the “Envi-met+IDW” model, which was created to evaluate the annual thermal impact. Analytical results show that, from the perspective of the annual cycle, the camphor tree has the best performance in regulating the indoor thermal environment, followed by water and the palm. Manila grass has a very weak impact on indoor thermal comfort throughout the year. Camphor trees, water, and palm extend the “acceptable temperature” by 523 h, 416 h, and 388 h respectively. However, the camphor tree also has the strongest cooling effect on indoor environments during winter, increasing the “heating demand temperature” by 289 h.
1. Introduction
The residential area is the basic unit of a city, whose landscape has received significant attention, especially in the backdrop of urban renewal movement [1,2]. Existing studies have analyzed the impacts of landscapes on aesthetics, environmental psychology, and the microclimate in residential areas [3,4,5]. Regarding the influence of the landscape on the microclimate, previous documents explored the impact of plant combination on microclimates, focusing on its impacts on wind speed, temperature, and relative humidity [6,7,8,9,10]. With temperature, relative humidity, and wind speed as mediating variables, some scholars have further explored the impacts of landscapes on thermal comfort [11,12,13,14,15]. However, in urban research, previous studies have only focused on the impacts of landscapes on the outdoor microclimate and outdoor thermal comfort, ignoring the influences on indoor environments [16,17]. This is because, in everyday scenarios, each indoor environment only has a unique outdoor landscape, which hinders the field measurement required for the investigation of the impact of outdoor landscapes on the indoor thermal environment. Furthermore, simulation tools, such as CFD (computational fluid dynamics), do not have a plant transpiration and evaporation model [18,19], which hinders the understanding of the impact of environmental factors on the indoor thermal environment. Envi-met, an advanced simulation tool, has built-in plant evaporation and transpiration models [20], which provide technical support to study the impact of landscapes on the indoor environment from the view of urban planning [21].
Apart from exploring the impact of landscapes on the indoor thermal environment, this research also introduces a new research paradigm. Singapore, Hong Kong, and other cities take the lead in the matter of the landscape affecting the thermal environment, and have been used as examples for the study method named “typical summer weather day” [22,23], which selects a typical summer day to assess the impact of the landscape on the indoor thermal environment. The “typical summer weather day” method is effective in tropical cities such as Singapore and Hong Kong, and it has been widely recognized and adopted by many scholars from other climate zones [24,25]. However, unlike Singapore and Hong Kong, which are typical tropical and subtropical cities [26,27], southern Hunan is a typical hot summer and cold winter climate zone, where landscapes reducing the heat in summer may exacerbate the cold in winter [28,29]. Therefore, it is inappropriate to evaluate landscapes in southern Hunan with the “typical summer weather day” method. Determining how to analyze the influence of landscapes on the indoor thermal environment from the perspective of the annual cycle is a scientific question.
This paper uses Envi-met (5.5 version) to simulate the indoor thermal environment of different landscapes in each month, and then draws the annual distributions of indoor thermal environments for different landscape scenarios with the IDW model, which is a temperature interpolation method [30]. Finally, the annual effects of landscapes on the indoor thermal environment are interpreted.
2. Materials and Methods
2.1. Residential Area in Southern Hunan
In the 1990s, China built many 6-story residential units in a unified form, which accounted for a big proportion in cities. Nowadays, the facilities and landscapes urgently need maintenance. Based on this situation, China launched the old city renovation movement [31]. Therefore, in this study, we chose a 6-story residential unit built in the 1990s as the target to explore the benefits of landscapes. The building in the 6-story residential unit has a height of around 18 m. The depth of the building is generally 10–12 m and the length is about 40 m. The distance between each building is around 6 m in the east–west direction to meet the requirements of fire trucks. The north–south distance is generally 18 m, which meets the 1:1 sunlight coefficient. The window to wall ration of the north and south wall is 1:3. These buildings are brick concrete structures with a wall thickness of 31 cm. According to the above characteristics, a prototype of this residential area was drawn in this research, as shown in Figure 1, and the properties of the wall material are shown in Table 1.
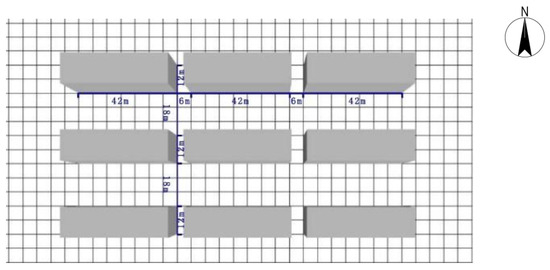
Figure 1.
Typical old residential unit prototype in southern Hunan.

Table 1.
Properties of the walls (source: Envi-met Database).
2.2. Research Scenario
By investigation, this study selected manila grass, palm, and camphor tree as the representative grass, shrub, and tree in Chenzhou. Four residential models are constructed in Figure 2, which are the manila grass residential unit, the palm residential unit, the swimming pool residential unit, and the camphor tree residential unit. The manila grass unit is composed of six blocks, and each block is 42 m long and 6 m wide. The palm and water units also consist of six blocks, which have the same size as that of manila grass. There are 48 camphor trees in sub-graph (d), with the crown width being 9 m which formed a total projected area of 3052 square meters in the street, approaching to 3024 square meters of manila grass, palm, and water. The attributes of manila grass, palm, water, and camphor tree are shown in Section 2.3.
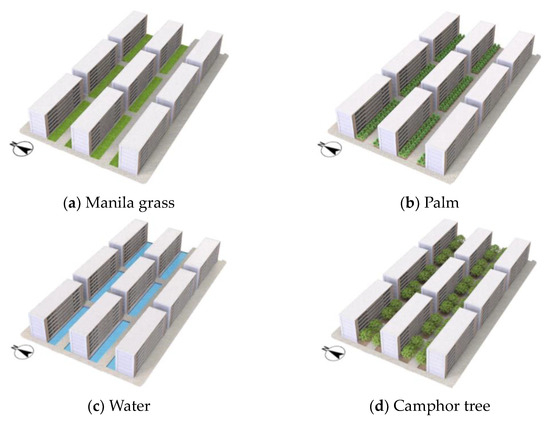
Figure 2.
The four research scenarios.
2.3. Common Landscape Elements and Their Attributes
Grassland, shrubs, trees, and water bodies are the four main elements of the landscape whose combinations create diverse landscapes [32,33]. Many studies have analyzed the impact of their combination on the microclimate [34]. This study aimed to clarify the effects of each landscape on the indoor thermal environment in residential areas. Through a survey of plants in Chenzhou city, the representative landscape elements were chosen in this study. Manila grass, palm, and camphor tree were selected as the representative grassland, shrub, and tree in the residential area of southern Hunan. In the databases of Envi-met (5.5 version), the attribute parameters of these plants and water were found, and are shown in Table 2.
Table 2.
Parameter index of residential landscape elements (source: Envi-met Database).
2.4. Climatic of Southern Hunan
We visited the Chenzhou Meteorological Bureau and successfully applied for the climate data. The obtained data came from the National Meteorological Station of Chenzhou City, and covered the period 2008–2018. The average air temperature, humidity, and wind speed of each hour were statistically analyzed, as shown in Figure 3, Figure 4 and Figure 5. In Figure 3, the average high and average low temperatures refer to the averages of the daily maximum and minimum temperatures in the month.
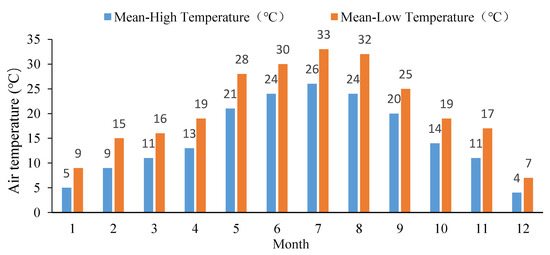
Figure 3.
The mean air temperature of each month.
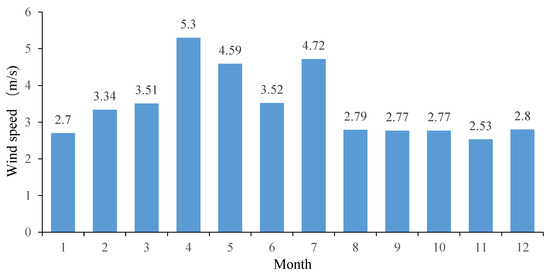
Figure 4.
The mean wind speed of each month.
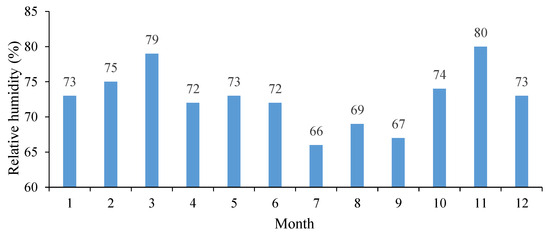
Figure 5.
The mean relative humidity of each month.
2.5. Simulation Tool
Envi-met (5.5 version) was employed as the research tool to analyze the impacts of the landscape on the indoor thermal environment using its built-in plant transpiration and evaporation models [21]. Envi-met is a microclimate simulation software package whose horizontal resolution is 0.5 to 10 m, with the maximum time step being 10 s [35]. Compared with other simulation tools, Envi-met has superiority in the following aspects. First, Envi-met can not only simulate the heat transfer and wind, but can also calculate the transpiration process of plants and the evaporation of water bodies [36], which is beyond the capabilities of other simulation technologies. As Envi-met can simulate the plants and water, it is favored by landscape scholars. Envi-met calculates the impacts of the outdoor effect on the indoor environment by two approaches [19]. First, Envi-met treats the indoor temperature as a predictor variable that is related to the energy flux of the building envelope. Second, Envi-met fixes the indoor temperature as a constant, which is used to calculate the energy demand for a building at a constant temperature. In this research, Envi-met uses the second algorithm to predict the impacts of landscapes on the indoor thermal environment, where the climate data reviewed in this research were set as the boundary conditions for the simulation. The indoor temperature is predicted by calculating the energy fluxes through the building envelope. The indoor air temperature calculated by Envi-met follows Equation (1) [37].
In the formula, V denotes the volume of air in room i (m3); is the initial temperature of the air in room i, and is the air temperature of room i after the time (S); is the specific heat capacity of the air, which is 1.003; E is the number of all enclosing surfaces in room i, and (m2) is the surface area of the enclosing walls or roofs e; () is the short-wave radiation that passes through the enclosing surfaces e and enters the room. is the heat convection coeffiffifficient. represents the temperatures at the nodes at the inner surface.
In this research, the model was built with Envi-met (5.5 version) based on the typical prototype of old residential unit in southern Hunan (Figure 1), where the attributes of the building material and plants were set according to Table 1 and Table 2.
Compared with traditional simulation tool whose accuracy has been confirmed, the Envi-met model added evaporation and transpiration models. A field experiment was conducted to validate the accuracy of the Envi-met model; this was carried out from 10:00 on 22 August 2020 to 10:00 on 24 August 2020 at Hunan Shangjia Green Environment Company (113.109° E, 28.235° N). Hunan Shangjia Green Environment Company provided us with a green building for measurement, which is shown in Figure 6a. As shown in Figure 6a, the model consisted of soil blocks and plants; the soil block was a modular planting loam with a thickness of 50 mm, which weighed 14 kg/m2 in the dry state and 45 kg/m2 in the full water state, and whose water retention was rated up to 68%. The attributes of plants and soils were provided by Hunan Shangjia Green Company. Figure 6b shows the simulation model that was built with the Envi-met model. The profiles of the measured building are shown in Figure 6c. The indoor and outdoor thermal environments were both measured with HOBO (MX2302), and the outdoor thermal environment was also used as the boundary condition for the simulation. HOBO (MX2302) has built-in air temperature and relative humidity sensors; the accuracy of the air temperature sensor is ±0.2 °C and that of the humidity sensor is ±2.5% RH. This study used HOBO (MX2302) to record the data with an interval of one hour. Excluding the first 24 h for the HOBO adaptation, the data from 10:00 on 23 August 2020 to 10:00 on 24 August 2020 were used to validate the accuracy of the Envi-met model.
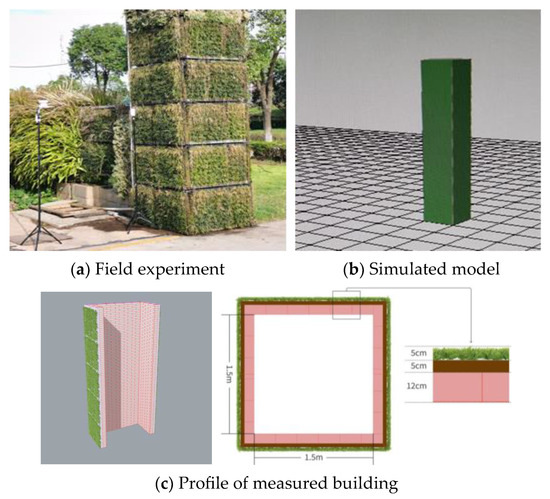
Figure 6.
Field experiment and simulated model.
The outdoor air temperature is shown in Figure 7a, and the simulated and measured indoor air temperatures are shown in Figure 7b, where the blue line indicates the measured indoor air temperature and the red dotted line represents the simulated indoor air temperature. The Pearson coefficient of the simulated and measured values is 0.969, which is close to that of 0.956 in a previous study [38]. Additionally, this research also calculated the RMSE and MAE of the simulated and measured data, whose values are 1.86 °C and 1.45 °C, respectively, which proves that Envi-met (5.5 version) is accurate enough to simulate the impacts of plants on the indoor air temperature.
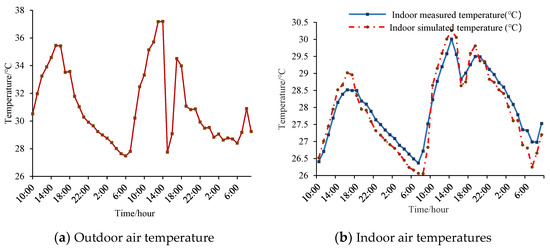
Figure 7.
Measured and simulated air temperatures.
3. Results and Discussion
Based on the data above, this research simulated different scenarios, where each scenario covers 12 × 24 data. A total of 1440 (5 × 12 × 24) indoor air temperatures were simulated with the Envi-met (5.5 version) model. Figure 8 shows a set of results with the same time, and visually reveals the impacts of natural elements on the indoor thermal environment.
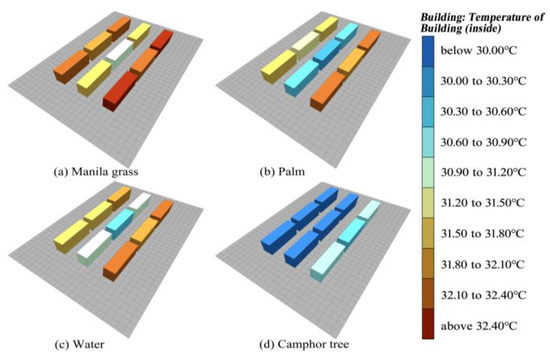
Figure 8.
A sample of indoor air temperatures of the four scenarios.
Figure 9 quantitatively analyzes the monthly average of the indoor air temperature that was regulated by different natural elements. The analytical results indicate that compared with the indoor air temperature of a residential unit without natural elements, the camphor tree reduces the indoor air temperature most. However, the impacts of the other three landscapes are hardly distinguished from the mean values.
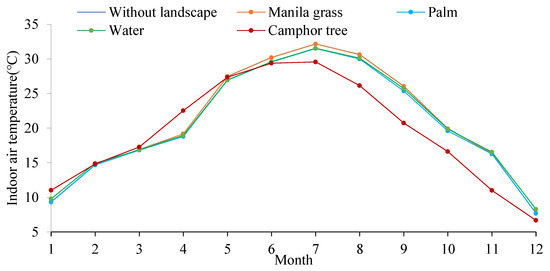
Figure 9.
The monthly average of indoor air temperature of the five scenarios.
The monthly averages hardly show the daily impacts of natural elements on the indoor air temperature. To clearly reveal their impacts, this research employed meteorological interpolation technology, namely the inverse distance weight (IDW) interpolation, which has proved acceptable in temperature interpolation [39,40]. The interpolation results are shown in Figure 9, where the x-coordinate represents the month and the y-coordinate represents the time. The z-value of each point indicates the indoor air temperature at that time, which is simulated with the average meteorological data of each hour in every month. For example, the average meteorological data of April for 10:00 were calculated from the 10:00 meteorological data of April. Following this method, this research obtained the average meteorological data for the other 23 h in April. Finally, the typical meteorological data of 24 h were used to describe the typical day in April, which was used to simulate the indoor air temperature in April. Following this method, this research calculated all the 1440 indoor air temperatures that formed the five month–daytime thermal distribution maps. According to the following criterion [41], air temperature below 8 °C is defined as “very cold”, 8–12 °C is defined as cold, 12–19 °C is defined as slightly cold, 19–26 °C is defined as comfortable, 26–30 °C is defined as slightly hot, 30–34 °C is defined as hot, and above 34 °C is defined as very hot. According to the standards of thermal perception, the thermal perception boundary lines were drawn in this research, and are shown in Figure 10.
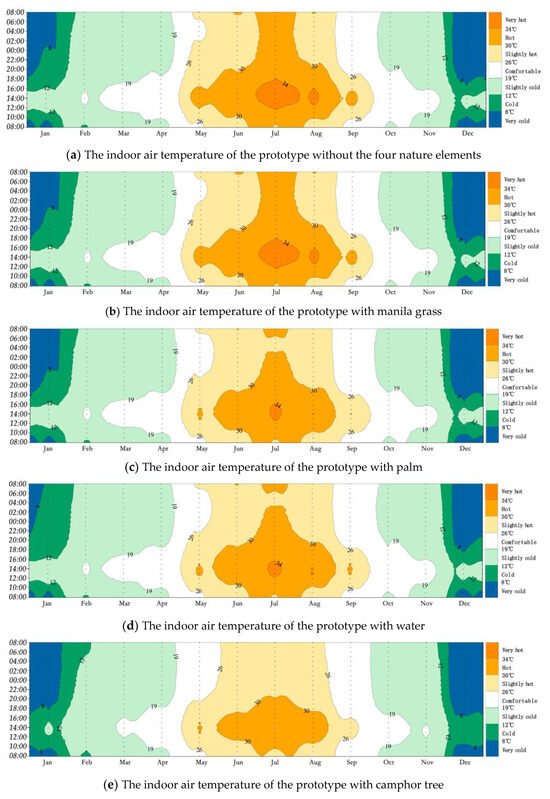
Figure 10.
The monthly average of the indoor air temperature of the five scenarios.
To evaluate the annual effect of landscapes on the indoor thermal environment, the duration of each thermal perception throughout the year was counted, with the duration calculated from its area ratio in the thermal distribution map of Figure 10. Compared with the indoor air temperature of the prototype without landscapes, manila grass had the weakest impact on the indoor air temperature, only reducing the “very hot” and “very cold” thermal perception by 17.23 h and 5.85 h, respectively. Palm and camphor tree both reduced the very “very hot” and “hot” thermal perception in summer, but increased the “cold” and “very cold” thermal perception. However, water not only reduced the “very hot” and “hot” thermal perceptions in summer, but also reduced the “very cold” thermal perception in winter.
To quantitatively evaluate the impact of landscape elements on indoor thermal comfort, in this research, “very hot” and “hot” indoor air temperatures were taken as the “cooling demand temperature”; “slightly hot”, “comfort”, and “slightly cold” indoor temperatures were taken as the “acceptable temperature”; and “very cold” and “cold” indoor air temperatures were taken as the “heating demand temperature”. Generally, manila grass had a slight impact on the annual indoor air temperature, only reducing the “cooling demand temperature” by 8.58 h, increasing the “heating demand temperature” by 14.74 h, and reducing the “acceptable temperature” by 6.16 h. Palm, water, and camphor tree all benefited the indoor air temperature from the view of annual cycle as they increased the annual “acceptable temperature” by 388.78 h, 416.78 h, and 523.16 h, respectively. Palm, water, and camphor tree all benefited the indoor thermal comfort in summer, reducing the “cooling demand temperature” by 385.27 h, 351.90 h, and 812.54 h. In the view of thermal perception in winter, camphor tree significantly deteriorated the indoor thermal perception as it increased the “heating demand temperature” by 289.38 h. Although palm and water benefited the indoor thermal comfort in summer, they still decreased the “heating demand temperature” by 3.51 h and 64.58 h, correspondingly.
4. Conclusions
Combing “Envi-met” and “IDW” methods, Chenzhou was taken as an example in this research to investigate the annual effect of landscapes on the indoor thermal environment in residential areas. This research found that although manila grass is widely planted in residential areas, it has only a very weak impact on the indoor temperature, affecting the “acceptable temperature” for only 6 h throughout the year, which can be ignored compared with the annual total of 8760 h. The camphor tree is the most effective landscape at regulating the indoor thermal environment, and extends the “acceptable temperature” by 523.16 h. The camphor tree lowers the indoor temperatures throughout the year, which decreases the “cooling demand temperature” by 812.54 h in summer and increases the “heating demand temperature” by 289.38 h. Generally, water performs better than palm in terms of regulating the annual indoor thermal environment, as water extends the “acceptable temperature” by 416.48 h, which is longer than that of palm (388.78 h). Specifically, palm performs better than water in summer, as they correspondingly reduce the “cooling demand temperature” by 385.27 h and 351.90 h, but the “heating demand temperature” reduced by water is longer than that of palm.
This research reveals that a landscape that benefits the thermal comfort in summer may deteriorate the thermal comfort in summer. Therefore, annual evaluation is necessary in hot summer and cold winter climate areas, and the method of “Envi-met+IDW” can be used as a reference. Furthermore, in terms of optimizing indoor thermal comfort throughout the year, camphor trees have the best performance, followed by water and palm. Manila grass has a very weak impact on indoor thermal comfort throughout the year.
Author Contributions
Conceptualization, J.L.; methodology, J.L.; software, J.L.; validation, B.Z.; formal analysis, J.L.; data curation, J.L.; writing—original draft preparation, J.L.; writing—review and editing, L.W.; visualization, X.C.; supervision, B.Z. and L.W.; funding acquisition, J.L. All authors have read and agreed to the published version of the manuscript.
Funding
This research was funded by Hunan Provincial Natural Science Foundation, grant number 2023JJ40728, the Scientific Research Fund of Hunan Provincial Education Department, grant number 21B0186. “The APC was funded by Hunan Provincial Natural Science Foundation, grant number 2023JJ40728”.
Data Availability Statement
Data are available upon request.
Acknowledgments
Thanks are given to Zilong Li and Chufeng Shi for their work in data collection.
Conflicts of Interest
The authors declare no conflicts of interest.
References
- Lai, Y.; Tang, B.; Chen, X.; Zheng, X. Spatial determinants of land redevelopment in the urban renewal processes in Shenzhen, China. Land Use Policy 2021, 103, 105330. [Google Scholar] [CrossRef]
- Pozoukidou, G.; Chatziyiannaki, Z. 15-Minute City: Decomposing the new urban planning eutopia. Sustainability 2021, 13, 928. [Google Scholar] [CrossRef]
- Mundher, R.; Abu Bakar, S.; Maulan, S.; Mohd Yusof, M.J.; Al-Sharaa, A.; Aziz, A.; Gao, H. Aesthetic quality assessment of landscapes as a model for urban forest areas: A systematic literature review. Forests 2022, 13, 991. [Google Scholar] [CrossRef]
- Yin, J.; Bratman, G.N.; Browning, M.H.; Spengler, J.D.; Olvera-Alvarez, H.A. Stress recovery from virtual exposure to a brown (desert) environment versus a green environment. J. Environ. Psychol. 2022, 81, 101775. [Google Scholar] [CrossRef]
- Priya, U.K.; Senthil, R. A review of the impact of the green landscape interventions on the urban microclimate of tropical areas. Build. Environ. 2021, 205, 108190. [Google Scholar] [CrossRef]
- Wang, C.; Liang, W.; Yan, J.; Jin, Z.; Zhang, W.; Li, X. Effects of vegetation restoration on local microclimate on the Loess Plateau. J. Geogr. Sci. 2022, 32, 291–316. [Google Scholar] [CrossRef]
- Tan, X.; Liao, J.; Bedra, K.B.; Li, J. Evaluating the 3D cooling performances of different vegetation combinations in the urban area. J. Asian Archit. Build. Eng. 2022, 21, 1124–1136. [Google Scholar] [CrossRef]
- Li, J.; Zheng, B.; Ouyang, X.; Chen, X.; Bedra, K.B. Does shrub benefit the thermal comfort at pedestrian height in Singapore? Sustain. Cities Soc. 2021, 75, 103333. [Google Scholar] [CrossRef]
- Thani, S.S.O.; Mohamad, N.N.; Jamaludin, S.N. Outdoor thermal comfort: The effects of urban landscape morphology on microclimatic conditions in a hot-humid city. WIT Trans. Ecol. Environ. 2013, 179, 651–662. [Google Scholar]
- Hall, S.J.; Learned, J.; Ruddell, B.; Larson, K.L.; Cavender-Bares, J.; Bettez, N.; Groffman, P.M.; Grove, J.M.; Heffernan, J.B.; Hobbie, S.E. Convergence of microclimate in residential landscapes across diverse cities in the United States. Landsc. Ecol. 2016, 31, 101–117. [Google Scholar] [CrossRef]
- Lin, J.; Brown, R.D. Integrating microclimate into landscape architecture for outdoor thermal comfort: A systematic review. Land 2021, 10, 196. [Google Scholar] [CrossRef]
- Zhang, X.; Lei, Y.; Li, R.; Ackerman, A.; Guo, N.; Li, Y.; Yang, Q.; Liu, Y. Research on thermal comfort of underside of street tree based on LiDAR point cloud model. Forests 2022, 13, 1086. [Google Scholar] [CrossRef]
- Gatto, E.; Buccolieri, R.; Aarrevaara, E.; Ippolito, F.; Emmanuel, R.; Perronace, L.; Santiago, J.L. Impact of urban vegetation on outdoor thermal comfort: Comparison between a mediterranean city (Lecce, Italy) and a northern European city (Lahti, Finland). Forests 2020, 11, 228. [Google Scholar] [CrossRef]
- Sun, S.; Xu, X.; Lao, Z.; Liu, W.; Li, Z.; García, E.H.; He, L.; Zhu, J. Evaluating the impact of urban green space and landscape design parameters on thermal comfort in hot summer by numerical simulation. Build. Environ. 2017, 123, 277–288. [Google Scholar] [CrossRef]
- Feng, L.; Zhao, M.; Zhou, Y.; Zhu, L.; Tian, H. The seasonal and annual impacts of landscape patterns on the urban thermal comfort using Landsat. Ecol. Indic. 2020, 110, 105798. [Google Scholar] [CrossRef]
- Meili, N.; Acero, J.A.; Peleg, N.; Manoli, G.; Burlando, P.; Fatichi, S. Vegetation cover and plant-trait effects on outdoor thermal comfort in a tropical city. Build. Environ. 2021, 195, 107733. [Google Scholar] [CrossRef]
- Altunkasa, C.; Uslu, C. Use of outdoor microclimate simulation maps for a planting design to improve thermal comfort. Sustain. Cities Soc. 2020, 57, 102137. [Google Scholar] [CrossRef]
- Fatnassi, H.; Bournet, P.E.; Boulard, T.; Roy, J.C.; Molina-Aiz, F.D.; Zaaboul, R. Use of computational fluid dynamic tools to model the coupling of plant canopy activity and climate in greenhouses and closed plant growth systems: A review. Biosyst. Eng. 2023, 230, 388–408. [Google Scholar] [CrossRef]
- Perini, K.; Chokhachian, A.; Dong, S.; Auer, T. Modeling and simulating urban outdoor comfort: Coupling ENVI-Met and TRNSYS by grasshopper. Energy Build. 2017, 152, 373–384. [Google Scholar] [CrossRef]
- Liu, Z.; Zheng, S.; Zhao, L. Evaluation of the ENVI-Met vegetation model of four common tree species in a subtropical hot-humid area. Atmosphere 2018, 9, 198. [Google Scholar] [CrossRef]
- Liu, Z.; Cheng, W.; Jim, C.Y.; Morakinyo, T.E.; Shi, Y.; Ng, E. Heat mitigation benefits of urban green and blue infrastructures: A systematic review of modeling techniques, validation and scenario simulation in ENVI-met V4. Build. Environ. 2021, 200, 107939. [Google Scholar] [CrossRef]
- Tong, S.; Wong, N.H.; Tan, C.L.; Jusuf, S.K.; Ignatius, M.; Tan, E. Impact of urban morphology on microclimate and thermal comfort in northern China. Sol. Energy 2017, 155, 212–223. [Google Scholar] [CrossRef]
- Lehoczky, A.; Sobrino, J.A.; Skoković, D.; Aguilar, E. The urban heat island effect in the city of Valencia: A case study for hot summer days. Urban Sci. 2017, 1, 9. [Google Scholar] [CrossRef]
- Jin, H.; Cui, P.; Wong, N.H.; Ignatius, M. Assessing the effects of urban morphology parameters on microclimate in Singapore to control the urban heat island effect. Sustainability 2018, 10, 206. [Google Scholar] [CrossRef]
- Shi, L.; Luo, Z.; Matthews, W.; Wang, Z.; Li, Y.; Liu, J. Impacts of urban microclimate on summertime sensible and latent energy demand for cooling in residential buildings of Hong Kong. Energy 2019, 189, 116208. [Google Scholar] [CrossRef]
- Aflaki, A.; Mirnezhad, M.; Ghaffarianhoseini, A.; Ghaffarianhoseini, A.; Omrany, H.; Wang, Z.-H.; Akbari, H. Urban heat island mitigation strategies: A state-of-the-art review on Kuala Lumpur, Singapore and Hong Kong. Cities 2017, 62, 131–145. [Google Scholar] [CrossRef]
- Cheung, P.K.; Jim, C.Y. Effects of urban and landscape elements on air temperature in a high-density subtropical city. Build. Environ. 2019, 164, 106362. [Google Scholar] [CrossRef]
- Li, J.; Zheng, B.; Chen, X.; Zhou, Y.; Rao, J.; Bedra, K.B. Research on annual thermal environment of non-hvac building regulated by window-to-wall ratio in a Chinese city (Chenzhou). Sustainability 2020, 12, 6637. [Google Scholar] [CrossRef]
- Macintyre, H.L.; Heaviside, C.; Cai, X.; Phalkey, R. The winter urban heat island: Impacts on cold-related mortality in a highly urbanized European region for present and future climate. Environ. Int. 2021, 154, 106530. [Google Scholar] [CrossRef] [PubMed]
- Wang, M.; He, G.; Zhang, Z.; Wang, G.; Zhang, Z.; Cao, X.; Wu, Z.; Liu, X. Comparison of spatial interpolation and regression analysis models for an estimation of monthly near surface air temperature in China. Remote Sens. 2017, 9, 1278. [Google Scholar] [CrossRef]
- Li, X.; Hui, E.C.; Chen, T.; Lang, W.; Guo, Y. From Habitat III to the new urbanization agenda in China: Seeing through the practices of the “three old renewals” in Guangzhou. Land Use Policy 2019, 81, 513–522. [Google Scholar] [CrossRef]
- Whittinghill, L.J.; Rowe, D.B.; Schutzki, R.; Cregg, B.M. Quantifying carbon sequestration of various green roof and ornamental landscape systems. Landsc. Urban Plan. 2014, 123, 41–48. [Google Scholar] [CrossRef]
- Liu, W.; Zuo, B.; Qu, C.; Ge, L.; Shen, Q. A reasonable distribution of natural landscape: Utilizing green space and water bodies to reduce residential building carbon emissions. Energy Build. 2022, 267, 112150. [Google Scholar] [CrossRef]
- He, Y.; Lin, E.S.; Zhang, W.; Tan, C.L.; Tan, P.Y.; Wong, N.H. Local microclimate above shrub and grass in tropical city: A case study in Singapore. Urban Clim. 2022, 43, 101142. [Google Scholar] [CrossRef]
- Teichmann, F.; Baumgartner, C.M.; Horvath, A.; Luisser, M.; Korjenic, A. Simulation of urban microclimate with uhiSolver: Software validation using simplified material data. Ecol. Process. 2021, 10, 67. [Google Scholar] [CrossRef]
- Bruse, M. ENVI-met 3.0: Updated model overview. Univ. Bochum. 2004, 3, 1–12. [Google Scholar]
- Li, J.; Zheng, B.; Bedra, K.B.; Li, Z.; Chen, X. Evaluating the effect of window-to-wall ratios on cooling-energy demand on a typical summer day. Int. J. Environ. Res. Public Health 2021, 18, 8411. [Google Scholar] [CrossRef]
- Szűcs, Á.; Gál, T.; Andrade, H. Comparison of measured and simulated Mean Radiant Temperature: Case study in Lisbon (Portugal). Finisterra 2014, 49, 95–111. [Google Scholar] [CrossRef]
- Samanta, S.; Pal, D.K.; Lohar, D.; Pal, B. Interpolation of climate variables and temperature modeling. Theor. Appl. Climatol. 2012, 107, 35–45. [Google Scholar] [CrossRef]
- Ozelkan, E.; Bagis, S.; Ozelkan, E.C.; Ustundag, B.B.; Yucel, M.; Ormeci, C. Spatial interpolation of climatic variables using land surface temperature and modified inverse distance weighting. Int. J. Remote Sens. 2015, 36, 1000–1025. [Google Scholar] [CrossRef]
- Li, J.; Zheng, B.; Chen, X.; Qi, Z.; Bedra, K.B.; Zheng, J.; Li, Z.; Liu, L. Study on a full-year improvement of indoor thermal comfort by different vertical greening patterns. J. Build. Eng. 2021, 35, 101969. [Google Scholar] [CrossRef]


Disclaimer/Publisher’s Note: The statements, opinions and data contained in all publications are solely those of the individual author(s) and contributor(s) and not of MDPI and/or the editor(s). MDPI and/or the editor(s) disclaim responsibility for any injury to people or property resulting from any ideas, methods, instructions or products referred to in the content. |
© 2024 by the authors. Licensee MDPI, Basel, Switzerland. This article is an open access article distributed under the terms and conditions of the Creative Commons Attribution (CC BY) license (https://creativecommons.org/licenses/by/4.0/).