Article

Study on Associations between Root and Aboveground Growth of Mixed-Planting Seedlings of Populus tomentosa and Pinus tabuliformis under Soil Nutrient Heterogeneity

by
Xi Wei
1,2,†,
Jiafeng Yao
1,†,
Yu Guo
1,
Xiang Sui
1,
Xiao Lv
1,
Xiaoman Liu
1,
Yuan Dong
1 and
Wenjun Liang
1,*
1
College of Forestry, Shanxi Agriculture University, Jinzhong 030801, China
2
Ji County Station, Chinese National Ecosystem Research Network (CNERN), Beijing 100083, China
*
Author to whom correspondence should be addressed.
These authors contributed equally to this work.
Forests 2024, 15(7), 1151; https://doi.org/10.3390/f15071151
Submission received: 15 May 2024 / Revised: 19 June 2024 / Accepted: 26 June 2024 / Published: 2 July 2024
(This article belongs to the Section Forest Soil)

Abstract

:
Near-natural transformation can convert artificial monoculture forests into mixed forests with diverse ages, multi-layered structures, and enhanced ecological functions. This transformation optimizes stand structure, improves soil physical and chemical properties, and enhances stand productivity and species diversity. This study aimed to explore the relationship between the underground roots and aboveground growth of Pinus tabuliformis and Populus tomentosa under conditions of nutrient heterogeneity, with the goal of advancing plantation transformation. This research focused on 1-year-old Populus tomentosa and 5-year-old Pinus tabuliformis, employing two planting densities (25 cm and 50 cm) and three fertilization levels, low (50 g·m−2), medium (100 g·m−2), and high (200 g·m−2), using Stanley Potassium sulfate complex fertilizer (N:P:K = 15:15:15). Each treatment had three replicates, resulting in a total of nine experimental groups, all planted in circular plots with a radius of 1 m. Standard major axis (SMA) regression was used to analyze the allometric relationship between underground fine root biomass and aboveground organ biomass. This study further explored correlations between fine root length, root surface area, volume, biomass, and aboveground biomass, culminating in a mixed-effects model. The mixed-effects model quantified the relationships between underground roots and aboveground growth in varying soil nutrient environments. The results indicated optimal root growth in Populus tomentosa and Pinus tabuliformis, characterized by maximum root length, surface area, and volume, under conditions of 200 g·m−2 soil nutrient concentration and 50 cm planting distance; Populus tomentosa fine roots had a vertical center at a depth of 8.5 cm, whereas Pinus tabuliformis roots were centered at depths of 5–7.5 cm, indicating differing competitive strategies. Pinus tabuliformis exhibited competitive superiority in the soil’s surface layer, in contrast to Populus tomentosa, which thrived in deeper layers. The study of the allometric growth model revealed that under conditions where the nutrient gradient was 200 g·m−2 and the planting distance was 25 cm, Populus tomentosa demonstrated its highest allometric growth index (2.801), indicative of positive allometric growth. Furthermore, there was a notable inclination of resource allocation towards the aboveground, which enhances the accumulation of aboveground biomass. The mixed-effects model equation showed a clear linear relationship between underground roots and aboveground biomass. The final fitting coefficient of the model was high, providing a robust theoretical basis for future management practices. The mixed-effects model revealed the following hierarchy of fixed-effect coefficients for root system characteristics affecting aboveground biomass: fine root volume (132.11) > fine root biomass (6.462) > root surface area (−4.053) > fine root length (0.201). In subsequent plantation reconstruction and forest management, increasing soil fertility and planting distance can promote the growth of underground roots and biomass accumulation. Appropriately increasing soil fertility and reducing planting distance can effectively promote aboveground biomass accumulation, achieving sustainable forest development.

1. Introduction

Forests, which are fundamental to ecosystems, not only exhibit diverse structures and functions but also play crucial roles in fostering sustainable economic, social, and environmental development [1,2]. In China, extensive artificial forests were often characterized by monolithic structures, limited productivity, compromised stability and resilience, reduced biodiversity, and diminished ecological and environmental services [3,4]. Addressing these issues, the transformation of artificial forests towards “close-to-nature management”, especially converting monotypic stands into mixed forests, has emerged as an effective strategy. Near-natural transformation could optimize stand structure, significantly improve the soil’s physical and chemical properties, and enhance stand productivity and species diversity [5,6]. Studies have shown that the soil microbial community structure in subtropical Pinus massoniana plantations responds extremely sensitively to changes in tree species composition [7]. After introducing nitrogen-fixing species to modify the Eucalyptus robusta monoculture, the soil carbon storage, nitrogen content, and microbial diversity increased significantly [8]. The aboveground plant diversity resulting from the mixing of multiple tree species was mirrored in the diversity of the subsurface microbial community and its niche differentiation in the mixed forest, leading to complex, synergistic, and complementary ecological function relationships. Although significant progress has been made in understanding the ecological benefits of the aboveground components of the stand, research on the role of underground roots in forest management remains relatively insufficient. The coordination and competition between aboveground and belowground components could facilitate the successful transition from monoculture to mixed forest. This transition is a key factor in determining the sustainable development of forest stands and maximizing their ecological services. Therefore, studying the correlation between aboveground and belowground growth and establishing their interrelationship is particularly important.
Plant competition plays a pivotal role in terrestrial growth, significantly influencing community structure and species evolutionary patterns [9]. Research in this field spans various ecological levels, including individuals, populations, communities, and ecosystems. Studies investigate how competition affects the variability in individual size [10], regulates population size [11], influences the spatial distribution patterns of communities [12], and contributes to maintaining species diversity in ecosystems [13]. Overall, competition significantly impacts plant growth, both aboveground and belowground [11]. Many scholars have differing understandings of the competitive interactions among underground roots in heterogeneous nutrient environments. Plants respond to environmental changes by adjusting the morphological structures of their root tips and leaves, particularly in soils with nutrient heterogeneity [14]. Plant roots tend to grow in soil patches with higher nutrient concentrations, a behavior considered a foraging mechanism to cope with soil nutrient heterogeneity [15]. Day et al. [16] discovered in their research on Greengrass and Festuca that nutrient heterogeneity significantly increased interspecific competition in nutrient patches, a trend more pronounced in low-nutrient soils [17]. Jiali et al. [18] also demonstrated that plant root biomass was higher in heterogeneous soil compared to soil with average nutrient levels. “Competitor–stress-tolerant–disturbance-tolerant” theory [19] and Cahill et al.’s [20] research also supported the notion that extensive root proliferation in nutrient patch areas significantly affected plant root competition. McNickle et al. [21] predicted that roots in nutrient patch areas invested more energy and time in nutrient acquisition, a hypothesis they confirmed experimentally. Conversely, Tilman’s [22] minimum resource demand competition theory and Schenk’s [23] research presented alternate views. They argued that root competition was more intense in nutrient-poor soil and decreased with increasing soil nutrient concentrations. They also noted that under sufficient nutrient conditions, root competition had a more significant impact on plant growth and species diversity. However, some studies, such as those by Blair [24] and Von Wettberg and Weiner [25], found no significant effect of nutrient patches on root competition intensity. In summary, soil nutrient status is intricately linked to underground root competition, with the two being inseparable. Moreover, the growth of underground roots and that of aboveground parts are closely interconnected. Consequently, studying the relationships between root competition and aboveground growth in heterogeneous soil nutrients is of paramount importance.
Pinus tabuliformis (abbreviated as Pinus t. in the following) and Populus tomentosa (abbreviated as Populus t. in the following), known for their high survival rates and strong adaptability, dominated natural forests in North China, significantly contributing to water and soil conservation and ecological improvement [26,27]. Populus t., a fast-growing broadleaved species, played crucial roles in afforestation efforts in China, valued for its excellent carbon sequestration and soil improvement effects [28]. The genetic improvement of Populus t. focused on enhancing its wood quality and environmental adaptability [29]. Studies also showed that Populus t. effectively remediated heavy-metal-polluted soil and was excellent for ecological restoration [30]. Recent studies on Pinus t. focused on its adaptive mechanisms, responses to environmental changes, and the effects of various conditions on seedling growth [31,32,33]. Pinus t. exhibited strong drought resistance, cold tolerance, barren tolerance, and root plasticity, making it suitable for timber production, soil and water conservation, and erosion prevention [34]. However, China’s monoculture forests of Pinus t. faced issues such as simplistic structure, severe pest and disease problems, poor tree growth, and limited natural regeneration ability [35]. To enhance the ecological function of pure Pinus t. forests, there has been a growing research focus on adopting mixed-forest management strategies aimed at increasing tree species diversity to improve forest stability and ecological service functions. Consequently, measures such as stand renovation have been implemented, including the introduction of Populus t. into Pinus t. plantations, to ensure the stand’s integral role within the forest ecosystem. Studying the relationship between the root systems and aboveground growth of broadleaf Populus t. and conifer Pinus t. under nutrient heterogeneity was of great significance. This research aimed to promote the transformation of artificial pure forests, restore forest ecological functions, and achieve sustainable management. This study investigated the impact of root competition on aboveground growth under heterogeneous soil nutrient conditions by manipulating soil nutrients and varying the planting distances between 5-year-old Pinus t. and 1-year-old Populus t. Allometric growth equations were employed to explore the relationship between roots and aboveground biomass, and a mixed-effects model was constructed to analyze these dynamics. By examining fixed-effect coefficients and their significance within the model, this research quantified the correlation between roots and aboveground parts under varying nutrient conditions. The hypotheses tested are as follows: (1) The response of fine roots of Populus t. and Pinus t. is pronounced under heterogeneous nutrient conditions, particularly under high nutrient levels and closer planting distances. (2) Under nutrient heterogeneity, Populus t.’s subsurface fine roots exhibit a clear allometric relationship with aboveground biomass, displaying distinct resource allocation strategies across different conditions. (3) Under heterogeneous nutrient conditions, underground roots significantly influence aboveground growth and development.

2. Materials and Methods

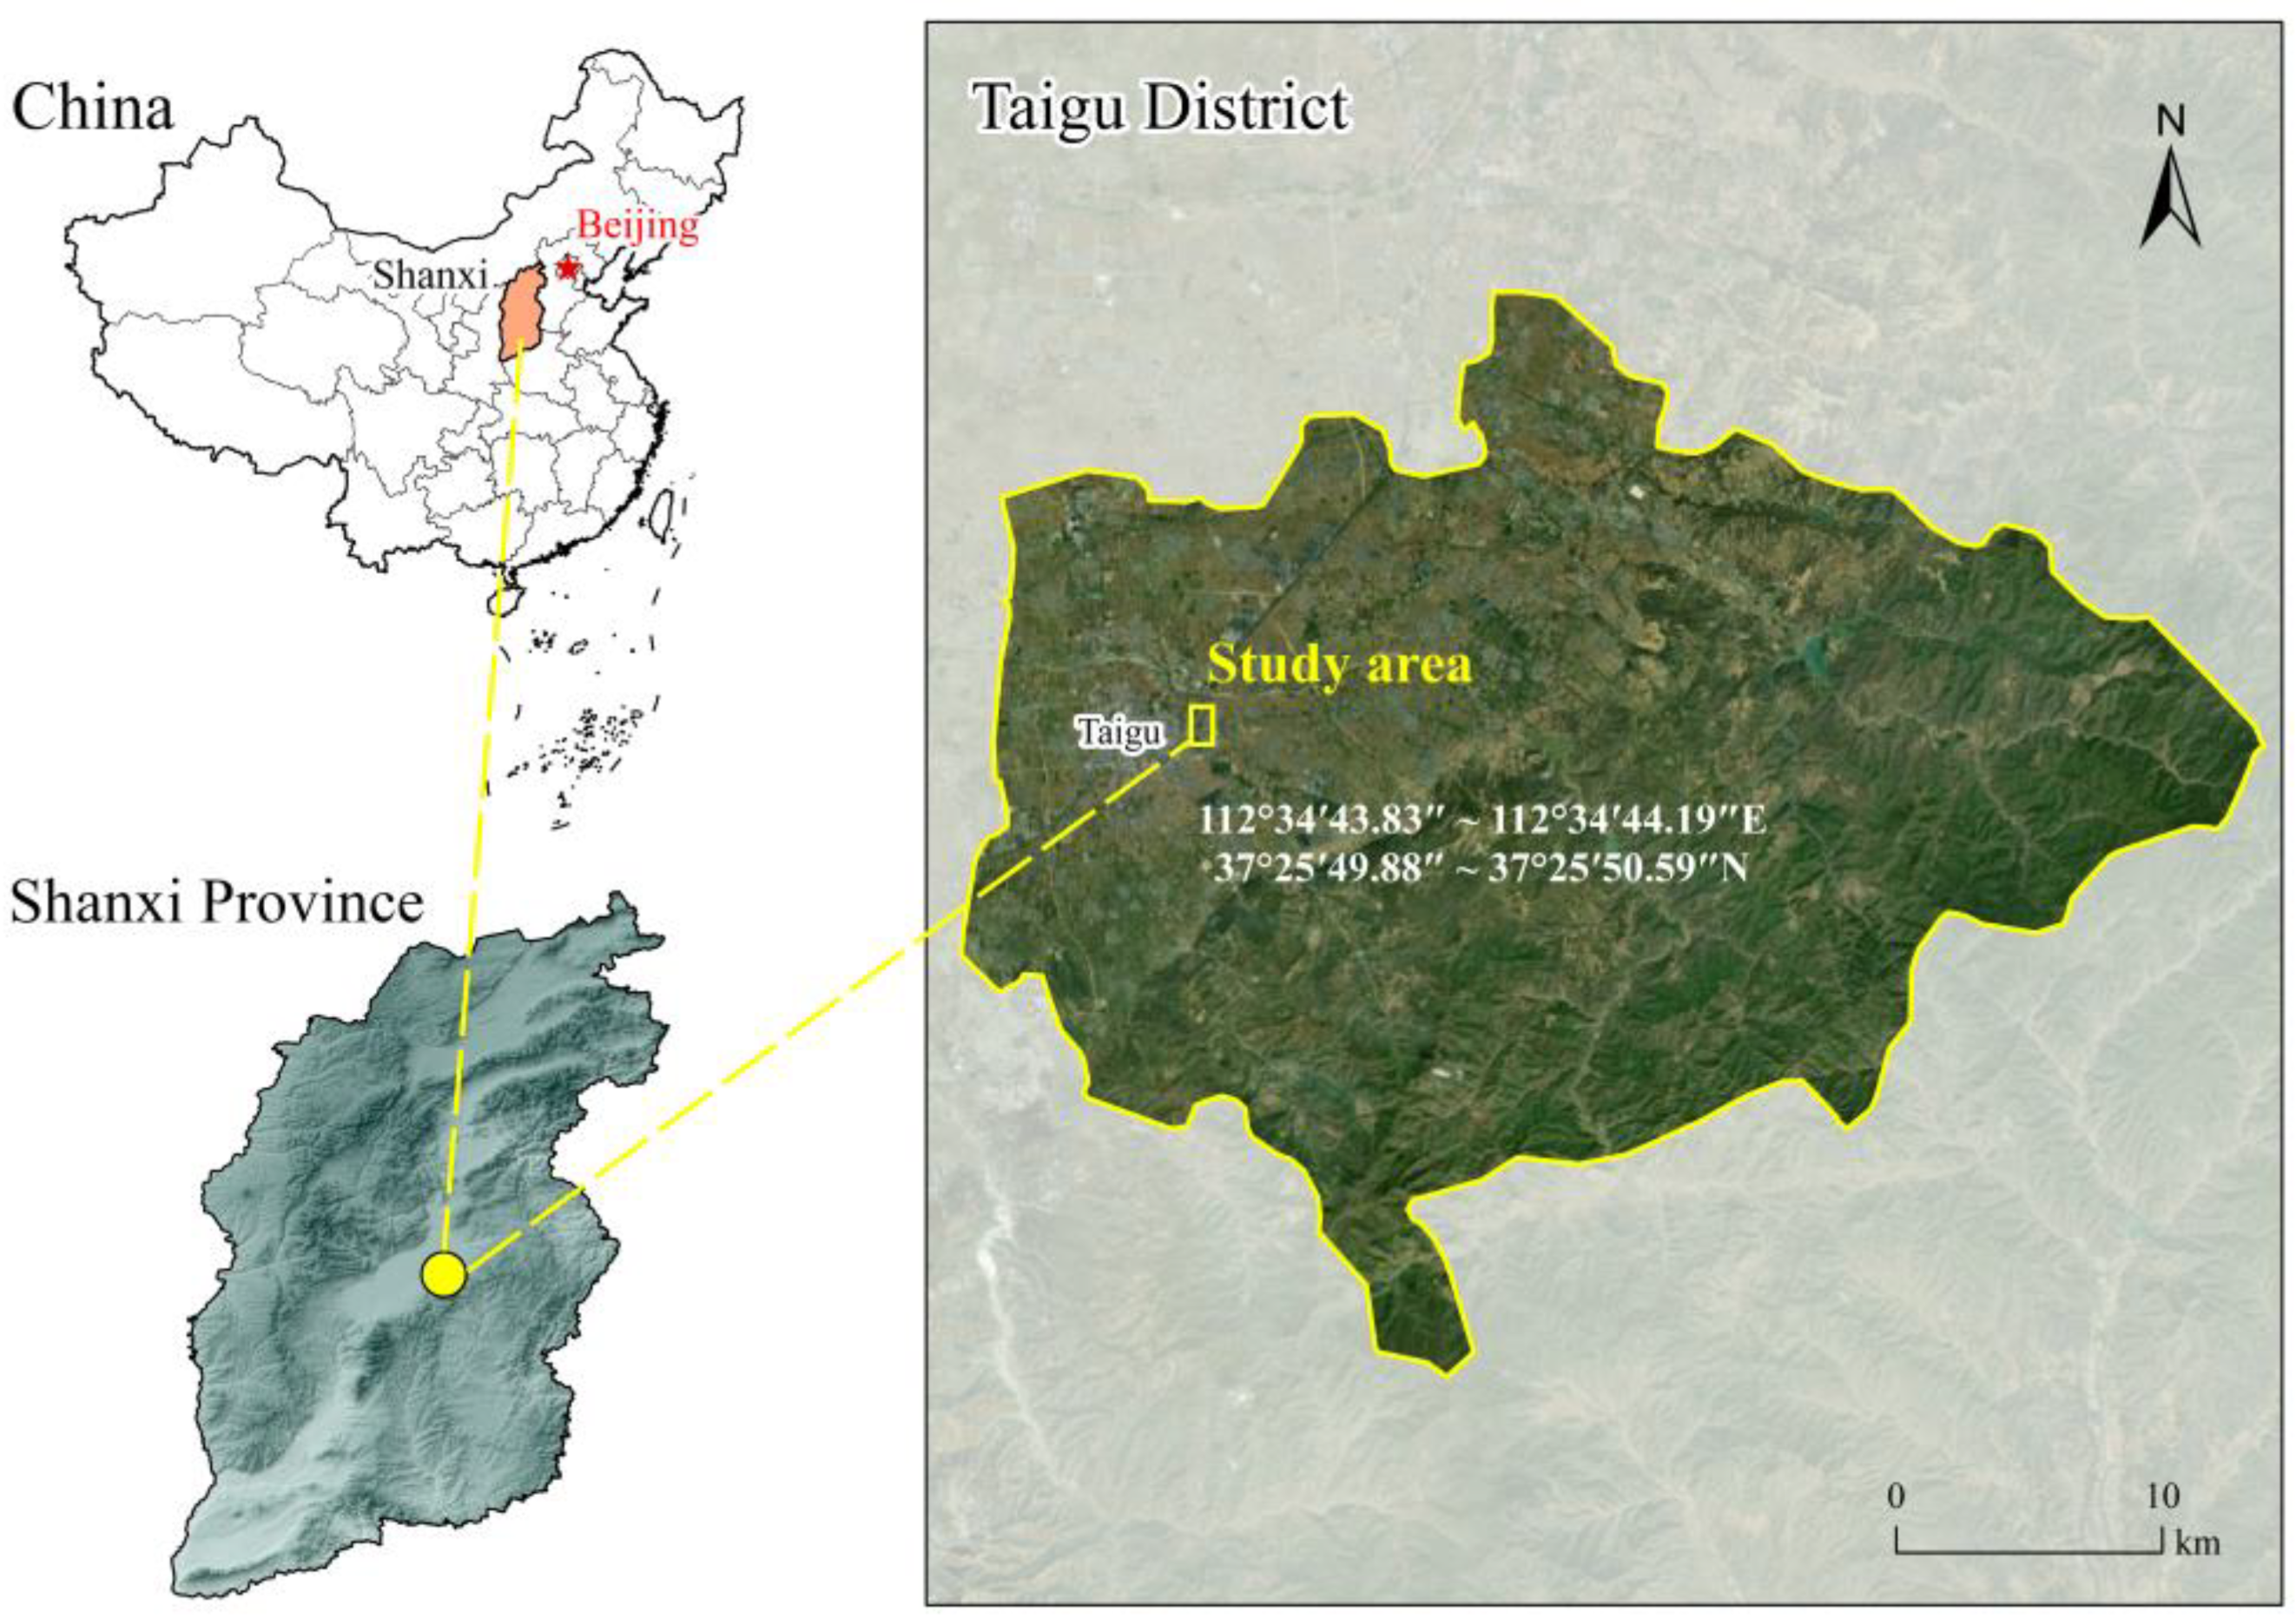
2.1. Overview of the Study Area

The experimental site is located at the Forestry Station of Shanxi Agricultural University, Taigu District, Jinzhong City, Shanxi Province (112°28′–113°01 E, 37°12′–37°03′ N), in the eastern part of the Loess Plateau, at an elevation of approximately 800 m, with a temperate continental monsoon climate (Figure 1). The climate is characterized by cold, dry winters with minimal snowfall, hot, rainy summers, crisp autumns, and dry, windy springs. During the period when the rainy and warm seasons overlap, precipitation distribution is significantly uneven, with most rainfall occurring from July to September, totaling an annual average of 458 mm. Significant diurnal temperature variations are observed, with an average annual temperature of 9.5 °C to 10.5 °C and spring and autumn temperatures ranging from 10 °C to 22 °C. The average annual sunshine duration ranges from approximately 2500 to 2600 h, and the frost-free period extends from 150 to 190 days. The predominant soil type in this area is brown soil, featuring a pH value of approximately 8.0 [36].

2.2. Research Methods

2.2.1. Test Materials

In this experiment, two tree species were selected as the research objects, namely 5-year-old Pinus t. and 1-year-old Populus t., which are common tree species in the Loess Plateau in China. Pinus t. was selected from the same group of young trees with good and similar growth, and the plants’ heights and ground diameters were basically the same. Populus t. cuttings of the same size were selected. To achieve uniform initial nutrient levels across all sample points, soil preparation involved thorough mixing of the 50 cm layer across each site. This ensured homogeneity in soil properties throughout the study area. This process ensured that the soil properties became uniform across all sample points. The initial soil nutrients are shown in Table 1.

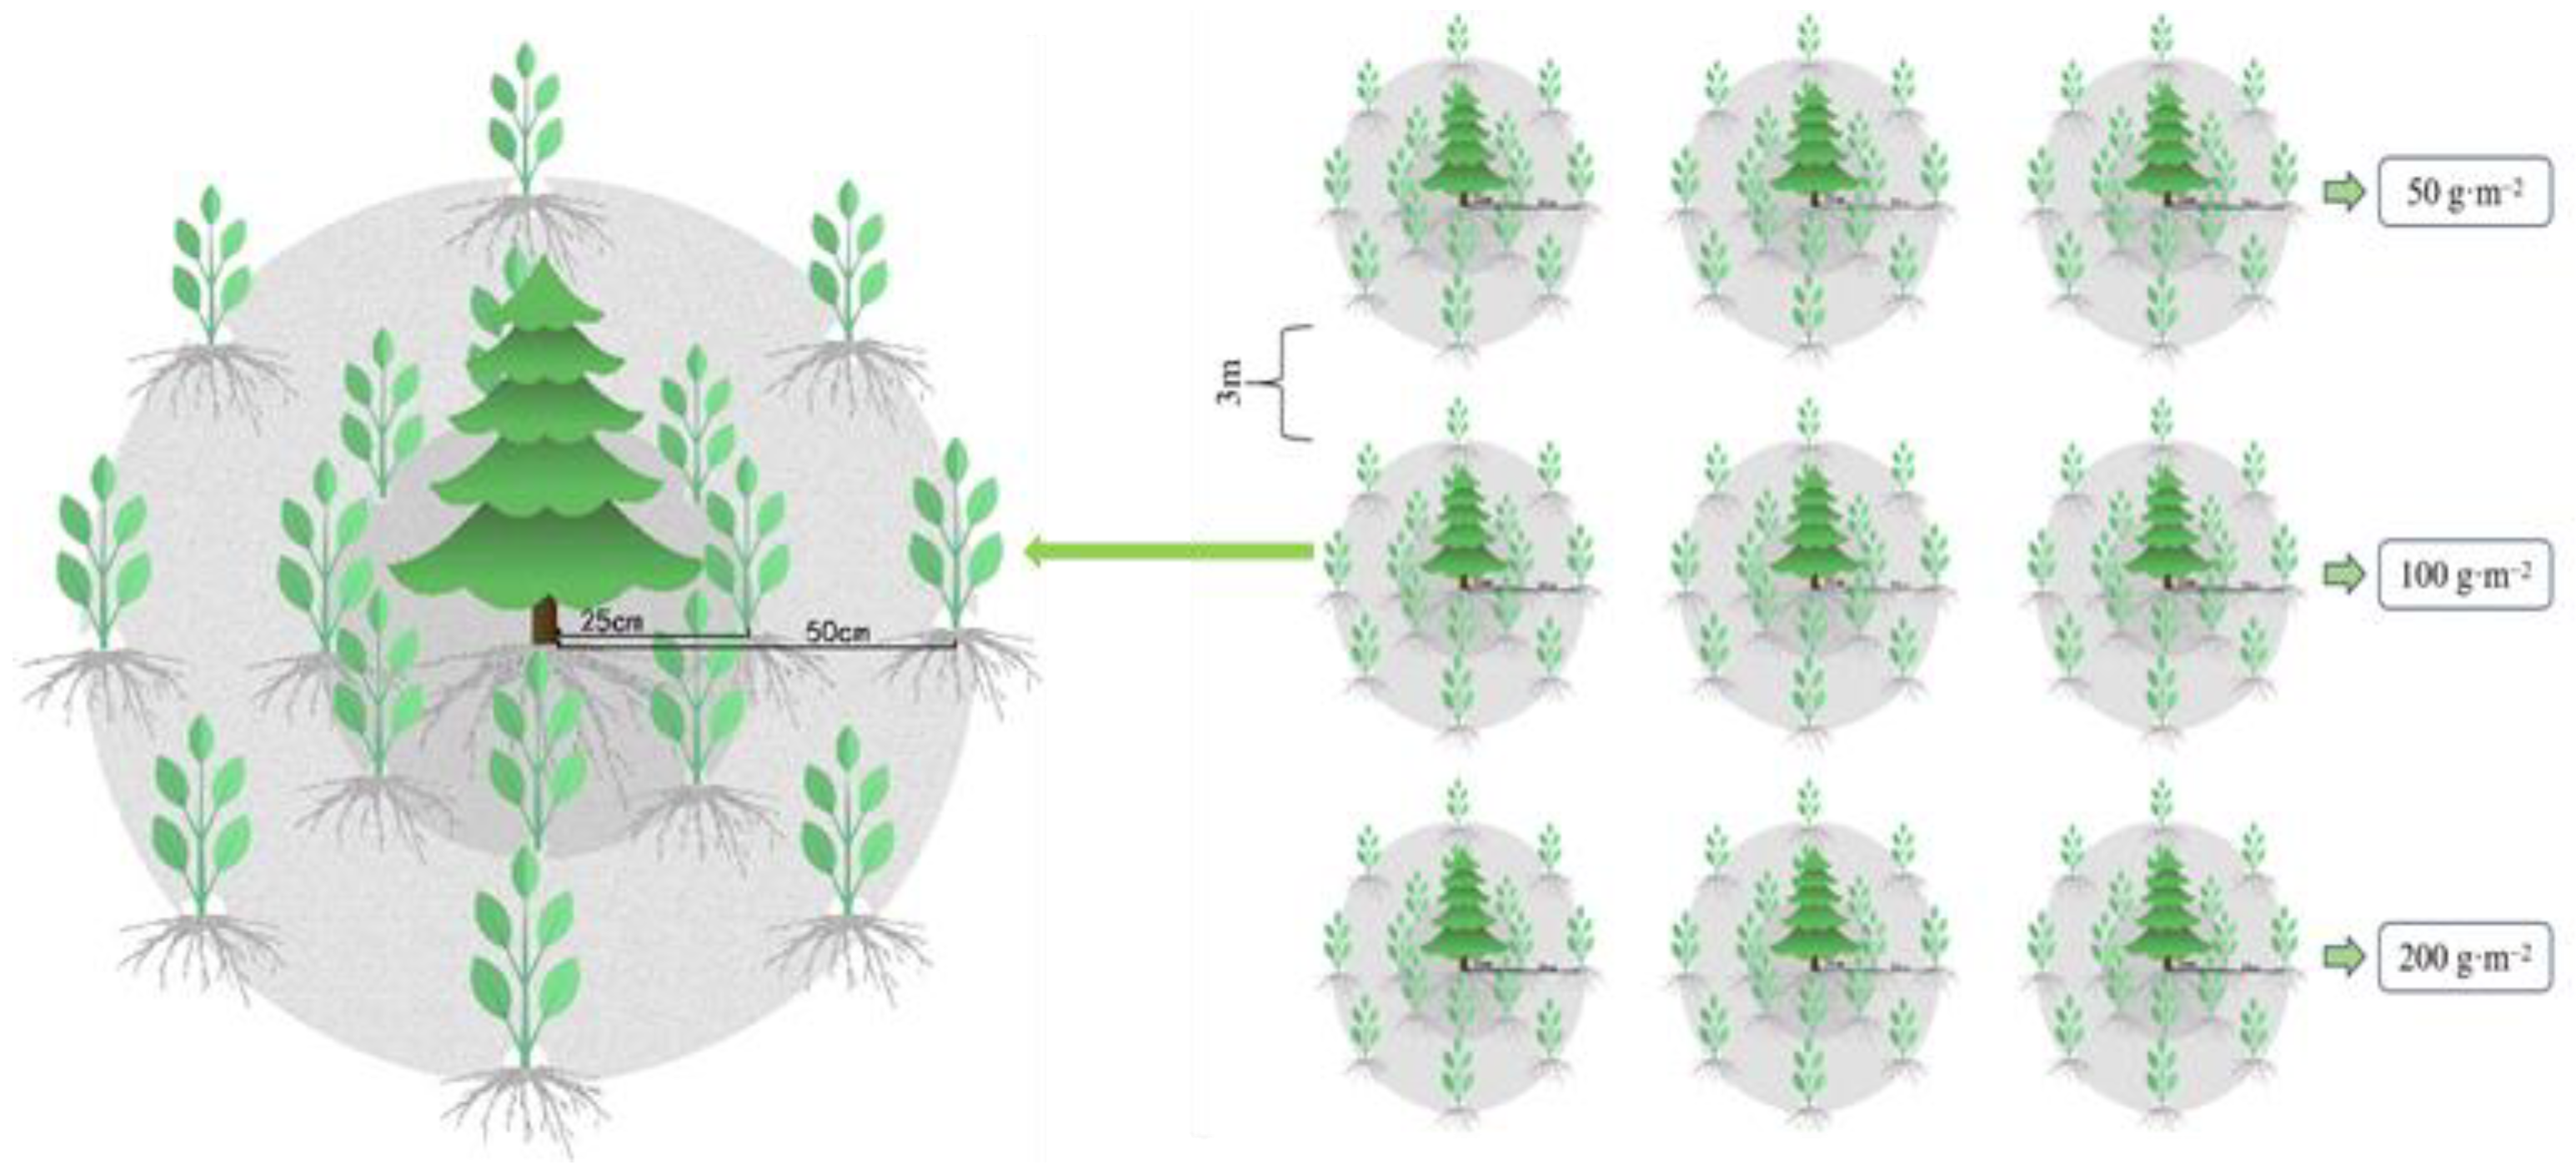
2.2.2. Experimental Design

The experiment was conducted in the Forestry Station of Shanxi Agricultural University from April 2021 to October 2023 to study the growth of Populus t. and Pinus t. in two growing seasons, aiming to explore the relationship between root and aboveground growth under soil nutrient heterogeneity. The 5-year-old Pinus t. was planted in the center point. After the survival of Pinus t., Populus t. cuttings were uniformly planted in eight directions 25 cm and 50 cm away from Pinus t. in order to eliminate the influence of planting direction, as shown in Figure 2. Three fertilization gradients with different concentrations were set up, low concentration (50 g·m−2), medium concentration (100 g·m−2), and high concentration (200 g·m−2), with 3 replicates per gradient, and a total of 9 groups were set. The fertilizer used was Stanley potassium sulfate compound fertilizer (N:P:K = 15:15:15). To eliminate the influence of fertilizer on adjacent sample sites, a 50 cm deep plastic partition was inserted between the sites to isolate the flow of nutrients. After the slow seedling stage, the fertilizer was evenly distributed in the sample sites. During the trial period, regular seedling management, including watering and weed removal, was carried out to ensure the normal growth of Pinus t. and Populus t.

2.2.3. Sample Collection and Processing

In October 2022, a sampling area with a 1 m radius was designated around Pinus t. To minimize disturbance during excavation, ground weeds and debris were removed. The whole tree method was employed using shovels and hoes, starting from the base of the trunk and gradually expanding outward. Excavation was conducted carefully to avoid root damage. In cases of deep or compact soil, roots were collected after the soil had been softened with water to minimize root damage. Small or fragile roots were precisely excavated using hand tools such as brushes. Once roots were fully exposed, four vertical soil layers (0–5 cm, 5–10 cm, 10–15 cm, and 15–20 cm) were delineated to collect root samples of Pinus t. and Populus t. During sampling, it was noted that negligible fine root distribution was exhibited in the soil below 20 cm; therefore, only fine roots in the 0–20 cm soil layer were collected, disregarding roots below 20 cm. Once transported to the lab, root samples were gently washed with water and a brush to remove all attached soil. Care was maintained during the cleaning process to prevent root damage. The cleaned root system was utilized to determine the root index. Aboveground leaves and stems were also collected for biomass measurement and transported to the laboratory. In the laboratory, root diameters were measured with electronic vernier calipers. Roots with a diameter > 2 mm were segregated, and only fine roots (0–2 mm) were scanned with an EPSON Perfection V750 scanner (Seiko Epson Corporation, Suwa, Nagano, Japan). The Win-RHIZO Pro 2012 root analysis system was used to obtain growth indices of fine roots, including root length, surface area, and volume. Following scanning and analysis, fine roots, leaves, and stems were dried at 105 °C for 30 min and then further dried at 85 °C to a constant weight, cooled, and weighed with a 1/1000 precision electronic balance to measure the dry weight for biomass data.

2.3. Data Processing

2.3.1. Vertical Center of Fine Roots

The distribution of fine roots of Pinus t. and Populus t. exhibits heterogeneity in the vertical soil profile, warranting a quantitative analysis using the formula for the fine roots’ vertical center. The formula for this calculation is delineated as follows:
D F R V B = i = 1 n D i P i
P i = R L D i R L D +
DFRVB denotes the soil depth (cm) at the vertical center of fine roots; i represents the soil layer; and Di specifies the depth (cm) at the midpoint of each soil layer. Pi was calculated as the ratio of RLDi, which signifies the fine root length density within a specific soil layer i, to RLD+, indicating the total fine root length density in the 0–20 cm soil layer.

2.3.2. Allometric Growth Model

To control for the influence of available nutrients per plant, specifically the effects of plant size, on study outcomes, the standardized major axis (SMA) method was employed. This approach enabled a comprehensive analysis of the relationships between subsurface fine root biomass and aboveground biomass under varying soil nutrient conditions. The allometric growth equation, Y = β · X α , was transformed into logY = log   β + α log   X after logarithmic transformation, where X represents underground fine root biomass and Y represents aboveground biomass. The slope α represents the allometric exponent, and β is the intercept of the equation. The “Standardized Major Axis Tests and Routines (SMATR) 2.0” software [37] was employed to calculate the parameters of the allometric equation and to assess the allometric relationships, including performing common slope tests and variance analysis. The slope α was compared with the theoretical value of 1.0 to ascertain any significant difference. A significant difference (p < 0.05) suggested allometric growth in the relationship between underground fine root biomass and aboveground biomass. A greater deviation of the slope from 1.0 indicated more pronounced differences in allometric growth rates. Conversely, a non-significant difference (p > 0.05) indicated isokinetic growth between the two [38]. Post hoc multiple comparisons were used to analyze the significance of differences in regression slopes and intercepts among treatments. In cases of non-significant slope differences, a common slope was utilized, and the Wald method was employed to test the significance of displacement differences along the common principal axis among treatments, as well as to calculate said displacements.

2.3.3. Correlation Analysis

In this study, we employed Pearson correlation coefficients to evaluate the linear relationships between fertilization concentrations and multiple plant parameters including aboveground biomass, root length, root surface area, root volume, and root biomass. The Pearson correlation coefficient (r) assesses the strength and direction of linear relationships, ranging from −1 (perfect negative correlation) to 1 (perfect positive correlation), with 0 indicating no linear correlation. Data were standardized prior to analysis to enhance comparability and mitigate unit discrepancies. Using R version 4.3.2 and the “GGally” package, we computed correlations and conducted significance tests at the 0.05 level to determine the statistical significance of these relationships. Through these steps, we systematically analyzed the relationship between the root system and aboveground biomass under nutrient heterogeneity.

2.3.4. Mixed-Effects Model

In this study, a linear mixed-effects model was employed to examine the relationship between fine root characteristics and aboveground biomass. The model defined aboveground biomass as the response variable (Y), incorporating fixed effects (β) comprising fine root length, surface area, volume, and biomass. Random effects (b) accounted for variations in nutrient gradients and planting distances, while model error (ε) represented unsystematic discrepancies. This approach aimed to delineate both fixed and random variations in the data, thereby enhancing the accuracy of the relationship analysis.
The model’s equation was formulated as follows:
Y ij = X ij T β + Z ij T b i + ϵ ij
Yij, the dependent variable, represents the total aboveground biomass for the j observation in the i planting condition, where i indexes planting conditions, and j indexes observations within a condition. The matrix Xij encapsulates all fixed-effect covariates (such as fine root length, surface area, volume, and biomass) for the given observation, with X ij T serving as its transpose to align with the dimensions of the fixed-effect parameter β. The parameter vector β quantifies the impact of these covariates on aboveground biomass. The matrix Zij and its transpose Z ij T represent the random-effect covariates, with bi as the random-effect parameter vector corresponding to the i planting condition. The error term εij accounts for the unexplained variation in the observation not captured by the fixed or random effects.
Estimation of fixed effects β: the β parameter was estimated through standard linear regression methods, with a focus on minimizing the sum of squared residuals, i.e., ( Y i j X i j T ) 2 ( Y i j X i j T β ) 2 . Processing of random effects bi: The estimation of bi utilized the variance component of the random-effects model, employing restricted maximum likelihood estimation (REML). This process considered the influence of planting conditions on the relationship between fine root characteristics and aboveground biomass. Model testing entailed the evaluation of R2 (coefficient of determination), MSE (mean square error), and RMSE (root mean square error) metrics. The model was constructed using the “MixedLM” class in the “statsmodels” library of Python 3.11, with “matplotlib” for visualization.
The creation of other graphical representations was performed using Origin 2021 software (version 2021, OriginLab, Northampton, MA, USA).

3. Result Analysis

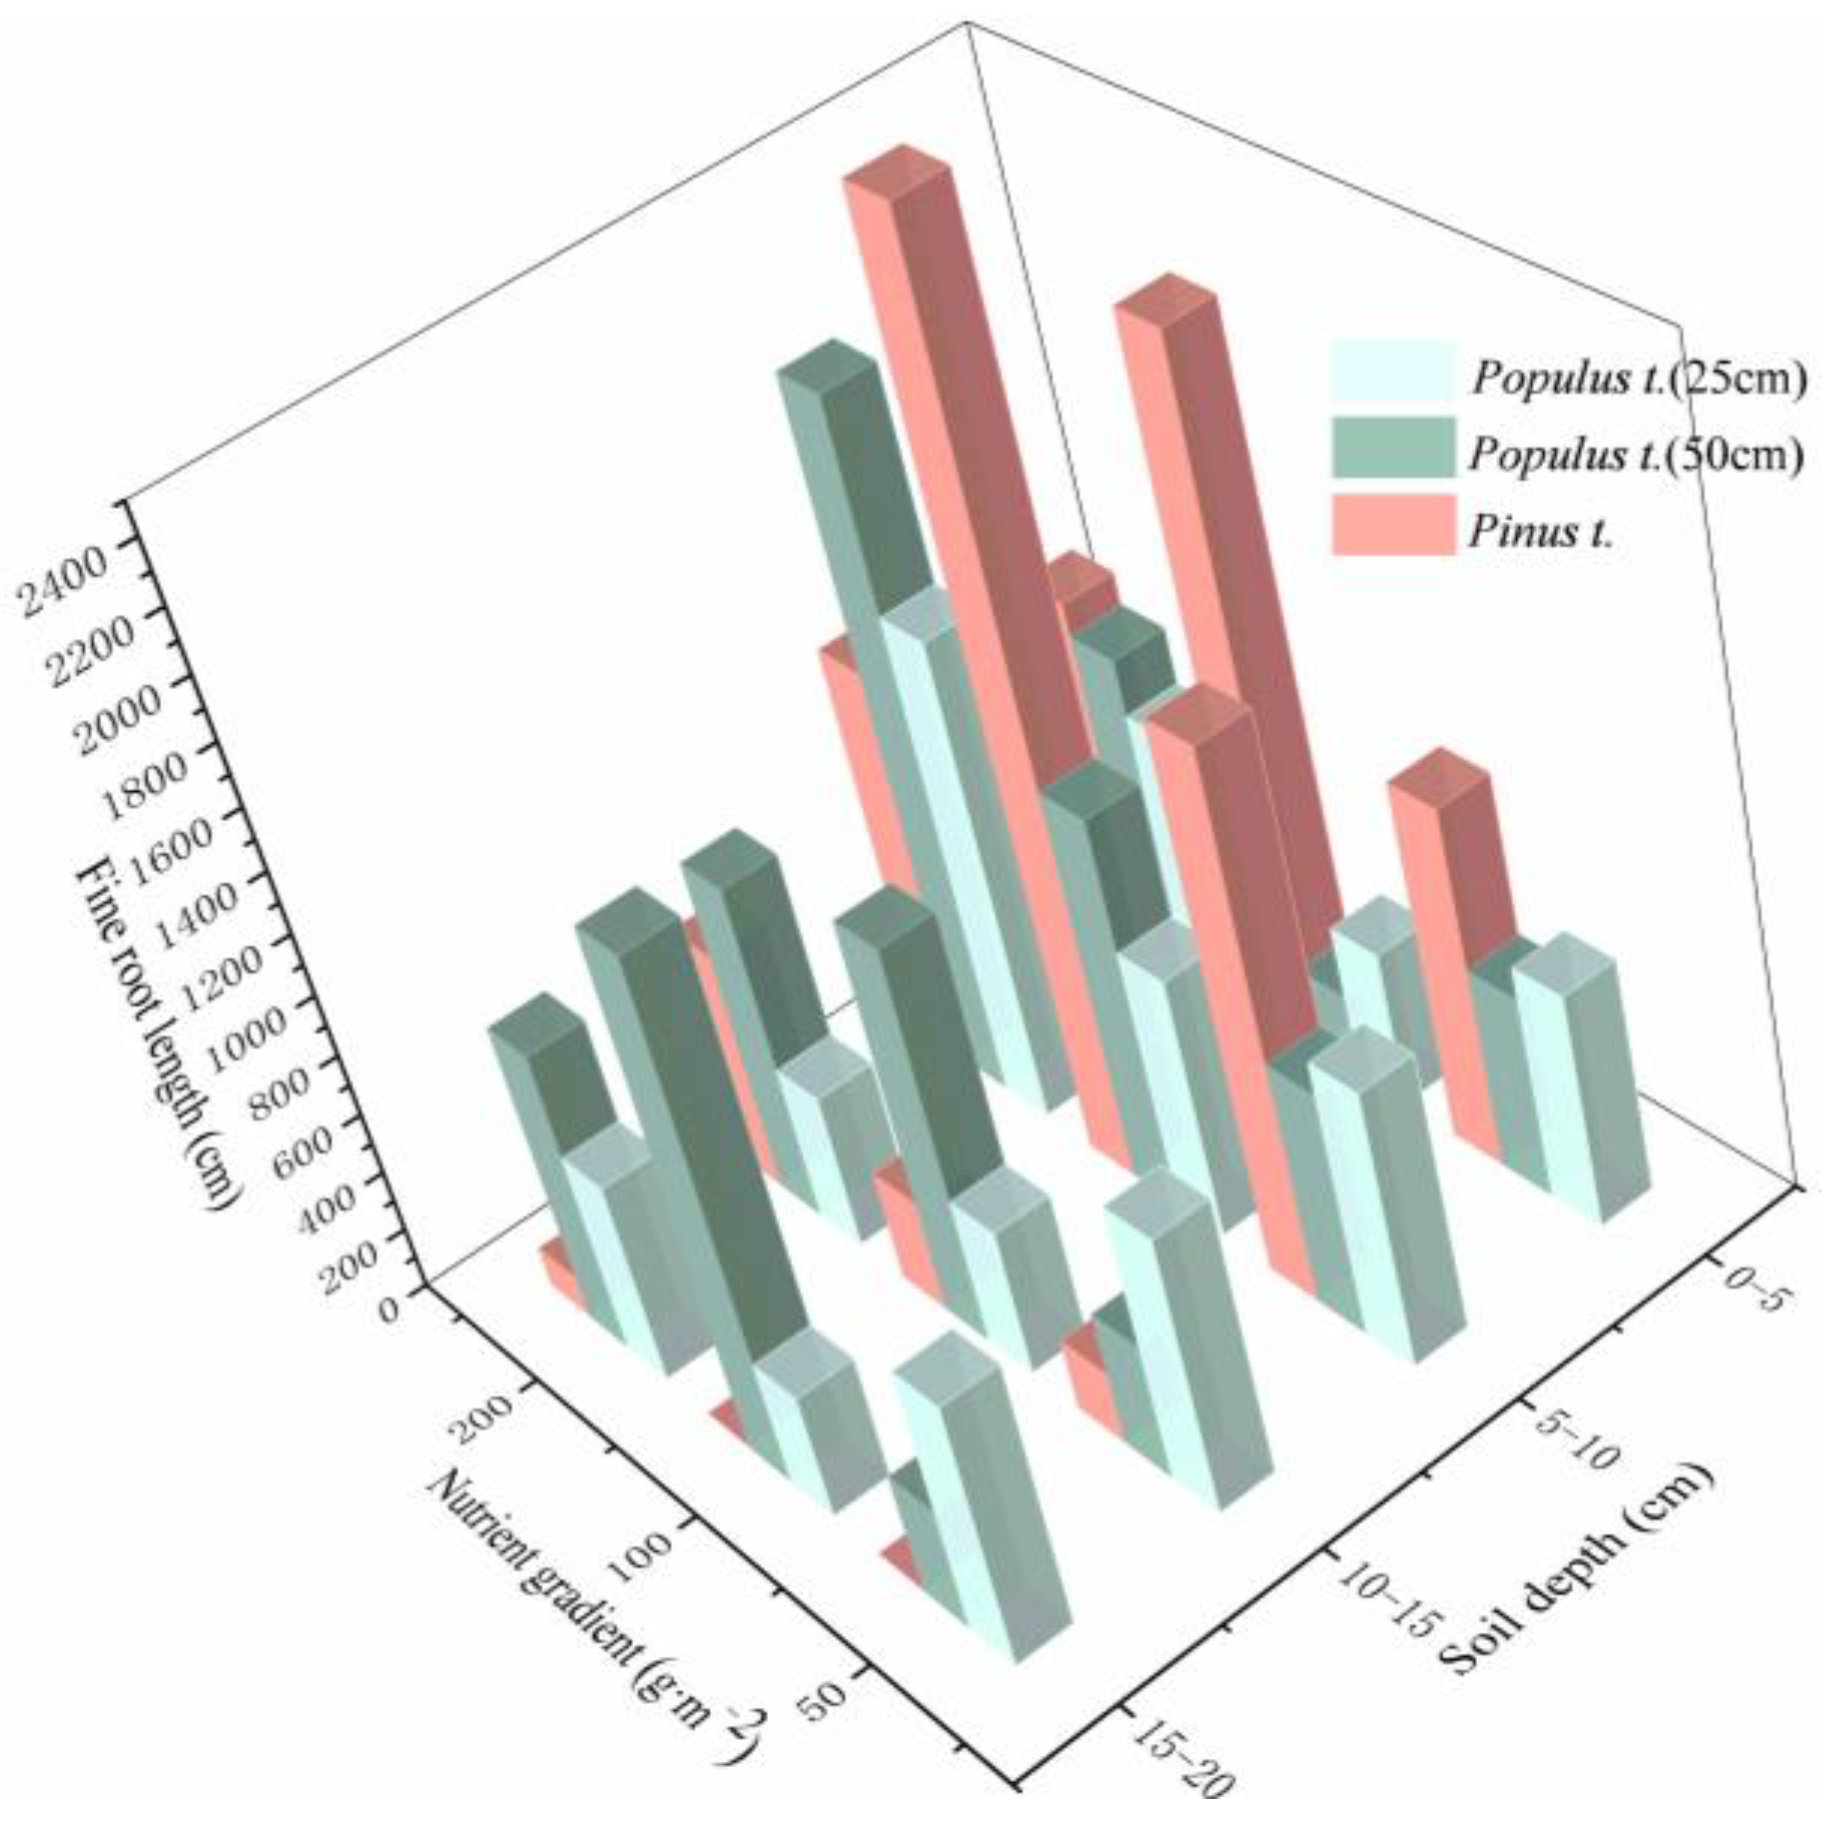
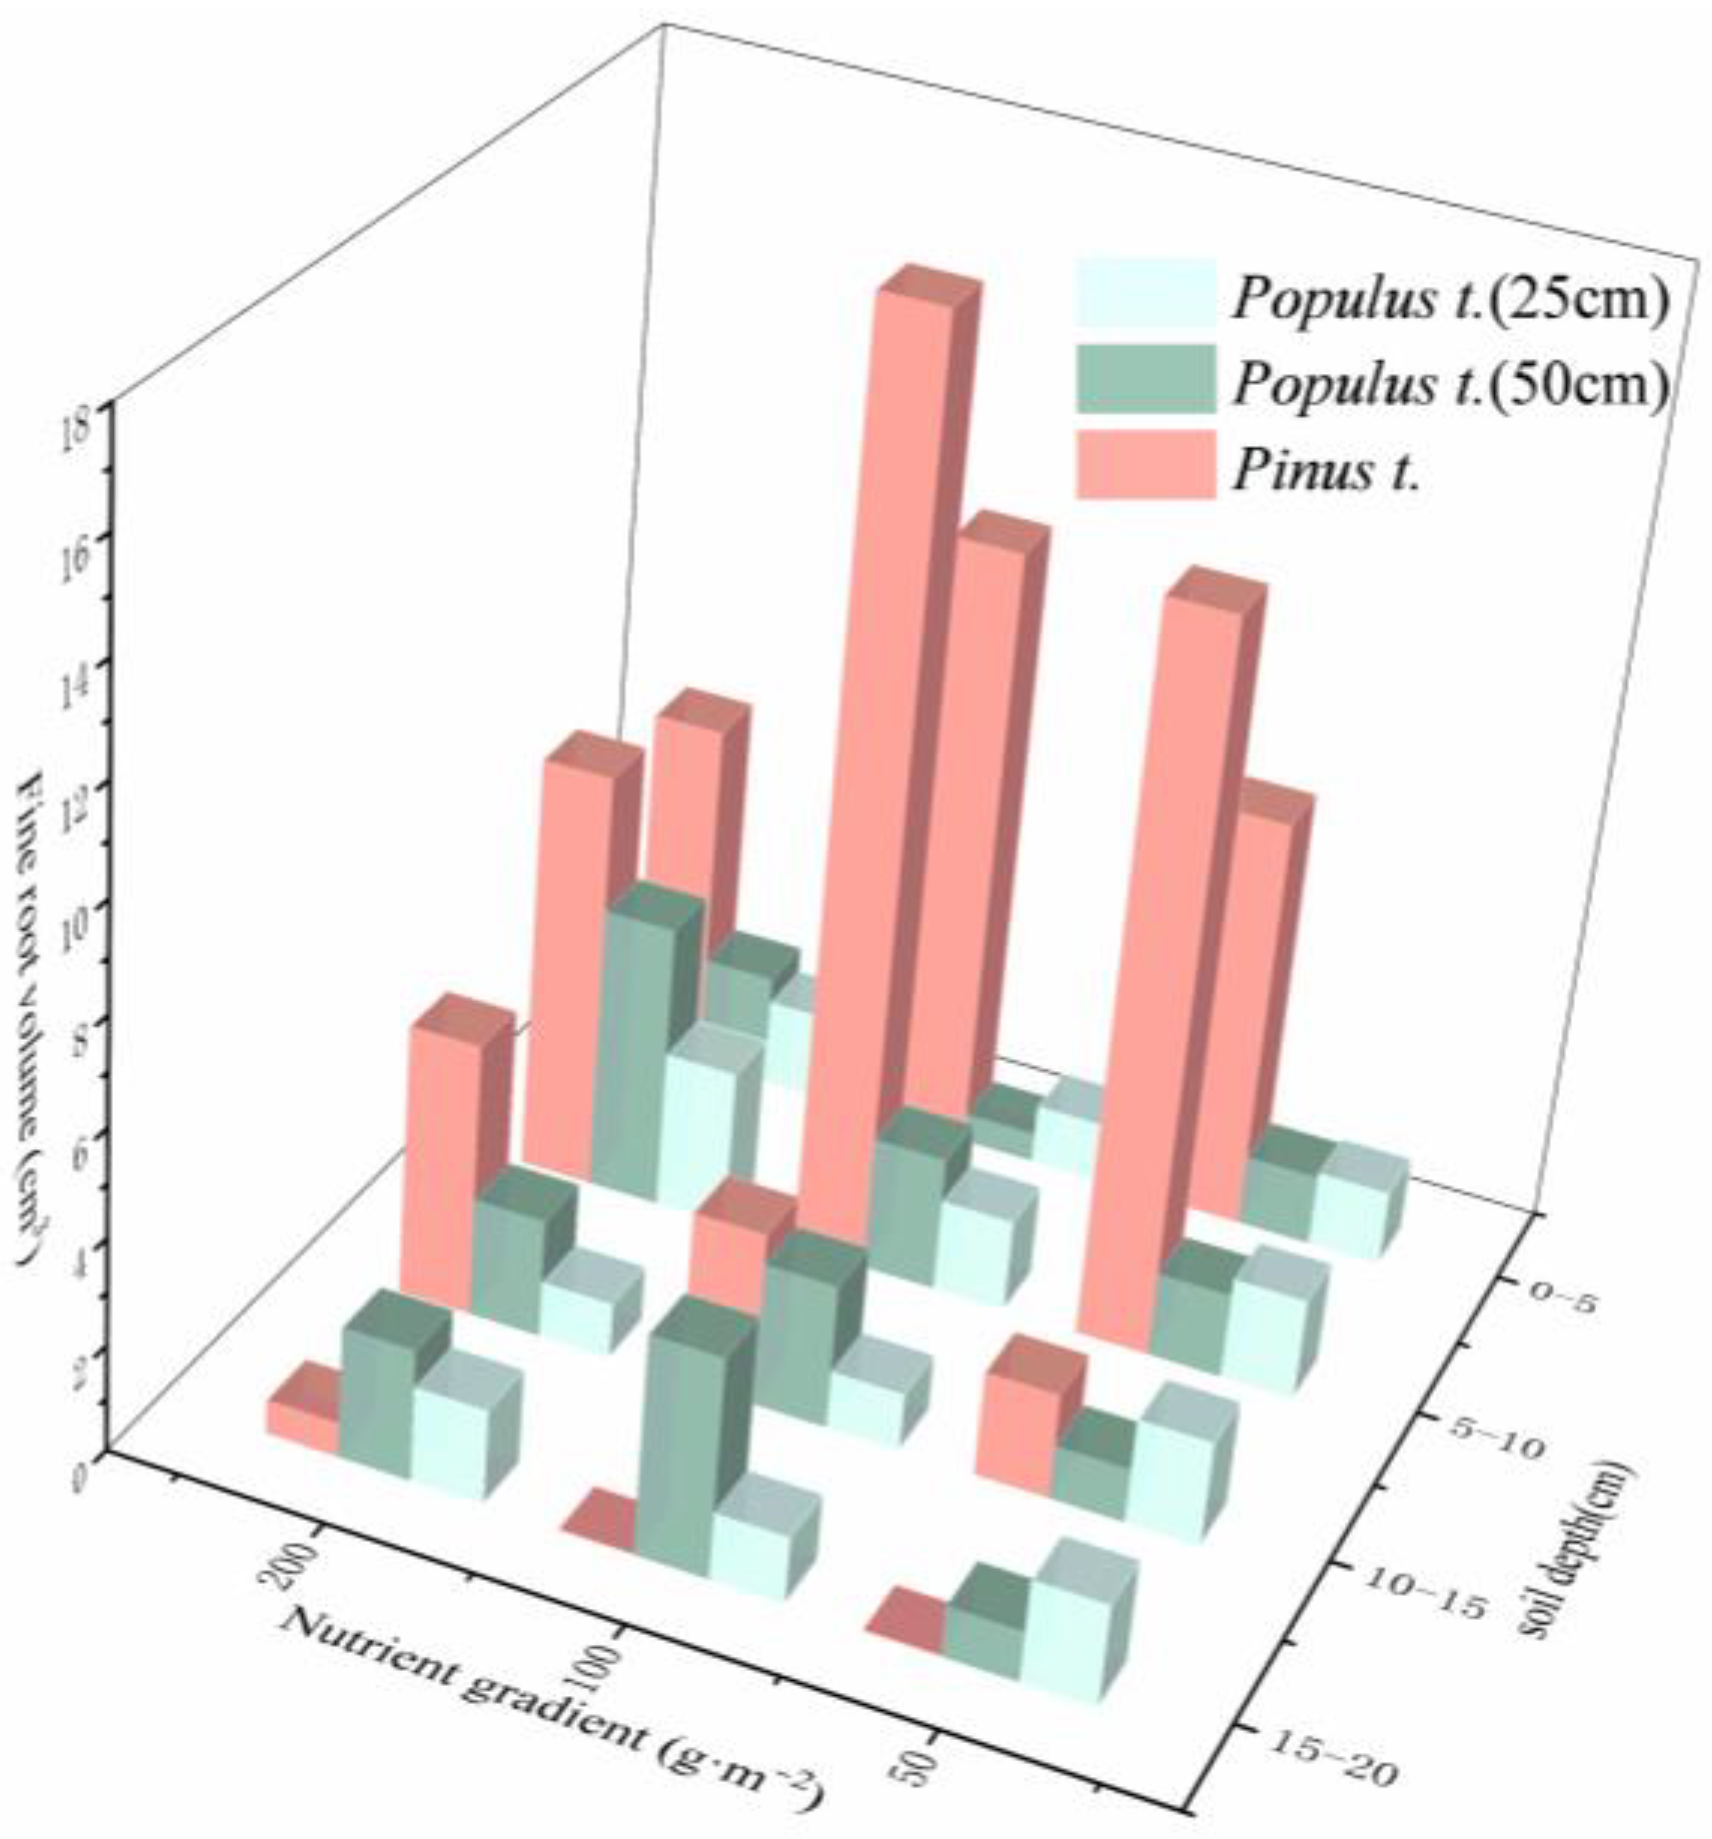
3.1. Changes in Root Traits under Heterogeneous Soil Nutrient Conditions

Figure 3 illustrates the variations in the fine root length of Populus t. and Pinus t. across diverse nutrient gradients and planting distances. As the nutrient gradient increased, Populus t.’s (25 cm) fine root length initially decreased before increasing, whereas Populus t.’s (50 cm) fine root length showed a consistent increasing trend. Conversely, the fine root length of Pinus t. exhibited an initial increase followed by a decrease. With increasing soil depth, both Populus t. (25 cm) and Populus t. (50 cm) displayed a trend of increasing and then decreasing root lengths, primarily within the 0–20 cm soil layer. The fine root length of Pinus t. also followed an increasing and then decreasing pattern, predominantly concentrated in the 0–10 cm soil layer, indicating noticeable surface aggregation. Under a constant nutrient gradient, Populus t.’s (50 cm) fine root length was shorter than that of Populus t. (25 cm) at 50 g·m−2 but longer at nutrient gradients of 100 g·m−2 and 200 g·m−2. In summary, at a nutrient gradient of 200 g·m−2 and a distance of 50 cm from Pinus t., Populus t.’s fine root length was the greatest, which favored the growth of Populus t. fine roots.
Changes in the fine root surface area of Populus t. and Pinus t. across different nutrient gradients and planting distances are depicted in Figure 4. The root surface areas of Populus t. and Pinus t. clearly responded to variations in nutrient gradients and planting distances. As the nutrient gradient increased, Populus t. (25 cm) and Populus t. (50 cm) displayed a trend of initially decreasing and then increasing at a soil depth of 0–20 cm. In contrast, Pinus t. exhibited an initial increase followed by a decrease at a soil depth of 0–10 cm and a gradual increase from 10 to 20 cm. With increasing soil depth, both Populus t. (25 cm) and Pinus t. tended to show a pattern of initially increasing followed by decreasing root surface area. At nutrient gradients of 50 g·m−2 and 200 g·m−2, Populus t.’s (50 cm) root surface area first increased and then decreased, while at a nutrient gradient of 100 g·m−2, there was a steady increase. At a nutrient gradient of 50 g·m−2, Populus t.’s (50 cm) fine root surface area was less than that of Populus t. (25 cm), yet larger at nutrient gradients of 100 g·m−2 and 200 g·m−2. Generally, combining a nutrient gradient of 200 g·m−2 with a planting distance of 50 cm proved most favorable for the growth of Populus t.’s fine root surface area. At nutrient gradients of 50 and 100 g·m−2, the fine root surface area of Pinus t. was greater, thereby enhancing its root growth.
Spatial changes in the fine root volume of Populus t. and Pinus t. across varying nutrient gradients and planting distances are depicted in Figure 5. With increasing nutrient concentration, the fine root volume of Populus t. (25 cm) initially increased and then decreased, while that of Populus t. (50 cm) consistently exhibited a gradual increase. For Pinus t., the fine root volume typically increased initially and then decreased. With an increase in soil depth, Populus t. (25 cm), Populus t. (50 cm), and Pinus t. all exhibited patterns of increasing followed by decreasing fine root volume. Under a constant nutrient gradient, the fine root volume of Populus t. (50 cm) was less than that of Populus t. (25 cm) at 50 g·m−2 but greater at 100 g·m−2 and 200 g·m−2. In general, a nutrient gradient of 200 g·m−2 combined with a planting distance of 50 cm proved to be the most favorable for the growth of Populus t.’s fine root volume. At nutrient gradients of 50 g·m−2 and 100 g·m−2, the fine root volume of Pinus t. was more substantial, thus enhancing the growth of its fine roots.
The vertical center position of fine roots played a crucial role in revealing the root concentration at various soil depths, significantly contributing to the study of tree nutrient absorption strategies. As depicted in Figure 6, the vertical center of Populus t.’s fine roots was deeper than that of Pinus t. The vertical center of Pinus t.’s fine roots experienced an initial decrease followed by an increase with rising nutrient gradients, mainly concentrating at 5–7.5 cm. This pattern suggested a marked surface aggregation characteristic of Pinus t.’s fine roots across various nutrient gradients. For Populus t. (25 cm), the vertical center of the fine roots underwent a gradual decrease, while for Populus t. (50 cm), there was an initial increase followed by a decrease. The vertical centers of Populus t. (25 cm) and Populus t.’s (50 cm) fine roots increased with a nutrient concentration of 50 g·m−2 and ranged between 8.5 and 10.5 cm at 200 g·m−2.

3.2. Biomass of Roots and Various Organs under Heterogeneous Soil Nutrient Conditions

Figure 7 illustrates that the ratios of fine root biomass to aboveground biomass, encompassing stem and leaf variables, at nutrient gradients and planting distances of 50 g·m−2 and 25 cm, 50 g·m−2 and 50 cm, and 200 g·m−2 and 50 cm were significantly greater than 1.0, indicative of an allometric growth pattern (p < 0.01). At nutrient gradients and planting distances of 100 g·m−2 and 25 cm and 200 g·m−2 and 25 cm, the ratio significantly exceeded 1.0 (p < 0.05), suggestive of a rapid allometric growth pattern. At the nutrient gradient and planting distance of 100 g·m−2 and 50 cm, the ratio did not significantly deviate from 1.0, indicative of isokinetic growth. The allometric growth index α (slope), representing fine root biomass, aboveground biomass, leaves, and stems, consistently surpassed 1.0 across various nutrient gradients and planting distances. The hierarchy of growth rates for roots and aboveground biomass followed 200 g·m−2 and 25 cm > 50 g·m−2 and 25 cm > 100 g·m−2 and 25 cm > 50 g·m−2 and 50 cm > 200 g·m−2 and 50 cm, suggesting a notable disparity between root and whole plant growth rates, most pronounced at 200 g·m−2 and 25 cm. A horizontal comparison indicated that at 200 g·m−2 and 25 cm, biomass distribution was biased towards the aboveground components. This observation suggested that the nutrient gradient and planting distance of 200 g·m−2 and 50 cm were conducive to root biomass accumulation.
Table 2 demonstrates that there was no significant difference in the allometric growth index between the root system and the biomass of each organ under various root competition treatments, suggesting a consistent allometric growth trajectory. The three types displayed common allometric indices of 1.212, 1.207, and 1.245. Further Wald testing indicated no significant intercept drift in the linear fitting for different treatments, suggesting that the aboveground biomass level remained unaltered at any given underground biomass level.

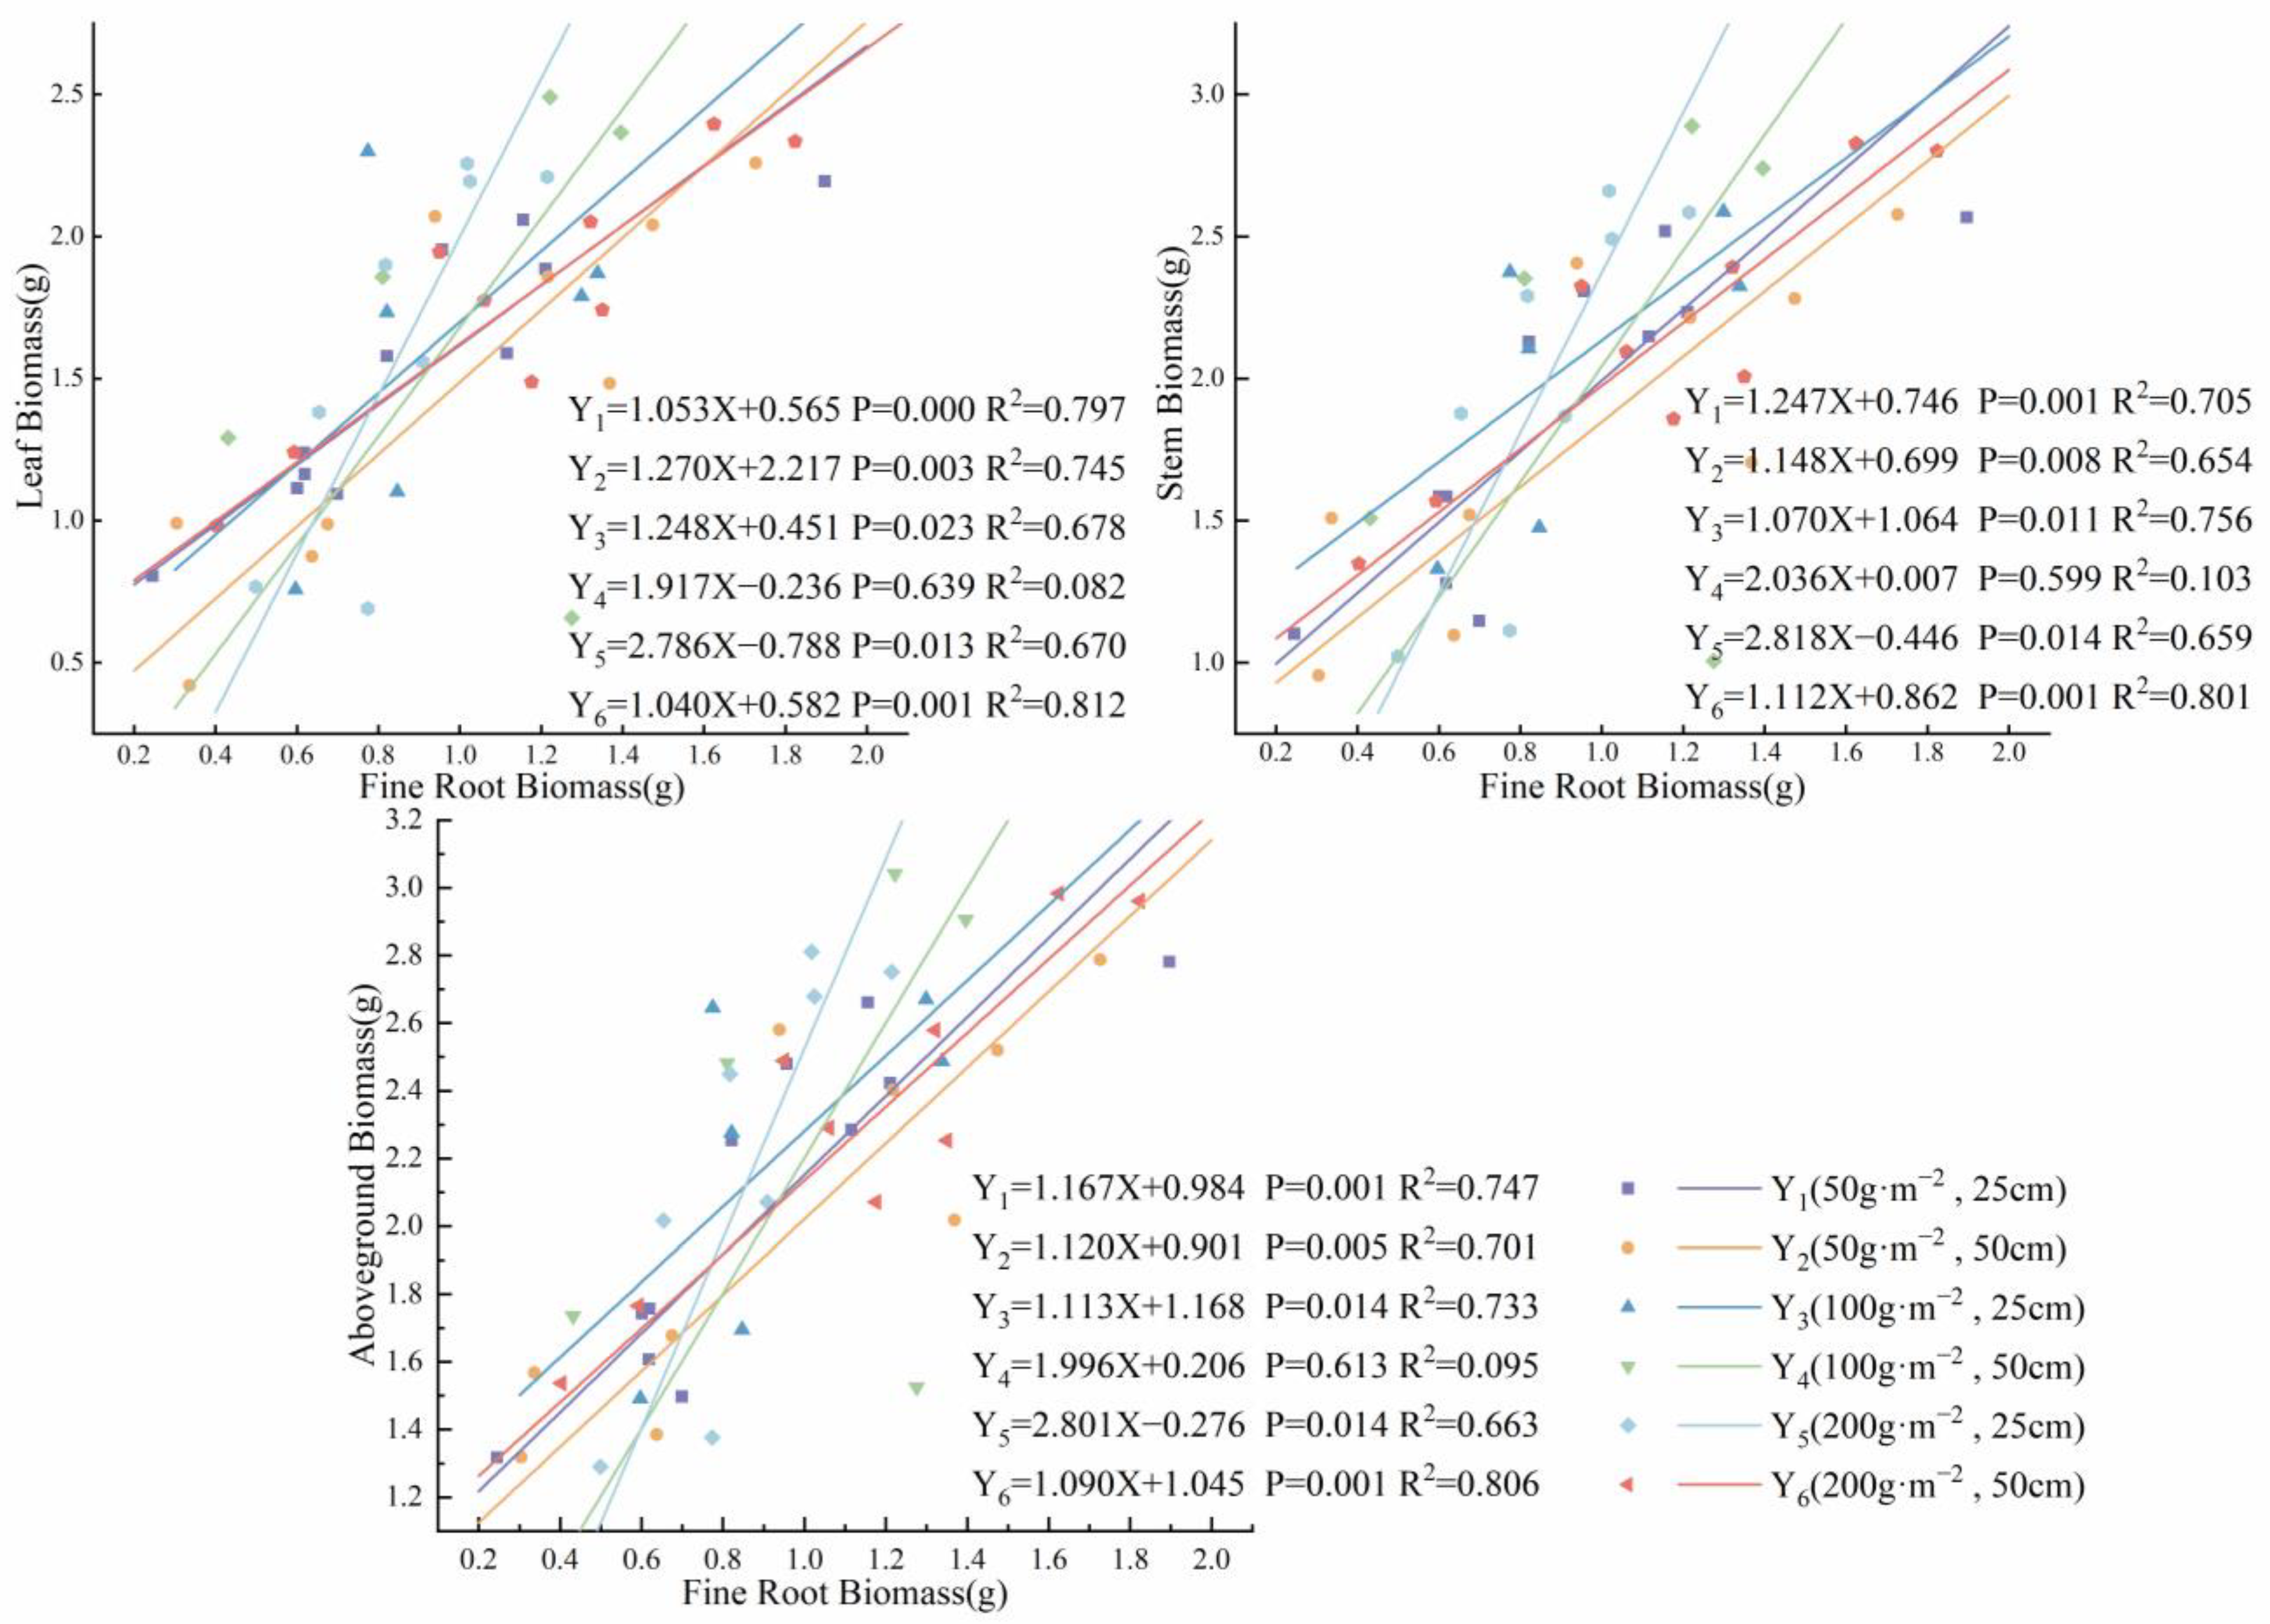
3.3. Relationship between Root Competition and Aboveground Growth under Heterogeneous Soil Nutrient Conditions

Utilizing the Pearson correlation test, we identified factors with strong correlations between aboveground and underground variables. Figure 8 demonstrates a highly significant positive correlation (p < 0.01) between aboveground biomass and various aspects of fine roots, including length, surface area, volume, and biomass. We developed a mixed-effects model, considering different nutrient gradients and planting distances as random effects and fine root metrics (length, surface area, volume, and biomass) as fixed effects. This model, using aboveground biomass as the response variable, quantitatively assessed the influence of subterranean factors on aboveground biomass. The model was subjected to multiple calibrations using the critical proportion method. Following calibration, the model demonstrated a robust fit, as indicated by its parameters (R2 = 0.722, RMSE = 0.356, MAE = 0.597), suggesting high adaptability to the observed variables and theoretical soundness. A well-fitting hypothesis, supported by empirical data, facilitated the development of a mixed-effects model, incorporating these indicators.
The model equation (the relationship between underground and aboveground growth) had an obvious linear relationship. Figure 9 indicates that the fine root volume and biomass were significantly positively correlated with aboveground biomass, emphasizing their crucial role in its accumulation. Specifically, fine root volume exerted a significant influence on aboveground biomass accumulation, with an effect coefficient of 132.11 (p = 0.044). The fixed effect of fine root biomass on aboveground biomass was pronounced, with a coefficient of 6.462 (p = 0.028). Fine root length, with a fixed-effect coefficient of 0.201, demonstrated a positive but non-significant influence on aboveground biomass (p = 0.243). Conversely, the fixed effect of fine root surface area on aboveground biomass was −4.053, signifying a non-significant negative impact (p = 0.099). The inclusion of soil nutrient gradient and planting distance as random effects, to accommodate their inherent variation (variance = 7238.59), implied that these are significant factors in aboveground biomass accumulation. In summary, the fine root volume and biomass constituted key determinants of aboveground biomass, while the influence of fine root length and surface area may be obscured by other factors (Figure 9).
Figure 10 indicates that most observed values closely align with the diagonal predicted value distribution, validating the model’s accuracy in correlating underground root system indicators with aboveground growth.
In mixed-effects model analysis, the examination of a scatterplot of residuals against predicted values provides critical diagnostic insights into the model fit quality. Ideally, residuals should display a random distribution, oscillating around the zero line (indicative of no residuals), and be devoid of discernible patterns. In this study, Figure 11 illustrates the distribution of residuals (disparities between actual and model-predicted values) in relation to predicted values. Most data points’ residuals were clustered near the zero line, suggesting that the model predictions were closely aligned with actual observations. However, there were notable deviations from the zero line, reflecting substantial discrepancies between the model predictions and actual observations under certain conditions. The distribution of residuals showed no clear non-random patterns, thereby supporting the model’s assumptions’ validity. Concurrently, the magnitudes of residuals did not appreciably escalate with increasing predicted values, suggesting the model’s assumption of variance constancy (homoskedasticity) to be plausible. Residual analysis underscored the model’s predictive efficacy in numerous instances, yet it also highlighted the necessity for further examination and the integration of additional variables or a more intricate model framework to enhance prediction precision, particularly for higher predicted values (Figure 11).

4. Discussion

Roots, especially fine roots, are vital for plants in the absorption of nutrients and water. These roots are both dynamic and metabolic, making significant contributions to plant and ecosystem functions such as soil water and nutrient absorption, physical fixation, resource storage, and nutrient production [39]. Fine root morphology, which includes root length, surface area, and volume, has a substantial influence on plant growth and ecological processes [40]. Root length indicates a root’s capacity for nutrient and water absorption, signifying its effectiveness in nutrient capture within soil spaces [41]. A longer root system is correlated with enhanced soil exploitation and resource acquisition. Additionally, the surface area and volume of roots are instrumental in water and nutrient absorption [42]. In nutrient-rich conditions, fine roots of Pinus t. and Populus t. demonstrated proliferation and morphological alterations. Analysis of the relationships between root characteristics and aboveground growth under various soil nutrient conditions uncovered complex spatial patterns in the fine roots of Populus t. and Pinus t., which were influenced by nutrient gradients and planting distances. The fine roots of Pinus t. are predominantly found within a 0–10 cm depth, reaching their peak in length, surface area, and volume at 5–10 cm, accounting for over 50% of their distribution and demonstrating surface aggregation. This finding was in alignment with the research of Guo et al. [43]. The shallow distribution of Pinus t. roots can be attributed to its characteristic as a shallow-rooted species, primarily absorbing nutrients and water from the soil surface. As the nutrient gradient increased, the fine root length, root surface area, and root volume of Pinus t. initially increased and then decreased. This trend is consistent with the findings of Yang Fan et al. [44]. In underground competition scenarios, elevated fertilization intensifies nutrient competition among tree species and seedlings, which hinders the growth of young target trees and modifies root morphology. The fine root length, root surface area, and root volume of Populus t. (25 cm) showed a pattern of initial decrease followed by an increase with nutrient concentrations ranging from 50 g·m−2 to 200 g·m−2. In contrast, Populus t. (50 cm) demonstrated a steady increase, in alignment with the research conducted by Robinson [45], Sun Yu-bo [46], and their colleagues. Enhanced soil nutrients and increased planting density may reduce root competition, potentially attributable to the superior adaptability and competitiveness of Populus t. compared to Pinus t., particularly in extreme conditions. The vertical center of fine roots for Populus t. (25 cm and 50 cm) resided below 8.5 cm, in contrast to 5–7.5 cm for Pinus t., corroborating the findings of Chen et al. [47]. Pinus t. predominantly inhabited shallow soil layers, whereas the broadleaf species Populus t. exhibited a deeper root distribution. This distinct stratification suggested differential nutrients and water absorption zones, resulting in diverse root distributions across soil layers in Pinus t. and Populus t.
The growth of underground roots and aboveground plant parts followed the allometric growth rule, displaying variability across different environmental conditions [48]. However, the patterns of root response to soil nutrient distribution and competitive environments significantly influence the growth of a plant’s aboveground parts. Allometric growth analysis (SMA) provided a more comprehensive representation of plant resource allocation strategies compared to biomass and biomass ratio data (root biomass/total biomass). The results demonstrated that the allometry index for fine root biomass, aboveground biomass, and stem and leaf variables reached its peak at a nutrient gradient of 200 g·m−2 and a planting distance of 25 cm. This indicated that plants dynamically adjusted their biomass allocation in response to specific nutrient and spatial conditions. Consistent with the findings of Zhang Libin et al. [49], the addition of nutrients and planting distance modified plant biomass allocation strategies. Fertilization significantly enhanced soil urease and alkaline phosphatase activities, as well as increased soil nitrogen content compared to unfertilized conditions [50]. Higher nutrient concentrations facilitated more efficient nutrient uptake by plants from the soil. This optimization allowed plants to allocate greater energy and resources to aboveground growth, such as leaves and stems, optimizing photosynthesis and reproductive activities, without excessive root proliferation. In response to elevated nutrient levels, plants activated feedback mechanisms that regulated root growth. Root systems, upon detecting high nutrient concentrations, suppressed their own growth to conserve energy while promoting the growth of aboveground parts crucial for photosynthesis. Moreover, increased planting density amplified competition among canopy organs for aboveground space, leading to the constrained growth of stems and leaves in Populus t. and Pinus t. As a result, underground root development was inhibited. Under these conditions, plants prioritized allocating more biomass to aboveground organs to alleviate canopy pressure, thereby impeding the growth and development of underground roots [51,52]. This was presumably attributed to the association of soil nutrients with essential plant components such as nucleic acids, phospholipids, and proteins, as well as their direct influence on photosynthesis. In conditions where nutrients and nitrogen are scarce, plants often accumulate sugars, leading to reduced photosynthesis. This phenomenon is due to sugars triggering metabolite feedback, which impacts genes involved in photosynthesis [53]. Consequently, increased soil nutrients may reduce sugar accumulation in leaves [54], enhance nitrogen allocation to photosynthesis [55], and promote biomass allocation to aboveground components [56].
The length, surface area, volume, and biomass of roots are critical morphological indicators for root growth and development. In this study, the influence of each morphological index on aboveground biomass was quantified using a mixed-effects model. The influence of fine root volume on aboveground growth was most significant. These results are in line with the findings of Kim et al. [57]. An increase in fine root volume reflected strategic resource allocation towards roots, which enhanced the plants’ ability to acquire soil resources, consequently increasing aboveground biomass. An increase in fine root volume signified not only an adjustment in plant resource allocation strategy but also a response to environmental pressures. This increased volume of fine roots facilitated more efficient soil exploration, thereby enhancing water and nutrient absorption. This enhanced resource acquisition efficiency directly impacted the growth and development of the plants’ aboveground components. In environments with limited resources or competition, an increased fine root volume, which improved access to soil resources, enabled plants to effectively support the biomass growth of their aboveground components, thus gaining a competitive advantage in biomass. Furthermore, a larger fine root volume, implying an increased surface area, provided more interfaces for microbial activity, potentially enhancing nutrient cycling and soil health, thereby indirectly supporting aboveground growth. Consequently, an increase in fine root volume constituted an adaptive response of plants to environmental changes and resource constraints, significantly influencing plant growth and ecosystem functions. Quantifying fine root biomass was essential for comprehending forest subsurface ecosystems and predicting changes in plant biomass allocation under heterogeneous soil nutrient conditions. Fine root biomass played a pivotal role in nutrient uptake and the accumulation of soil organic matter [58]. There was a close relationship between fine root biomass and aboveground biomass, consistent with Aerts et al. [59]. Plants with a higher proportion of root biomass exhibited significant advantages in underground competition. This advantage was attributable to factors such as enhanced root growth and soil space occupation by fine root biomass, critical aspects in underground competition [60]. Enhancing plant competitiveness in resource-limited environments necessitated increasing fine root biomass. Thin roots, due to their higher surface-area-to-volume ratio, facilitated more efficient soil exploration and enhanced water and nutrient absorption [61]. Enhanced resource access directly affected the growth and biomass accumulation in the plants’ aboveground parts. Especially in nutrient-deficient environments, plants gained a competitive advantage in subsurface resource competition by increasing fine root biomass, thereby enhancing access to limited resources. Additionally, fine root growth facilitated efficient soil space utilization, a crucial factor for inter-root competition and overall plant growth. Consequently, the increase in fine root biomass signified an adaptive adjustment in the plant resource allocation strategy and played a key role in adapting to environmental pressures, thus enhancing survival and reproductive success.

5. Conclusions

In this study, we investigated the characteristics of underground roots and aboveground biomass and explored their relationship through experiments involving nutrient heterogeneity. We established three fertilization gradients and two planting distance conditions. The main findings are summarized as follows: The soil nutrient concentration and planting distance significantly influenced root growth and biomass accumulation in Populus t. and Pinus t. Firstly, regarding aboveground biomass, utilizing the allometric growth model, we observed a positive allometric growth pattern when the nutrient concentration was 200 g·m−2 and planting distance was 25 cm. This configuration yielded the highest allometric growth index, indicating a resource allocation bias towards aboveground biomass accumulation. Secondly, concerning root characteristics, optimal performance in terms of root length, surface area, and volume was observed at a nutrient concentration of 200 g·m−2 and a planting distance of 50 cm for both Populus t. and Pinus t. This aligned with principles of stand growth and favored the development of fine roots. Fine roots of Populus tomentosa predominantly concentrated in deeper soil layers (below 8.5 cm), while those of Pinus t. were concentrated in shallower layers (5–7.5 cm), reflecting their respective competitive advantages. Finally, utilizing a mixed-effects model, we found that fine root length, surface area, volume, and biomass exhibited different fixed-effect coefficients on aboveground biomass. In particular, fine root volume (132.11) contributed most significantly to aboveground biomass, followed by fine root biomass (6.462), thereby promoting aboveground biomass accumulation. In conclusion, adjusting soil fertility upwards and reducing planting distance enhances root growth and biomass accumulation, whereas increasing soil fertility and planting distance effectively promotes aboveground biomass accumulation. Despite the limitations of our current dataset, these findings provide practical insights for future plantation transformations and forest management strategies.

Author Contributions

X.W.: Conceptualization, Data Curation, Methodology, Validation, Visualization, Writing—Original Draft, and Writing—Review and Editing. J.Y.: Conceptualization, Data Curation, Methodology, Validation, Visualization, Writing—Original Draft, and Writing—Review and Editing. Y.G.: Conceptualization, Data Curation, Formal Analysis, Methodology, Visualization, and Writing—Review and Editing. X.S.: Writing—Review and Editing, Methodology, Investigation, and Data Curation. X.L. (Xiao Lv): Data Curation and Writing—Review and Editing. X.L. (Xiaoman Liu): Data Curation and Writing—Review and Editing. Y.D.: Data Curation and Writing—Review and Editing. W.L.: Conceptualization, Funding Acquisition, and Writing—Review and Editing. All authors have read and agreed to the published version of the manuscript.

Funding

This research was supported by the National Key Research and Development Plan Project of China (2022YFF1300401), National Natural Science Foundation of China (32371970, 31971644), Shanxi Province Water Conservancy Science and Technology Research and Promotion Project (2024GM30), Scientific and Technological Innovation Project of Colleges and Universities in Shanxi Province (2021L105), and the Shanxi Provincial Outstanding Doctoral Program for Incentive Funds for Scientific Research Projects (SXYBKY2018032).

Data Availability Statement

Data will be made available on request.

Conflicts of Interest

The authors declare that they have no known competing financial interests or personal relationships that could have appeared to influence the work reported in this paper.

References

  1. Gustafsson, L.; Baker, S.C.; Bauhus, J.; Beese, W.J.; Brodie, A.; Kouki, J.; Lindenmayer, D.B.; Lõhmus, A.; Pastur, G.M.; Messier, C.; et al. Retention Forestry to Maintain Multifunctional Forests: A World Perspective. BioScience 2012, 62, 633–645. [Google Scholar] [CrossRef]
  2. Li, Y.; Mei, B.; Linhares-Juvenal, T. The economic contribution of the world’s forest sector. For. Policy Econ. 2019, 100, 236–253. [Google Scholar] [CrossRef]
  3. Lu, Y.C.; Zhang, S.G.; Lei, X.D.; Ning, J.K.; Wang, Y.X. Theoretical Basis and Implementation Techniques on Close-to-nature Transformation of Plantations. World For. Res. 2009, 22, 20–27. [Google Scholar]
  4. Shirong, L.; Yujing, Y.; Hui, W. Development strategy and management countermeasures of planted forests in China: Transforming from timber-centered single objective management towards multi-purpose management for enhancing quality and benefits of ecosystem services. Acta Ecol. Sin. 2018, 38, 1–10. [Google Scholar]
  5. Sun, D.J.; Wen, Y.; Luo, Y.H.; Li, X.Q.; Zhang, W.X.; Ming, A.G. Effect of close-to-nature management on species diversity in a Cunninghamia lanceolata plantation. For. Res. 2015, 28, 202–208. [Google Scholar]
  6. Ratcliffe, S.; Holzwarth, F.; Nadrowski, K.; Levick, S.; Wirth, C. Tree neighbourhood matters-Tree species composition drives diversity-productivity patterns in a near-natural beech forest. For. Ecol. Manag. 2015, 335, 225–234. [Google Scholar] [CrossRef]
  7. Wen, L.; Lei, P.F.; Xiang, W.H.; Yan, W.D.; Liu, S.G. Soil microbial biomass carbon and nitrogen in pure and mixed stands of Pinus massoniana and Cinnamomum camphora differing in stand age. For. Ecol. Manag. 2014, 328, 150–158. [Google Scholar] [CrossRef]
  8. Huang, X.M.; Liu, S.R.; Wang, H.; Hu, Z.D.; Li, Z.G.; You, Y.M. Changes of soil microbial biomass carbon and community composition through mixing nitrogen-fixing species with Eucalyptus urophylla in subtropical China. Soil Biol. Biochem. 2014, 73, 42–48. [Google Scholar] [CrossRef]
  9. Curtis, E.J.; Gorrod, E.J.; Ellis, M.V.; Chisholm, L.A. A spatio-temporal analysis of canopy dynamics and intra-stand competition in a riparian forest, south-eastern Australia. For. Ecol. Manag. 2019, 432, 189–199. [Google Scholar] [CrossRef]
  10. Yang, Y.-H.; Li, W.L.; Huang, P.; Zong, J.W.; Li, Z.Z. Effect of potassium fertilizer and plastic film mulching on growth and size inequality in Lilium davidii var. unicolor. Acta Prataculturae Sin. 2011, 20, 217–222. [Google Scholar]
  11. Deng, J.-M.; Wang, G.-X.; Morris, E.; Wei, X.-P.; Li, D.-X.; Chen, B.-M.; Zhao, C.-M.; Liu, J.; Wang, Y.U.N. Plant mass-density relationship along a moisture gradient in north-west China. J. Ecol. 2006, 94, 953–958. [Google Scholar] [CrossRef]
  12. Lin, Y.; Berger, U.; Grimm, V.; Ji, Q.U. Differences between symmetric and asymmetric facilitation matter: Exploring the interplay between modes of positive and negative plant interactions. J. Ecol. 2012, 100, 1482–1491. [Google Scholar] [CrossRef]
  13. Børja, I.; De Wit, H.A.; Steffenrem, A.; Majdi, H. Stand age and fine root biomass, distribution and morphology in a Norway spruce chronosequence in southeast Norway. Tree Physiol. 2008, 28, 773–784. [Google Scholar] [CrossRef] [PubMed]
  14. de Kroon, H.; Huber, H.; Stuefer, J.F.; van Groenendael, J.M. A modular concept of phenotypic plasticity in plants. New Phytol. 2005, 166, 73–82. [Google Scholar] [CrossRef] [PubMed]
  15. Wang, Q.; Cheng, Y. Response of fine roots to soil nutrient spatial heterogeneity. Chin. J. Appl. Ecol. 2004, 15, 1063–1068. [Google Scholar]
  16. Day, K.J.; Hutchings, M.J.; John, E.A. The Effects of Spatial Pattern of Nutrient Supply on Yield, Structure and Mortality in Plant Populations. J. Ecol. 2003, 91, 541–553. [Google Scholar] [CrossRef]
  17. Hodge, A. Root decisions. Plant Cell Environ. 2009, 32, 628–640. [Google Scholar] [CrossRef]
  18. Jiali, S.; Hongbo, L.; Aiping, Z. Effects of nutrient heterogeneity on shoot and root growth of Zea mays and intraspecific competition. J. China Agric. Univ. 2022, 27, 11. [Google Scholar]
  19. Grime, J.P. The Scale–Precision Trade-off in Spacial Resource Foraging by Plants: Restoring Perspective. Ann. Bot. 2007, 99, 1017–1021. [Google Scholar] [CrossRef]
  20. Cahill, J.F.; McNickle, G.G.; Haag, J.J.; Lamb, E.G.; Nyanumba, S.M.; St Clair, C.C. Plants integrate information about nutrients and neighbors. Science 2010, 328, 1657. [Google Scholar] [CrossRef]
  21. McNickle, G.G.; Cahill, J.F.; Karban, R. Plant Root Growth and the Marginal Value Theorem. Proc. Natl. Acad. Sci. USA 2009, 106, 4747–4751. [Google Scholar] [CrossRef]
  22. Tilman, D. Resource Competition and Community Structure. (MPB-17), Volume 17; Princeton University Press: Princeton, NJ, USA, 1982. [Google Scholar]
  23. Schenk, H.J. Root Competition: Beyond Resource Depletion. J. Ecol. 2006, 94, 725–739. [Google Scholar] [CrossRef]
  24. Blair, B. Effect of soil nutrient heterogeneity on the symmetry of belowground competition. Plant Ecol. 2001, 156, 199–203. [Google Scholar] [CrossRef]
  25. Von Wettberg, E.J.; Weiner, J. Larger Triticum aestivum plants do not preempt nutrient-rich patches in a glasshouse experiment. Plant Ecol. 2003, 169, 85–92. [Google Scholar] [CrossRef]
  26. Wei, S.P.; Liang, W.J.; Wei, X.; Bu, R.Y.; Yao, J.F. Natural regeneration of Larix principis-rupprechtii plantations with different densities and its influencing factors. Chin. J. Appl. Ecol. 2022, 33, 2687–2694. [Google Scholar] [CrossRef]
  27. Zhang, Y.; Li, Y.; Zhao, H.; Cheng, Y.; Wang, W.; Jiang, Z.; Cai, J. Relationship between Hydraulic Efficiency and Gas Exchange and Growth of Six Poplar Clones. Sci. Silvae Sin. 2022, 58, 118–126. [Google Scholar] [CrossRef]
  28. Zhao, X.M.; Sun, X.Y.; Kang, X.Y.; Wang, H.Y. Dynamics of soil organic carbon and total nitrogen contents in short-rotation triploid Populus tomentosa plantations. Acta Ecol. Sin. 2012, 32, 4714–4721. [Google Scholar] [CrossRef]
  29. Kang, X.Y. Thinking and practices for strategy on a new round genetic improvement of Populus tomentosa. J. Beijing For. Univ. 2016, 38, 1–8. [Google Scholar]
  30. Xiao, W.J.; Ghen, Y.X. Application of Grey Correlation Analysis to the Evaluation ofHDS Sediment in Different Phytoremediation Copper Sulfide. Jiangxi Sci. 2022, 40, 1108–1113. [Google Scholar]
  31. Wang, H.Y.; Liu, J.G.; Yuan, H.C.; Duan, W.B.; Zhu, S.W.; Mu, M.X. Effects of Three Extracts on Physiological Indexes of 2-year-old Pinus sylvestris var. mongolica Seedlings. For. Eng. 2024, 40, 44–54. [Google Scholar]
  32. Huang, F.X. Effects of Different Fertilization Methods on Seedling Growth of Pinus sylvestris. Agric. Technol. Equip. 2023, 12, 129–130+133. [Google Scholar]
  33. Gao, Y.H. Effects of Different Thinning Methods on the Growth of Pinus Sylvestris Plantation. Sci. Technol. Qinghai Agric. For. 2023, 4, 82–85. [Google Scholar]
  34. Zhang, H.; Ye, R.H.; Wang, J. Effects of Irrigation Intensity on Seedling Growth of Pinus sylvestris var. mongolica in Mu Us Sandy Land. Prot. For. Sci. Technol. 2024, 2, 1–3. [Google Scholar] [CrossRef]
  35. Song, S.H.; Zhu, B.B.; Jin, L.; Chang, J.C.; Hu, L.; Song, L.P.; Chang, Q.; Song, Y.F. Effects of Forest Gaps disturbance On Regeneration Pattern of Pinus sylvestris var. mongolica Plantations. J. Northeast. For. Univ. 2022, 50, 6–10. [Google Scholar]
  36. Feng, D.D.; Xue, Q.Q.; Qi, J.Y.; Wang, L.J.; Li, H.; Men, L.; Zhang, Z.W. Community Structure and Occurrence Regularity of Pyralidae in Artificial Seabuckthorn Plantation. J. Shanxi Agric. Sci. 2020, 48, 793–798. [Google Scholar]
  37. Falster, D. User’s Guide to SMATR: Standardised Major Axis Tests and Routines Version 2.0, Copyright 2006. 2006. Available online: https://www.bio.mq.edu.au/research/groups/comparative/SMATR/ (accessed on 15 November 2023).
  38. Warton, D.I.; Wright, I.J.; Falster, D.S.; Westoby, M. Bivariate line-fitting methods for allometry. Biol. Rev. 2006, 81, 259–291. [Google Scholar] [CrossRef]
  39. Ding, J.; Ding, J.; Kong, D.; Zhang, Z.; Cai, Q.; Xiao, J.; Liu, Q.; Yin, H. Climate and soil nutrients differentially drive multidimensional fine root traits in ectomycorrhizal-dominated alpine coniferous forests. J. Ecol. 2020, 108, 2544–2556. [Google Scholar] [CrossRef]
  40. McCormack, M.L.; Guo, D.; Iversen, C.M.; Chen, W.; Eissenstat, D.M.; Fernandez, C.W.; Li, L.; Ma, C.; Ma, Z.; Poorter, H.; et al. Building a better foundation: Improving root-trait measurements to understand and model plant and ecosystem processes. New Phytol. 2017, 215, 27–37. [Google Scholar] [CrossRef]
  41. Glass, N.T.; Yun, K.; Dias de Oliveira, E.A.; Zare, A.; Matamala, R.; Kim, S.H.; Gonzalez-Meler, M. Perennial grass root system specializes for multiple resource acquisitions with differential elongation and branching patterns. Front. Plant Sci. 2023, 14, 1146681. [Google Scholar] [CrossRef]
  42. Lobet, G.; Couvreur, V.; Meunier, F.; Javaux, M.; Draye, X. Plant Water Uptake in Drying Soils. Plant Physiol. 2014, 164, 1619–1627. [Google Scholar] [CrossRef]
  43. Guo, Y.; Yao, J.F.; Dong, Y.; Yan, J.; Yang, N.; Feng, Y.H.; Wei, X.; Liang, W.J. Root distribution characteristics of monoculture and mixture of Pinus tabuliformis and Robinia pseudoacacia plantation. Ying Yong Sheng Tai Xue Bao 2023, 34, 2881–2888. [Google Scholar] [CrossRef] [PubMed]
  44. Yang, F.; Nan, H.; Gao, S.; Wang, X.; Zhang, M.; Liu, W. Effects of Underground Competition on Leaf and Root Development of Pinus tabulaeformis and Picea asperata Seedlings. Guangxi For. Sci. 2022, 51, 307–316. [Google Scholar]
  45. Robinson, D. Root proliferation, nitrate inflow and their carbon costs during nitrogen capture by competing plants in patchy soil. In Interactions in the Root Environment: An Integrated Approach: Proceedings of the Millenium Conference on Rhizosphere Interactions, IACR-Rothamsted, United Kingdom 10–12 April 2001; Powlson, D.S., Bateman, G.L., Davies, K.G., Gaunt, J.L., Hirsch, P.R., Eds.; Springer: Dordrecht, The Netherlands, 2002; pp. 41–50. [Google Scholar]
  46. Sun, Y.-B.; Bi, H.-X.; Duan, H.-Q.; Peng, R.-D.; Wang, J.-J. Variation of fine root distribution and belowground competition in apple-soybean intercropping system. Chin. J. Ecol. 2019, 38, 459–466. [Google Scholar]
  47. Chen, J.-H. Study on the Distribution of Root Density of Robinia pseudoacacia L. and Pinus tabulaeformis Carr. Arid Zone Res. 2007, 24, 647–651. [Google Scholar]
  48. Weiner, J. Allocation, plasticity and allometry in plants. Perspect. Plant Ecol. Evol. Syst. 2004, 6, 207–215. [Google Scholar] [CrossRef]
  49. Zhang, L.; He, M.; Zhang, K. Response of biomass allocation and allometric growth of Caragana korshinskii to nitrogen and phosphorus addition. Acta Ecol. Sin. 2023, 43, 6627–6636. [Google Scholar]
  50. Li, D.D.; Jiang, Y.C.; Luo, C.L.; Feng, Y.; Wang, A.P.; Dong, Q. Effects of Nitrogen and Phosphorus Separate Application and Intercropping on Soil Nutrients and Enzyme Activities at Flowering Stage of Spring Wheat. J. Shanxi Agric. Sci. 2022, 50, 1414–1421. [Google Scholar]
  51. Wu, F.Z.; Wang, K.Y.; Yang, W.Q.; Lu, Y.J. Effects of Fargesia denudata density on its biomass distribution pattern. Chin. J. Appl. Ecol. 2005, 16, 991–995. [Google Scholar]
  52. Wang, M.L.; Jiang, Y.S.; Wei, X.; Cai, S.F.; Qi, X.X.; Li, F. Effects of planting density and fertilization on growth characters and artemisinin of Artemisia annu. L. J. Plant Nutr. Fertil. Sci. 2010, 16, 185–190. [Google Scholar] [CrossRef]
  53. Bläsing, O.E.; Gibon, Y.; Günther, M.; Höhne, M.; Morcuende, R.; Osuna, D.; Thimm, O.; Usadel, B.; Scheible, W.R.; Stitt, M. Sugars and circadian regulation make major contributions to the global regulation of diurnal gene expression in Arabidopsis. Plant Cell 2005, 17, 3257–3281. [Google Scholar] [CrossRef]
  54. Hermans, C.; Hammond, J.P.; White, P.J.; Verbruggen, N. How do plants respond to nutrient shortage by biomass allocation? Trends Plant Sci. 2006, 11, 610–617. [Google Scholar] [CrossRef]
  55. Li, C.-B.; Zheng, Z.; Peng, Y.; Nie, X.-Q.; Yang, L.-C.; Xiao, Y.; Zhou, G.-Y. Precipitation and nitrogen addition enhance biomass allocation to aboveground in an alpine steppe. Ecol. Evol. 2019, 9, 12193–12201. [Google Scholar] [CrossRef]
  56. Yan, Z.; Eziz, A.; Tian, D.; Li, X.; Hou, X.-H.; Peng, H.; Han, W.; Guo, Y.-L.; Fang, J. Biomass Allocation in Response to Nitrogen and Phosphorus Availability: Insight From Experimental Manipulations of Arabidopsis thaliana. Front. Plant Sci. 2019, 10, 598. [Google Scholar] [CrossRef]
  57. Kim, B.-M.; Horita, J.; Suzuki, J.-I.; Tachiki, Y. Resource allocation in tragedy of the commons game in plants for belowground competition. J. Theor. Biol. 2021, 529, 110858. [Google Scholar] [CrossRef]
  58. Jackson, R.B.; Canadell, J.G.; Ehleringer, J.R.; Mooney, H.A.; Sala, O.E.; Schulze, E.D. A global analysis of root distributions for terrestrial biomes. Oecologia 1996, 108, 389–411. [Google Scholar] [CrossRef]
  59. Aerts, R.; Boot, R.G.A.; van der Aart, P.J.M. The relation between above- and belowground biomass allocation patterns and competitive ability. Oecologia 1991, 87, 551–559. [Google Scholar] [CrossRef]
  60. Casper, B.B.; Jackson, R.B. Plant Competition Underground. Annu. Rev. Ecol. Evol. Syst. 1997, 28, 545–570. [Google Scholar] [CrossRef]
  61. Lu, B.; Qian, J.; Hu, J.; Wang, P.-H.; Jin, W.; Tang, S.; He, Y.; Zhang, C. The role of fine root morphology in nitrogen uptake by riparian plants. Plant Soil 2022, 472, 527–542. [Google Scholar] [CrossRef]
Figure 1. Location map of the study area. Note: the yellow area in the figure is the research area.
Forests 15 01151 g001
Figure 2. Schematic diagram of test design.
Forests 15 01151 g002
Figure 3. Spatial changes in root length of fine roots of Pinus t. and Populus t.
Forests 15 01151 g003
Figure 4. Spatial changes in surface area of fine roots of Pinus t. and Populus t.
Forests 15 01151 g004
Figure 5. Spatial changes in fine root volume of Pinus t. and Populus t.
Forests 15 01151 g005
Figure 6. Spatial changes in vertical center of fine roots of Pinus t. and Populus t.
Forests 15 01151 g006
Figure 7. Allometric growth relationship between underground fine roots and aboveground biomass of Populus t. under different nutrient gradients and planting distances.
Forests 15 01151 g007
Figure 8. Correlation diagram of Populus t. between underground roots and aboveground biomass. Note: RL, root length; RS, root surface area; RV, root volume; RB, root biomass; AB, aboveground biomass.
Forests 15 01151 g008
Figure 9. Fixed-effect coefficients of the mixed-effects model. Note: RL, root length; RS, root surface area; RV, root volume; RB, root biomass.
Forests 15 01151 g009
Figure 10. Prediction effects of a mixed-effects model for subsurface fine roots and aboveground growth under heterogeneous nutrient conditions.
Forests 15 01151 g010
Figure 11. Residual distribution of the mixed-effects model predicting the relationship between subsurface roots and aboveground growth under heterogeneous nutrient conditions.
Forests 15 01151 g011
Table 1. Initial soil nutrient values in experimental area.
Soil NutrientMeasured Value
Organic matter (g·kg−1)3.10
Available nitrogen (mg·kg−1)60.61
Total nitrogen (g·kg−1)0.41
Available phosphorus (mg·kg−1)7.76
Total phosphorus (g·kg−1)0.49
Table 2. Common slope between root system and biomass of each organ under different nutrient gradients and planting distances.
Regressiontp α
Fine root biomass–leaf biomass9.30.11.2
Fine root biomass–stem biomass8.40.11.2
Fine root biomass–aboveground biomass8.40.11.2
Note: t, t-value obtained from the t-test, which is used to determine whether there is a significant difference between the regression coefficient and zero; p, p-value, representing the probability that the observed results occurred by chance under the null hypothesis; α, slope of the regression line, indicating the rate of change in the dependent variable for each unit change in the independent variable.
Disclaimer/Publisher’s Note: The statements, opinions and data contained in all publications are solely those of the individual author(s) and contributor(s) and not of MDPI and/or the editor(s). MDPI and/or the editor(s) disclaim responsibility for any injury to people or property resulting from any ideas, methods, instructions or products referred to in the content.

