Article

Charring of and Chemical Changes in Historical Wood under Thermal Loading

by
Katarína Dúbravská
1,
Viera Kučerová
2,*,
Jaroslava Štefková
3 and
Ol’ga Mišíková
4
1
Department of Fire Protection, Faculty of Wood Sciences and Technology, Technical University in Zvolen, 960 01 Zvolen, Slovakia
2
Department of Chemistry and Chemical Technology, Faculty of Wood Sciences and Technology, Technical University in Zvolen, 960 01 Zvolen, Slovakia
3
Institute of Foreign Languages, Technical University in Zvolen, 960 01 Zvolen, Slovakia
4
Department of Wood Science, Faculty of Wood Sciences and Technology, Technical University in Zvolen, 960 01 Zvolen, Slovakia
*
Author to whom correspondence should be addressed.
Forests 2024, 15(7), 1189; https://doi.org/10.3390/f15071189
Submission received: 14 May 2024 / Revised: 1 July 2024 / Accepted: 2 July 2024 / Published: 9 July 2024

Abstract

:
Research in historical timber assessment is hindered by the limited availability of samples, yet understanding the fire resistance of historic wood is crucial for preservation efforts. There is an opinion that historic wood behaves similarly to contemporary wood in terms of fire resistance. The aim of this paper is to observe the rate of charring of historical pine wood during the experiment, the color changes in the sample that occurred due to thermal loading, and the changes in the chemical composition of pine wood. Test samples made from historic pine wood were loaded with a 50 kW∙m−2 radiation panel for 60 min. The charring process was faster at the beginning of the charred layer formation. The charring rate at the beginning of the test at a depth of 10 mm from the exposed side reached values from 1.28 mm∙min−1 to 3.16 mm∙min−1. At a depth of 30 mm from the exposed side, the individual charring rates approached a value of 1 mm∙min−1 (0.99 mm∙min−1 to 1.08 mm∙min−1). Observations during medium-scale testing revealed distinct layers forming on the exposed side: a charred layer, charring base, pyrolysis layer, and intact wood. The chemical composition of the wood changed under the influence of the thermal load. The relative contents of extractives and holocellulose decreased with the increasing temperature while the lignin content increased. The highest value of combustion heat was measured in the charred layer of the sample. Correlation analysis demonstrated a negative relationship between the combustion heat and holocellulose, while a positive correlation was found with the lignin content. Chemical changes were also monitored using the FTIR method. These findings provide valuable insights into the behavior of historic pine wood under thermal loading, which is essential for understanding and preserving historical structures.

1. Introduction

When dealing with fire safety in existing historical buildings, it is necessary to assess the historical wood’s reaction to fire to choose the best fire protection system. Therefore, an understanding of the fire behavior of historical timber is important. There is little guidance available for the assessment of historical structures. The availability of samples is limited when researching the behavior of historical timber exposed to fire. Samples for testing are usually obtained from timber structures that have already been removed from a historical building [1]. Cracks and holes are prevalent on their surface because, as reported by Yin et al., 2010 [2], historical buildings are exposed to ultraviolet radiation, rain, snow, and long periods of natural drying for hundreds of years. These are often removed from structures because they exhibit these particular deficiencies and need to be replaced. It is, therefore, quite complicated to find a historical wooden structure that does not show the abovementioned defects.
Wood consists of cellulose, hemicelluloses, lignin, and extractives. Hemicelluloses are the least stable during the thermal loading of wood. Hemicelluloses condense with lignin at low temperatures, and they degrade to shorter-chain molecules at high temperatures. Gaseous or liquid decomposition products are formed, increasing the mass loss of wood [3]. Thermal loading of wood below 250 °C can increase cellulose’s crystallinity due to the degradation of its amorphous part. Condensation, cross-linking, and degradation reactions can be observed in lignin molecules during thermal loading [4]. The original extractives are degraded or leave the wood by temperature. The most volatile compounds are released at the beginning of the treatment, while others are degraded [5].
Thermal loading of wood leads to changes in its structure [6] and chemical composition, and thus, various properties of wood (color change, durability, hygroscopicity, MOR—modulus of rupture, MOE—modulus of elasticity) change [7,8,9,10,11,12]. The color changes after the thermal degradation of wood were evaluated by Fonsea and Barreira [13], Friquin [5], Lipinkas and Mačiulaitis [14], and White and Dietenberg [15]. According to the color changes, the authors divided the following zones: unburned wood, pyrolysis zone base, pyrolysis zone, charring base, and char layer.
In fire protection and safety, the heat of combustion is also an important characteristic. The value of the heat of combustion depends on the material’s chemical composition [16]). The heat of combustion is the absolute value of the specific energy combustion, in joules, for the unit mass of a solid fuel burned in an oxygen atmosphere in a bomb calorimeter under specified conditions. The heat of combustion assumes that the water is entirely condensed. The content of wood components and their elemental composition play an important role in its calorific value [17]. Based on this value, the calorific value serves as a parameter to calculate the fire loading when determining the fire protection of buildings.
Combustion of wood consists of several processes. At temperatures above 100 °C, evaporation of chemically unbound water from wood occurs, followed by slow pyrolysis and the beginning of decomposition of hemicelluloses, cellulose, and lignin at temperatures around 160–180 °C [5]. Between 150° and 200 °C, gases consisting of 70% non-flammable carbon dioxide (CO2) and 30% flammable carbon monoxide (CO) are formed, and above 200 °C, more and more flammable gases are formed, and the proportion of CO2 decreases [18]. As soon as the gases ignite, the surface temperature increases significantly, and in a pyrolysis zone, which is about 5 mm thick, charring of the wood takes place. This process is described by Blass [18].
According to Eurocode 5 [19], in timber structures that are exposed to fire, the charring of their surface must be considered. The position of the charring line is assumed to be 300 °C isotherm for most softwood and hardwood [19]. However, the literature gives different values at which the charring process starts. These are 250 °C [20], 300 °C [21], and 360 °C [22]. The resulting char layer acts as a thermal insulator between the exposed surface and the unburned wood. This has been confirmed by Blass [18], Harper [23], Su et al. [24], Friquin [5], White and Dietenberg [15], and Pinto et al. [25]. They reported that as the thickness of the char layer increases, its thermal insulation properties improve. At the same time, the charring rate of the remaining wood decreases. The char layer acts as a natural barrier against decomposition further inside the woodmass. However, the protective effect may be compromised because the cracks and fissures formed allow heat and oxygen to partially reach the interior of the cross-section [26,27].
The aim of this work was to investigate the behavior of historical pine wood, focusing on the charring rate over time, color changes due to thermal loading, alterations in chemical composition, and heat of combustion.

2. Material and Methods

This article focuses on assessing the behavior of wood elements in historical buildings. It concerns buildings built more than a hundred years ago. Such buildings do not meet fire safety requirements (no fire safety regulations existed at the time of their construction). At the same time, the fire risk increases due to the changes on the surface of wooden constructions caused by weathering and/or micro-organism damages, which lead to faster fire development in the initial stage.
As there was no information on the wood species (the sample was taken from a 150-year-old building), firstly, microscopic observation of the historical wood sample was carried out to identify the wood species of the sample. Then, the char layer formation process was investigated by a medium-scale test. In general, it is assumed that the charring of historical wood is faster than that of current wood. After the medium-scale test, when the sample was exposed to a radiant heat source, the chemical analysis of the sample was conducted.

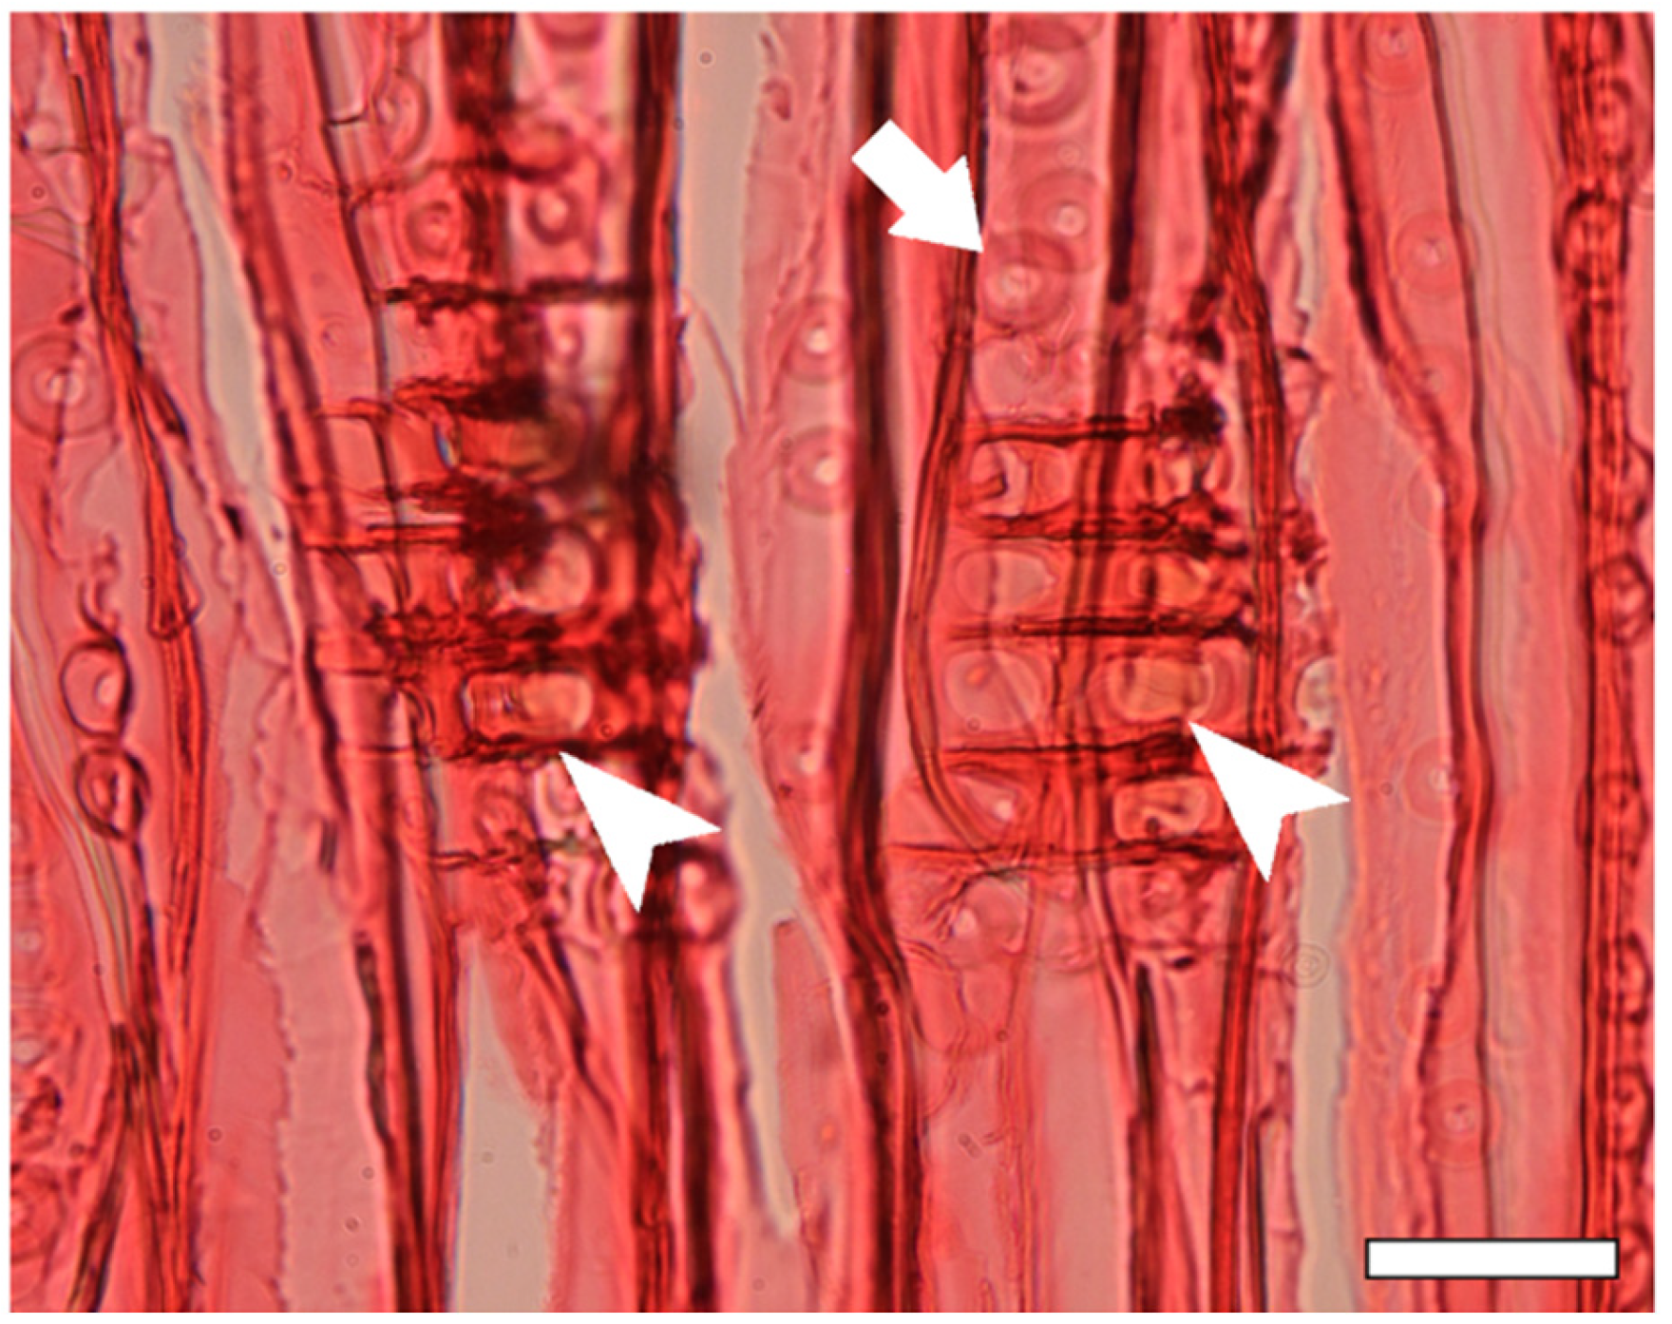
2.1. Microscopic Observation of the Historical Wood Sample

Microscopic observations needed to be carried out to determine the wood species of the samples. One small wood block with the dimensions of approximately 7 × 4 × 3 mm was carefully cut out of the sample. It was observed, and the species was identified by a radial microsection. Coniferous species are identified by indentures and cross-field pitting on ray parenchyma, which were observed in the radial microsection.
The small wood block was embedded in epoxy resin and left to cure for two weeks. Approximately 15 μm thick microsections were cut from the wood–resin blocks on a sledge microtome (Reichert, Wien, Austria). The microsections were stained with Safranin stain. Safranin O, Astra blue, Fast Green FCF, and aniline blue are among the most important stains for wood anatomists. These widely utilized stains also call for minimum reagents and techniques. In many situations, Safranin O may be the only stain required to enhance contrast prior to the image acquisition and measurement [28] of various anatomical features [29,30,31,32]. After staining, the microsections were mounted in Euparal (BioQuip Products Inc., Rancho Dominguez, CA, USA).

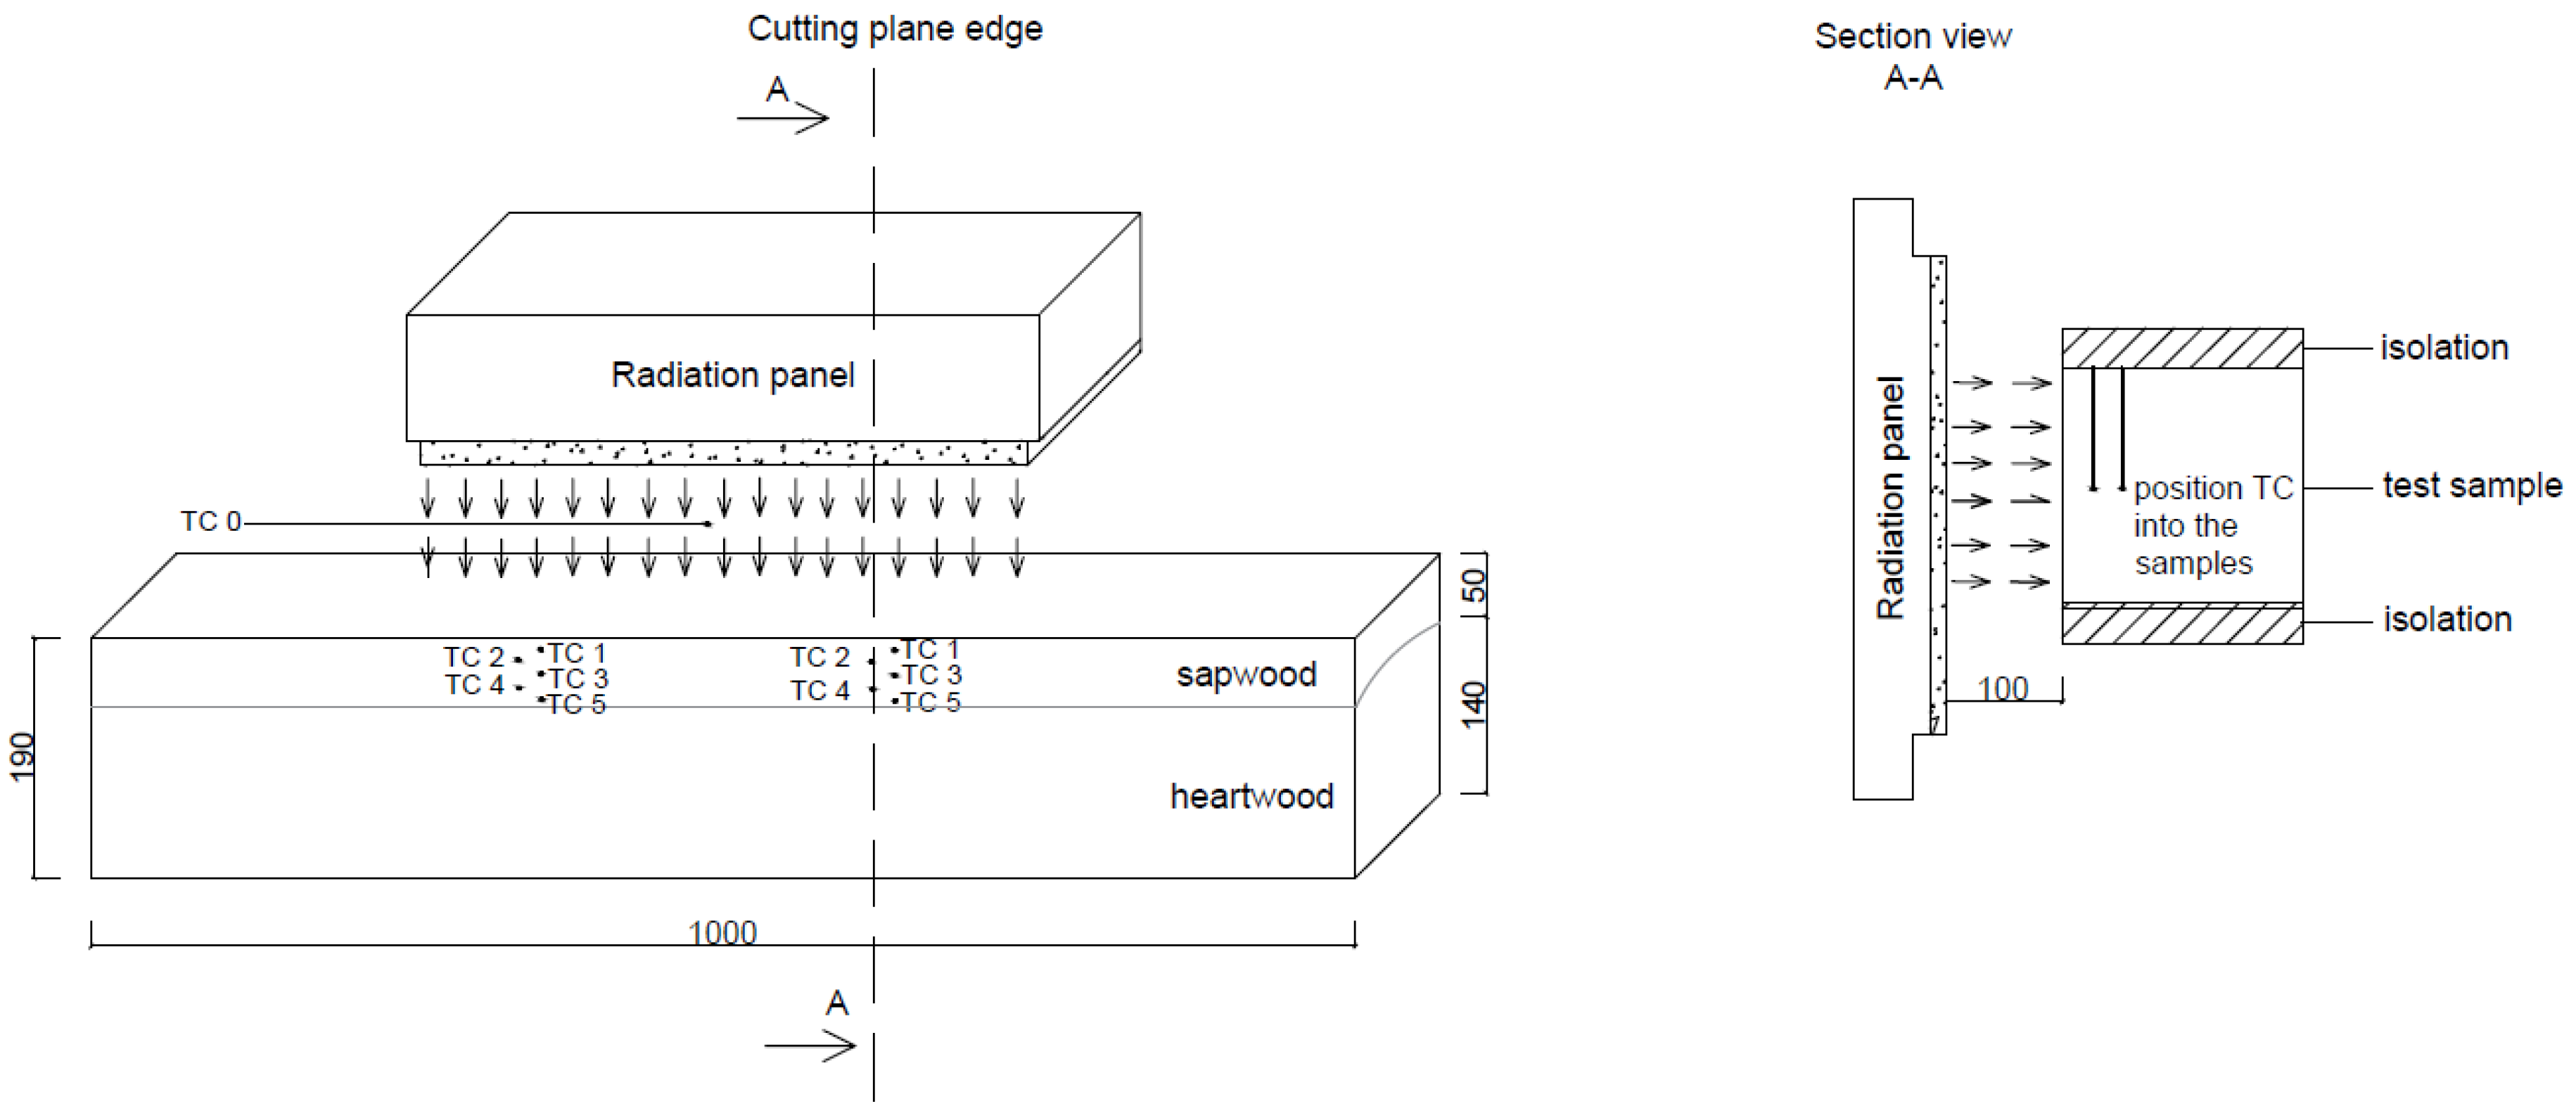
2.2. Medium-Scale Test for Assessing the Depth of Charring

A medium-scale test to assess the formation of a char layer is a non-standardized test adapted to the laboratory conditions. It stems from the theory of Eurocode 5 [19]. According to Eurocode 5 [19], the position of the charring line for most softwoods and hardwoods was taken as the position of the 300 °C isotherm.
From the removed pieces of construction, four blocks with dimensions 190 × 190 × 1000 mm were made and used to perform the medium-scale tests. The density of the historical wood was 456 kg∙m−3, ±5%, and the moisture content of the test samples was 6.4–7.1%. In every sample, two rows of thermocouples were placed. The results of eight measurements were obtained via a medium-scale test.
These were samples with heartwood and sapwood parts. The specific wood species was determined by microscopic observation. The edge between the sapwood and heartwood was clearly seen by visual assessment. Test samples were separated into two groups according to the fraction of heart and sap. Two samples (4 measurements) had a sapwood depth of 20 mm and a heartwood depth of 170 mm. These were named sample 20S/170H (Figure 1). Two samples (4 measurements) had a sapwood depth of 50 mm and a heartwood depth of 140 mm. These were named sample 50S/140H. The results show the average values for sample 20S/170H (average of 4 measurements of sample 20S/170H) and sample 50S/140H (average of 4 measurements of sample 50S/140H).
The surface of the historical sample (exposed side) was carefully scrabbed off other building materials. Despite the gentle scrabbing off the mortar, the surface damages due to weather impacts and micro-organisms were visible.
The test samples were transferred to the laboratory, where they were conditioned to meet the medium-scale test conditions.
The test samples were placed in the test furnace on a non-combustible tray, and the unexposed sides were insulated with mineral insulation (Figure 1—cross-section view). Temperature development was recorded during the medium-scale test using 5 Ni-Cr Ni thermocouples (TC). These were temperature sensors measuring from −40 °C to 1000 °C within a diameter of 3 mm. The thermocouple locations were as follows: TC1 recorded temperature at the depth of 10 mm, TC2 at 20 mm, TC3 at 30 mm, TC4 at 40 mm, and TC5 at 50 mm from the surface of the exposed side (Figure 1).
The thermocouples were connected to AHLBORN ALMEMO 2290-8710 V7 datalogger (Ahlborn Mess- und Regelungstechnik GmbH, Holzkirchen, Germany). A thermal load test was carried out using a radiation panel. It is a ceramic panel that is heated by propane–butane, with a constant flow rate and a 480 × 280 mm radiation area. The distance between the radiation panel and the test sample was 100 mm. This distance corresponds to a radiation intensity of 50 kW∙m−2. The thermal loading of the sample was monitored by a TC0 thermocouple placed between the control panel and the sample (50 mm from the radiation source).
The measurement was performed in a closed room with a temperature of 20 ± 3 °C. Each test sample lasted 60 min, and the temperature recording interval was 10 s.
In this research, the principle of assessing the formation of a charred layer consists of the temperature development in specific places. The temperature of charring formation is characterized by a particular temperature. The charring temperature is given in Eurocode [19] and it is defined as the position of the 300 °C isotherm, which is widely accepted as a rounded value.
Four test samples (two series of measurements were recorded in each sample) were subjected to the medium-scale test.

2.3. Color Changes

Color changes occurring after the thermal loading of historical pine wood were observed visually. The sample was divided into individual zones according to Le and Tsai [33], as shown in Figure 2.
After the medium-scale test and subsequent cooling of the test sample, the sample was divided into two parts. The cut was made perpendicular to the direction of the fibers, approximately 500 mm in length.
The thermal degradation process of wood was characterized by pyrolysis processes, resulting in the formation of a char layer accompanied by a change in color [34]. Based on the color and texture, the char layer was easily identifiable.

2.4. Chemical Analyses

Samples of heartwood and sapwood were taken for chemical analyses after thermal loading of historical wood. The samples were divided into four zones according to the temperature development. The temperature in each sample’s zone was linked to the temperature recorded during 60 min. Each sample of sapwood and heartwood was disintegrated into sawdust and sieved to a fraction of 0.5–1 mm. The fractions of that sawdust of samples were used for the chemical analyses.

2.4.1. Determination of Extractives

After thermal loading, wood sawdust was extracted in the Soxhlet apparatus with a mixture of ethanol and toluene according to the American Society for Testing and Materials (ASTM) International standard procedure D 1107-96 [35]. Determination of extractives was performed on three replicates per each sample.

2.4.2. Determination of Holocellulose and Lignin

Holocellulose content was determined using the method by Wise et al. [36]. Lignin content was determined according to the ASTM International standard procedure D1106-96 [37]. Determination of holocellulose and lignin was performed on three replicates per each sample.

2.4.3. FTIR Analysis of Wood and Holocellulose

Fourier-transform infrared (FT-IR) spectra of wood sawdust were recorded on a Nicolet iS10 FT-IR spectrometer equipped with a Smart iTR attenuated total reflectance sampling accessory (Thermo Fisher Scientific, Madison WI, USA). The spectra were acquired by accumulating 64 scans at a resolution of 4 cm−1 in an absorbance mode at wavenumbers from 4000 to 650 cm−1. Spectral peaks were measured using OMNIC 8.0 software (Thermo Fisher Scientific, Madison WI, USA). The crystallinity of cellulose indices was calculated for the total crystallinity index (TCI, A1370/A2900, [38]) and the lateral order index (LOI, A1430/A898, [38]) after FTIR of wood sawdust. All samples were dried in a drying kiln and processed into capsules before measurements. Measurements were performed on four replicates per each sample.

2.5. Determination of Heat of Combustion

The Calorimeter C 200 (IKA®-WERKE GmbH & Co. KG, Staufen, Germany) was used to measure the value of the heat of combustion (QHC). The evaluation was performed using Cal Win software 2.12.000 (IKA®-Werke GmbH & Co. KG, Staufen, Germany). The samples were analyzed according to the standards STN ISO 1928:2003-07 [39]. Samples were dried to absolute dry matter in a laboratory oven. The weight of the sample before combustion was approximately 0.5 g, and it was weighed on the analytical balance with an accuracy of 0.0001 g. In the calorimeter, samples were incinerated entirely in a pure oxygen environment at 30 Bar. Benzoic acid (IKA®-Werke GmbH & Co. KG, Staufen, Germany) was used as a thermochemical standard during the experiment.
The calorific value (QCV) was calculated based on the formula (STN ISO 1928:2003 [39]):
QCV = [QHC − 206.0 × w(H)] × (1 − 0.01 × w) − 23.05 × w
where:
  • QCV—calorific value upon constant volume and water content w (kJ∙kg−1);
  • QHC—the heat of combustion upon constant volume and waterless state (kJ∙kg−1);
  • w(H)—hydrogen percentage content (6.01% for wood);
  • w—the relative moisture content (%).
Average values and standard deviation were calculated for three replicates.

3. Results and Discussion

The measurements and analyses performed are in chronological order. Due to the removal of historical wood from the building, we did not have information about the type of wood. The type of wood was determined through microscopic observation of historical wood samples. Subsequently, the historical wood was subjected to a thermal load through a radiant source for 60 min. During the medium-scale test, a charred layer and a pyrolysis layer were formed on the historical wood, which were subjected to chemical analysis.

3.1. Microscopic Observation of Historical Wood Samples

Coniferous wood species are identified by their cross-fields, which are observed on radial microsections. It is, therefore, necessary to cut the radial microsection to examine the cross-field. Figure 3 shows earlywood tracheids with bordered pits and the cross-field. In the cross-field, simple pits of the window type are visible. The window-type thinning indicates that the examined wood species is pine (Figure 3). The arrowheads in Figure 3 denote the window-type cross-fields and the arrow shows bordered pits.

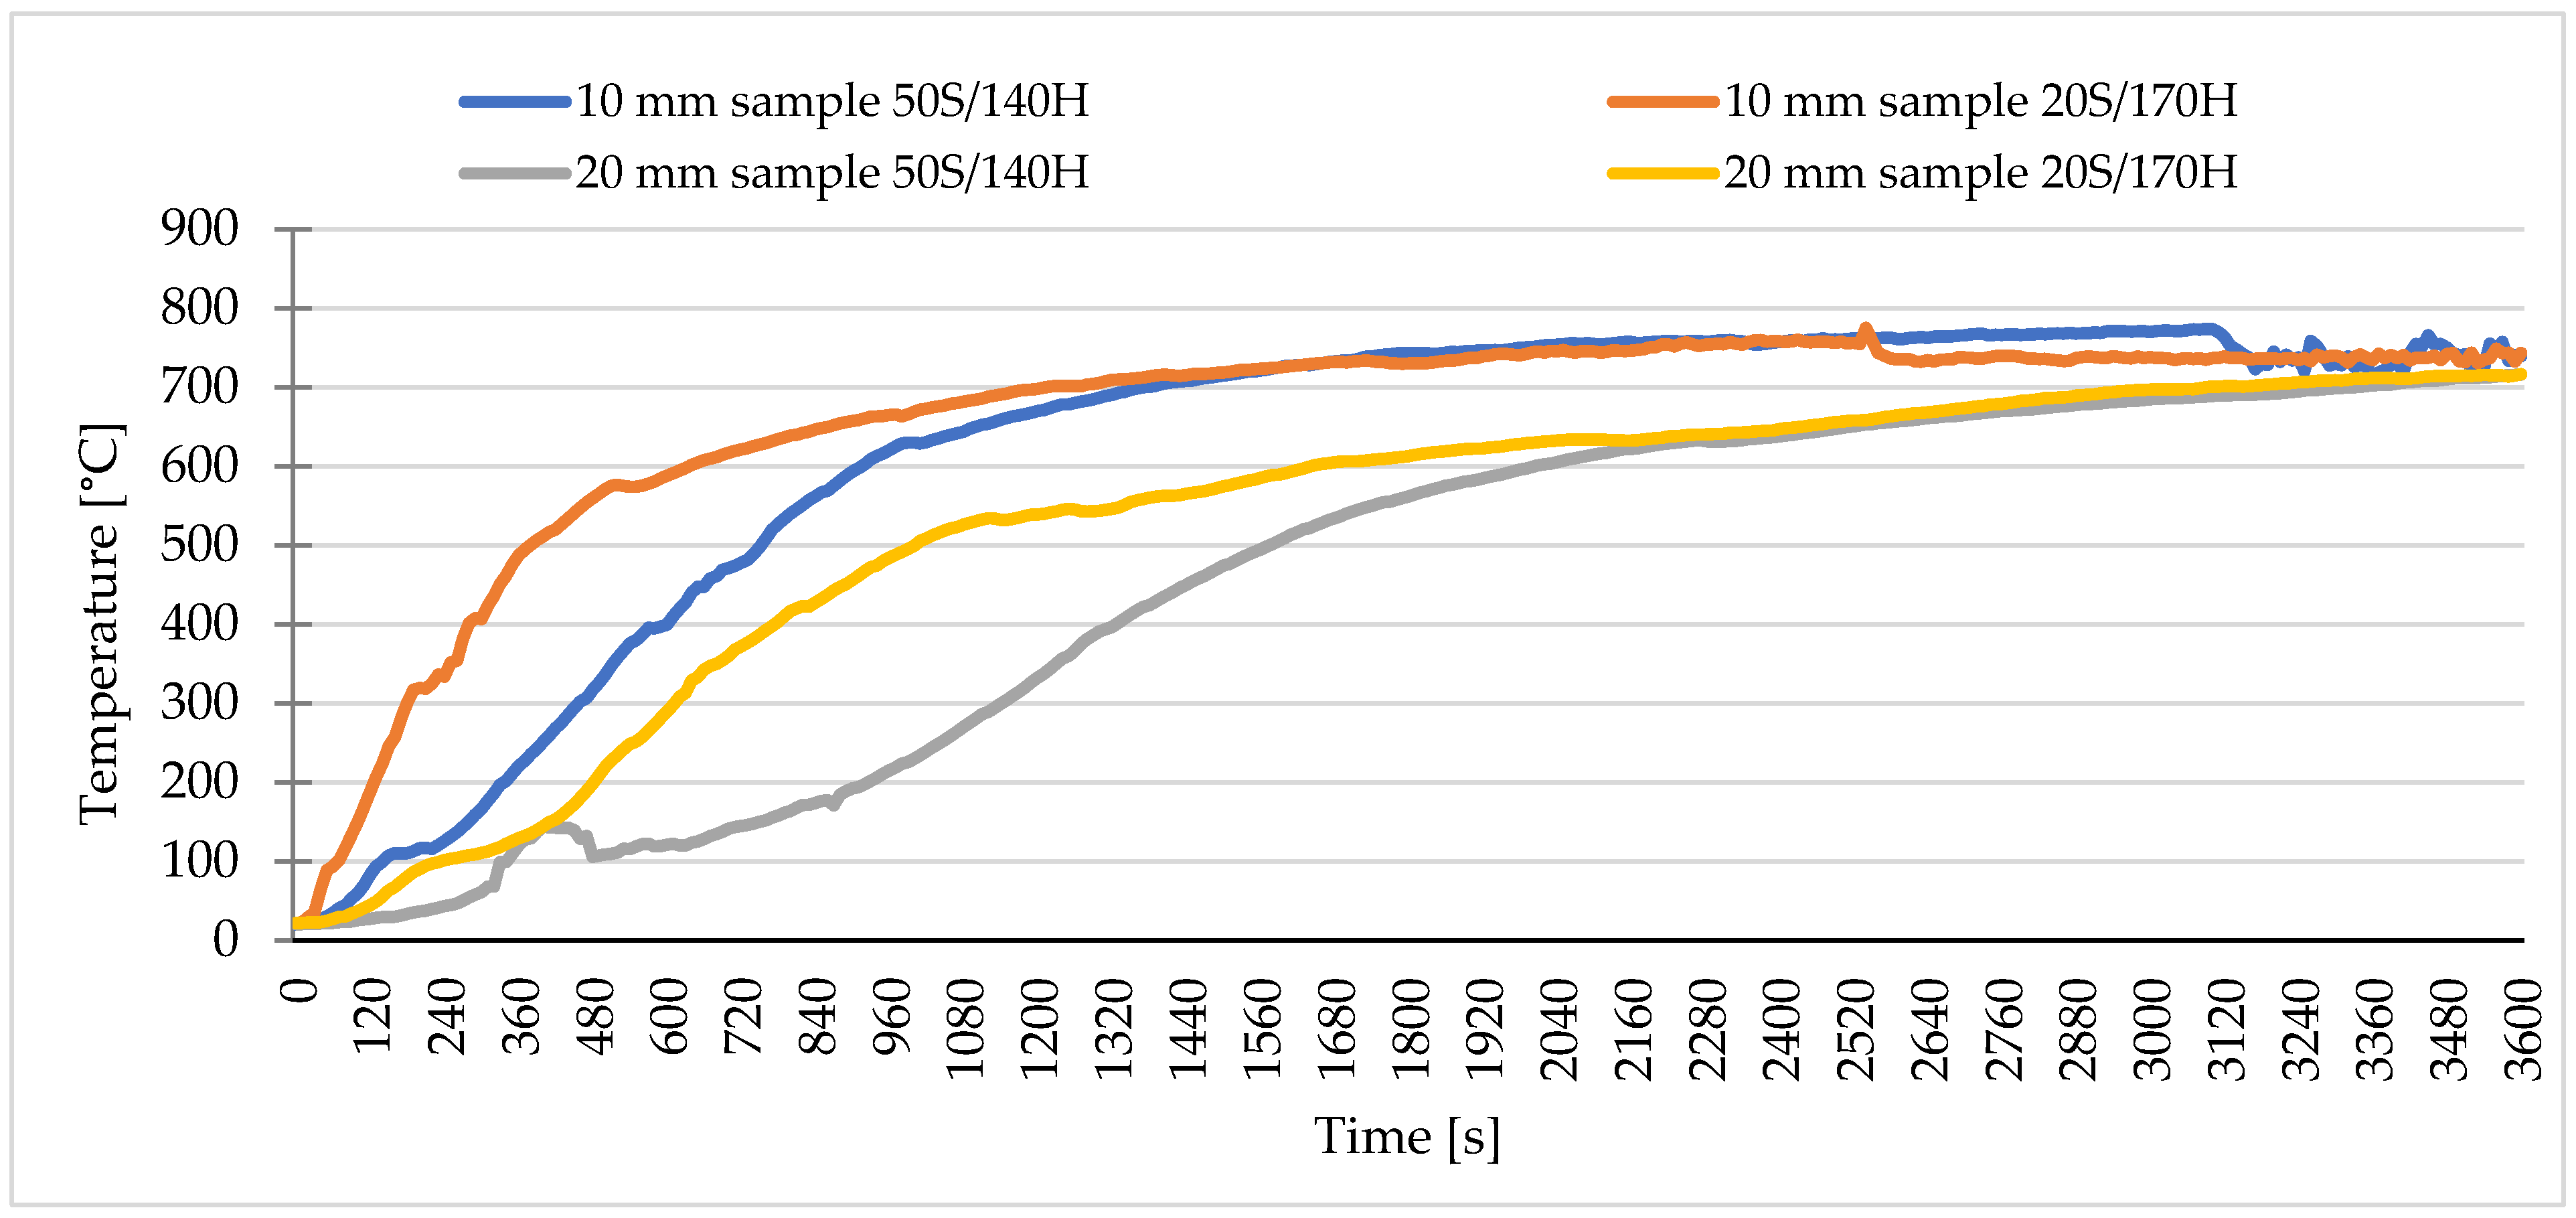
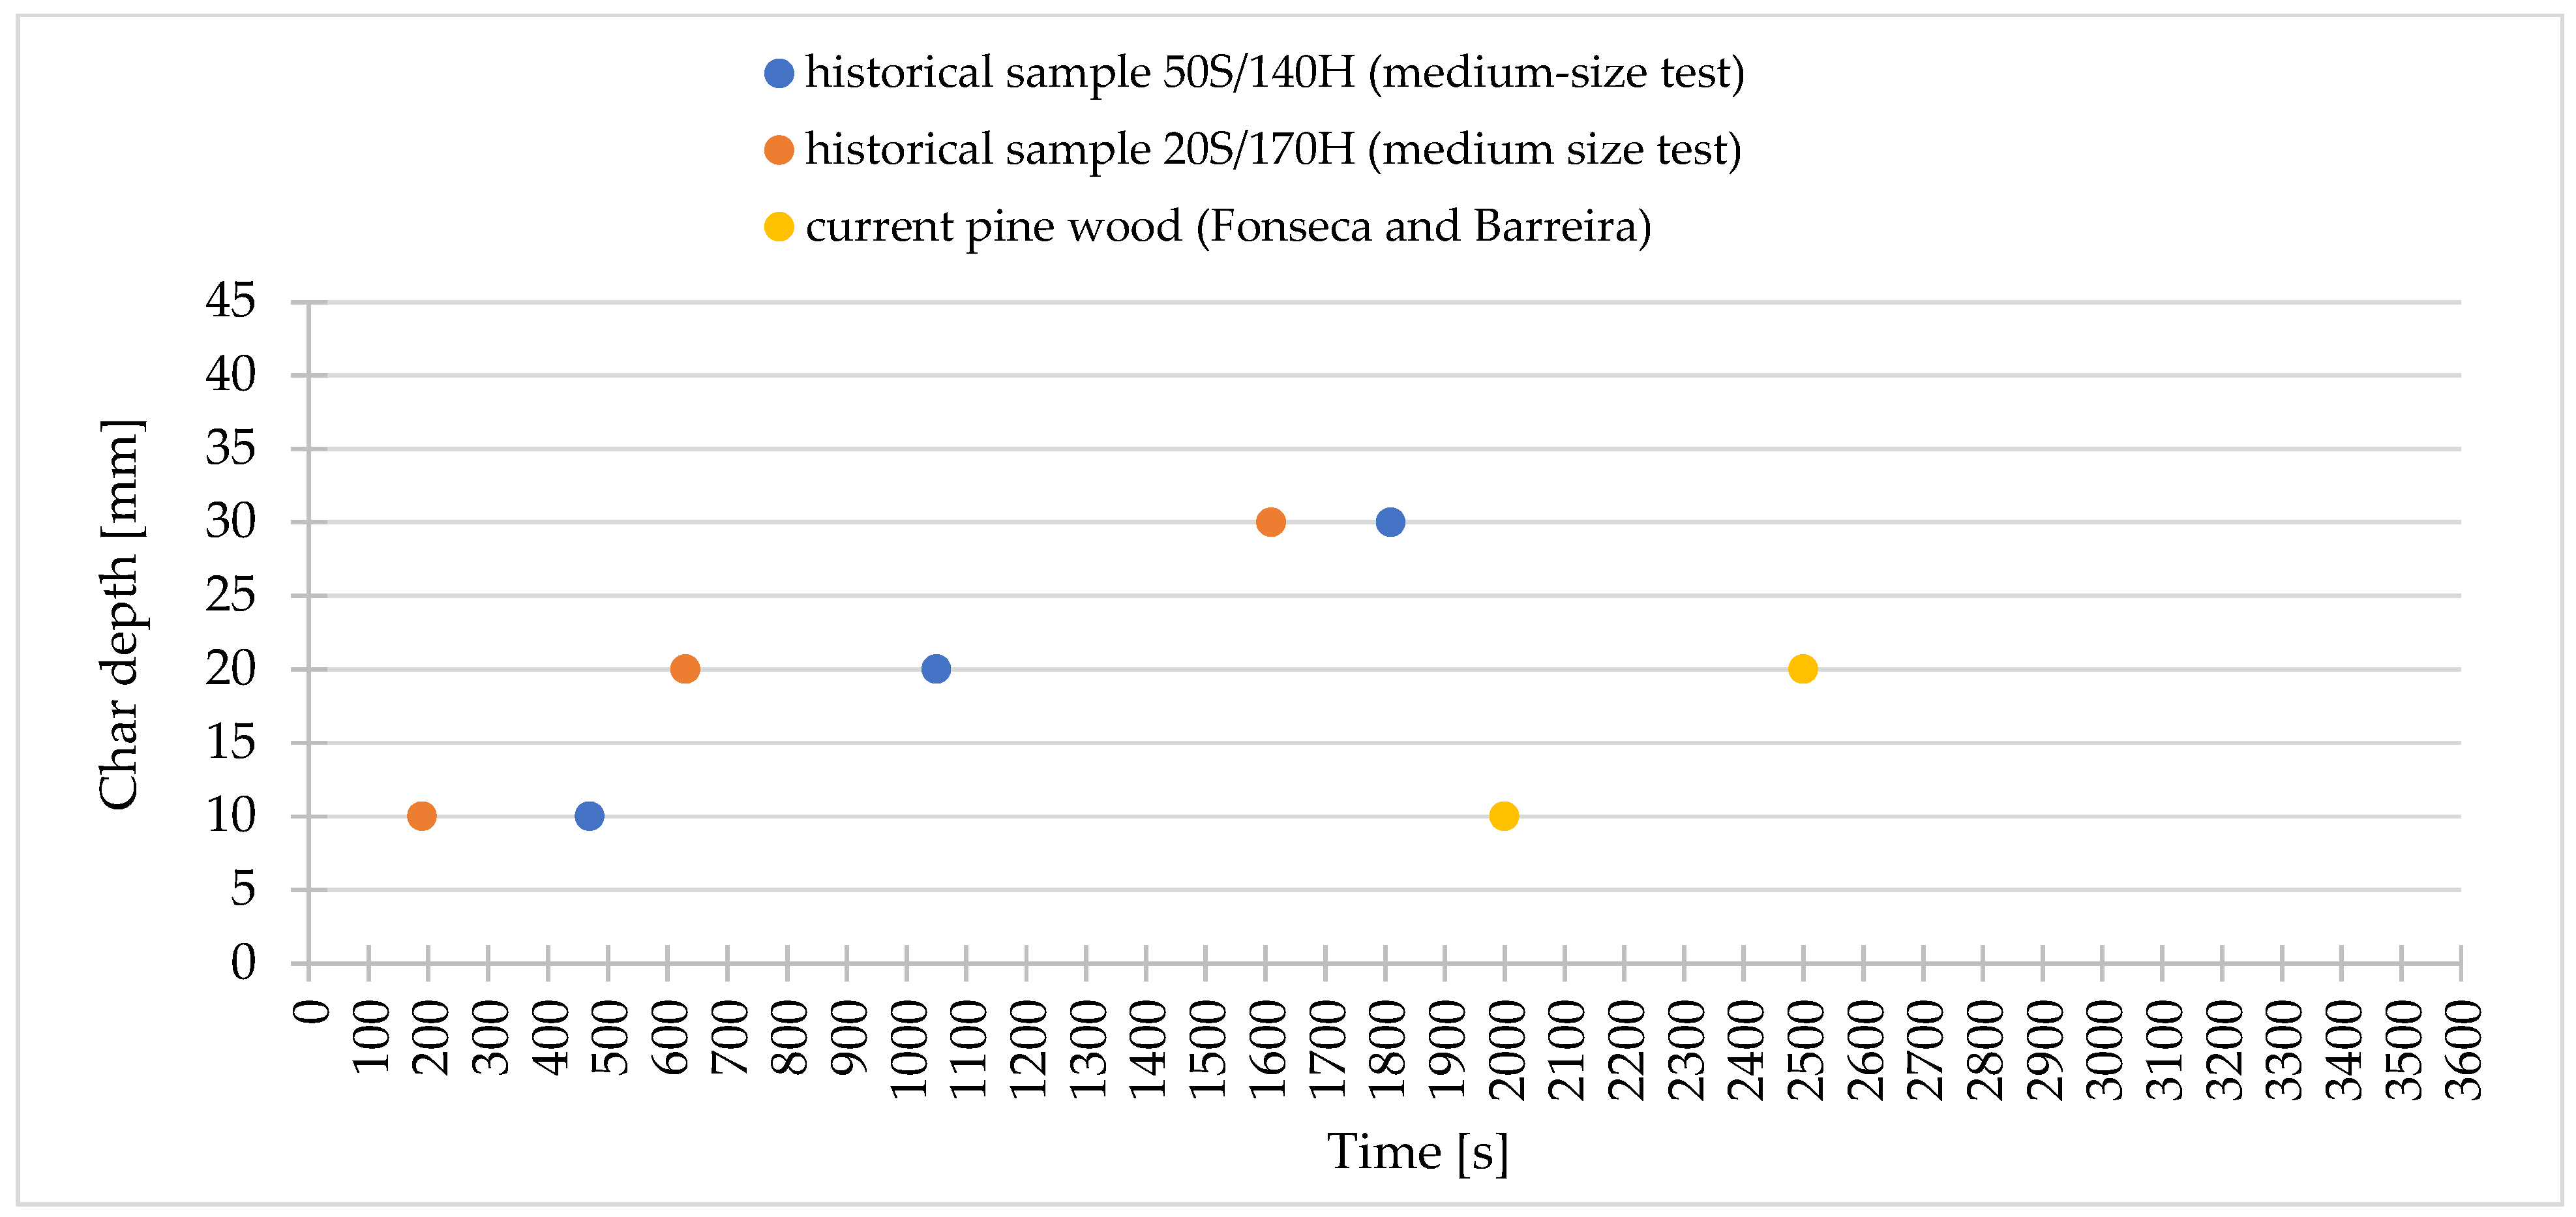
3.2. Medium-Scale Test for Assessing the Depth of Charring

Figure 4 shows the temperature development in historical sample 20S/170H and sample 50S/140H at 10 mm and 20 mm depth from the exposed side. A flame on the sample 20S/170H occurred at the 29th second. The temperature between the radiation panel and the test sample was 529 °C. Above the surface of the test sample, a sufficient amount of combustible vapor was released to form a combustible mixture with oxygen in the air, and ignition consequently occurred. The sample 20S/170H burned by flaming combustion until the end of the test. On the sample 50S/140H, flame development occurred at the 42nd second and persisted until the end of the test. The temperature between the radiation panel and the test sample achieved 579 °C.
The first 10 mm of the sample 20S/170H was charred in 180 s. At the 653rd second, the char layer started to form at 20 mm. For the sample 50S/140H, the charring of the first 10 mm took 460 s. At the 1160th second, the char layer also began to form at a distance of 20 mm for the sample 50S/140H. The temperature difference was mainly due to the surface quality of the exposed side. During sample preparation, the surface was free of mortar (connecting material of two squared timber). The surface of the historical sample may have had cracks and holes and been exposed to long-term weathering and micro-organisms. Deterioration significantly affected the development of temperatures up to 20 mm for the sample 20S/170H and sample 50S/140H.
The difference in temperature development between the historical sample 20S/170H and historical sample 50S/140H was also evident on TC 2, which recorded the temperature at a distance of 20 mm from the exposed side. The temperature development at a 20 mm distance from the exposed side is directly dependent on the temperature development recorded at a 10 mm distance from the exposed side (significantly different thermal development of temperature curve measured TC1 of historical sample 50S/140H and sample 20S/170H from the beginning of the test until 1440 s). From 490 s, a significant temperature growth occurs in historical sample 20S/170H at a 20 mm distance. In the sample of historical sample 50S/140H, a moderate temperature decrease occurs, and the consequent temperature increase is not as fast as in sample 20S/170H. At 2200 s, both sample 50S/140H and sample 20S/170H achieve a temperature of 625 °C. From this moment on, the temperature of sample 50S/140H develops in the same way as in sample 20S/170H.
From this point onwards, the difference between the sample 20S/170H and sample 50S/140H temperature was a maximum of 13.3 °C. The temperature development at 20 mm depended on the temperature progress at 10 mm (see Figure 4).
The temperature development at a depth of 30 mm from the exposed side is recorded in Figure 5. At this point, the char layer formation process occurred for the sample 20S/170H at 1810th s. For the sample 50S/140H, charring occurred as early as in the 1610th s. The difference in the sample 20S/170H and sample 50S/140H temperature developments at 30 mm from the exposed side was not as intense as at 10 and 20 mm. The effect of the insulating nature of the char layer was evident.
After the end of the test and subsequent cooling and sawing, the samples in the place where the thermocouples were placed showed that the color of the wood was dark brown, almost black. This is the color of wood typical for the formation of a charred layer. According to the visual observation, charring did not occur in any of the test samples at 40 mm from the exposed surface. Based on the temperature profile, a pyrolysis layer is formed in that area, which would begin to char within a few minutes.
Figure 6 shows the time at which the temperature reached 300 °C at thermocouple TC1, TC2, and TC3 is recorded for the sample 50S/140H and sample 20S/170H. Based on the fact that charring occurs at 300 °C and the starting temperature of the charring process, we assume that charring did not occur at this point. However, Figure 5 indicates that charring at 40 mm would have occurred within a few minutes if loading continued.
The formation of the char layer resulted in a decrease in the rate of charring. Table 1 shows the differences in the charring rate at the beginning of the charring process. The charring of the first 10 mm occurred in the 460th s for the sample 50S/140H, while for the sample 20S/170H, it took 180 s. The difference in temperature development was also visible in the char layer at 20 mm, but it had a decreasing tendency. At a depth of 30 mm, there was a difference (about 200 s), which was not as intense as at the beginning (at 10 mm distance).
The charring process slowed down as the char layer grew, and the threshold of 40 mm from the exposed side was not reached by any sample at 3600 s.
The charred layer of historic wood has an insulating character. The first 10 mm of sample 20S/170H from the exposed surface charred in 190 s, the second 10 mm of heartwood charred in 440 s, the third 10 mm sample 20S/170H charred in 1170 s, and the fourth 10 mm did not char even after 2430 s. By increasing the char depth, the charring process of unburned wood is slower. The fact that the charring temperature is around 300 °C was confirmed. Temperatures on the thermocouple at 40 mm from the exposed side did not reach 300 °C, but they were close to this value (271.9 °C).
The instantaneous charring rate is the quotient of the depth of the char layer and the time during which this char layer was formed.
The recorded results from this research were compared with the results of other authors. When evaluating the tests, the study [1] concluded that at a radiation level of 50 kW∙m−2, the charring processes in the test samples were rapid at the beginning, and then they leveled off.
The depth of charring for historical wood was evaluated based on the research carried out by Wang et al. [40], who dealt with the depth of charring of historical wooden structures. It concerned a construction made of wood, also qualified as softwood. Eurocode 5 [19] states a uniform charring rate for all softwoods.
Wang et al. [40] assessed the charring rate of historical wood. They report that the instantaneous charring rate at 10 mm from the exposed side of one of the samples was 2.14 mm·min−1. The instantaneous carbonization rate at a point 30 mm from the exposed side of the same sample was 1.08 mm·min−1. Hadwig [41] assessed the rate of charring and the formation of a char layer on a sample of Norway spruce. The char layer’s formation rate was 1.8 mm·min−1 in the first 5 min. In the 40th minute, the charring rate value was 0.8 mm·min−1. Martinka et al. [42] calculated the charring rate and charring depth of pine wood from the weight loss. They stated that the examined wooden samples had a higher one-dimensional charring rate under the specified test conditions than the value given in Eurocode [19], and the average rate of carbonization of pine wood at a heat flow of 50 kW·m−2 was determined in the range of 0.86 to 1.30 mm·min−1. The charring rate values of non-historical wood are lower than those of historical wood.
Figure 6 shows the time dependence of char layer formation on historical wood (medium-scale test) and char layer formation on current wood (the results of Fonseca and Barreira [13]), who investigated the char layer formation on current wood loaded by an electro-ceramic heating system with a thermal power unit of 70 kW (approximately 56 kW). Fonseca and Barreira [13] measured the temperature at different positions—10, 20, 30, 50, and 250 mm from the heating exposure surface. The results of the measurements are shown in Figure 6 (as current wood). At 30 mm from the exposure surface, the temperature was still below 300 °C.
The charring process of historical wood is significantly faster than the charring of current wood, compared to Fonseca and Barreira [13]. A 20 mm layer of historical wood chars 2.2 to 3.8 times faster than a 200 mm layer of current wood. Comparing temperatures at the distance of 30 mm from the surface, historical wood achieved 546.7 °C, while current wood did not even achieve the value of 300 °C.
Historical wood is a higher risk in terms of fire safety. Faster charring of historical wood causes the loss of mechanical properties of wooden constructions and might cause a consequent collapse of the construction. Both effects present a hazard during the evacuation of people via escape routes that do not meet the fire safety requirements.

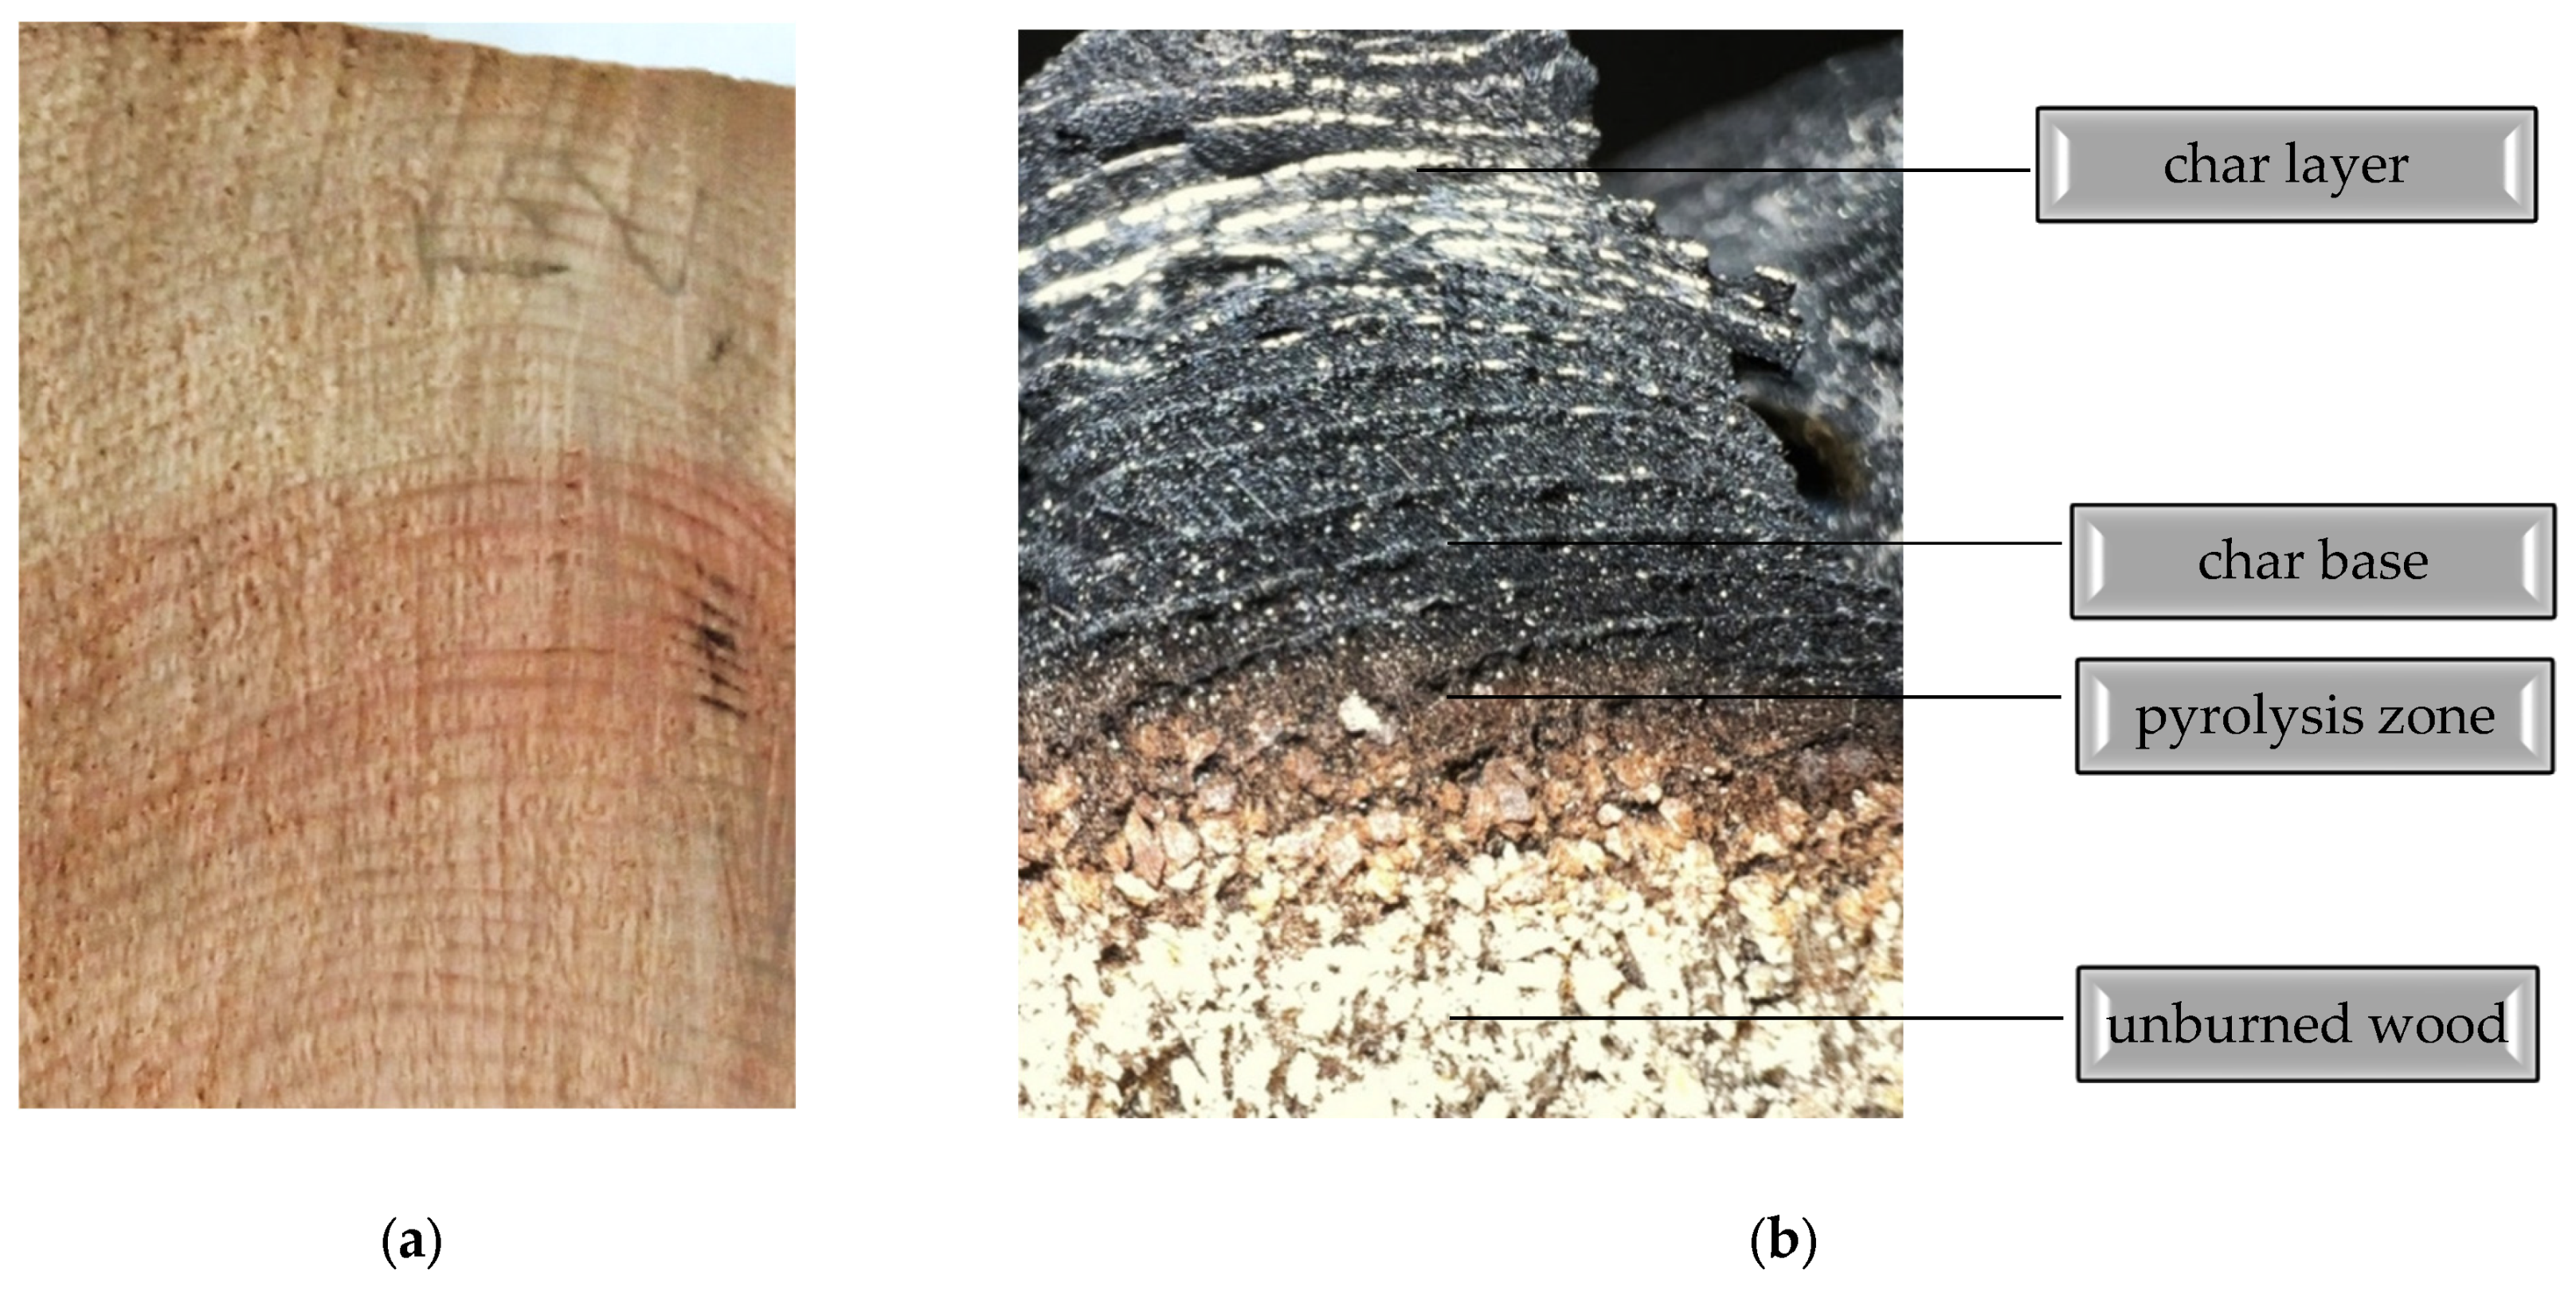
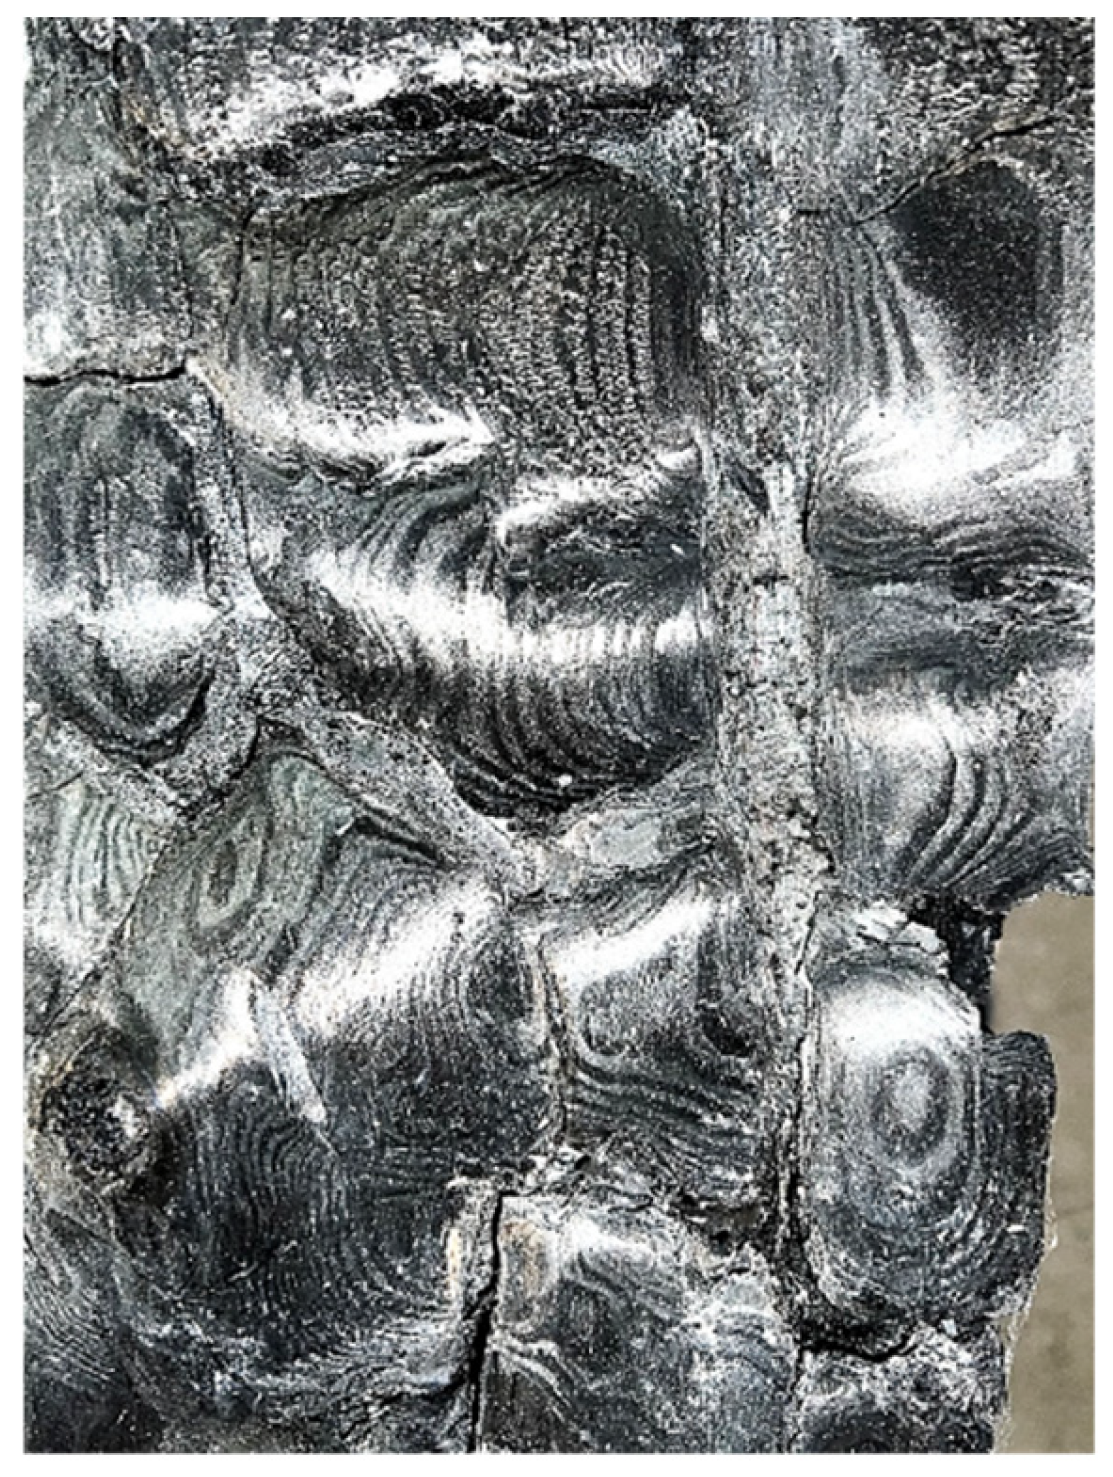
3.3. Char Layer and Color Changes

The test samples were loaded for 3600 s with a heat load of 50 kW∙m−2. The temperatures recorded in the 3600th s from sample 20S/170H (Table 2) represented the starting temperature for monitoring the chemical changes described below.
During the medium-scale test, color changes on the exposed side of the test sample were visually assessed. Figure 7 shows the color changes that occurred during the medium-scale test.
The char layer was identified as a black porous solid, as defined by Pinto et al. [25]. After removing char layers with assumed zero strength and stiffness (Figure 8), there was the basis-of-charring zone. This interface between charred and non-charred wood (the base of charring) was defined by a line between black and brown material. The brown color in Figure 7 represents the pyrolysis layer (it ranges from shades of light brown to dark brown). The interface between the pyrolysis zone and the intact wood was defined by the line between the brown wood and the wood with the original color. It was characterized by a temperature of around 100 °C.
The classification of the zones, which arose on the basis of the thermal loading of the test samples, was carried out on the basis of the temperature curves recorded at the end of the medium-scale test and by visual classification.
Figure 7a depicts the sample before thermal loading, with the sample 50S/140H and sample 20S/170H clearly visible. Figure 7b shows a char layer formed on the exposed side of the test sample, which consists of several layers.
The process of forming a char layer on the surface of the exposed side was relatively fast. According to the thermal development, the carbonized layer was formed at a lower rate based on the temperature curves recorded by thermocouples TC1–TC5 (Table 1).

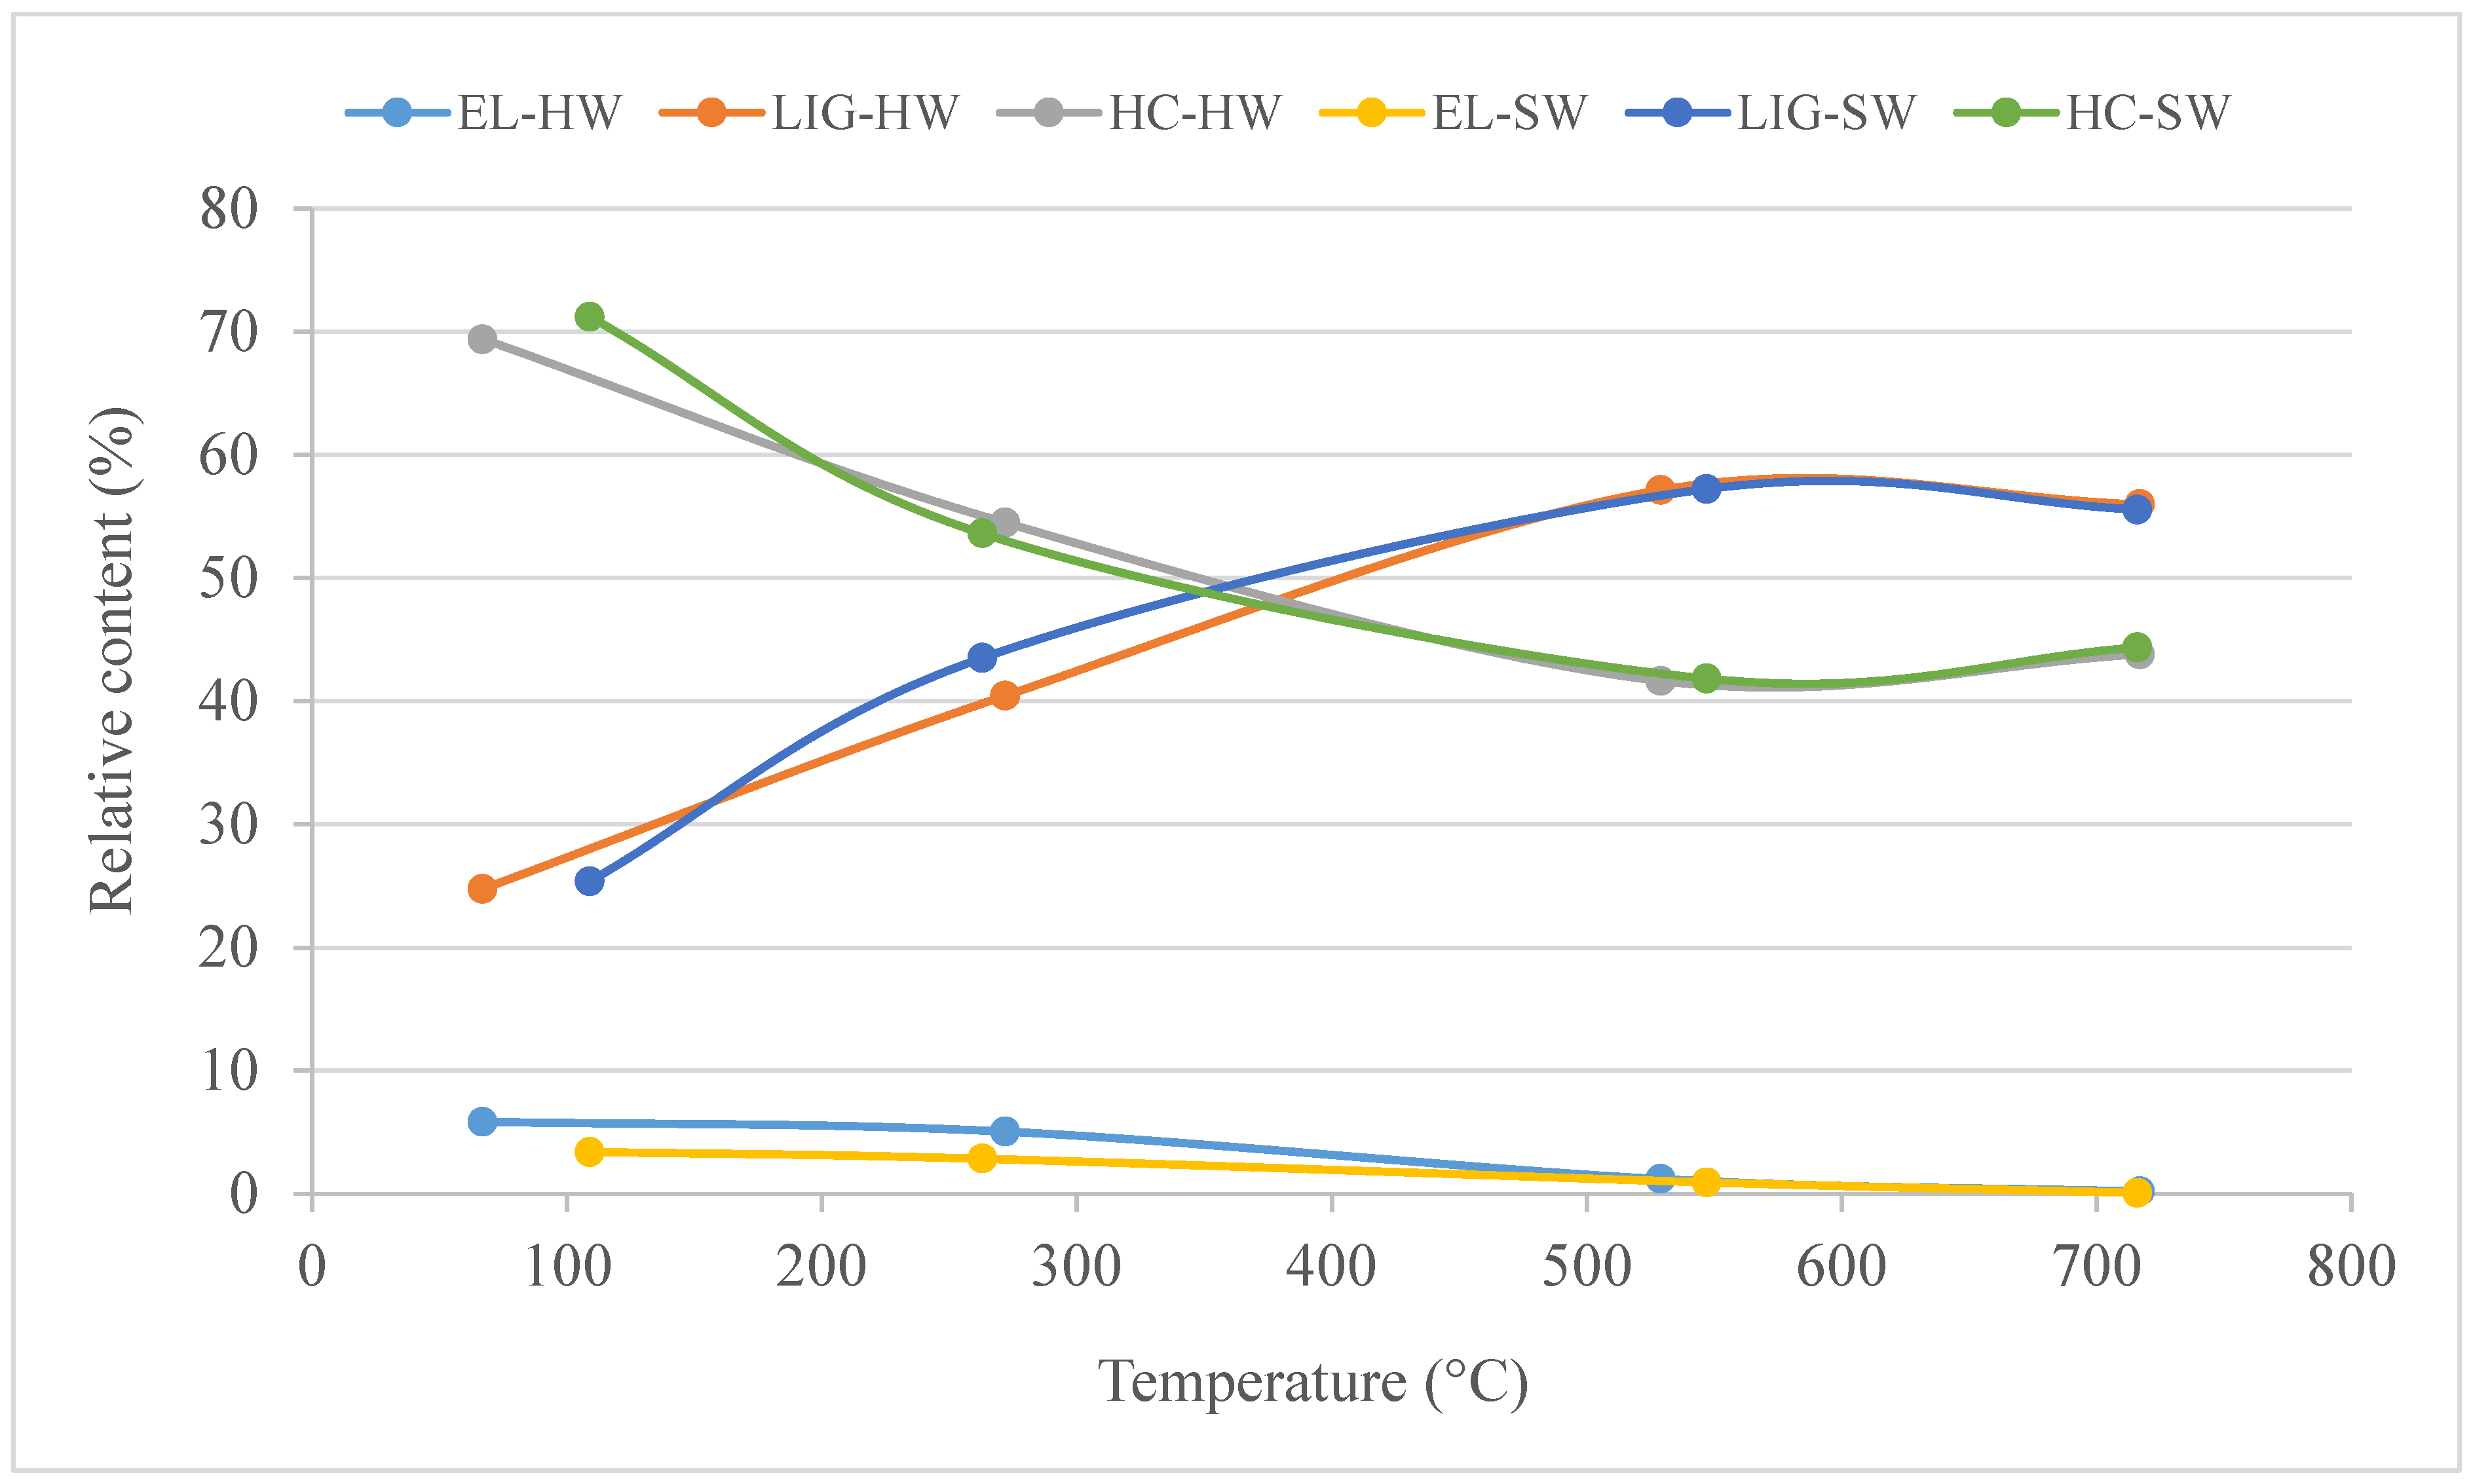
3.4. Chemical Composition of Pine Wood
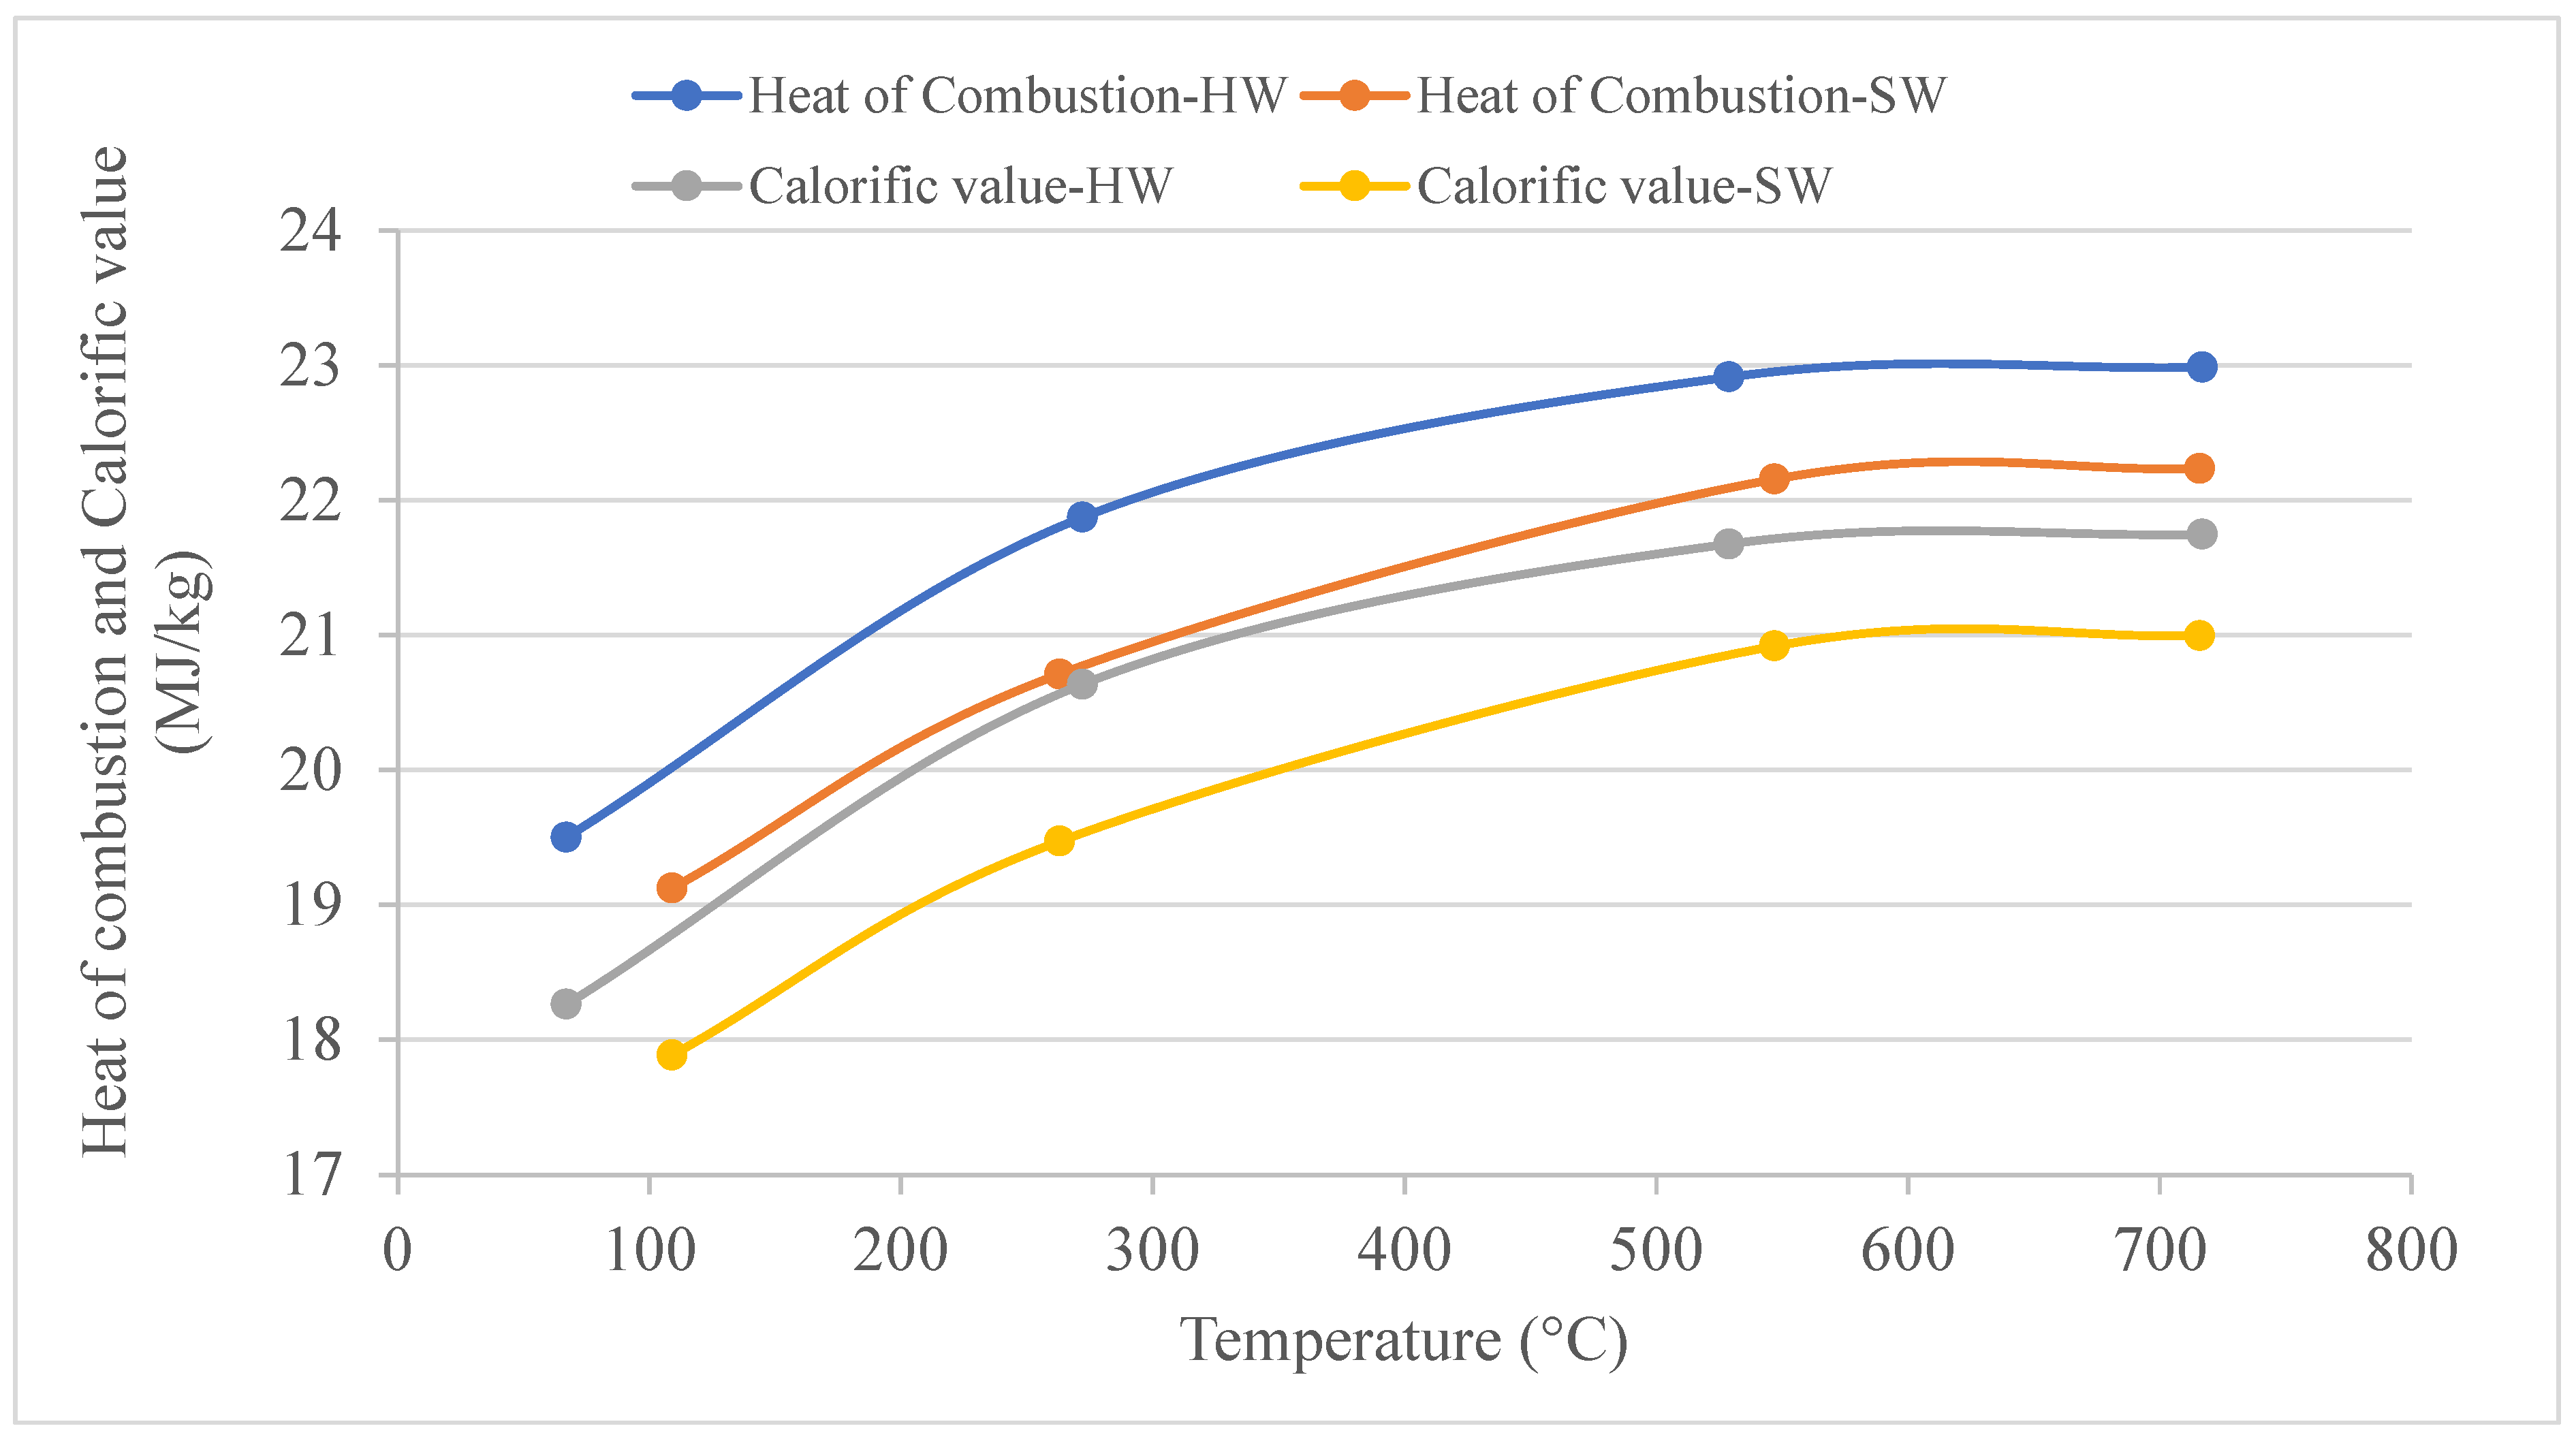
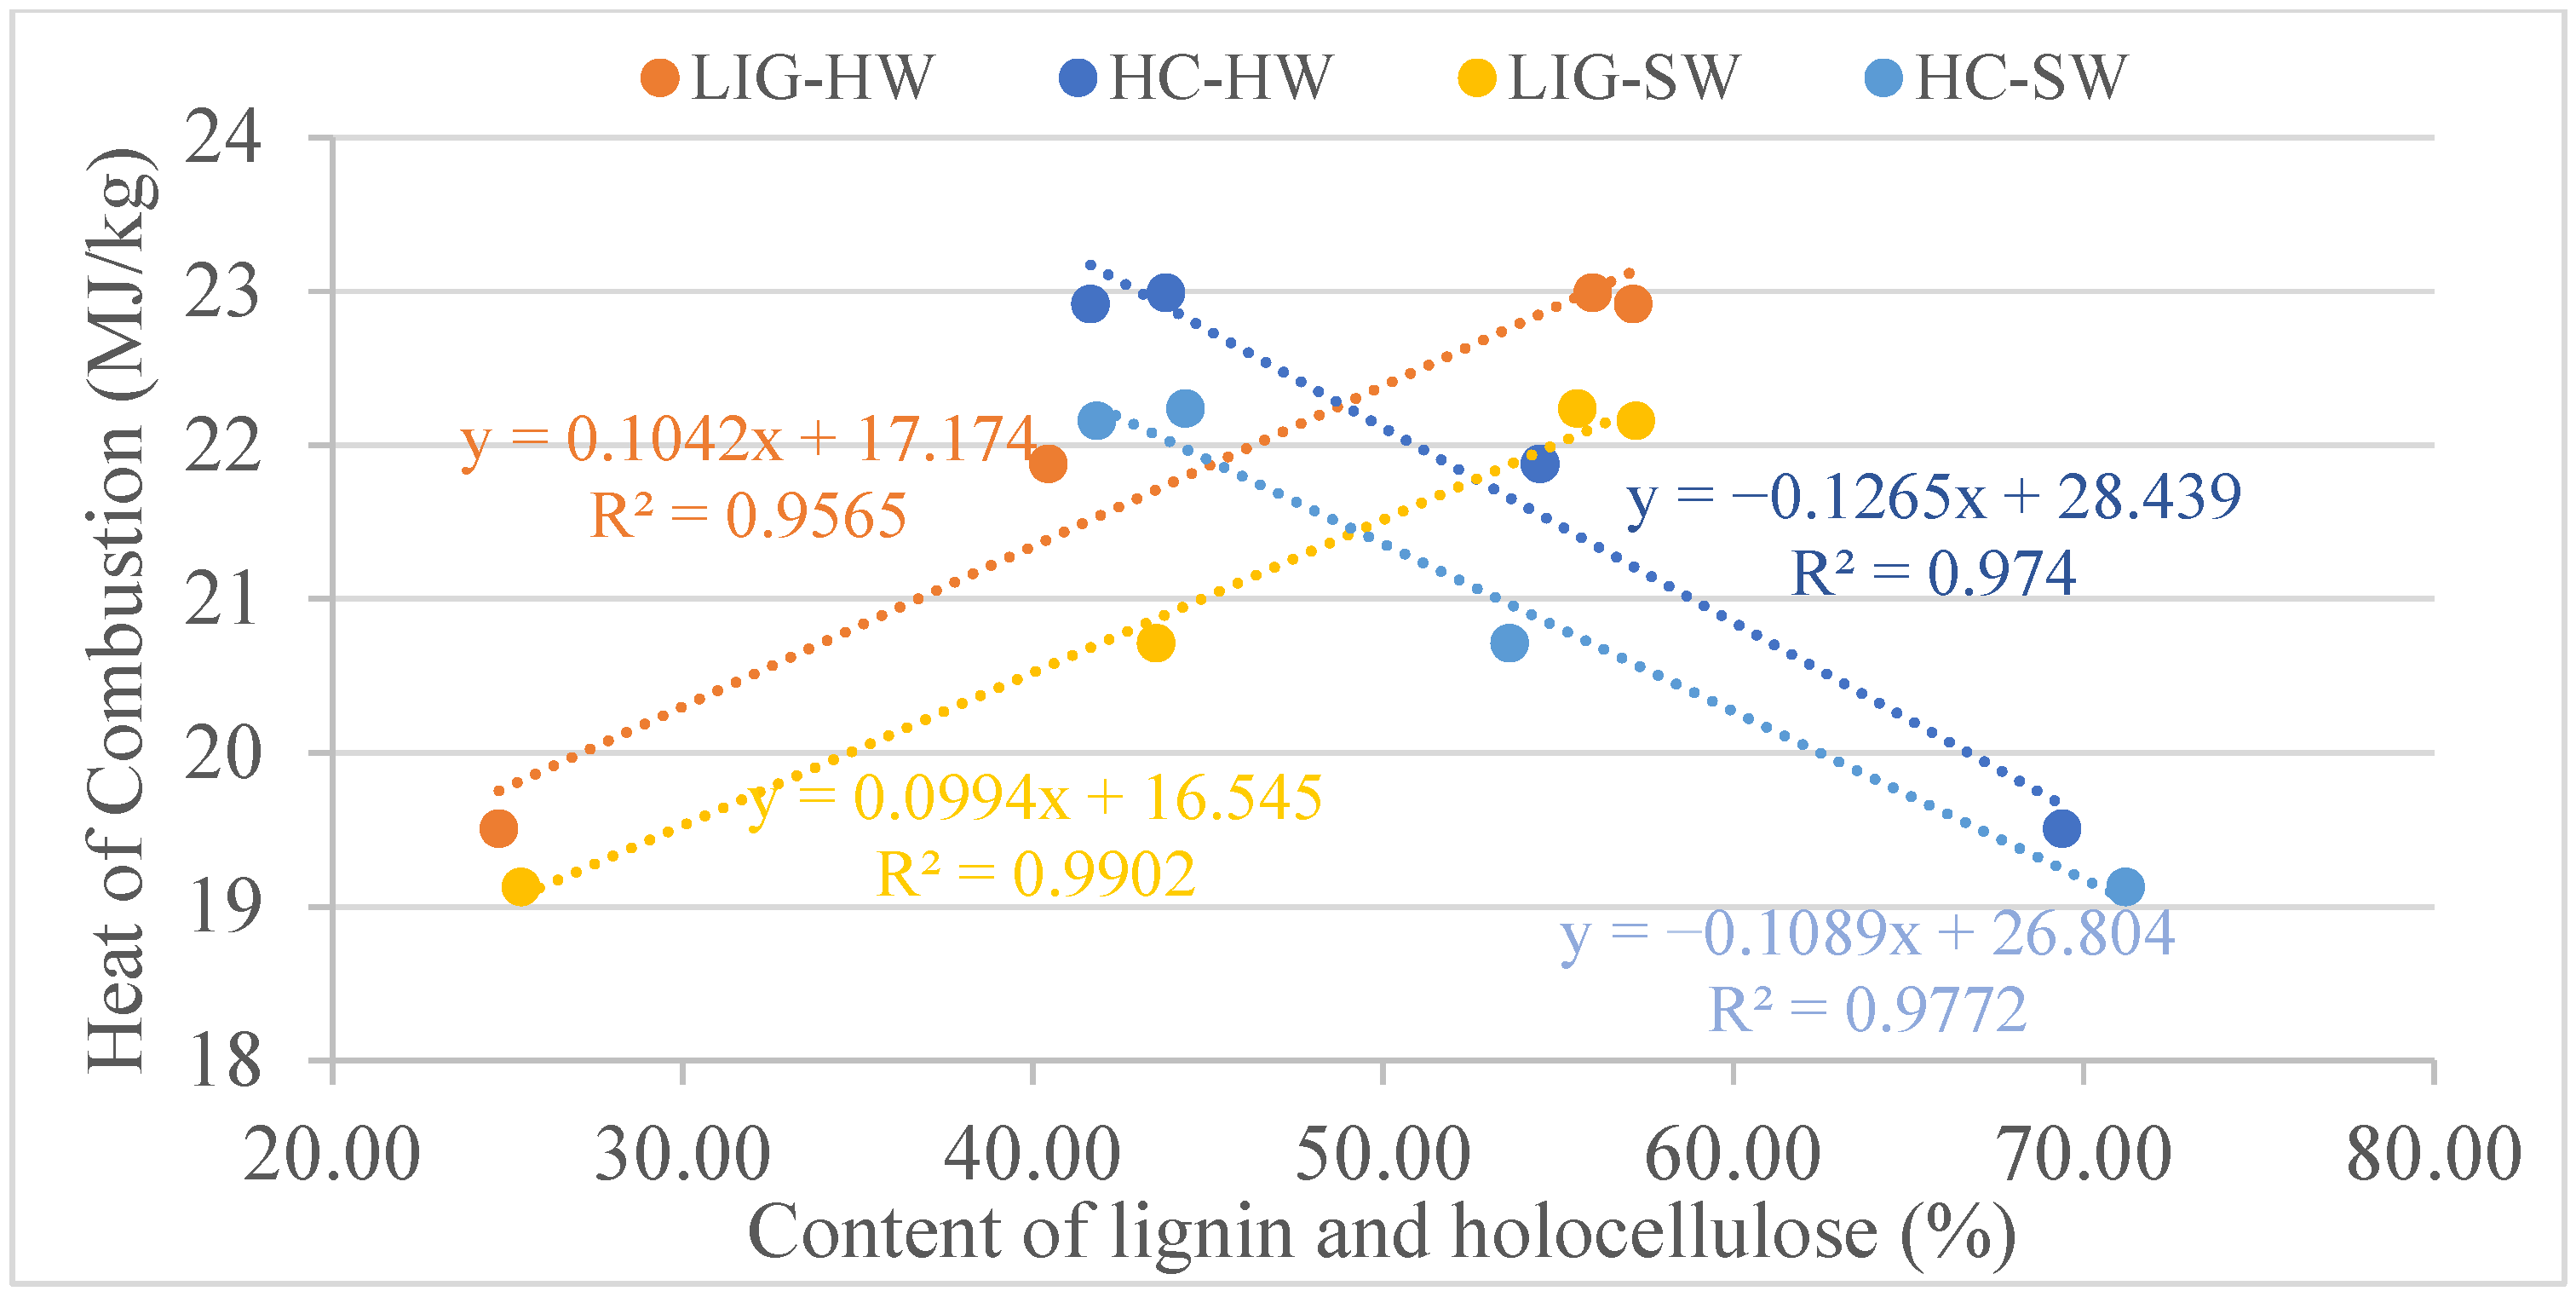
The samples of heartwood and sapwood were taken from four different temperature zones (Table 2). The content of the chemical compounds of wood differs when comparing lower and higher temperatures of treatment (Figure 9). The content of holocellulose at the lowest temperatures of thermal loading was 69.40% for heartwood and 71.21% for sapwood. The higher content of holocellulose in sapwood than in heartwood was also stated by Waliszewska et al. [43]. The content of lignin for these temperatures is 24.75% for heartwood and 25.38% for sapwood. The difference in the content of lignin in heartwood and sapwood was very little. Campbell et al., 1990 [44] state that based on the literature and their results, the variation in lignin content between pine heartwood and sapwood is not significant. The proportion of lignin is increasing with the temperature in the samples. The increase in lignin content may have been caused by the condensation reactions of lignin with hemicelluloses cleavage products or lignin macromolecule cross-linking [45,46]. In contrast, the content of holocellulose and extractives in our samples decreased with the temperature. The content of extractives was higher in the heartwood than in the sapwood. The most significant difference in the content of extractives was in the sapwood—3.40% at 109 °C—and in heartwood—5.85% at a temperature of 67 °C—and 2.86% at a temperature of 263 °C in sapwood and 5.06% at a temperature of 272 °C in the heartwood. From temperatures of 547 °C for sapwood and 529 °C for heartwood, the difference in the content of extractive substances is not so significant.
The extractives content in pine wood was established by several authors (Esteves et al., 2011 [47], Piernik et al. [9]). Our wood samples no longer contained the most volatile extractives, which had evaporated during their use in construction for approximately 150 years. The content of extractives may, therefore, differ from the content of extractives determined by other authors. One should remember that cross-study comparisons are also difficult due to the diversity of extraction procedures and analytical methods. Furthermore, seasonal variation in extractive content can occur due to changes in metabolic activity [48].
Determining the percentage proportion of the main wood constituents makes it possible to assess the value of the ratio of holocellulose to the lignin content of (H/L) after thermal loading. In our case, the holocellulose and lignin ratio ranged from 2.80 to 0.73 for the heartwood and 2.81 to 0.73 for the sapwood. The most advanced degradation of carbohydrate constituents was determined in the heartwood and sapwood with thermal loading at the highest temperature. Piernik et al. [9] and Scots Pine Wood recorded a decrease in the ratio of H/L after thermal loading. Holocellulose is composed of cellulose and hemicelluloses. Hemicelluloses do not form as crystalline and resistant structure as cellulose; they are easily degraded at about 180 °C. At higher temperatures, cellulose starts to decompose. This was the reason why the content of holocellulose decreased in thermally loaded wood. Lignin has a highly branched three-dimensional phenolic structure, including three main phenylpropane units, namely p-coumaril, coniferyl, and sinapyl. Softwood lignin contains relatively fewer sinapyl units and consists mainly of guaiacol structures. The main process of decomposition in lignin starts around 400 °C, with the formation of aromatic hydrocarbons, phenolics, hydroxyphenolics, and guaiacyl-/syringyl-type compounds, with most products having phenolic –OH groups.

3.5. Calorimetry

Figure 10 shows the results of the heat of combustion and calorific value of wood. The results show that higher heat of combustion and calorific values were measured for heartwood than for sapwood. The highest average heat of combustion, 22.99 MJ∙kg−1, was measured for heartwood and the lowest, 19.13 MJ∙kg−1, for sapwood. The highest average calorific value for sapwood was 21.00 MJ∙kg−1, and the lowest value was 17.89 MJ∙kg−1; for heartwood, it was MJ∙kg−1 and 18.27 MJ∙kg−1.
The chemical composition of wood is the main factor that affects the heat of combustion. Extractives and lignin, which are rich in carbon and hydrogen, have higher heating values than carbohydrates with a higher oxygen content. The heat of combustion of extractives is higher than that of lignin. The published results for isolated wood components, which are holocellulose, lignin, and extractives [49,50], confirm that holocellulose in wood has a lower energy content than aromatic lignin. In our study, we found a polynomial correlation between the heat of combustion and the content of extractives, with a coefficient of 0.9769 for heartwood and 0.8957 for sapwood (Figure 11). A positive correlation was found between the heat of combustion and lignin (Figure 12) for heartwood (0.9565) and sapwood (0.9902). On the other hand, the correlation between the heat of combustion and holocellulose was negative (Figure 12). According to Esteves et al., 2023 [17], there have not been many studies on the influence of chemical composition on the heating value of biomass. The study suggests that the highest calorific value was achieved by lignin and extractives.
According to Demirbas 2017 [51], hardwood lignin has a higher calorific value than softwood lignin; the calorific value of cellulose is the same regardless of the species [52]. Although cellulose differs from hemicelluloses, the heating values are not very different due to their similar chemical structures.

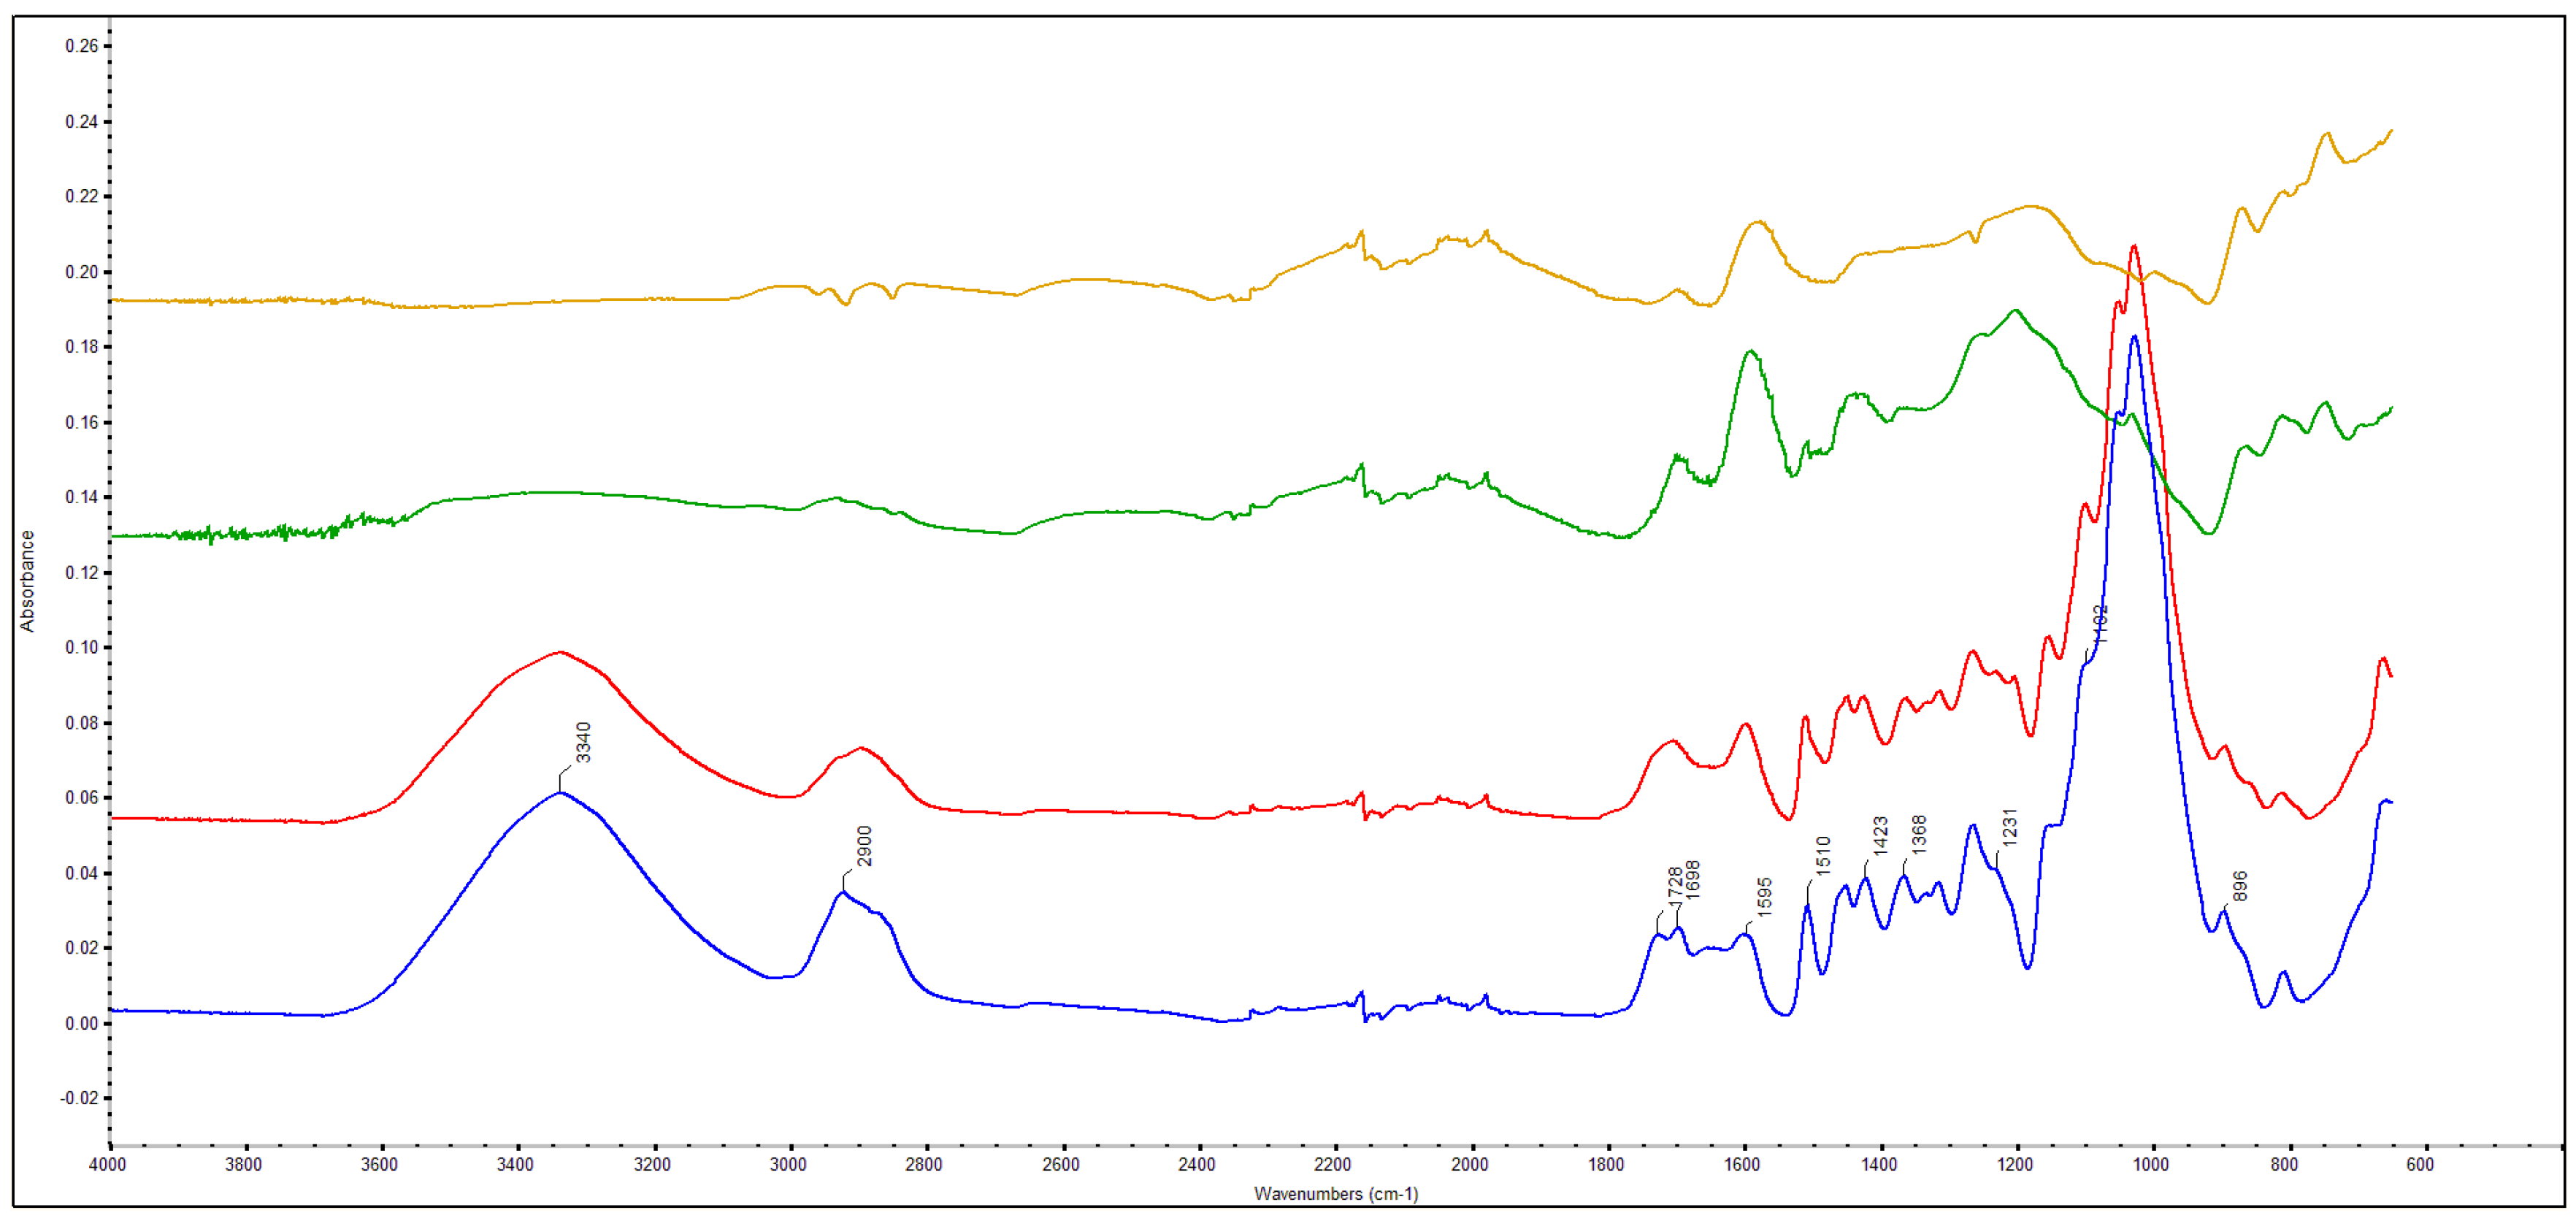
3.6. FTIR Analysis of Pine Wood

Figure 13 shows the FTIR spectra of the heartwood of pine under thermal loading. The FTIR spectra of heartwood and sapwood did not differ significantly. Therefore, the heartwood spectra were evaluated. During the thermal loading of wood, several reactions occur simultaneously; therefore, it is quite difficult to interpret the differences between the spectra of wood. The band at 3430 cm−1 corresponds to the O-H stretching vibration from alcohols (3600–3300 cm−1) and carboxylic acids (3300–2500 cm−1), present either in polysaccharides or lignin. In the FTIR spectra at a wavelength of 3340 cm−1 and 2900 cm−1, a decrease was observed in the band from the least to the most heat-stressed wood, indicating the loss of hydroxyl group and carboxylic acids. In the FTIR spectra between 1750 and 1700 cm−1, the C=O bond shows absorption. At approximately 1725–1700 cm−1, it is a carboxylic acid; at 1725–1705 cm−1, it is an ester and a ketone; and at 1740–1720 cm−1, it is an aldehyde. Only in the sample of wood least affected by the temperature were there two peaks in the range of bands 1750 to 1700 cm−1, namely at 1730 cm−1 and 1700 cm−1. In other samples, the peaks of the bands were located only at 1700 cm−1. According to Srinivas and Pandey [53], the decrease in peak intensities at 1730 cm−1 (non-conjugated carbonyl stretching in hemicelluloses) indicated hemicelluloses degrade with treatment.
The bands at 1595 cm−1 correspond to vibrations in the aromatic ring of lignin plus C=O stretching. The belt height increases to approximately 550 °C, then decreases slightly. We observed the same trend for the 1510 cm−1 band, corresponding to the benzene ring’s stretching vibrations for softwood lignin (Guaiacyl-G). According to Kotilainen et al. [54], the changes in the intensity of these bands result from the condensation of lignin and cleavage of aliphatic side chains in lignin during heating. The band at 1460 cm−1 corresponds to the asymmetric deformation of the CH bond of xylan, while the vibration of the aromatic ring of lignin, but also the bending of CH in cellulose, corresponds to the band at 1420 cm−1 [55]. For samples up to a temperature of approximately 300 °C, a band at 1460, 1450, and 1423 cm−1 was observed. At a temperature of 550 °C, only one extended band from 1470 to 1392 cm−1 was observed, which significantly decreased at the loading temperature of about 720 °C. The 1370 cm−1 band, primarily attributed to the C−H bending vibrations in cellulose, decreases with the increasing loading temperature, while it almost disappears at a temperature of 720 °C. We can assume that at this temperature, cellulose and lignin were degraded. The decrease in the intensity of this band was also observed by thermally loaded pine wood by Özgenç et al., 2017 [56]. The intensity band at 1160 cm−1 (C−O−C vibrations in cellulose), as well as 1030 cm−1 (associated with cellulose deformations), decreased gradually with the temperature, probably due to the beginning of cellulose degradation processes. The decrease in the height of the belt was observed at the peak of 896 cm−1 (the sugar ring tension) up to a temperature of 272 °C. At 529 °C and about 720 °C, the bands were shifted to a wave number of 871 cm−1. A change in absorption in this band indicates a decrease in cellulose and, at higher temperatures, cellulose degradation. The changes in cellulose crystallinity were calculated as a ratio of the values of the bands at the wavelength of 1370 and 2900 cm−1 (TCI) and the ratio of band values at the wavelength of 1430 and 898 cm−1 (LOI). The TCI and LOI values increased up to a temperature of 272 °C. At higher temperatures, the TCI and LOI values of the cellulose could not be calculated because the bands used to calculate the crystallinity of the cellulose disappeared (Figure 13).
The results of the chemical analysis and FTIR analysis imply that thermal loading affected the chemical constituents of wood and the chemical structure of historical pine wood.

4. Conclusions

By carrying out a medium-scale test, in which historical pine wood was loaded with a radiation panel with a power of 50 kW∙m−2 for 3600 s, the following conclusions were reached:
-
The insulating character of the charred layer created was confirmed;
-
With increasing distance from the exposed side, the rate of charring decreases;
-
The charring temperature is approx. 300 °C, based on a visual assessment of the cross-sectional test sample and adequate temperature curves;
-
The charring process of historical wood is significantly faster than the charring of current wood. This fact is confirmed by comparing the results of the medium-scale test for historical wood with the results of other authors [13] for current wood;
-
The relative content of extractives decreased with the increasing temperature due to their degradation;
-
The relative holocellulose content decreased with the increasing temperature due to the degradation of saccharides of the hemicellulose type;
-
The relative content of lignin increased with the increasing temperature, which may have been caused by the condensation reactions of lignin with hemicelluloses cleavage products or lignin macromolecule cross-linking;
-
There was a polynomial correlation between the heat of combustion and the content of extractives, a negative correlation between the heat of combustion and holocellulose, and a positive correlation between the heat of combustion and lignin;
-
FTIR analysis confirmed the degradation of hemicelluloses, condensation reactions of lignin, and increase in cellulose crystallinity, while all wood components were degraded at a temperature above 550 °C.
The results obtained can serve as a basis for future studies of the behavior of historical wood during thermal loading.

Author Contributions

K.D., methodology, conceptualization, supervision, writing—original draft, experimental—medium-size test for assessing the depth of charring, evaluation of the results, and funding acquisition; V.K., methodology, conceptualization, supervision, writing—original draft, experimental—chemical analysis, determination of heat of combustion, evaluation of the results, and funding acquisition; J.Š., writing—original draft, translation and review of the article; O.M., writing—original draft, microscopy. All authors have read and agreed to the published version of the manuscript.

Funding

This work was supported by the Slovak Research and Development Agency (Bratislava, Slovakia) under contracts APVV-17-0005. This work was supported by the Slovak Research and Development Agency under the Contract no. APVV-22-0030. This work was supported by the Scientific Grant Agency of the Ministry of Education, Research, Development and Youth of the Slovak Republic and the Slovak Academy of Sciences under the Contract VEGA no. 1/0115/22 A comprehensive approach to the study of changes in fire parameters using progressive analytical and testing methods.

Data Availability Statement

The data are contained within the article.

Conflicts of Interest

The authors declare no conflicts of interest.

References

  1. Chorlton, B.; Gales, J. Fire performace of cultural heritage and contemporary timbers. Eng. Struct. 2019, 201, 109739. [Google Scholar] [CrossRef]
  2. Yin, Y.; Luo, B.; Zhang, Z.; Zhang, Y.; Cheng, X.; Jiang, X. Introductione to the application of non-destructive testing methods in wood structure ancient architecture. ANc. Archit. Gard. Technol. 2020, 3, 20–23. [Google Scholar]
  3. Kučerová, V.; Lagaňa, R.; Hýrošová, T. Changes in chemical and optical properties of silver fir (Abies alba L.) wood due to thermal treatment. J. Wood Sci. Vol. 2019, 65, 21. [Google Scholar] [CrossRef]
  4. Zaman, A.; Alen, R.; Kotilainen, R. Thermal behavior of scots pine (Pinus sylvestris) and silver birch (Betula pendula) at 200–230 °C. Wood Fiber Sci. 2000, 32, 138–143. [Google Scholar]
  5. Friquin, K.L. Material properties and external factors influencing the charring rate of solid wood and glue-laminated timber. Fire Mater. 2011, 35, 303–327. [Google Scholar] [CrossRef]
  6. Jang, E.S.; Kang, C.W. Changes in gas permeability and pore structure of wood under heat treating temperature conditions. J. Wood Sci. 2019, 65, 37. [Google Scholar] [CrossRef]
  7. Zawadzki, J.; Gawron, J.; Antczak, A.; Klosińska, T.; Radomski, A. The influence of heat treatment on the physico-chemical properties of pinewood (Pinus sylvestris L.). Drewno 2016, 59, 49–57. [Google Scholar] [CrossRef]
  8. Taghiyari, H.R.; Bayani, S.; Militz, H.; Papadopoulos, A.N. Heat Treatment of Pine Wood: Possible Effect of Impregnation with Silver Nanosuspension. Forests 2020, 11, 466. [Google Scholar] [CrossRef]
  9. Piernik, M.; Woźniak, M.; Pinkowski, G.; Szentner, K.; Ratajczak, I.; Krauss, A. Impact of the Heat Treatment Duration on Color and Selected Mechanical and Chemical Properties of Scots Pine Wood. Materials 2022, 15, 5425. [Google Scholar] [CrossRef]
  10. Candelier, K.; Thevenon, M.F.; Petrissans, A.; Dumarcay, S.; Gerardin, P.; Petrissans, M. Control of wood thermal treatment and its effects on decay resistance: A review. Ann. For. Sci. Vol. 2016, 73, 571–583. [Google Scholar] [CrossRef]
  11. Durmaz, E.; Ucuncu, T.; Karamanoglu, M.; Kaymakci, A. Effects of heat treatment on some characteristics of Scots pine (Pinus sylvestris L.) wood. FioResources 2019, 14, 9531–9543. [Google Scholar] [CrossRef]
  12. Peng, Q.; Ormondroyd, G.; Spear, M.; Chang, W.S. The effect of the changes in chemical composition due to thermal treatment on the mechanical properties of Pinus densiflora. Constr. Build. Mater. 2022, 358, 129303. [Google Scholar] [CrossRef]
  13. Fonseca, E.M.; Barreira, L.M.S. Charring rate determination of wood pine profiles submitted to high temperatures. WIT Trans. Built Environ. 2009, 108, 449–459. [Google Scholar]
  14. Lipinskas, D.; Mačiulaitis, R. Further opportunities for development of the method for fire origin prognosis. J. Civ. Eng. Manag. 2005, 9, 299–307. [Google Scholar] [CrossRef]
  15. White, R.H.; Dietenberger, M.A. Fire safety of wood construction. In Wood Handbook; Wood as an engineering material; General Technical Report: Madison, WI, USA, 2010; pp. 18–22. [Google Scholar]
  16. Dietenberger, M.; Hasburgh, L. Wood Products Thermal Degradation and Fire. In Reference Module in Materials Science and Materials Engineering; Elsevier: Amsterdam, The Netherlands, 2016; pp. 9712–9716. [Google Scholar]
  17. Esteves, B.M.; Sen, U.; Pereire, H. Influence of Chemical Composition on Heating Value of Biomass: A Review and Bibliometric Analysis. Energies 2023, 16, 4226. [Google Scholar] [CrossRef]
  18. Blass, H.J. Timber Engineering: Step 1: Basic of Design, Material Properties, Structural Components and Joints; Centrum Hout: Almere, The Netherlands, 1995; p. 300. [Google Scholar]
  19. EN 1995-1-2:2004/AC:2009; Eurocode 5: Design of Timber Structures-Part 1-2: General-Structural Fire Design. European Union: Brussels, Belgium, 2009.
  20. Esteves, B.M.; Pereira, H.M. Wood modificatiion by heat treatment: A review. Bioresurces 2008, 4, 370–404. [Google Scholar] [CrossRef]
  21. Konig, J. Structural fire design according to Eurocode 5—Design rules and their background. Fire Mater. 2004, 29, 147–163. [Google Scholar] [CrossRef]
  22. Mikkola, E. Charring of wood based materials. Fire Saf. Sci. 1991, 3, 547–556. [Google Scholar] [CrossRef]
  23. Harper, C.A. Handbook of Building Materials for Fire Protection (e-Book); McGraw-Hill: New York, NY, USA, 2004. [Google Scholar]
  24. Su, H.C.; Tung, S.F.; Tzeng, C.T.; Lai, C.M. Variation in the charring depth of wood studs inside wood-frame walls with time in a fire. Wood Res. 2019, 64, 449–460. [Google Scholar]
  25. Pinto, E.M.; Machado, G.O.; Felipetto, R.P.; Chistoforo, A.L.; Lahr, F.A.R.; Calil, C.J. Thermal Degradation and Charring Rate of Corymbia Citriodora. Open Constr. Build. Technol. J. 2016, 10, 450–456. [Google Scholar]
  26. Li, K.; Hostikka, S.; Peng, D.; Yuanzhou, L.; Heping, Z.; Jie, J. Charring shrinkage and cracking of fir during pyrolysis in an inert atmosphere and at different ambient pressures. Proc. Combust. Inst. 2017, 36, 3185–3194. [Google Scholar] [CrossRef]
  27. Li, K.; Mousavi, M.; Hostikka, S. Char cracking of medium density fibreboard due to thermal shock effect induced pyrolysis shrinkage. Fire SAfety J. 2017, 91, 165–173. [Google Scholar] [CrossRef]
  28. Tardif, J.C.; Conciatori, F. Microscopis Exmination of Wood: Sample Preparation and Techniques for Light Microscopy; Springer: Cham, Switzerland, 2015; pp. 373–415. [Google Scholar]
  29. Jones, B.; Tardif, J.; Westwood, R. Weekly xylem production in trembling aspen (Populus tremuloides) in response to artificial defoliation. Can. J. Bot. 2004, 82, 590–597. [Google Scholar] [CrossRef]
  30. Heinrichs, D.K.; Tardif, J.C.; Bergeron, Y. Xylem production in six tree species growing on an island in the boreal forest region of western Quebec, Canada. Can. J. Bot. 2007, 85, 518–525. [Google Scholar] [CrossRef]
  31. Waito, J.; Conciatori, F.; Tardif, J.C. Frost Rings and White Earlywood Rings in Picea Mariana trees from the boreal plains, Central Canada. IAWA J. 2013, 34, 71–87. [Google Scholar] [CrossRef]
  32. Au, R.; Tardif, J.C. Allometric relationships and dendroecology of the dwarf shrub Dryas integrifolia near Churchill, subarctic Manitoba. Can. J. Bot. 2007, 85, 585–597. [Google Scholar] [CrossRef]
  33. Le, T.D.; Thasi, M.T. Experimental Assessment of the Fire Resistance. Materials 2019, 12, 4003. [Google Scholar] [CrossRef]
  34. Buchanan, A.H.; Abu, A.K. Structural Design for Fire Safety, 2nd ed.; Wiley: Dunedin, FL, USA, 2017. [Google Scholar]
  35. ASTM D1106-96; Standard Test Method for Acid-Insoluble Lignin in Wood. ASTM International: West Conshohocken, PA, USA, 2017.
  36. Wise, L.E.; Murphy, M.; Adieco, A.D.D. Chlorite holocellulose, its fractionnation and bearing on summative wood analysis and on studies on the hemicelluloses. Pap. Trade J. 1946, 122, 35–43. [Google Scholar]
  37. ASTM D1107-96; Standard Test Method for Ethanol-Toluene Solubility of Wood. ASTM International: West Conshohocken, PA, USA, 2007.
  38. Nelson, M.L.; O’Connor, R.T. Relation of certain infrared bands to cellulose crystallinity and crystal latticed type. Part I. Spectra of lattice types I, II, III and of amorphous cellulose†. J. Appl. Polym. Sci. 1964, 8, 1311–1324. [Google Scholar] [CrossRef]
  39. STN ISO 1928:2003-07; Solid Fuels. Determination of Gross Caloric Value and Calculation of Heating. ISO: Geneva, Switzerland, 2003.
  40. Wang, Y.; Wang, W.; Zhou, H.; Qi, F. Burning characteristics of ancient wood from traditional buildings in Shanxi Province. Forests 2022, 13, 190. [Google Scholar] [CrossRef]
  41. Hadvig, S. Charring of Wood in Buildings Fire: Practice, Theory, Instrumentation, Measurement; Technical University in Denmark: Lyngby, Denmark, 1981; p. 238. [Google Scholar]
  42. Martinka, J.; Rantuch, P.; Liner, M. Calculation of charring rate and char depth of spruce and pine wood from mass loss. J. Therm. Anal. Calorim. 2018, 132, 1105–1113. [Google Scholar] [CrossRef]
  43. Waliszewska, B.; Prądzyński, W.; Zborowska, A.; Stachowiak-Wencek, A.; Waliszewska, H.; Spek-Dźwigała, A. The diversification of chemical composition of pine wood depending on the. For. Wood Technol. 2015, 91, 182–187. [Google Scholar]
  44. Campbell, A.G.; Kim, W.-J.; Koch, P. Chemical Variation in Lodgepole Pine with Sapwood/Heartwood, Stem Height, and Variety. Wood Fiber Sci. 1990, 22, 22–30. [Google Scholar]
  45. Nuopponene, M.; Vuorinen, T.; Jämsä, S.; Viitaniemi, P. Thermal Modifications in Softwood Studied by FT-IR and UV Resonance Raman Spectroscopies. J. Wood Chem. Technol. 2005, 24, 13–26. [Google Scholar] [CrossRef]
  46. Boonstra, M.J.; Tjeerdsma, B. Chemical analysis of heat treated softwood. Holz Roh- Werkst. 2006, 64, 204–211. [Google Scholar] [CrossRef]
  47. Esteves, B.; Videira, R.; Pereira, H. Chemisty analysis of heat treated pine wood extractives. Wood Sci. Technol. 2011, 45, 661–667. [Google Scholar] [CrossRef]
  48. Mbakidi-Ngouaby, H.; Pinault, E.; Gloaguen, V.; Costa, G.; Sol, V.; Millot, M.; Mambu, L. Profiling and seasonal variation of chemical constituents from Pseudotsuga menziesii wood. Ind. Crops Prod. 2018, 117, 34–49. [Google Scholar] [CrossRef]
  49. Dorez, G.; Ferry, L.; Sonnier, R.; Taguet, A.; Lopez-Cuesta, J.M. Effect of cellulose, hemicellulose and lignin contents on pyrolysis and combustion of natural. J. Anal. Appl. Pyrolysis 2014, 107, 323–331. [Google Scholar] [CrossRef]
  50. Kim, D.; Park, K.Y.; Yoshikawa, K. Conversion of Municipal Solid Wastes into Biochar through Hydrothermal Carbonization. In Engineering Applications of Biochar; InTechOpen: London, UK, 2017. [Google Scholar]
  51. Demirbas, A. Higher heating values of lignin types from wood and non-wood lignocellulosic biomasses. Energy Sources 2017, 39, 592–598. [Google Scholar] [CrossRef]
  52. Maksimuk, Y.; Antonava, Z.; Krouk, V.; Korsakava, A.; Kursevich, V. Prediction of Higher Heating Value Based on Elemental Composition for Lignin and Other Fuels. Fuel 2020, 263, 116727. [Google Scholar] [CrossRef]
  53. Srinivas, K.; Pandey, K.K. Photodegradation of thermally modified wood. J. Photochem. Photobiol. B Biol. 2012, 117, 140–145. [Google Scholar] [CrossRef] [PubMed]
  54. Kotilainen, R.A.; Toivanen, T.-J.; Alén, R.J. FTIR Monitoring of Chemical Changes in Softwood During Heating. J. Wood Chem. Technol. 2000, 20, 307–320. [Google Scholar] [CrossRef]
  55. Michell, A.; Higgins, H. Infrared Spectroscopy in Australian Forest Products Research; CSIRO Forestra and Forest Products: Melbourne, Australia, 2002; p. 60. [Google Scholar]
  56. Özgenç, Ö.; Durzam, S.; Boyc, I.H.; Eski-Kocak, H. Determination of chemical changes in heat-treated wood using ATR-FTIR and FT Raman spectrometry. Spectrochim. Acta Part A Mol. Biomol. Spectrosc. 2017, 17, 395–400. [Google Scholar] [CrossRef] [PubMed]
Figure 1. Experimental setup of the medium-scale test, the position of thermocouples (historical wood sample-sample 20S/170H).
Forests 15 01189 g001
Figure 2. Degradation zones in a section of burnt wood [13].
Forests 15 01189 g002
Figure 3. Radial cross-section of historical pine wood. The scale is denoted in the lower right corner of the figure and it is 50 μm.
Forests 15 01189 g003
Figure 4. Temperature development recorded on the exposed side of the test sample (10 mm and 20 mm).
Forests 15 01189 g004
Figure 5. Temperature development recorded on the exposed side of the test sample (30 mm, 40 mm, and 50 mm).
Forests 15 01189 g005
Figure 6. The comparison of the dependence of the char layer formed on historical wood by a medium-scale test and the char layer formed on current wood from the research of Fonseca and Barreira [13].
Forests 15 01189 g006
Figure 7. Cross-sections of the samples (a) before thermal loading and (b) after thermal loading.
Forests 15 01189 g007
Figure 8. The exposed side of the sample after thermal loading.
Forests 15 01189 g008
Figure 9. The relative content of holocellulose (HC), lignin (LIG), and extractives (EL) in heartwood (HW) and sapwood (SW) of pine.
Forests 15 01189 g009
Figure 10. Heat of combustion and calorific value in pine heartwood and sapwood.
Forests 15 01189 g010
Figure 11. Changes in the heat of combustion by the content of extractives (EL-HW are extractives in heartwood, EL-SW are extractives in sapwood).
Forests 15 01189 g011
Figure 12. Changes in the heat of combustion and the content of lignin and holocellulose (LIG-HW is lignin in heartwood, HC-HW is holocellulose in heartwood, LIG-SW is lignin in sapwood, HC-SW is holocellulose in sapwood).
Forests 15 01189 g012
Figure 13. FTIR spectra of the pine heartwood after thermal loading (blue line—67 °C, red line—272 °C, green—529 °C, orange—717 °C).
Forests 15 01189 g013
Table 1. Instantaneous charring rate at a depth of 10, 20, 30 mm from the exposed side.
Distance from the Exposed Side
[mm]
Sample 50S/140H
[mm·min−1]
Sample 20S/170H
[mm·min−1]
101.29 ± 0.153.16 ± 0.30
201.14 ± 0.091.90 ± 0.18
300.99 ± 0.051.08 ± 0.06
Table 2. Temperatures recorded in the 3600th second of a medium-scale test.
TC1 (°C)TC2 (°C)TC3 (°C)TC4 (°C)TC5 (°C)
Sample 50S/140H739.4716.4546.7262.9108.8
Sample 20S/170H743.1716.7529.0271.967.1
Disclaimer/Publisher’s Note: The statements, opinions and data contained in all publications are solely those of the individual author(s) and contributor(s) and not of MDPI and/or the editor(s). MDPI and/or the editor(s) disclaim responsibility for any injury to people or property resulting from any ideas, methods, instructions or products referred to in the content.

