Article

Repeated Mild Summer Drought in Crataegus monogyna Jacq. Provokes Compensation Growth in the Following Year

by
Kristine Vander Mijnsbrugge
1,*,
Stefaan Moreels
1,
Laura Decorte
1,
Marie Stessens
1 and
Eduardo Notivol Paino
2
1
Department of Forest Ecology and Management, Research Institute for Nature and Forest, 9500 Geraardsbergen, Belgium
2
Department for Environment, Agricultural and Forest Systems, Agri-Food Research and Technology Centre of Aragon (CITA), 50059 Zaragoza, Spain
*
Author to whom correspondence should be addressed.
Forests 2024, 15(7), 1234; https://doi.org/10.3390/f15071234
Submission received: 25 June 2024 / Revised: 11 July 2024 / Accepted: 13 July 2024 / Published: 16 July 2024

Abstract

:
Water limitations will pose significant challenges to forest ecosystems across Europe. To gain a deeper understanding of the potential impacts, we investigated the response of the common shrub Crataegus monogyna to two summer droughts, each followed by rewatering. The experimental design consisted of a common garden with potted saplings from a local Belgian (n = 48), a Swedish (n = 47), and a Spanish-Pyrenean provenance (n = 48). We quantified the effects on growth and leaf phenology, focusing on the legacies in the year following the droughts. Responses were influenced by the severity of the drought and by its timing. Most strikingly, height increment was enhanced by 24% (p = 0.046) in comparison to the controls in the year following the droughts in the group of plants that endured the two drought treatments, each time without developing visible stress symptoms. Only one such mild drought, whether early or late summer, did not lead to this response, suggesting stress memory acting as a growth promoter. A late summer drought that resulted in visible drought symptoms led to a reduced diameter increment in the year following the droughts, independent of the preceding treatment (severe, mild, or no drought), whereas this was not the case for a similar drought in early summer. Minor leaf phenological responses were detected in the year following the droughts. Finally, the non-local provenances did not respond in a deviating way to the droughts compared to the local provenance. Our findings contribute to the prediction of carbon sequestration in forests and other woody vegetations in the temperate regions of Europe.

1. Introduction

Forests play a fundamental role in hydrological and biogeochemical cycles, offering a wide array of ecosystem services crucial for biodiversity conservation and maintenance [1,2]. The escalation of extreme weather events such as heatwaves, droughts, and storms due to climate change can heighten tree mortality rates, potentially resulting in a net release of atmospheric CO2. Among these events, drought and its associated disturbances exert the most substantial global impact on forests [3,4]. It is hypothesized that trees may not readily adapt to abrupt aridity increases through evolutionary mechanisms, given their long reproductive cycles and limited ability to migrate away from stressful conditions. The looming threat of prolonged and intensified droughts due to global warming justifies the study of the effects of drought on woody plants [4,5].
During drought conditions, plants eventually experience desiccation, which leads to a decrease in cell turgor pressure, resulting in the closure of stomatal pores on leaf surfaces. This closure significantly slows down the dehydration process [6]. Studies indicate that in trees, stomata typically close before significant cavitation in the hydraulic system occurs, at the expense of negative impacts of stomatal closure, such as reduced carbon assimilation [7]. However, additional water loss can still occur through cuticular conductance, stomatal leakiness, and other tissues like bark [7].
Plant hydraulic strategies are finely tuned to their environmental conditions, aiming to maximize carbon assimilation while avoiding hydraulic failure during drought stress. Leaf shedding is a common adaptive strategy during drought conditions, considered vital for plant survival [8]. Typically, leaf shedding occurs after stomatal closure [7], with xylem embolism in the leaves serving as a primary driver of leaf mortality during drought [9,10,11]. This shedding reduces the evaporative leaf surface area, helping woody perennials delay cavitation initiation in stem conductive tissues [12,13]. Consequently, it eases water stress on the remaining foliage, slowing desiccation rates [14,15]. However, shedding leaves without complete nutrient resorption leads to net nutrient losses, affecting long-term tree performance [16]. Rebuilding a damaged crown after severe drought requires additional carbon investment, either from non-structural carbohydrate reserves or from assimilation of remaining or newly grown leaves after the drought stress [17].
While there has been significant attention on understanding the physiological factors leading to tree mortality during drought, it is equally important to grasp the mechanisms involved in the recovery of drought [18]. Drought resilience can be measured by assessing both the impact of the disturbance and the rate of recovery following it [19]. If little or no cavitation has occurred, recovery after rainfall is rapid, with stomata reopening to assimilate new carbon as plants rehydrate. However, when cavitation thresholds are exceeded, photosynthetic recovery is considerably slower [20]. In summary, summer drought significantly impacts the growth, gas exchange, and photosynthetic performance of both shrubs and trees, including differences in drought tolerance strategies among co-occurring species [21,22].
Drought and heat pose a threat to ecosystem carbon uptake, which currently helps in mitigating the rising atmospheric CO2 levels by offsetting human-caused fossil fuel emissions [23]. Reduced forest carbon uptake during drought and heat comes from stress-related declines in photosynthesis [24]. While the connection between drought and reduced carbon uptake is well-documented, several key questions remain [23]. These include the impact of recurrent droughts, the strength of seasonal and regional compensation effects, land–atmosphere feedbacks that can intensify heatwaves, and forest management strategies in a changing climate.
In this study, we conducted a controlled recurrent drought experiment using three provenances of Crataegus monogyna Jacq. in a common garden setting. C. monogyna, commonly known as hawthorn, is a shrub species traditionally and widely planted in hedgerows in the temperate regions of Europe. Despite being a common shrub, hawthorn has been relatively neglected both in scientific research on woody species, as it holds no economic value in the forestry sector, and in conservation efforts, which typically prioritize rare species [25]. Apart from in situ measurements of physiological traits [26] or secondary metabolites in Crataegus spp. [27] in relation to drought, this study describes an experimental drought in controlled conditions, focusing on growth responses.
Potted saplings were exposed to water deprivation during early and/or late summer within the same growing season, followed by rewatering. This experimental setup allowed us to investigate the potential impact of prior drought exposure. We hypothesized that the response to the imposed drought would be influenced by (i) the severity of the drought and (ii) whether saplings had previously experienced a drought. In addition, we hypothesized that (i) drought not only leads to above-ground growth reduction but can also act as an above-ground growth stimulus, and that (ii) different provenances may react in a different way to imposed drought regimes. Our main objective was to understand the post-drought recovery process, focusing specifically on the effects on growth traits and leaf phenology in the year following the drought. The common garden setting provided a controlled environment for assessing variability among the different provenances.

2. Materials and Methods

2.1. Plant Material

Our study species is Crataegus monogyna. It is widespread across nearly all of Europe, thriving on soils with moderate pH, nutrient levels, and water supply [28]. In May and June, the shrubs bloom abundantly, offering pollen and nectar to various insects. By August, the shrubs bear numerous berries that are a food source for many birds [28]. Hawthorn is extensively planted in hedgerows, wooded banks, and the edges and understory of forest stands in Belgium to enhance species diversity, restore historical landscapes, and support wildlife [25,29].
We utilized 143 C. monogyna plants belonging to three provenances (48 plants from a local Belgian provenance, 48 plants from a Spanish-Pyrenean provenance, and 47 plants from a south-Swedish provenance). The seed collection process is already outlined in [30], as C. monogyna was collected in the same growth environments as described for Prunus spinosa. Seeds were gathered in 2016 and germinated in 2018 (C. monogyna seeds need a relative long stratification time). In the first growing season, the seedlings remained in forestry trays (54.5 × 31 cm with 28 cells) filled with standard nursery potting soil composed of 1.5 kg/m3 NPK 12 + 14 + 24, 20% organic matter, pH levels ranging from 5.0 to 6.5, an electrical conductivity (E.C.) of 450 µS/cm, and dry matter content of 25%. No additional fertilizer was added to the potting soil. In the winter of 2018, the seedlings were transferred to 1 L pots, using the same standard potting soil, without additional fertilizer. A common garden of potted seedlings was established in 2019 on an outdoor container field situated at the Research Institute for Agriculture and Fisheries in Melle, Belgium, where the pots were watered using automated sprinklers that were programmed and monitored by experienced technical staff. The three provenances were individually mingled (single tree plot design).

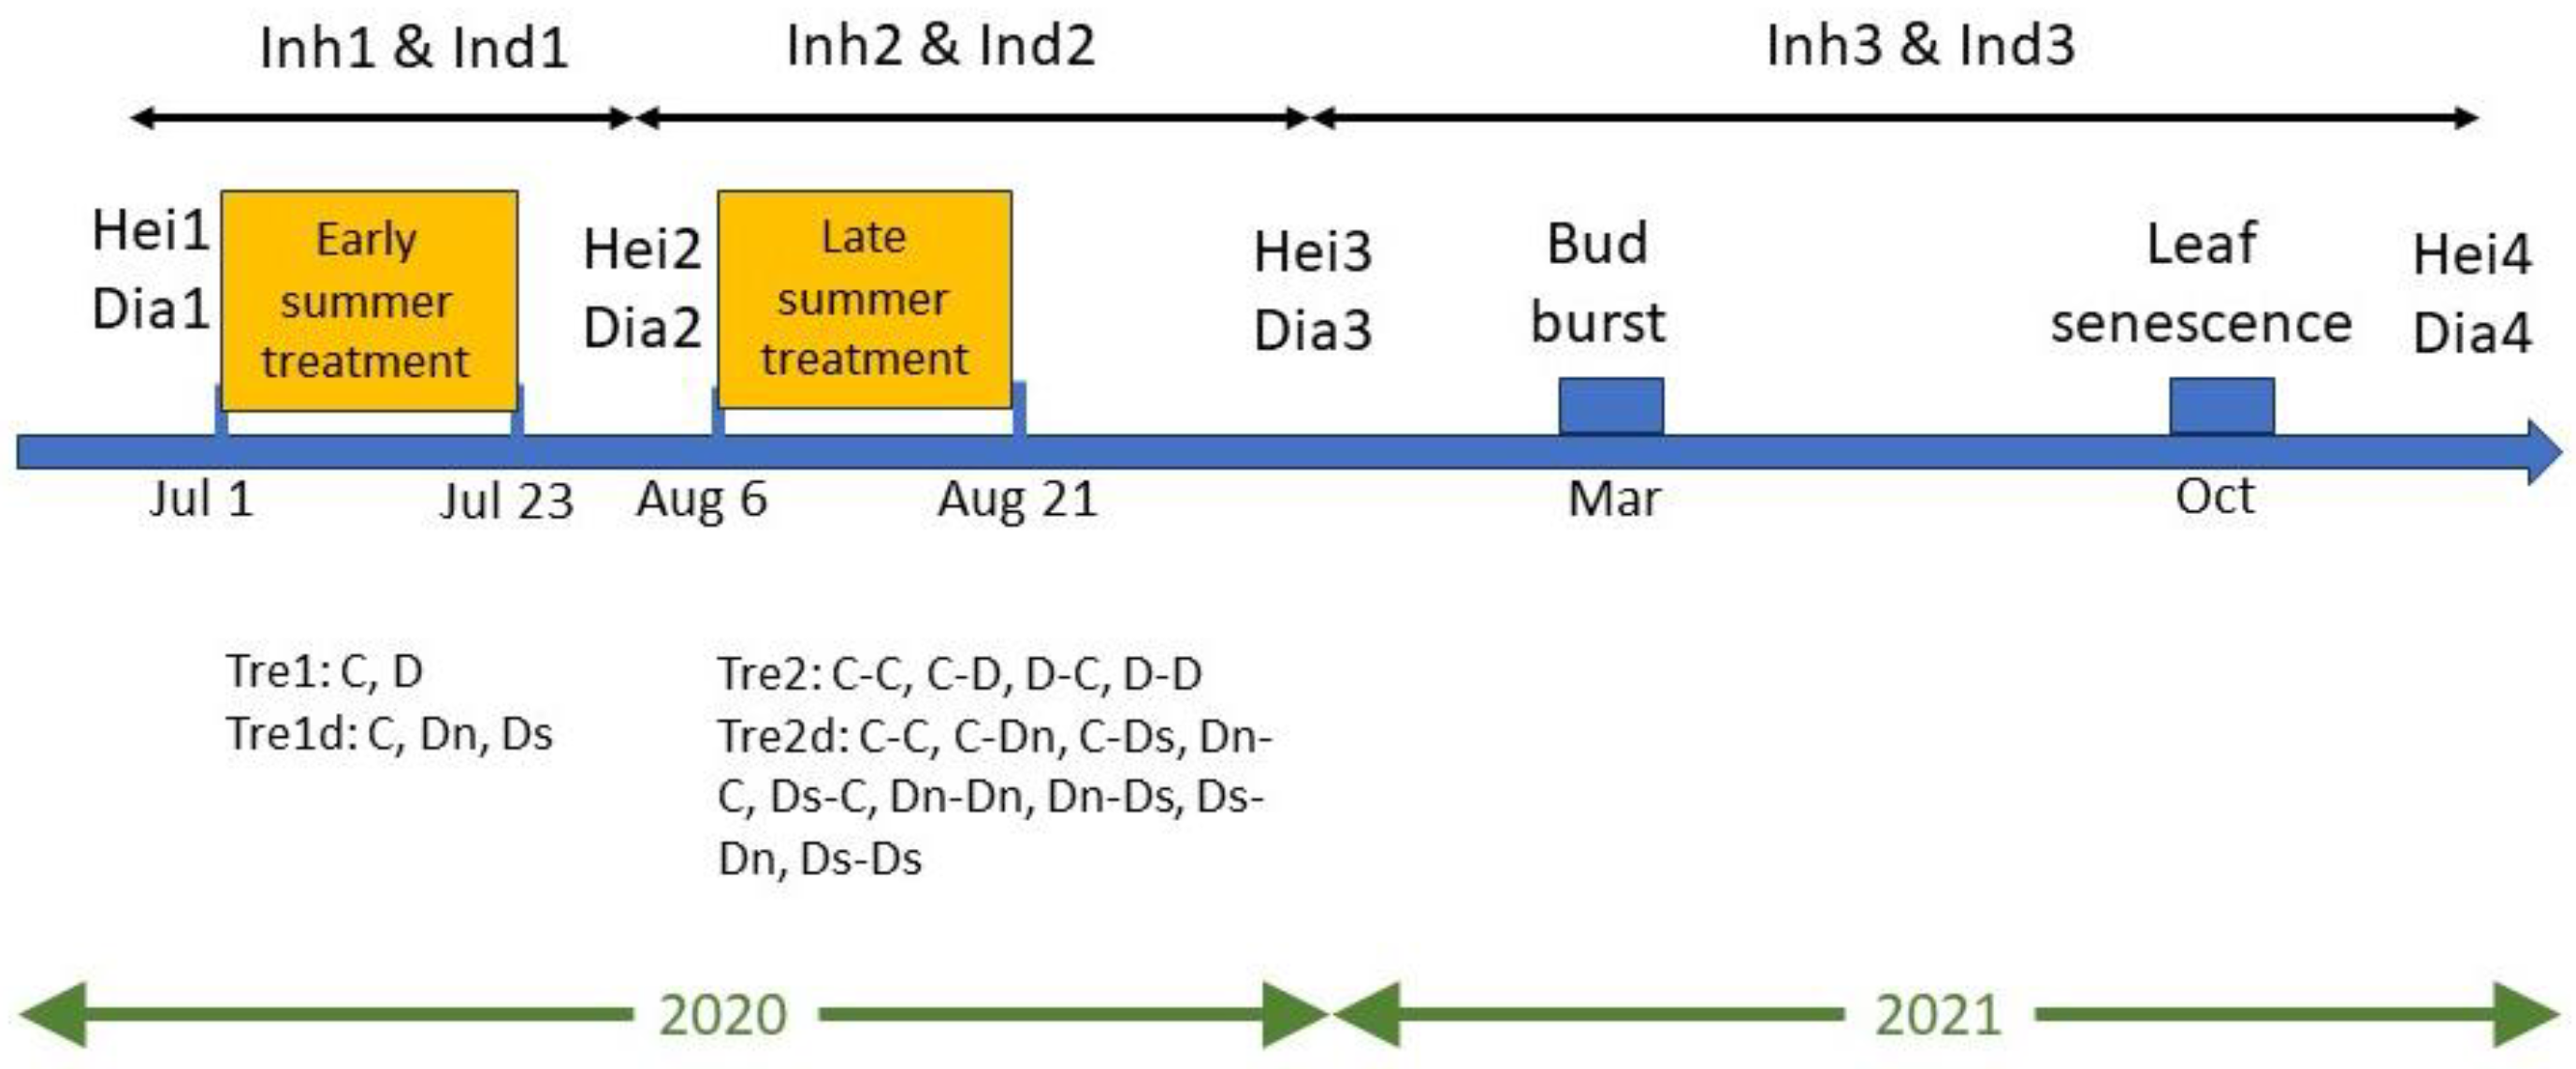
2.2. Drought Treatments

In mid-June 2020, we transferred all potted plants from the container field to a greenhouse equipped with an automatic grey shade net to shield the plants from intense solar radiation. Monthly mean temperatures in the greenhouse for July till September were 21.8, 24.3, and 19.7 °C, whereas the mean relative humidity was 54.8, 55.3, and 60%, respectively. We conducted controlled drought treatments during early and late summer of 2020 following a full-factorial design (Figure 1). The early summer treatment was conducted from 1 July to 23 July, while the late summer treatment ran from 6 August to 21 August. To avoid mortality, both treatments were ended when several plants displayed (nearly) total leaf desiccation. At the beginning and at the end of each treatment, we ensured all plants, both control and drought treated, were fully hydrated by immersing the pots overnight in a water basin, with the water level maintained at 5 cm above the pot base. Subsequently, excess water was allowed to drain naturally. In this way, field capacity was approached.
For the initial early summer treatment, half of the young plants (designated as the drought group D, n = 72, each provenance with 24 plants) were subjected to water withholding, while the other half (the control group C, n = 71, each provenance with 24 or 23 plants) received regular watering by skilled personnel to maintain optimal moisture levels. In the subsequent late summer treatment, we divided both the control and drought groups from the early summer treatment into halves, with each half then assigned to either the control or the drought condition for the late summer treatment (Figure 1). The four experimental groups resulting from this design are referred to as control-control (C-C), control-drought (C-D), drought-control (D-C), and drought-drought (D-D). The allocation of the three provenances was evenly distributed among the control and drought groups for both the early and late summer treatment.
After the two treatments, the plants were kept in the greenhouse until October 2020, ensuring they were consistently maintained under well-watered conditions as monitored by experienced technical staff. In October 2020, they were transferred back to the container field outside. All treatment groups were individually intermingled.

2.3. Measurements and Observations

We conducted several measurements and observations throughout the experiment. We weighed all pots at the beginning of each drought treatment, after drainage of excess water following the overnight soaking in water (proxy for field capacity), and more or less weekly thereafter during the treatments. The reduction in pot weight served as an indicator of water scarcity (Figure 2).
Height and diameter measurements were taken at the start of each treatment (1 July and 6 August) and at the end of 2020 (20 December for diameter) or at the beginning of the growing season in 2021 (25 March for height) (Figure 3). Height was measured up to the still-living part of the plant. Height measurements in December 2020 were considered less reliable as it was visually less clear if top parts of stems had died off. This became unmistakable at the spring bud burst in 2021. We measured the stem diameter using a measuring rod positioned 2 cm above the soil level. At the end of the growing season of 2021, height and diameter were measured once more. We calculated the increment height and diameter by subtracting the height and diameter on 1 July from the ones on 6 August for the early summer treatment, by subtracting the height and diameter on August 6 from the ones in the winter between 2020 and 2021 for the late summer treatment, and by subtracting the height and diameter in the winter between 2020 and 2021 from the ones at the end of 2021 for the following growing season.
We assessed the presence/absence of visual drought symptoms on the plants, i.e., the desiccation of leaves, about one week after the end of each treatment (29 July and 28 August). At this time, affected leaves would not regain turgor and revive anymore. Based on this assessment, the groups of plants in both drought treatments were divided in subgroups: whether or not they were displaying visual drought symptoms (Ds and Dn, respectively). This resulted in the following number of plants in each treatment group: 36 in C-C, 13 in C-Dn, 23 in C-Ds, 25 in Dn-C, 11 in Ds-C, 17 in Dn-Dn, 7 in Dn-Ds, 8 in Ds-Dn, and 3 in Ds-Ds. Because of the low number, results from the Ds-Ds group are shown for completeness but are not discussed.
Bud burst in the spring of 2021 was evaluated following a scoring protocol with 1: buds in rest, 2: buds swelling and changing colour from brown/red to white and green, 3: buds opening and first leaves protruding but not yet unfolding, 4: leaves unfolding, and 5: leaves unfolded and enlarged [25]. Bud burst was scored on 5, 15, and 26 March and 6 April. Leaf senescence in the autumn of 2021 was observed using a scoring protocol with 1: green leaves, 2: leaves light green, 3: less than half of the leaves becoming brown, 4: more than half of the leaves becoming brown, and 5: all leaves brown and starting to fall off [31]. This phenophase was scored on 19 September and 18 October. For both phenological traits, the whole plant (i.e., all buds or all leaves) was evaluated and a mean score was given.

2.4. Statistical Analysis

We utilized the open-source statistical software R [32] for all data analyses. We employed linear models for height and diameter or the change in height and diameter (increments) and we processed the phenological observations, which are ordinal data, using cumulative logistic regression in the package ordinal [33]. Figures were generated using ggplot2 [34]. For the phenological data, we included a unique plant identifier as a random effect in the mixed-effect models to address repeated observations on the same plants.
To evaluate the effects of the droughts on the growth of the plants, we modelled the change in height and diameter over different time spans (increment response variables), each time taking into account the initial height and diameter. For each response variable, we first looked at the influence of the treatment, distinguishing the effects of mild (having no visual drought stress symptoms at the end of the treatment) or more severe (having visual drought stress symptoms) drought. The treatment variables (Tre1d or Tre2d) consisted of three (C, Dn, and Ds for the first treatment) or nine levels (C-C, C-Dn, C-Ds, Dn-C, Ds-C, Dn-Dn, Dn-Ds, Ds-Dn, and Ds-Ds for the first and second treatment). Secondly, we questioned whether the change in height or diameter due to the treatments differed between the provenances (Pro). In other words, we looked at significant interaction terms between provenance and treatment in the models. The amount of plants in the experiment was not large enough to distinguish in these provenance models between mild and more severe drought. Therefore, the treatment variables in these provenance models (Tre1 or Tre2) consisted of two (C and D for the first treatment) or four levels (C-C, C-D, D-C, and D-D for the second treatment).
Height (Hei1) and diameter (Dia1) at the start of the experiment were modelled to look for initial growth differences between the provenances:
Hei1 = β0 + β1Pro
Dia1 = β0 + β1Pro
The change in height (Inh1) and diameter (Ind1) during the early summer treatment was modelled:
Inh1 = β0 + β1Tre1d + β2Hei1
Ind1 = β0 + β1Tre1d + β2Dia1
Influence of provenance:
Inh1P = β0 + β1Tre1 × β2Pro + β3Hei1
Ind1P = β0 + β1Tre1 × β2Pro + β3Dia1
The change in height (Inh2) and diameter (Ind2) during and after the late summer treatment was modelled:
Inh2 = β0 + β1Tre2d + β2Hei2
Ind2 = β0 + β1Tre2d + β2Dia2
Influence of provenance:
Inh2P = β0 + β1Tre2 × β2Prov + β3Hei2
Ind2P = β0 + β1Tre2 × β2Prov + β3Dia2
The change in height (Inh3) and diameter (Ind3) during the growing season of 2021 was modelled:
Inh3 = β0 + β1Tre2d + β2Hei3
Ind3 = β0 + β1Tre2d + β2Dia3
Influence of provenance:
Inh3P = β0 + β1Tre2 × β2Prov + β3Hei3
Ind3P = β0 + β1Tre2 × β2Prov + β3Dia3
We looked for carry-over effects of the treatments on the leaf phenological traits bud burst (Bud) and leaf senescence (Sen) in the year after the treatments. We modelled the chance (pbud) that a plant on a given day had already reached a given bud burst score, or a score higher than this. Similarly, we modelled the chance (psen) that the leaves of a plant on a given day were still in a given senescence score level or in a level lower than this.
(pbud/1-pbud) = β0 − β1Day − β2Tre2d − β3Hei3
(psen/1-psen) = β0 − β1Day − β2Tre2d − β3Hei4
Influence of provenance:
(pbudP/1-pbudP) = β0 − β1Day − β2Tre2 × β3Prov − β4Hei3
(psenP/1-psenP) = β0 − β1Day − β2Tre2 × β3Prov − β4Hei4

3. Results

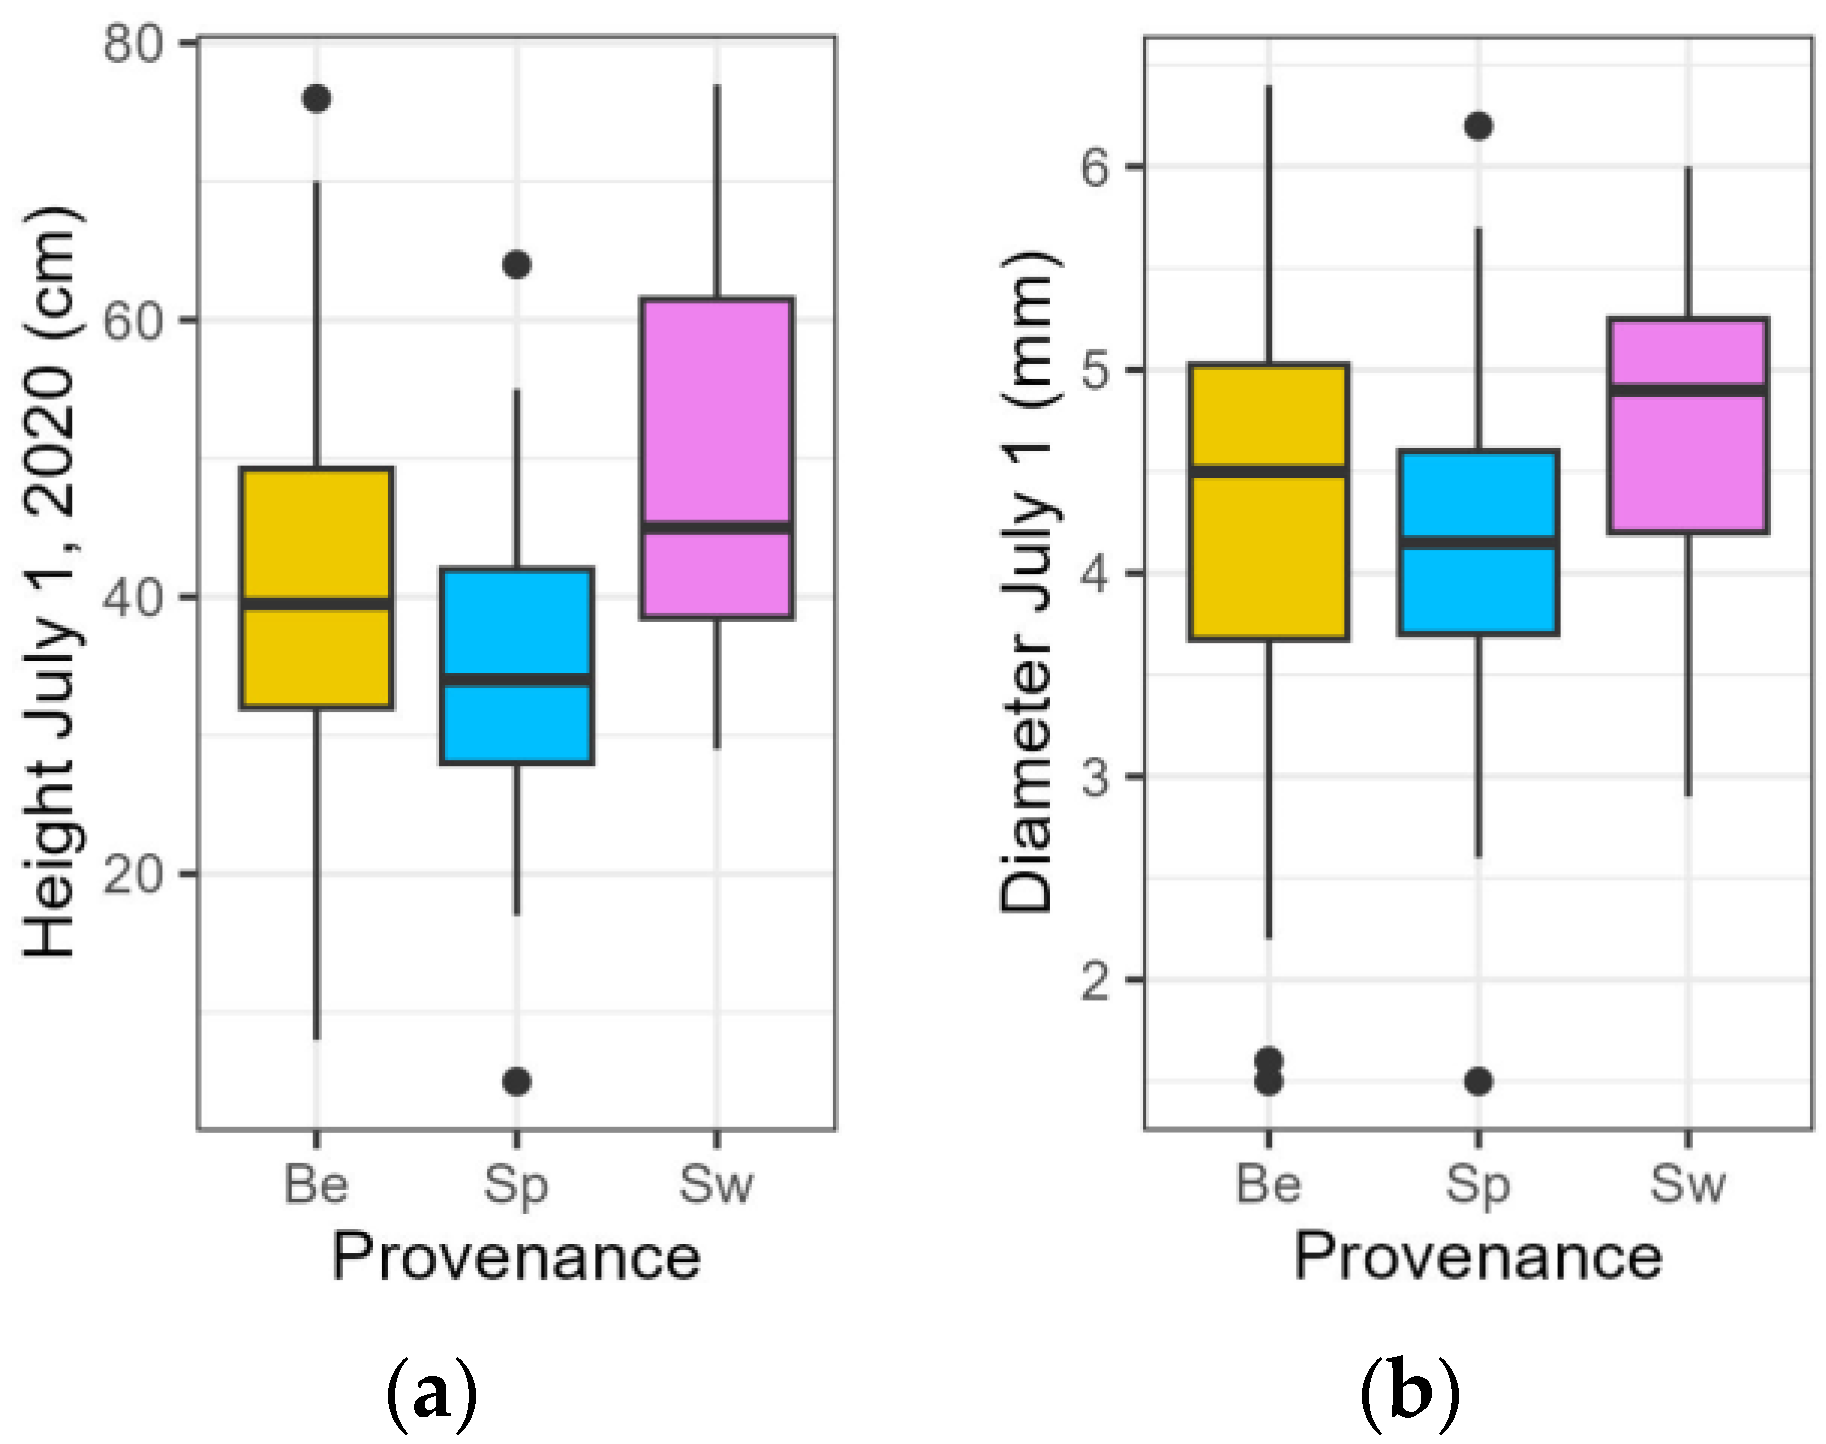
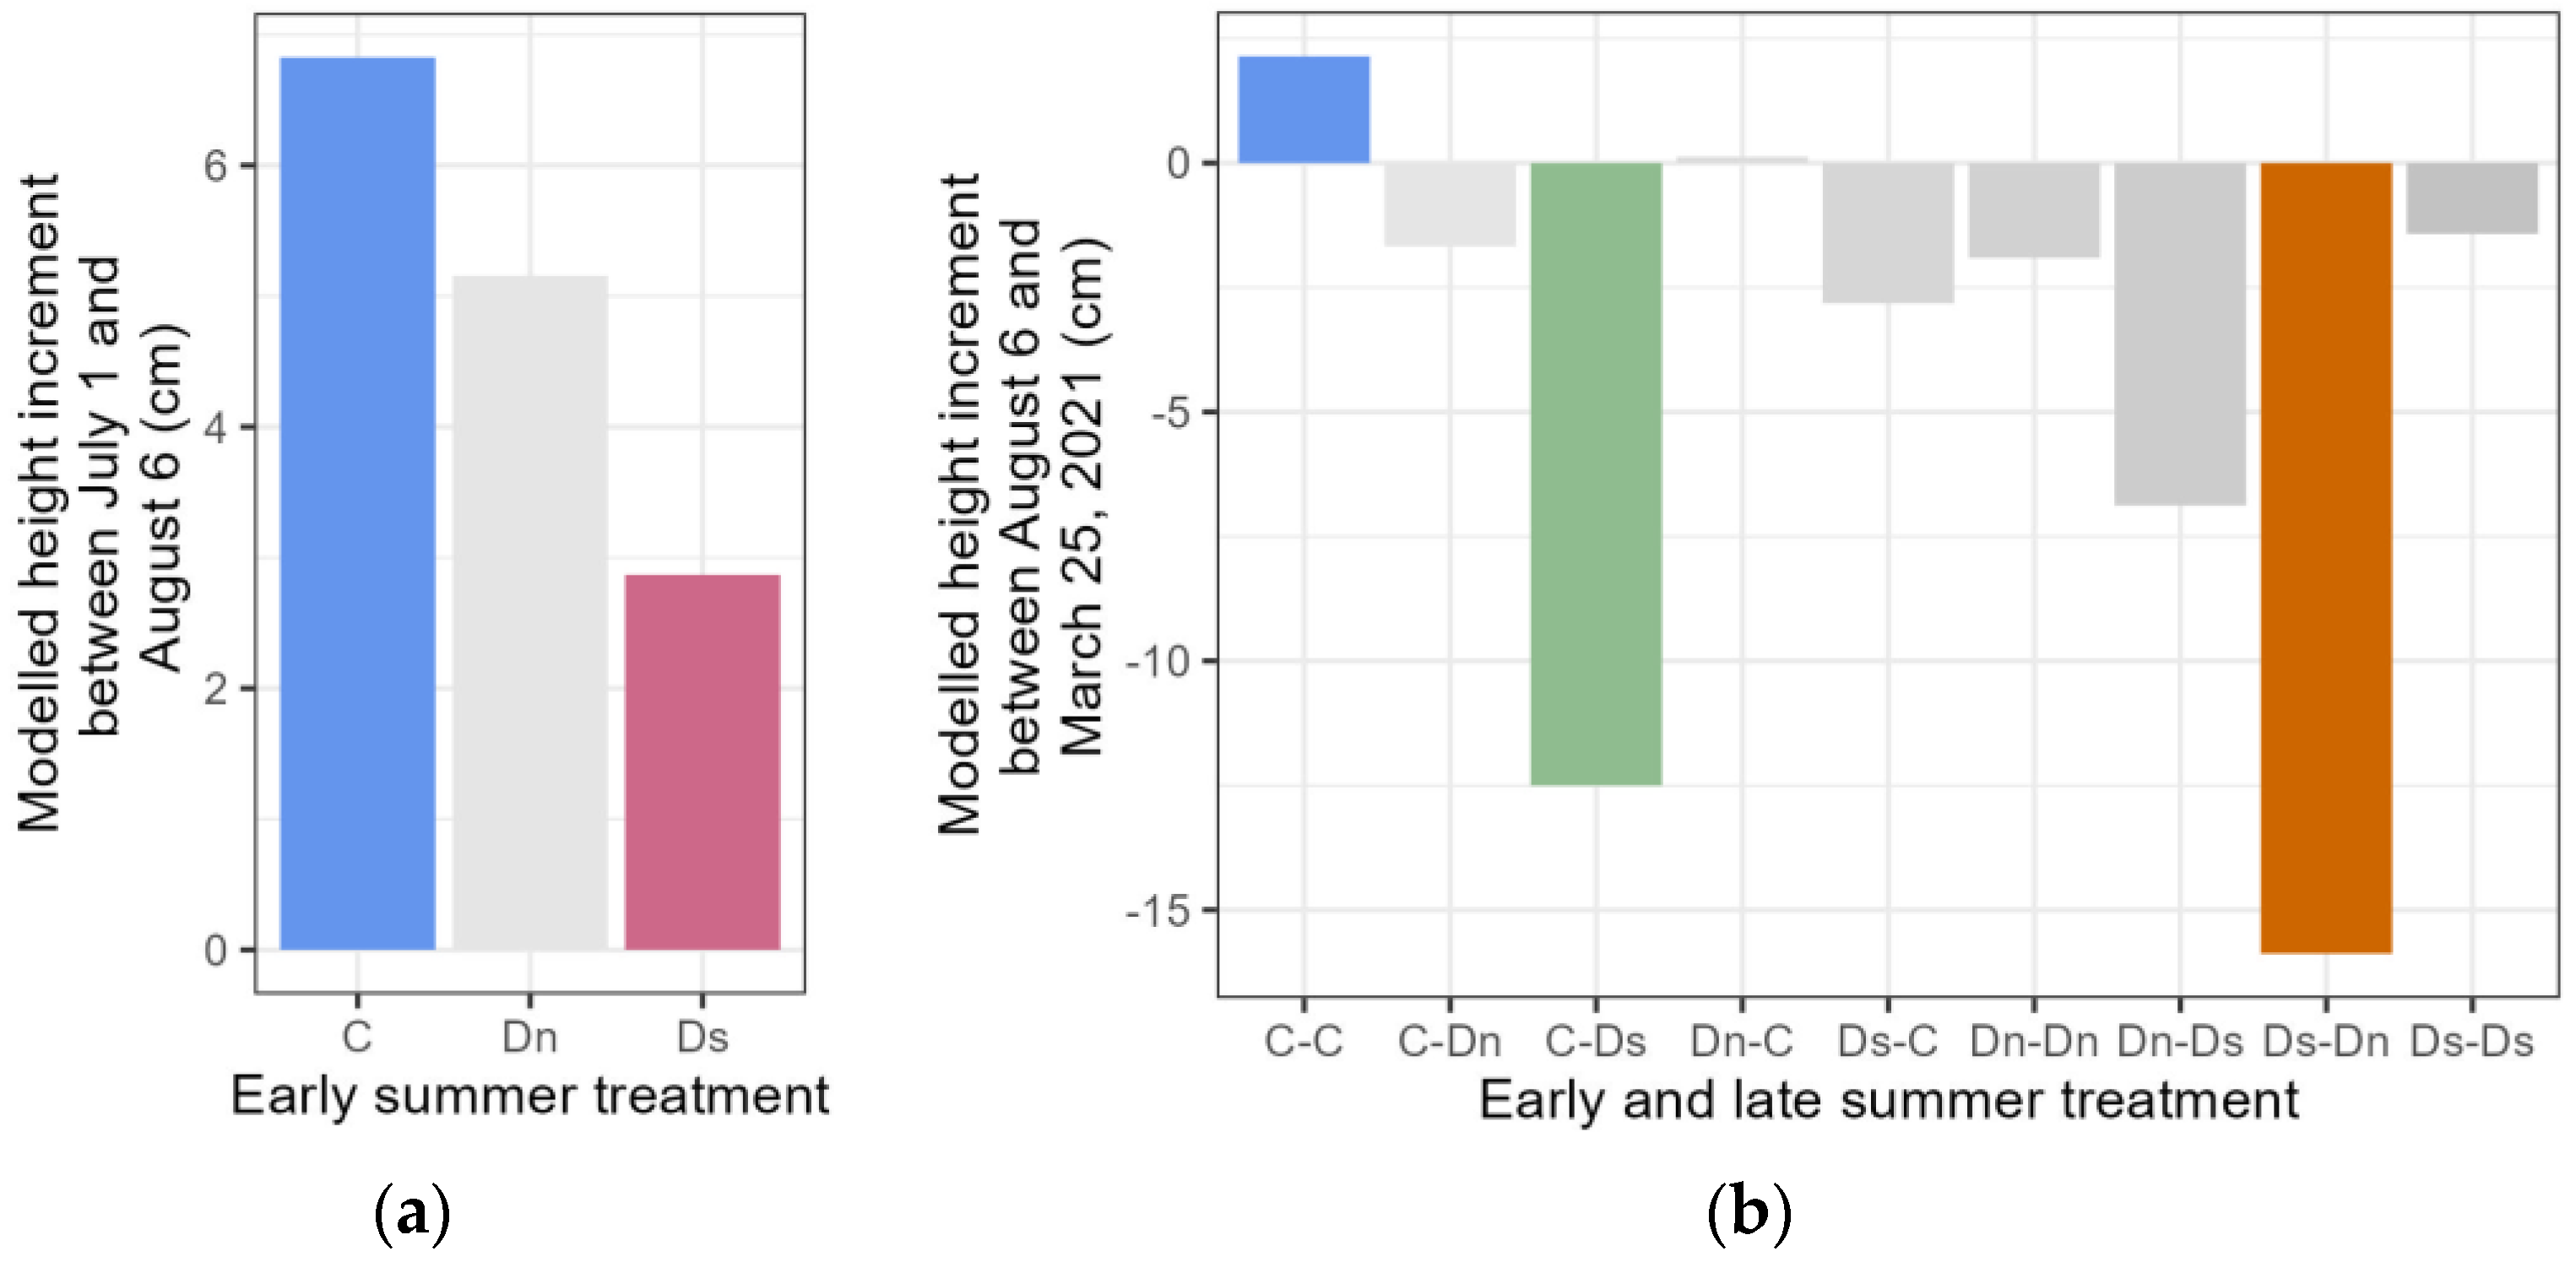
3.1. Growth Traits in the Year of the Drought Treatments

At the start of the early summer drought, the Belgian provenance was higher than the Spanish one but shorter than the Swedish one (Table 1, Figure 4a). The diameter of this local provenance was still smaller than the diameter of the Swedish provenance, but there was no significant difference between the diameters of the local and the Spanish provenance (Table 1, Figure 4b).
When considering plants of equal height (height is a co-factor in the model), the early summer drought caused a smaller height increment between 1 July and 6 August in the group of saplings that displayed leaf desiccation symptoms due to the drought (significant treatment group Ds in Table 2, Figure 5a). The Spanish-Pyrenean and Swedish provenances did not show a deviating response to this early summer drought compared to the Belgian one (no significant interaction term between provenance and treatment in Table 2). For the diameter increment between 1 July and 6 August, no influence of the treatment was present (no significant treatment groups in Table 2) and the provenances also reacted in a similar manner to the treatment (no significant interaction term between provenance and treatment in Table 2).
Due to the late summer drought, a reduction in height increment, as measured between 6 August and 25 March of 2021, was observed in the C-Ds and Ds-Dn groups (significant treatment groups in Table 3, Figure 5b) because of top parts dying off. Similar to the early summer drought treatment, the Spanish-Pyrenean and Swedish provenances did not respond differently to the late summer drought compared to the Belgian one (no significant interaction term between provenance and treatment groups in Table 3). For the diameter increment between 6 August and 20 December, no influence of the treatment was present (no significant treatment groups in Table 3) and the provenances also reacted in a similar manner to the treatments (no significant interaction terms between provenance and treatment in Table 3).

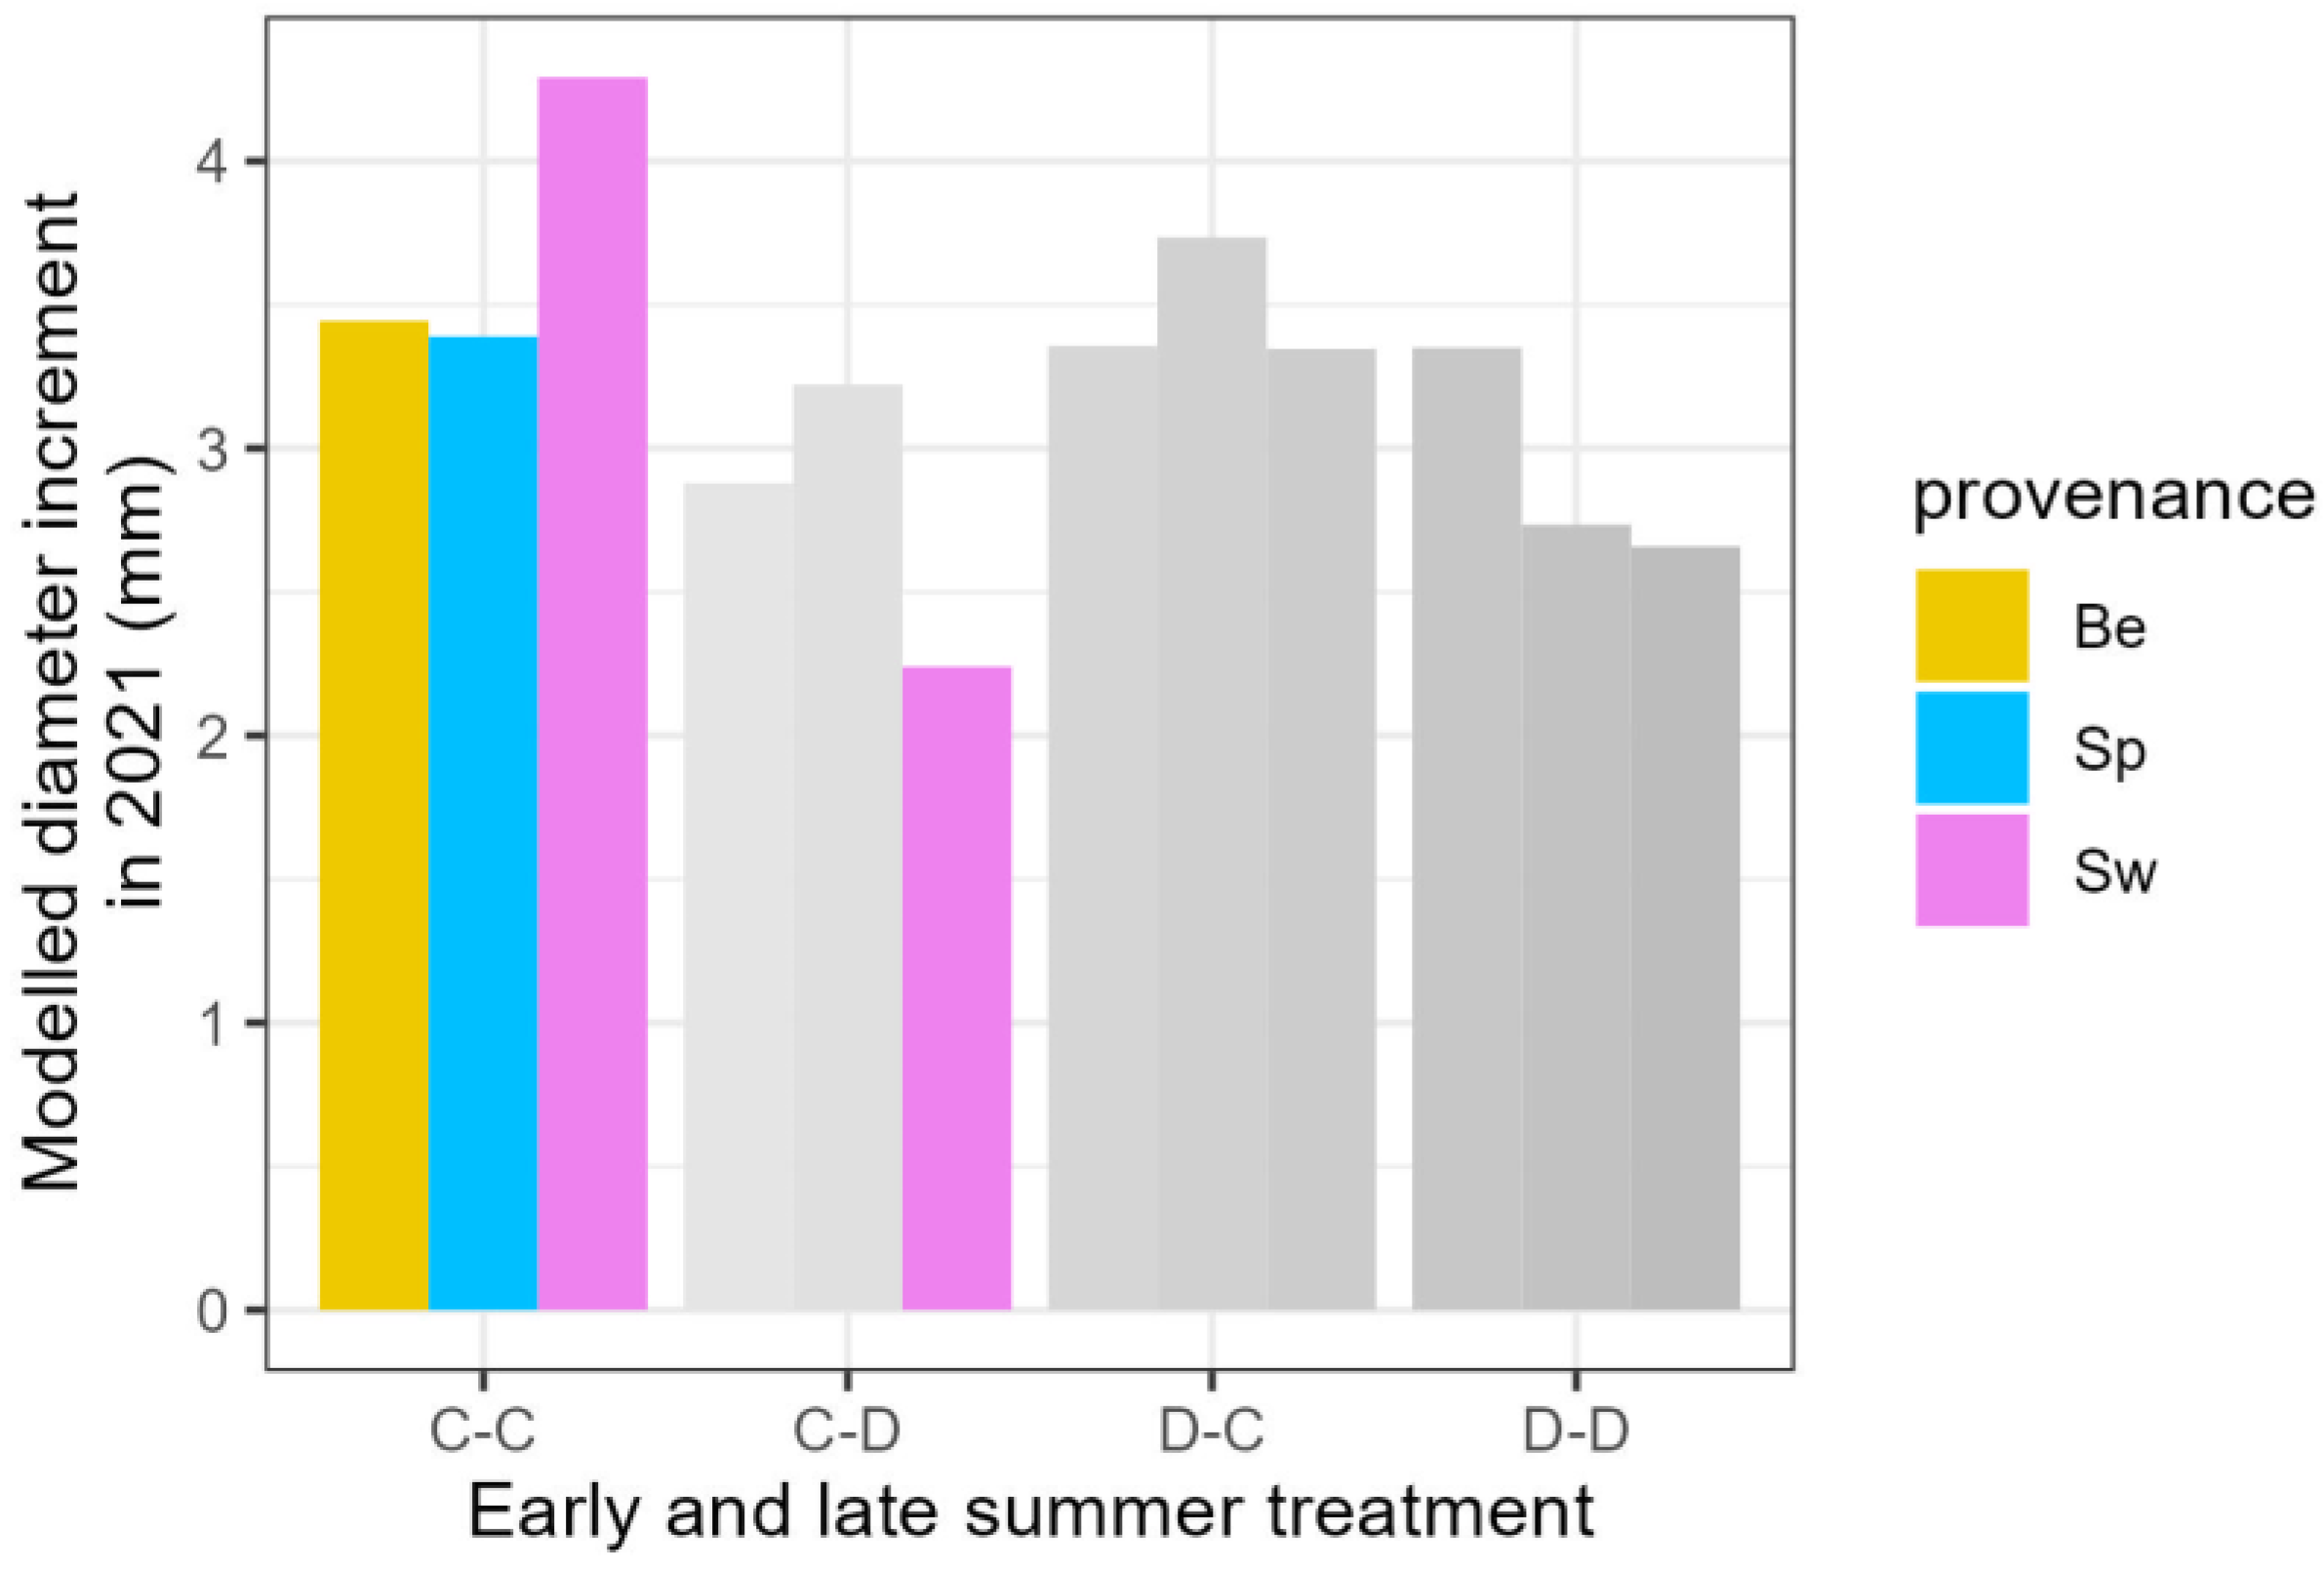
3.2. Growth Traits in the Year Following the Drought Treatments

When plants of the same height were compared (height is a co-factor in the models), the treatment group C-Ds exhibited a reduced height increment in 2021 compared to the control group (C-C), while, surprisingly, Dn-Dn showed a greater increment (significant treatment groups in Table 4, Figure 6a). The change in height increment in 2021 due to the drought treatments in 2020 did not differ among the three studied provenances (no significant interaction terms between provenance and treatment in Table 4). For the diameter increment in the year after the treatments, the groups experiencing a drought treatment in the late summer and displaying visual drought symptoms (C-Ds, Dn-Ds, and Ds-Ds) had a significant smaller increment compared to the control (C-C) (significant treatment groups in Table 4, Figure 6b). The Swedish provenance displayed a significantly smaller diameter increment than the Belgian provenance for the treatment group C-D (significant interaction term between provenance and treatment group in Table 4, Figure 7).

3.3. Leaf Phenological Traits in the Year Following the Drought Treatments

In the year following the treatments, only the group Ds-C displayed an advanced bud burst (significant treatment group in Table 5, Figure 8a). Regarding leaf senescence in autumn, only the group C-Ds displayed a delayed leaf senescence (significant treatment group in Table 5, Figure 8b). When looking at the different provenances, only the Spanish-Pyrenean provenance differed from the Belgian provenance for both bud burst (later) and leaf senescence (later) (significant provenances in Table 5, Figure 9a,b). The phenological responses of the Spanish-Pyrenean and Swedish provenances in 2021 to the different treatments in 2020 did not deviate from the Belgian provenance (no significant interaction terms between provenance and treatment groups in Table 5).

4. Discussion

In our experiment, we observed not only a reduced radial growth in the year following a repeated summer drought treatment, a well-known reaction, but also an enhanced height growth. The responses were influenced by the severity of the drought and by its timing within the growing season.

4.1. Compensation Growth

Height increment in the year following the droughts was enhanced in the group of plants that experienced both of the two drought treatments without developing visible drought stress symptoms (Dn-Dn). Although rather counter-intuitive, enhanced growth during the recovery phase following adverse growing conditions is a known phenomenon and is called compensation growth [35,36]. The term is used among plant and animal systems [37]. It is an adaptive strategy employed by organisms facing challenging environmental conditions, serving as a mechanism that contributes to ecosystem stability [38]. Accelerated growth has been studied as a response to herbivory, both in herbaceous species [39] and in woody perennials [40,41], and also upon other disturbances such as arthropod attack, disease, fire, lightning strikes, floods, drought, and blowdown (reviewed by [reviewed by 37]). In grassland ecosystems responding to drought, two distinct biotic mechanisms have been proposed to lead to compensation growth [42]. The first occurs at the population level and involves an increase in the abundance of drought-tolerant plants, which functionally compensate for the decline in drought-intolerant species [43]. The second mechanism, at the individual level, is termed physiological compensation [44] and is suggested to take place when all individuals within the community recover following a drought event. Physiological compensation typically occurs in response to short-term or moderate drought conditions, whereas shifts in species abundances are more likely to manifest under long-term or extreme drought [36].
Our result of enhanced height increment in the year following two successive mild summer droughts fits in the description of physiological compensation growth, specifically as environmental conditions for all individual plants were similar in our common garden set-up, with exception of the water supply during the treatments. This contrasts with the description of compensation growth in forests by Li et al. [37], where enhanced growth of individual trees is associated with improved access to resources such as nutrients, light, water, etc. resulting from a disturbance, which can be natural (fire, disease, etc.) or man-made (e.g., thinning). Thus, the question arises of which resources plants use for physiological compensation growth when access to external resources is not improved. The answer can possibly be found in the distinction between accumulated versus stored reserves [45]. The accumulated fraction of the total non-structural carbohydrates in trees is characterised by a rapid turnover rate that mitigates negative carbon balances in the recurrent annual growth cycle. Conversely, the stored fraction is marked by a gradual turnover rate that may meet the demand during stressful conditions. In this sense, physiological compensation growth can be achieved by using stored non-structural carbohydrates which are only released upon disturbances.
Compensation growth on an individual level following rehydration after drought stress has already been described in oak [46,47], Douglas-fir [48], Scotch pine [49], and Thuja occidentalis [50]. Oak and Douglas fir are tree species characterized by a cyclic growth pattern whereby drought-treated plants displayed a higher chance of an extra growth cycle after post-drought rewatering. An interesting observation in our experiment is the occurrence of compensation growth only after two mild drought treatments, not after only one, suggesting stress memory. A plant can adjust to environmental pressures, improving a plant’s subsequent response to future stressors [51,52]. Drought stress can act as a priming event that initiates stress memory [17,18]. Our experiment exemplifies the triggering of compensation growth due to stress memory.

4.2. Timing of the Droughts and Legacies in the Timing of Leaf Phenological Traits

Woody vegetation experiences negative legacy effects after droughts, including lower growth than expected in the years following the drought [53]. Even more, reduced radial growth can occur together with post-drought upregulation of photosynthesis [54]. It can be expected that the seasonal growth stages have typical windows of vulnerability to droughts [55]. Our experiment corroborates this. A late summer drought that caused visible stress symptoms (C-Ds and Dn-Ds) resulted in a reduced radial increment in the subsequent year, whereas this was not the case for a severe early summer drought (Ds-C and Ds-Dn), suggesting that post-drought photosynthesis during late summer was able to help the recovery of the early summer droughted plants. This finding may be related to the enhanced post-drought photosynthesis observed in beech [56]. When considering the impact of the severe late summer drought on the height increments (C-Ds and Dn-Ds), only the C-Ds group displayed a reduced height increment in the following year, possibly (partly) attributable to stress memory in the Dn-Ds group [18].
Minor effects were observed on the phenological traits in the year after the treatments. Only the treatment group Ds-C displayed an advanced bud burst. This is possibly a rather random effect. Regarding leaf senescence in autumn, only the treatment group C-Ds displayed a delayed leaf senescence, while this group also demonstrated a reduced growth increment in both height and diameter in 2021, suggesting that more severe droughts may influence the timing of leaf senescence. Although drought often advances autumnal leaf senescence, it may also delay it [57,58,59]. Finally, whereas bud burst in general is more genetically determined, the timing of leaf senescence may be more sensitive to environmental triggers such as drought [60].

4.3. Influence of Provenance

For all the growth traits that we studied, none displayed a deviating response to the drought among the different provenances, suggesting a general drought-response strategy in C. monogyna. In the timing of the leaf phenological traits, we found the Spanish-Pyrenean provenance to deviate from the local Belgian provenance with a later bud burst and a later leaf senescence. Although the Swedish provenance did not display a later or earlier bud burst and leaf senescence, the C-D treatment reduced the diameter increment in the year following the drought treatment in this provenance more than in the Belgian provenance. This effect may have been caused by the fact that initial plants in the Swedish provenance were higher.

5. Conclusions

As has similarly been observed in agricultural crops and herbaceous plants, mild drought can act as a growth stimulus. This was observed for the shrub Crataegus monogyna after repeated mild drought within one growing season, each time followed by plentiful rewatering. Although these conditions may occur rarely in situ, it still may influence the outcome of carbon sequestration modelling in woody vegetations. Research is needed to look for similar responses in major forest tree species.

Author Contributions

Conceptualization, K.V.M., E.N.P. and S.M.; methodology, K.V.M., E.N.P. and S.M.; investigation, M.S., L.D. and S.M.; validation, K.V.M.; formal analysis, K.V.M., L.D. and M.S.; data curation, K.V.M., L.D. and M.S.; writing—original draft preparation, K.V.M.; writing—review and editing, K.V.M., M.S., L.D. and E.N.P.; supervision, K.V.M. and E.N.P. All authors have read and agreed to the published version of the manuscript.

Funding

This research received no external funding.

Data Availability Statement

Data are available at 10.5281/zenodo.12205688.

Acknowledgments

We thank Yorrick Aguas Guerreiro, Cédric Van Dun, and Matthieu Gallin for contributing to the data acquisition. Marc Schouppe and Nico De Regge helped in taking care of the plants.

Conflicts of Interest

The authors declare no conflicts of interest.

References

  1. Bonan, G.B. Forests and climate change: Forcings, feedbacks, and the climate benefits of forests. Science 2008, 320, 1444–1449. [Google Scholar] [CrossRef] [PubMed]
  2. Pan, Y.; Birdsey, R.A.; Fang, J.; Houghton, R.; Kauppi, P.E.; Kurz, W.A.; Phillips, O.L.; Shvidenko, A.; Lewis, S.L.; Canadell, J.G.; et al. A Large and Persistent Carbon Sink in the World’s Forests. Science 2011, 333, 988–993. [Google Scholar] [CrossRef] [PubMed]
  3. Reichstein, M.; Bahn, M.; Ciais, P.; Frank, D.; Mahecha, M.D.; Seneviratne, S.I.; Zscheischler, J.; Beer, C.; Buchmann, N.; Frank, D.C.; et al. Climate extremes and the carbon cycle. Nature 2013, 500, 287–295. [Google Scholar] [CrossRef] [PubMed]
  4. Choat, B.; Brodribb, T.J.; Brodersen, C.R.; Duursma, R.A.; López, R.; Medlyn, B.E. Triggers of tree mortality under drought. Nature 2018, 558, 531–539. [Google Scholar] [CrossRef] [PubMed]
  5. Trenberth, K.E.; Dai, A.; van der Schrier, G.; Jones, P.D.; Barichivich, J.; Briffa, K.R.; Sheffield, J. Global warming and changes in drought. Nat. Clim. Chang. 2014, 4, 17–22. [Google Scholar] [CrossRef]
  6. Monteith, J.L. A reinterpretation of stomatal responses to humidity. Plant Cell Environ. 1995, 18, 357–364. [Google Scholar] [CrossRef]
  7. Martin-StPaul, N.; Delzon, S.; Cochard, H. Plant resistance to drought depends on timely stomatal closure. Ecol. Lett. 2017, 20, 1437–1447. [Google Scholar] [CrossRef]
  8. Munne-Bosch, S.; Alegre, L. Die and let live: Leaf senescence contributes to plant survival under drought stress. Funct. Plant Biol. 2004, 31, 203–216. [Google Scholar] [CrossRef] [PubMed]
  9. Blackman, C.J.; Brodribb, T.J.; Jordan, G.J. Leaf hydraulics and drought stress: Response, recovery and survivorship in four woody temperate plant species. Plant Cell Environ. 2009, 32, 1584–1595. [Google Scholar] [CrossRef]
  10. Blackman, C.J.; Creek, D.; Maier, C.; Aspinwall, M.J.; Drake, J.E.; Pfautsch, S.; O’Grady, A.; Delzon, S.; Medlyn, B.E.; Tissue, D.T.; et al. Drought response strategies and hydraulic traits contribute to mechanistic understanding of plant dry-down to hydraulic failure. Tree Physiol. 2019, 39, 910–924. [Google Scholar] [CrossRef]
  11. Cardoso, A.A.; Batz, T.A.; McAdam, S.A.M. Xylem Embolism Resistance Determines Leaf Mortality during Drought in Persea americana. Plant Physiol. 2020, 182, 547–554. [Google Scholar] [CrossRef] [PubMed]
  12. Wolfe, B.T.; Sperry, J.S.; Kursar, T.A. Does leaf shedding protect stems from cavitation during seasonal droughts? A test of the hydraulic fuse hypothesis. New Phytol. 2016, 212, 1007–1018. [Google Scholar] [CrossRef] [PubMed]
  13. Hochberg, U.; Windt, C.W.; Ponomarenko, A.; Zhang, Y.-J.; Gersony, J.; Rockwell, F.E.; Holbrook, N.M. Stomatal Closure, Basal Leaf Embolism, and Shedding Protect the Hydraulic Integrity of Grape Stems. Plant Physiol. 2017, 174, 764–775. [Google Scholar] [CrossRef] [PubMed]
  14. Vilagrosa, A.; Bellot, J.; Vallejo, V.R.; Gil-Pelegrin, E. Cavitation, stomatal conductance, and leaf dieback in seedlings of two co-occurring Mediterranean shrubs during an intense drought. J. Exp. Bot. 2003, 54, 2015–2024. [Google Scholar] [CrossRef] [PubMed]
  15. Schuldt, B.; Buras, A.; Arend, M.; Vitasse, Y.; Beierkuhnlein, C.; Damm, A.; Gharun, M.; Grams, T.E.E.; Hauck, M.; Hajek, P.; et al. A first assessment of the impact of the extreme 2018 summer drought on Central European forests. Basic Appl. Ecol. 2020, 45, 86–103. [Google Scholar] [CrossRef]
  16. Marchin, R.; Zeng, H.; Hoffmann, W. Drought-deciduous behavior reduces nutrient losses from temperate deciduous trees under severe drought. Oecologia 2010, 163, 845–854. [Google Scholar] [CrossRef]
  17. Ruehr, N.K.; Grote, R.; Mayr, S.; Arneth, A. Beyond the extreme: Recovery of carbon and water relations in woody plants following heat and drought stress. Tree Physiol 2019, 39, 1285–1299. [Google Scholar] [CrossRef] [PubMed]
  18. Gessler, A.; Bottero, A.; Marshall, J.; Arend, M. The way back: Recovery of trees from drought and its implication for acclimation. New Phytol. 2020, 228, 1704–1709. [Google Scholar] [CrossRef] [PubMed]
  19. Ingrisch, J.; Bahn, M. Towards a Comparable Quantification of Resilience. Trends Ecol. Evol. 2018, 33, 251–259. [Google Scholar] [CrossRef]
  20. Zeppel, M.J.B.; Harrison, S.P.; Adams, H.D.; Kelley, D.I.; Li, G.; Tissue, D.T.; Dawson, T.E.; Fensham, R.; Medlyn, B.E.; Palmer, A.; et al. Drought and resprouting plants. New Phytol. 2015, 206, 583–589. [Google Scholar] [CrossRef]
  21. Bryant, K.; Fredericksen, B.; Hudiburg, T.; Rosenthal, D. Physiological strategies for handling summer water stress differ among co-existing species and between juvenile and mature trees. Front. For. Glob. Chang. 2023, 5, 1018789. [Google Scholar] [CrossRef]
  22. Weemstra, M.; Eilmann, B.; Sass-Klaassen, U.G.W.; Sterck, F.J. Summer droughts limit tree growth across 10 temperate species on a productive forest site. For. Ecol. Manag. 2013, 306, 142–149. [Google Scholar] [CrossRef]
  23. Wolf, S.; Paul-Limoges, E. Drought and heat reduce forest carbon uptake. Nat. Commun. 2023, 14, 6217. [Google Scholar] [CrossRef] [PubMed]
  24. Ciais, P.; Reichstein, M.; Viovy, N.; Granier, A.; Ogée, J.; Allard, V.; Aubinet, M.; Buchmann, N.; Bernhofer, C.; Carrara, A.; et al. Europe-wide reduction in primary productivity caused by the heat and drought in 2003. Nature 2005, 437, 529–533. [Google Scholar] [CrossRef] [PubMed]
  25. Vander Mijnsbrugge, K.; Onkelinx, T.; De Cuyper, B. Variation in bud burst and flower opening responses of local versus non-local provenances of hawthorn (Crataegus monogyna Jacq.) in Belgium. Plant Syst. Evol. 2014, 301, 1171–1179. [Google Scholar] [CrossRef]
  26. Urban, J.; Matoušková, M.; Robb, W.; Jelínek, B.; Úradníček, L. Effect of Drought on Photosynthesis of Trees and Shrubs in Habitat Corridors. Forests 2023, 14, 1521. [Google Scholar] [CrossRef]
  27. Kirakosyan, A.; Seymour, E.; Kaufman, P.B.; Warber, S.; Bolling, S.; Chang, S.C. Antioxidant Capacity of Polyphenolic Extracts from Leaves of Crataegus laevigata and Crataegus monogyna (Hawthorn) Subjected to Drought and Cold Stress. J. Agric. Food Chem. 2003, 51, 3973–3976. [Google Scholar] [CrossRef]
  28. Fichtner, A.; Wissemann, V. Biological Flora of the British Isles: Crataegus monogyna. J. Ecol. 2021, 109, 541–571. [Google Scholar] [CrossRef]
  29. Uyttenbroeck, R.; De Vos, B.; Vander Mijnsbrugge, K. Verspreiding en Standplaats van Inheemse Bomen en Struiken in Vlaanderen. INBO.R.2014.1388322; Research Institute of Nature and Forest: Brussels, Belgium, 2014. [Google Scholar]
  30. Vander Mijnsbrugge, K.; Malanguis, J.M.; Moreels, S.; Turcsán, A.; Van der Schueren, N.; Notivol Mijnsbrugge, E. Direct Phenological Responses but Later Growth Stimulation upon Spring and Summer/Autumn Warming of Prunus spinosa L. in a Common Garden Environment. Forests 2022, 13, 23. [Google Scholar] [CrossRef]
  31. Vander Mijnsbrugge, K.; Janssens, A. Differentiation and Non-Linear Responses in Temporal Phenotypic Plasticity of Seasonal Phenophases in a Common Garden of Crataegus monogyna Jacq. Forests 2019, 10, 293. [Google Scholar] [CrossRef]
  32. R_Core_Team. R: A Language and Environment for Statistical Computing. R Foundation for Statistical Computing, version 4.3.0; R_Core_Team: Vienna, Austria, 2023. [Google Scholar]
  33. Christensen, R.H.B. Ordinal: Regression Models for Ordinal data. R Package Version 2015.6-28. Available online: http://www.cran.r-project.org/package=ordinal/ (accessed on 11 July 2024).
  34. Wickham, H. ggplot2: Elegant Graphics for data Analysis; Springer: New York, NY, USA, 2016. [Google Scholar]
  35. Belsky, A.J. Does Herbivory Benefit Plants? A Review of the Evidence. Am. Nat. 1986, 127, 870–892. [Google Scholar] [CrossRef]
  36. Zhou, H.; Hou, L.; Lv, X.; Yang, G.; Wang, Y.; Wang, X. Compensatory growth as a response to post-drought in grassland. Front. Plant Sci. 2022, 13, 1004553. [Google Scholar] [CrossRef] [PubMed]
  37. Li, C.; Barclay, H.; Roitberg, B.; Lalonde, R. Ecology and Prediction of Compensatory Growth: From Theory to Application in Forestry. Front Plant Sci. 2021, 12, 655417. [Google Scholar] [CrossRef] [PubMed]
  38. Gonzalez, A.; Loreau, M. The Causes and Consequences of Compensatory Dynamics in Ecological Communities. Annu. Rev. Ecol. Evol. Syst. 2009, 40, 393. [Google Scholar] [CrossRef]
  39. Maschinski, J.; Whitham, T.G. The Continuum of Plant Responses to Herbivory: The Influence of Plant Association, Nutrient Availability, and Timing. Am. Nat. 1989, 134, 1–19. [Google Scholar] [CrossRef]
  40. Aldous, S.E. Deer Browse Clipping Study in the Lake States Region. J. Wildl. Manag. 1952, 16, 401–409. [Google Scholar] [CrossRef]
  41. Garrison, G.A. Effects of Clipping on Some Range Shrubs. J. Range Manag. 1953, 6, 309–317. [Google Scholar] [CrossRef]
  42. Wilcox, K.R.; Koerner, S.E.; Hoover, D.L.; Borkenhagen, A.K.; Burkepile, D.E.; Collins, S.L.; Hoffman, A.M.; Kirkman, K.P.; Knapp, A.K.; Strydom, T.; et al. Rapid recovery of ecosystem function following extreme drought in a South African savanna grassland. Ecology 2020, 101, e02983. [Google Scholar] [CrossRef]
  43. Hoover, D.L.; Knapp, A.K.; Smith, M.D. Resistance and resilience of a grassland ecosystem to climate extremes. Ecology 2014, 95, 2646–2656. [Google Scholar] [CrossRef]
  44. Connell, S.D.; Ghedini, G. Resisting regime-shifts: The stabilising effect of compensatory processes. Trends Ecol. Evol. 2015, 30, 513–515. [Google Scholar] [CrossRef]
  45. El Omari, B. Accumulation versus storage of total non-structural carbohydrates in woody plants. Trees 2022, 36, 869–881. [Google Scholar] [CrossRef]
  46. Turcsán, A.; Steppe, K.; Sárközi, E.; Erdélyi, É.; Missoorten, M.; Mees, G.; Vander Mijnsbrugge, K. Early summer drought stress during the first growing year stimulates extra shoot growth in oak seedlings (Quercus petraea). Front. Plant Sci. 2016, 7, 193. [Google Scholar] [CrossRef] [PubMed]
  47. Spiess, N.; Oufir, M.; Matusikova, I.; Stierschneider, M.; Kopecky, D.; Homolka, A.; Burg, K.; Fluch, S.; Hausman, J.F.; Wilhelm, E. Ecophysiological and transcriptomic responses of oak (Quercus robur) to long-term drought exposure and rewatering. Environ. Exp. Bot. 2012, 77, 117–126. [Google Scholar] [CrossRef]
  48. Kaya, Z.; Adams, W.T.; Campbell, R.K. Adaptive significance of intermittent shoot growth in Douglas-fir seedlings. Tree Physiol 1994, 14, 1277–1289. [Google Scholar] [CrossRef] [PubMed]
  49. Seidel, H.; Matiu, M.; Menzel, A. Compensatory Growth of Scots Pine Seedlings Mitigates Impacts of Multiple Droughts within and Across Years. Front. Plant Sci. 2019, 10, 519. [Google Scholar] [CrossRef]
  50. van Kampen, R.; Fisichelli, N.; Zhang, Y.-J.; Wason, J. Drought timing and species growth phenology determine intra-annual recovery of tree height and diameter growth. AoB Plants 2022, 14, plac012. [Google Scholar] [CrossRef]
  51. Walter, J.; Jentsch, A.; Beierkuhnlein, C.; Kreyling, J. Ecological stress memory and cross stress tolerance in plants in the face of climate extremes. Environ. Exp. Bot. 2013, 94, 3–8. [Google Scholar] [CrossRef]
  52. Hilker, M.; Schmülling, T. Stress priming, memory, and signalling in plants. Plant Cell Environ. 2019, 42, 753–761. [Google Scholar] [CrossRef] [PubMed]
  53. Anderegg, W.R.L.; Schwalm, C.; Biondi, F.; Camarero, J.J.; Koch, G.; Litvak, M.; Ogle, K.; Shaw, J.D.; Shevliakova, E.; Williams, A.P.; et al. Pervasive drought legacies in forest ecosystems and their implications for carbon cycle models. Science 2015, 349, 528–532. [Google Scholar] [CrossRef]
  54. Kannenberg, S.A.; Maxwell, J.T.; Pederson, N.; D’Orangeville, L.; Ficklin, D.L.; Phillips, R.P. Drought legacies are dependent on water table depth, wood anatomy and drought timing across the eastern US. Ecol. Lett. 2019, 22, 119–127. [Google Scholar] [CrossRef]
  55. Anderegg, L.D.L.; Anderegg, W.R.L.; Berry, J.A. Not all droughts are created equal: Translating meteorological drought into woody plant mortality. Tree Physiol. 2013, 33, 672–683. [Google Scholar] [CrossRef] [PubMed]
  56. Pflug, E.E.; Buchmann, N.; Siegwolf, R.T.W.; Schaub, M.; Rigling, A.; Arend, M. Resilient Leaf Physiological Response of European Beech (Fagus sylvatica L.) to Summer Drought and Drought Release. Front. Plant Sci. 2018, 9, 187. [Google Scholar] [CrossRef]
  57. Vander Mijnsbrugge, K.; Vandepitte, J.; Moreels, S.; Mihaila, V.-V.; De Ligne, L.; Notivol, E.; Van Acker, J.; Van den Bulcke, J. Timing of autumnal leaf senescence in a common shrub species depends on the level of preceding summer drought symptoms. Environ. Exp. Bot. 2023, 216, 105539. [Google Scholar] [CrossRef]
  58. Vander Mijnsbrugge, K.; Turcsan, A.; Maes, J.; Duchene, N.; Meeus, S.; Steppe, K.; Steenackers, M. Repeated Summer Drought and Re-watering during the First Growing Year of Oak (Quercus petraea) Delay Autumn Senescence and Bud Burst in the Following Spring. Front. Plant Sci. 2016, 7, 419. [Google Scholar] [CrossRef]
  59. Mariën, B.; Dox, I.; De Boeck, H.J.; Willems, P.; Leys, S.; Papadimitriou, D.; Campioli, M. Does drought advance the onset of autumn leaf senescence in temperate deciduous forest trees? Biogeosciences 2021, 18, 3309–3330. [Google Scholar] [CrossRef]
  60. Vander Mijnsbrugge, K.; Moreels, S. Varying Levels of Genetic Control and Phenotypic Plasticity in Timing of Bud Burst, Flower Opening, Leaf Senescence and Leaf Fall in Two Common Gardens of Prunus padus L. Forests 2020, 11, 1070. [Google Scholar] [CrossRef]
Figure 1. Factorial design for the two consecutive drought treatments during the 2020 growing season with four treatment groups: C-C (control-control), C-D (control-drought), D-C (drought-control), and D-D (drought-drought). For each treatment, plants subjected to drought conditions were additionally categorized based on whether they exhibited visible drought symptoms (Ds) or remained symptom-free (Dn).
Forests 15 01234 g001
Figure 2. Weights of the pots during the two treatments.
Forests 15 01234 g002
Figure 3. Timeline with indication of treatments and measurements. Included are heights (Hei) and diameters (Dia) with their respective increments (Inh and Ind). Treatments are shown (Tre1 and Tre2) with control (C), drought (D), control-control (C-C), control-drought (C-D), drought-control (D-C), and drought-drought (D-D). Plants subjected to drought conditions were additionally categorized (Tre1d and Tre2d) based on whether they exhibited visible drought symptoms (Ds) or remained symptom-free (Dn).
Forests 15 01234 g003
Figure 4. Boxplots displaying the initial height (a) and diameter (b) of the plants at the start of the first treatment, according to their provenance.
Forests 15 01234 g004
Figure 5. Modelled change in height during the first treatment, between 1 July and 6 August (a), and during and after the second treatment, between 6 August and 25 March in the following year (b). Treatment groups with control (C), drought (D), control-control (C-C), control-drought (C-D), drought-control (D-C), and drought-drought (D-D), and with a further division of droughted groups according to the absence (Dn) or presence (Ds) of visible drought symptoms. Groups not differing significantly from the control (C and C-C) are in grey.
Forests 15 01234 g005
Figure 6. Modelled change in height (a) and diameter (b) during the year after the drought treatments. Treatment groups with control-control (C-C), control-drought (C-D), drought-control (D-C), and drought-drought (D-D), and with a further division of droughted groups according to the absence (Dn) or presence (Ds) of visible drought symptoms. Groups not differing significantly from the control (C-C) are in grey.
Forests 15 01234 g006
Figure 7. Modelled diameter increment during the year after the drought treatments, according to the provenance. Treatment groups with control-control (C-C), control-drought (C-D), drought-control (D-C), and drought-drought (D-D). Be: Belgian provenance, Sp: Spanish-Pyrenean provenance, Sw: Swedish provenance. Groups not differing significantly from the control (C-C) are in grey.
Forests 15 01234 g007
Figure 8. Modelled bud burst (a) and leaf senescence (b) in the year after the treatments, according to the treatments in the year before. Treatment groups with control-control (C-C), control-drought (C-D), drought-control (D-C), and drought-drought (D-D), and with the drought treated groups further divided according to the absence (Dn) or presence (Ds) of visual drought symptoms. Groups not differing significantly from the control (C-C) are in grey.
Forests 15 01234 g008
Figure 9. Modelled bud burst (a) and leaf senescence (b) in the year after the drought treatments according to the provenance. Treatment groups with control-control (C-C), control-drought (C-D), drought-control (D-C), and drought-drought (D-D). Be: Belgian provenance, Sp: Spanish-Pyrenean provenance, Sw: Swedish provenance. Groups not differing significantly from the control are in grey (i.e., Swedish provenance).
Forests 15 01234 g009
Table 1. Test statistics for the height (Hei1) and diameter (Dia1) at the start of the first treatment. The Belgian provenance is the standard to which the Spanish-Pyrenean (Sp) and the Swedish (Sw) provenances are compared.
Response VariableVariableEstimateSt. Errort-Valuep-Value
Hei1(intercept)40.401.8421.90<0.001 ***
Sp−5.442.61−2.090.039 *
Sw8.882.623.39<0.001 ***
Dia1(intercept)4.320.1334.40<0.001 ***
Sp−0.190.18−1.080.283
Sw0.430.182.410.017 *
*** p < 0.001; * p < 0.05.
Table 2. Test statistics for the height (Inh1 and Inh1P) and diameter increment (Ind1 and Ind1P) during the first treatment, between July 1 and August 6. The control group is the standard to which the drought treated group is compared. For the models without provenance (Inh1 and Ind1), the drought-treated group (D) is further divided according to the absence (Dn) or presence (Ds) of visual drought symptoms. This division is not retained in the provenance models (Inh1P and Ind1P). Here, the Belgian provenance is the standard to which the Spanish-Pyrenean (Sp) and the Swedish (Sw) provenances are compared.
Response
Variable
VariableEstimateSt. Errort-Valuep-Value
Inh1(intercept)−2.351.73−1.350.178
Dn−1.671.14−1.470.145
Ds−3.961.49−2.660.009 **
Hei10.220.045.94<0.001 ***
Ind1(intercept)0.520.202.630.010 **
Dn0.070.080.820.411
Ds0.030.110.290.775
Dia1−0.030.04−0.730.465
Inh1P(intercept)0.722.060.350.726
Sp−4.701.74−2.700.008 **
Sw−3.781.75−2.160.033 *
D−3.261.72−1.890.060
Hei10.220.045.44<0.001 ***
Sp:D2.242.430.920.358
Sw:D0.302.440.120.903
Ind1P(intercept)0.680.203.340.001 **
Sp−0.160.12−1.350.179
Sw0.330.122.740.007 **
D0.090.120.750.457
Dia1−0.080.04−1.930.056
Sp:D0.160.170.910.365
Sw:D−0.290.17−1.710.091
*** p < 0.001; ** p < 0.01; * p < 0.05.
Table 3. Test statistics for the height (Inh2 and Inh2P) and diameter increment (Ind2 and Ind2P) during and after the second treatment, between August 6 and March 25 of 2021 for height and between August 6 and December 20 for diameter. The control-control group is the standard to which the other groups are compared. Treatment groups with control-control (C-C), control-drought (C-D), drought-control (D-C), and drought-drought (D-D). For the models without provenance (Inh2 and Ind2), the drought-treated groups are further divided according to the absence (Dn) or presence (Ds) of visual drought symptoms. This division is not retained in the provenance models (Inh2P and Ind2P). Here, the Belgian provenance is the standard to which the Spanish-Pyrenean (Sp) and the Swedish (Sw) provenances are compared.
Response
Variable
VariableEstimateSt. Errort-Valuep-Value
Inh2(intercept)8.184.111.990.048 *
C-Dn−3.824.50−0.850.397
C-Ds−14.653.59−4.080.000 ***
Dn-C−2.023.48−0.580.563
Ds-C−4.964.58−1.080.280
Dn-Dn−4.054.02−1.010.315
Dn-Ds−9.025.49−1.640.103
Ds-Dn−18.025.19−3.470.001 ***
Ds-Ds−3.568.01−0.450.657
Hei2−0.140.07−2.040.043 *
Ind2(intercept)13.145.262.500.014 *
Sp−4.685.65−0.830.409
Sw1.195.720.210.835
C-D−11.275.66−1.990.048 *
D-C−4.605.63−0.820.416
D-D−11.485.63−2.040.044 *
Hei2−0.220.07−3.010.003 **
Sp: C-D6.378.020.800.428
Sw: C-D−5.178.03−0.640.521
Sp: D-C5.807.960.730.467
Sw: D-C−1.637.97−0.210.838
Sp: D-D9.327.961.170.244
Sw: D-D−1.198.08−0.150.883
Inh2P(intercept)0.700.242.920.004 **
C-Dn−0.130.16−0.800.427
C-Ds−0.130.12−1.110.271
Dn-C−0.230.12−1.880.062
Ds-C−0.140.16−0.880.378
Dn-Dn−0.270.14−1.940.055
Dn-Ds−0.130.19−0.710.476
Ds-Dn−0.060.18−0.340.736
Ds-Ds0.470.271.700.091
Dia2−0.070.05−1.500.137
Ind2P(intercept)0.860.253.400.001 ***
Sp−0.380.19−2.000.047 *
Sw−0.100.19−0.510.614
C-D−0.270.19−1.420.157
D-C−0.420.19−2.250.026 *
D-D−0.320.19−1.710.090
Dia2−0.070.04−1.520.131
Sp: C-D0.390.271.460.148
Sw: C-D0.010.260.050.957
Sp: D-C0.500.261.900.060
Sw: D-C0.170.270.630.533
Sp: D-D0.260.261.000.322
Sw: D-D0.320.271.210.230
*** p < 0.001; ** p < 0.01; * p < 0.05.
Table 4. Test statistics for the height (Inh3 and Inh3P) and diameter increment (Ind3 and Ind3P) in the year following the treatments. The control-control group is the standard to which the other groups are compared. Treatment groups are control-control (C-C), control-drought (C-D), drought-control (D-C), and drought-drought (D-D). For the models without provenance (Inh3 and Ind3), the drought-treated groups are further divided according to the absence (Dn) or presence (Ds) of visual drought symptoms. This division is not retained in the provenance models (Inh3P and Ind3P). Here, the Belgian provenance is the standard to which the Spanish-Pyrenean (Sp) and the Swedish (Sw) provenances are compared.
Response
Variable
VariableEstimateSt. Errort-Valuep-Value
Inh3(intercept)48.924.6910.44<0.001 ***
C-Dn0.005.580.001.000
C-Ds−9.484.47−2.120.036 *
Dn-C5.024.361.150.252
Ds-C−6.615.73−1.150.251
Dn-Dn10.125.032.010.046 *
Dn-Ds−5.086.88−0.740.462
Ds-Dn2.176.620.330.743
Ds-Ds−7.8110.02−0.780.437
Hei3−0.160.07−2.190.030 *
Ind3(intercept)2.980.585.13<0.001 ***
C-Dn−0.400.38−1.070.288
C-Ds−1.170.29−4.00<0.001 ***
Dn-C−0.140.29−0.490.625
Ds-C−0.250.38−0.670.502
Dn-Dn−0.410.33−1.220.226
Dn-Ds−1.080.45−2.390.018 *
Ds-Dn−0.840.45−1.860.066
Ds-Ds−1.870.66−2.850.005 **
Dia30.140.101.340.182
Inh3P(intercept)47.626.287.58<0.001 ***
Sp4.006.970.570.567
Sw6.326.990.900.368
C-D−3.616.93−0.520.603
D-C−1.396.94−0.200.841
D-D0.847.010.120.905
Hei3−0.200.08−2.600.010 *
Sp: C-D2.579.790.260.793
Sw: C-D−11.449.87−1.160.249
Sp: D-C0.859.800.090.931
Sw: D-C6.969.790.710.478
Sp: D-D5.129.810.520.602
Sw: D-D1.989.920.200.842
Ind3P(intercept)3.190.625.17<0.001 ***
Sp−0.050.44−0.120.903
Sw0.850.451.900.060
C-D−0.560.44−1.280.205
D-C−0.090.45−0.190.846
D-D−0.090.45−0.200.838
Dia30.050.100.490.623
Sp: C-D0.400.630.630.527
Sw: C-D−1.490.62−2.380.019 *
Sp: D-C0.430.630.690.493
Sw: D-C−0.860.63−1.370.173
Sp: D-D−0.560.63−0.890.376
Sw: D-D−1.540.64−2.410.017 *
*** p < 0.001; ** p < 0.01; * p < 0.05.
Table 5. Test statistics for bud burst (Bud) and leaf senescence (Sen) in the year following the treatments. The control-control group is the standard to which the other groups are compared. Treatment groups are control-control (C-C), control-drought (C-D), drought-control (D-C), and drought-drought (D-D). For the phenological models (Bud and Sen) without provenance, the drought-treated groups are further divided according to the absence (Dn) or presence (Ds) of visual drought symptoms. This division is not retained in the provenance models (BudP and SenP). Here, the Belgian provenance is the standard to which the Spanish-Pyrenean (Sp) and the Swedish (Sw) provenances are compared.
Response
Variable
VariableEstimateSt. Errorz-Valuep-Value
Budday−0.290.02−14.66<0.001 ***
C-Dn0.641.180.550.585
C-Ds−1.390.99−1.410.160
Dn-C1.190.911.310.192
Ds-C−3.141.22−2.560.010 *
Dn-Dn−1.371.07−1.290.199
Dn-Ds−1.051.54−0.690.493
Ds-Dn−2.041.46−1.400.162
Ds-Ds0.692.100.330.743
Hei30.010.020.530.597
Senday0.170.036.80<0.001 ***
C-Dn−1.911.03−1.850.064
C-Ds−1.840.87−2.110.035 *
Dn-C−0.590.81−0.730.468
Ds-C−0.141.07−0.130.895
Dn-Dn−1.030.92−1.120.262
Dn-Ds−0.961.27−0.750.452
Ds-Dn1.531.241.230.217
Ds-Ds−0.951.84−0.520.606
Hei40.060.014.19<0.001 ***
BudPday−0.290.02−14.64<0.001 ***
Sp5.621.274.44<0.001 ***
Sw0.931.220.760.445
C-D0.401.230.330.743
D-C−0.501.21−0.420.678
D-D−0.921.24−0.740.461
Hei30.030.011.950.052
Sp: C-D−1.381.75−0.790.428
Sw: C-D−1.041.78−0.580.560
Sp: D-C0.621.710.360.716
Sw: D-C0.921.710.540.591
Sp: D-D−1.731.73−1.000.317
Sw: D-D1.301.770.740.462
SenPday0.170.036.95<0.001 ***
Sp−2.791.20−2.320.020 *
Sw−0.601.19−0.510.611
C-D−2.781.20−2.320.021 *
D-C−0.971.17−0.830.408
D-D0.601.170.510.611
Hei40.050.014.280.000
Sp: C-D1.061.630.650.515
Sw: C-D1.651.680.980.327
Sp: D-C0.901.640.550.582
Sw: D-C0.661.660.400.691
Sp: D-D−1.081.65−0.660.511
Sw: D-D−2.101.68−1.250.210
*** p < 0.001; * p < 0.05.
Disclaimer/Publisher’s Note: The statements, opinions and data contained in all publications are solely those of the individual author(s) and contributor(s) and not of MDPI and/or the editor(s). MDPI and/or the editor(s) disclaim responsibility for any injury to people or property resulting from any ideas, methods, instructions or products referred to in the content.

