Article

An Index System for the Evaluation of the Effectiveness of Forest Ecological Product Value Realization in China

1
Research Institute of Forestry Policy and Information, Chinese Academy of Forestry, Beijing 100091, China
2
Chinese Academy of Forestry, Beijing 100091, China
*
Author to whom correspondence should be addressed.
Forests 2024, 15(7), 1236; https://doi.org/10.3390/f15071236
Submission received: 22 June 2024 / Accepted: 14 July 2024 / Published: 16 July 2024
(This article belongs to the Special Issue Economy and Sustainability of Forest Natural Resources)

Abstract

:
Forest Ecological Product Value Realization (FEPVR) is an important way for China to promote the transition and development of forestry and realize common prosperity. It is critical to assess the effectiveness of FEPVR rationally to obtain a comprehensive understanding of the progress of ecological civilization. Based on the Driver–Pressure–State–Impact–Response (DPSIR) model, in this study, we developed an evaluation index system for FEPVR effectiveness containing five subsystems and 37 indicators and assessed the effectiveness of FEPVR in China from 2011 to 2022 by using the linear weighted sum method, the coupling degree of coordination model, and Spearman’s correlation analysis. The results showed that the composite index increased from 0.1980 in 2011 to 0.6501 in 2022, with a general upward trend, but there is still great potential for improvement. The main contribution was from the Response subsystem. The year 2017 was an important turning point for FEPVR in China because its development started to speed up; the status of coupling coordination between different subsystems was gradually improving but was still at a low level. The relationship between all indicators was dominated by a non-significant correlation (52.4%), and the overall synergistic effect (27.8%) was greater than the trade-off effect (19.8%). This study provides a new perspective for evaluating the effectiveness of FEPVR and a decision-making reference for clarifying the direction of FEPVR optimization.

1. Introduction

Ecosystems play a key role in food production, climate regulation, and cultural support and are the basis for human survival and development [1]. Ecosystem services (ESs) are regarded as the link between human society and ecosystems, reflecting the various products and benefits that humans derive directly or indirectly from ecosystems and are closely related to human well-being [2,3]. Since the Millennium Ecosystem Assessment, there has been a global boom in the study of ESs [4]. Scholars have carried out in-depth analyses of the functions and values of ESs, which has continuously enriched its concept and connotation and prompted people to pay more attention to the protection of the ecological environment [5,6].
At present, the contradiction between ecological protection and economic development remains prominent [7]. Determining how to enhance the contribution of nature to sustainable economic development and human well-being and promote the transformation of ecological value is an urgent issue for the international community [8]. Beautiful ecological environments often exhibit significant characteristics, such as scarcity, high demand, and high cost, and contain a wealth of potential uses [9]. Assessing their value in a tangible way can increase the effectiveness and motivation of environmental management [10]. Recently, China has vigorously promoted the construction of ecological civilization and innovatively put forward the concept of ecological products (EPs) [11,12]. This concept is based on Marx’s labor theory of value as a logical starting point [13], i.e., through the biological production function and human labor, the beautiful ecological environment can be “produced”, exist in the form of products, and enjoyed by human beings, and the law of the market also applies to the production, circulation, and consumption of EPs [14]. Therefore, the concepts of EPs and ESs have certain similarities and connections, both emphasizing the various benefits that ecosystems provide to humans. The production process of EPs cannot be separated from the supply of ESs. The difference is that EPs are expressed in the form of end-products and do not include the intermediate service process of ecosystems. At the same time, EPs focus more on the tradability of the products, which is the carrier of the concept of “Lucid Waters and Lush Mountains Are Invaluable Assets”, with strong Chinese characteristics [15]. While reflecting on the relationship between nature and people, EPs also emphasize the relationship between people, with both natural and human attributes [16]. The Chinese government hopes to cultivate a new impetus for high-quality economic development and create a new scheme for harmonious coexistence between human beings and nature through ecological product value realization (EPVR), thereby resolving the rational use of natural resources and high-quality development of the economy and society. In this context, scholars carried out several theoretical studies around the connotation, value accounting, supply, paths, and modes of the value realization of EPs and the driving mechanism of EPs in the eco-industry [12,14,17,18,19,20,21]. Wang et al. [22] summarized the progress made in promoting EPVR mechanisms in China at the national and provincial levels. In terms of practical exploration, the government constructed different types and levels of EPVR pilots, the details of which can be found in the article [22].
Forest resources are an essential part of ecological resources. As the body of terrestrial ecosystems, forest ecosystems provide forest eco-products that play an increasingly prominent role in meeting people’s needs for a better life [23,24]. Specifically, they not only have the highest biological productivity and provide human beings with material products such as timber, medicinal herbs, and fruits but also have important ecological protection functions such as water conservation, windbreaks, sand fixation, soil and water conservation, and climate regulation, which can effectively prevent land degradation [25]. In addition, they provide important support in recreation, landscape aesthetics, and health care [26]. The quantity and quality of forest resources are directly related to sustainable socio-economic development. Two of the 17 Sustainable Development Goals (SDGs) set out by the United Nations in 2015 involve forests (SDG 13 and SDG 15) [27]. However, according to the Global Forest Resources Assessment 2020 published by the FAO, the global forest area is continuously decreasing (approximately 178 million hectares lost since 1990) [28]. The difference is that in the past decade, thanks to the implementation of the natural forest protection program, the conversion of cropland into forests program, and the key shelterbelt development programs, China has cumulatively afforested 64 million hectares, the forest coverage rate has increased from 20.36% to 24.02%, and the forest stock has increased from 15.137 billion m3 to 19.493 billion m3, making China the country with the largest growth of forest resources in the world, contributing to one-quarter of the new green areas [29,30]. It creates favorable conditions for increasing the supply of forest ecological products (FEPs) and promoting Forest Ecological Product Value Realization (FEPVR).
Research on FEPVR has focused on the definition and attributes of FEPs [31,32], the effective supply of FEPs [33,34], the value assessment and conversion efficiency of FEPs [35,36], forestry carbon trading [37,38], the relationship between FEPVR and the eco-industry [39], and the Forest Ecological Bank (FEB) [40]. However, very few studies have evaluated the effectiveness of FEPVR, and the corresponding promotion path is not clear. It is worth mentioning that the assessment of the value of FEPs can only reflect the potential forest ecosystem service value, and the value conversion efficiency of FEPs can only characterize the extent to which forest ecological benefits are transformed into economic benefits. Neither of them can effectively elucidate the linkage between FEPs and socio-economics, and they cannot explain the driving mechanism of FEPVR. Studying the effectiveness of FEPVR can not only reflect the government’s efforts to promote FEPVR and provide a quantitative management basis for guiding practical activities but also serve as an important hand for FEPVR capacity building and provide a reference for the corresponding application model, which is a key research direction in the future.
Some researchers have started to explore the evaluation of the effectiveness of EPVR [41,42], but it is still in the initial stage, and the evaluation methods could be mainly divided into single index methods (e.g., the Green Gold index and the value realization rate of ecological products) and the comprehensive index system methods constructed under different logical perspectives [43,44,45,46]. The former only used simple mathematical ratios for evaluation, which made it difficult to accurately describe the whole process of EPVR. The latter is conducive to fully considering the different dimensions of EPVR and can provide a more complete theoretical basis, but the corresponding assessment framework still needs to be further improved. Xie et al. [47] considered EPVR to be a major and complex systematic project and took the lead in attempting to introduce the DPSIR (Driver–Pressure–State–Impact–Response) model into the EPVR effectiveness evaluation system and argued its applicability and scientificity, which provided a promising pathway for the establishment of a unified and standardized logical framework. However, they only explored the general laws of EPVR from a macro-perspective for all domains and constructed a preliminary evaluation index system, which simply regarded all ecosystems as a whole and did not differentiate between the categories of EPs.
Thus, this study attempted to construct a targeted FEPVR effectiveness evaluation index system from a specific domain (forest), referring to the basic practice of Xie et al. [47] and combining the characteristics of Chinese FEPs. Based on this system, the temporal trend of FEPVR in China was empirically analyzed, and the trade-offs and synergistic relationships between the evaluation indicators were further elucidated. We hoped to integrate the value of FEPs and socio-economic systems into a unified analytical framework as a way of proposing a quantitative tool to assess the progress of FEPVR and to elucidate the pathways of value realization and the logic of action for EPs in a specific sector (forestry). This study would provide a reference for enhancing the public understanding of FEPVR, accelerating the maximization of forest ecological resource value, and promoting the comprehensive green transformation of economic and social development.

2. Building the Evaluation Index System for the Effectiveness of FEPVR

2.1. Clarification of Relevant Concepts

Although the concept of EPs is controversial, there is a consensus that EPs refer to final products or services that satisfy people’s needs for a better life and have ecological, economic, and social benefits, relying on natural resources and ecological environments and formed through the interactions of biological production and human labor without compromising ecosystem functions [14,22,48,49]. Ecological benefits reflect the beneficial impact of ecosystems on human production and life and, together with economic and social benefits, form the criteria and basis for judging the value of EPs [50]. Therefore, this study considered that FEPs refer to products or services beneficial to the enhancement of human well-being obtained through forest ecological construction and sustainable management of forests using forest resources as a carrier and have the same benefit attributes as general EPs. FEPVR was regarded as the process of converting forest resources into FEPs through governmental and market pathways under the premise of maintaining the function of forest ecosystems, prompting the maximization of their economic, ecological, and social benefits.

2.2. Design Logic of the Evaluation Indicator System

The applicability of the DPSIR model to EPVR and the possible effects of introducing the DPSIR model to evaluate the effectiveness of EPVR were highlighted in Xie et al. [47] and are repeated in this paper. FEPVR was a specific manifestation of EPVR in the field of forestry, to which the DPSIR model was equally applicable. It was worth mentioning that Xie et al. [47] only generally described the design logic as “constructing the indicator system according to the specific characteristics of EPVR in the economic, social, and ecological fields”. This did not effectively explain the formation process of EPs and the inherent relationship of their value realization. Therefore, this study continued to use the DPSIR model as the basic framework, divided FEPVR into five closely related subsystems (Driver subsystem, Pressure subsystem, State subsystem, Influence subsystem, and Response subsystem), and made the whole design logic more specific: it was considered that the FEPs were formed by the joint action of the human social system and the forest ecosystem and were the base conditions of FEPVR. The ecological benefits of FEPs were the basis of economic and social benefits, and the benefits could be transformed through corresponding measures, thus enhancing human well-being (Figure 1).

2.3. Formation of the Indicator System

We retained the relatively mature and relevant indicators proposed by Xie et al. [47], which were consistent with the development characteristics of FEPs, and adjusted the corresponding indicators from the perspective of value realizability according to the hierarchical classification method, combined with the characteristics of China’s forestry production and practical activities, to make the whole indicator system more consistent with the actual situation of EPVR in the field of forestry. The indicators were selected following the basic principles of systematicity, scientificity, data availability, and comparability [51]. The specific process was as follows.
The evaluation index system of the effectiveness of FEPVR in China constructed in this study consisted of five dimensions (standard layer), 16 first-level indicators (factor layer), and 37 second-level indicators (indicator layer), and the corresponding descriptions of the indicators are shown in Table 1. For the factors and indicators involved in the different subsystems, the main considerations were as follows: (1) the Driver subsystem reflected the potential causes and macro-contexts influencing the changes in FEPVR, which were manifested as economic and social attributes, and were consistent with general EPVR; so, we retained the original first-level indicators (D1~D3) and second-level indicators (X1~X6); (2) the Pressure subsystem was the direct cause of changes in FEPVR, which could be categorized into two dimensions: resource depletion (P1) and ecological damage (P2), with corresponding indicators X7 to X9; (3) the State subsystem centrally reflected the state of forest ecological elements, which were the basis of FEPVR, and could be divided into two dimensions, i.e., resource retention (P1) and ecological security (P2), and the corresponding indicators were X10~X14; (4) the Impact subsystem was the potential outcome of FEPVR and the specific expression of the three benefits. The process of transforming ecological benefits into economic and social benefits needed to rely on market-oriented tools and specific carriers to be realized, which could be considered in terms of eco-industrialization (I1) and social life (I2), and the corresponding indicators were X15~X21; and (5) the Response subsystem emphasized “human labor” in the broad sense, which was the actual action of FEPVR and could be considered from the aspects of ecological supply (R1), fiscal support (R2), green finance (R3), market cultivation (R4), research and education (R5), infrastructure (R6), and environmental regulation (R7), and the corresponding indicators were X22~X37.

3. Empirical Analysis

3.1. Study Period and Data Sources

Considering the time when the EPs were officially proposed and the time when the data were available, the study period was determined to be from 2011 to 2022. Data for the required indicators were mainly sourced from different years and types of statistical yearbooks, statistical bulletins, and development reports (Table 2).

3.2. Measurement Methods

3.2.1. Entropy Weight Method

In order to reduce the influence of subjective factors and improve the credibility of the research results, this study continued to follow the entropy weight method to determine the weight of the indicators [61]. The specific steps are as follows.
Step 1: Standardization of original data
Assume that the original data are n indicators on m time dimensions. Due to the different units of the original data, standardization is required to make the data comparable. Equations (1) and (2) correspond to the treatment of positive and negative indicators, respectively. For moderate indicators, it is necessary to calculate their average; data less than the average are calculated according to Equation (1), and data greater than or equal to the average are calculated according to Equation (2). The equations are as follows.
x i j = x i j min ( x i ) max ( x i ) min ( x i )
x i j = max ( x i ) x i j max ( x i ) min ( x i )
where xij indicates the value of the j indicator in the i-th year, i = 1, 2, 3, …, m; j = 1, 2, 3, …, and n. xij′ indicates the standardized value of xij.
To satisfy the demands of the subsequent logarithmic calculations (the antilogarithm is not zero), it is necessary to translate xij′ appropriately, as follows.
V i j = x i j + α
where Vij is the new standardized data and α is the translation distance, which takes the value 0.000001 in this case.
Step 2: Calculate the information entropy ej of the j-th indicator.
e j = 1 ln m i = 1 m P i j ln P i j  
where P i j = V i j i = 1 m V i j ; assume that lim V i j 0 , ln P i j = 0 .
Step 3: Calculate the weight ωj of the j-th indicator.
ω j = 1 e j j = 1 n 1 e j
The factor layer weights Gj and the standard layer weights Sj are gained by accumulating the corresponding indicator weights ωj.

3.2.2. Linear Weighted Sum Method and Relative Contribution

Considering that the TOPSIS (Technology for Order Preference by Similarity to an Ideal Solution) method could not take into account the interactions between each attribute factor and might ignore some important factors [62], this study determined the composite index of China’s FEPVR effectiveness through the linear weighted sum method [63] so that the role of each evaluation index was linearly compensated for the role of each evaluation index and the fairness of the composite index was ensured. The composite index Fij was obtained by the weighted summation of all the indicators, with the following formula.
F i j = j = 1 n ω j V i j
Similarly, the effectiveness scores Tij of the different subsystems were obtained by the weighted summation of the corresponding indicators.
The relative contribution of the subsystems, i.e., Rij, was calculated by the following formula.
R i j = T i j F i j × 100 %

3.2.3. Coupling Coordination Degree Model

The coupling coordination degree model was simple and easy to calculate, and the results were intuitive [64]. To quantify the degree of interaction and coordination between these subsystems, we continued to measure them through the model [65,66]. The steps are as follows.
Step 1: Calculate the coupling degree Ci between the different subsystems in the i-th year.
C i = k = 1 k T i j / k = 1 k T i j k k 1 k ,     2 k 5 ,   k N +
where k is the number of subsystems included in the calculation of the coupling degree.
Step 2: Calculate the coordination index Hi between the subsystems in the i-th year.
H i = k = 1 k T i j × W j
where k is the number of subsystems included in the calculation of the coordination index.
Step 3: Calculate the coupling coordination degree Pi between the subsystems in the i-th year.
P i = C i × H i
where the larger the value of Pi, the stronger the interaction and the more coordinated the development of the subsystems.

3.2.4. Correlation Analysis of Indicators

A trade-off relationship is one in which there are opposing trends between different things, implying that progress in one aspect can be disadvantageous to another. A synergistic relationship is one in which there are the same trends between different things, implying that progress in one aspect can be beneficial to another. Therefore, we can identify trade-off effects and synergistic effects between different indicators through correlation analysis [67] to enhance the observation of interactions between different indicators and analyze the possibility of transforming existing trade-offs into potential synergies [68]. In this study, Spearman’s correlation analysis was used because it is more suitable for assessing monotonic relationships between indicators compared to Pearson’s correlation analysis and has no requirements for data type and distribution [69]. The formula is as follows.
ρ = 1 6 n n 2 1 i = 1 n Q i Z i 2
where ρ is the rank correlation coefficient, Qi and Zi are the ranks of indicators Xi and Yi, respectively, and n is the number of samples. ρ ranges between −1 and 1. ρ > 0 indicates a positive correlation between the indicators, and ρ < 0 is a negative correlation between the indicators; the larger |ρ| is, the higher the correlation between the indicators.
Referring to Zhu et al. [70], when ρ > 0.6, it can be assumed that there is a synergistic effect between indicators; on the contrary, when ρ < −0.6, it can be assumed that there is a trade-off effect between indicators. Both cases should be statistically significant (p ≤ 0.05). When ρ is between −0.6 and 0.6, it can be considered that there is no significant correlation between indicators.

4. Results and Analysis

4.1. Indicator Weights

The results of the weights for the different layers are shown in Table 3. From the standard layer, the weight ranking was as follows: Response subsystem (0.3750) > Driver subsystem (0.1735) > Pressure subsystem (0.1625) > State subsystem (0.1490) > Impact subsystem (0.1400). In the factor layer, population growth (D2), ecological damage (P2), resource retention (S1), social life (I2), and ecological supply (R1) had large weights, all greater than 0.08. In terms of the indicator layer, population density (X3) and the ratio of soil erosion area to total land area (X8) were given higher weights, while the rest of the indicators were less than 0.05.

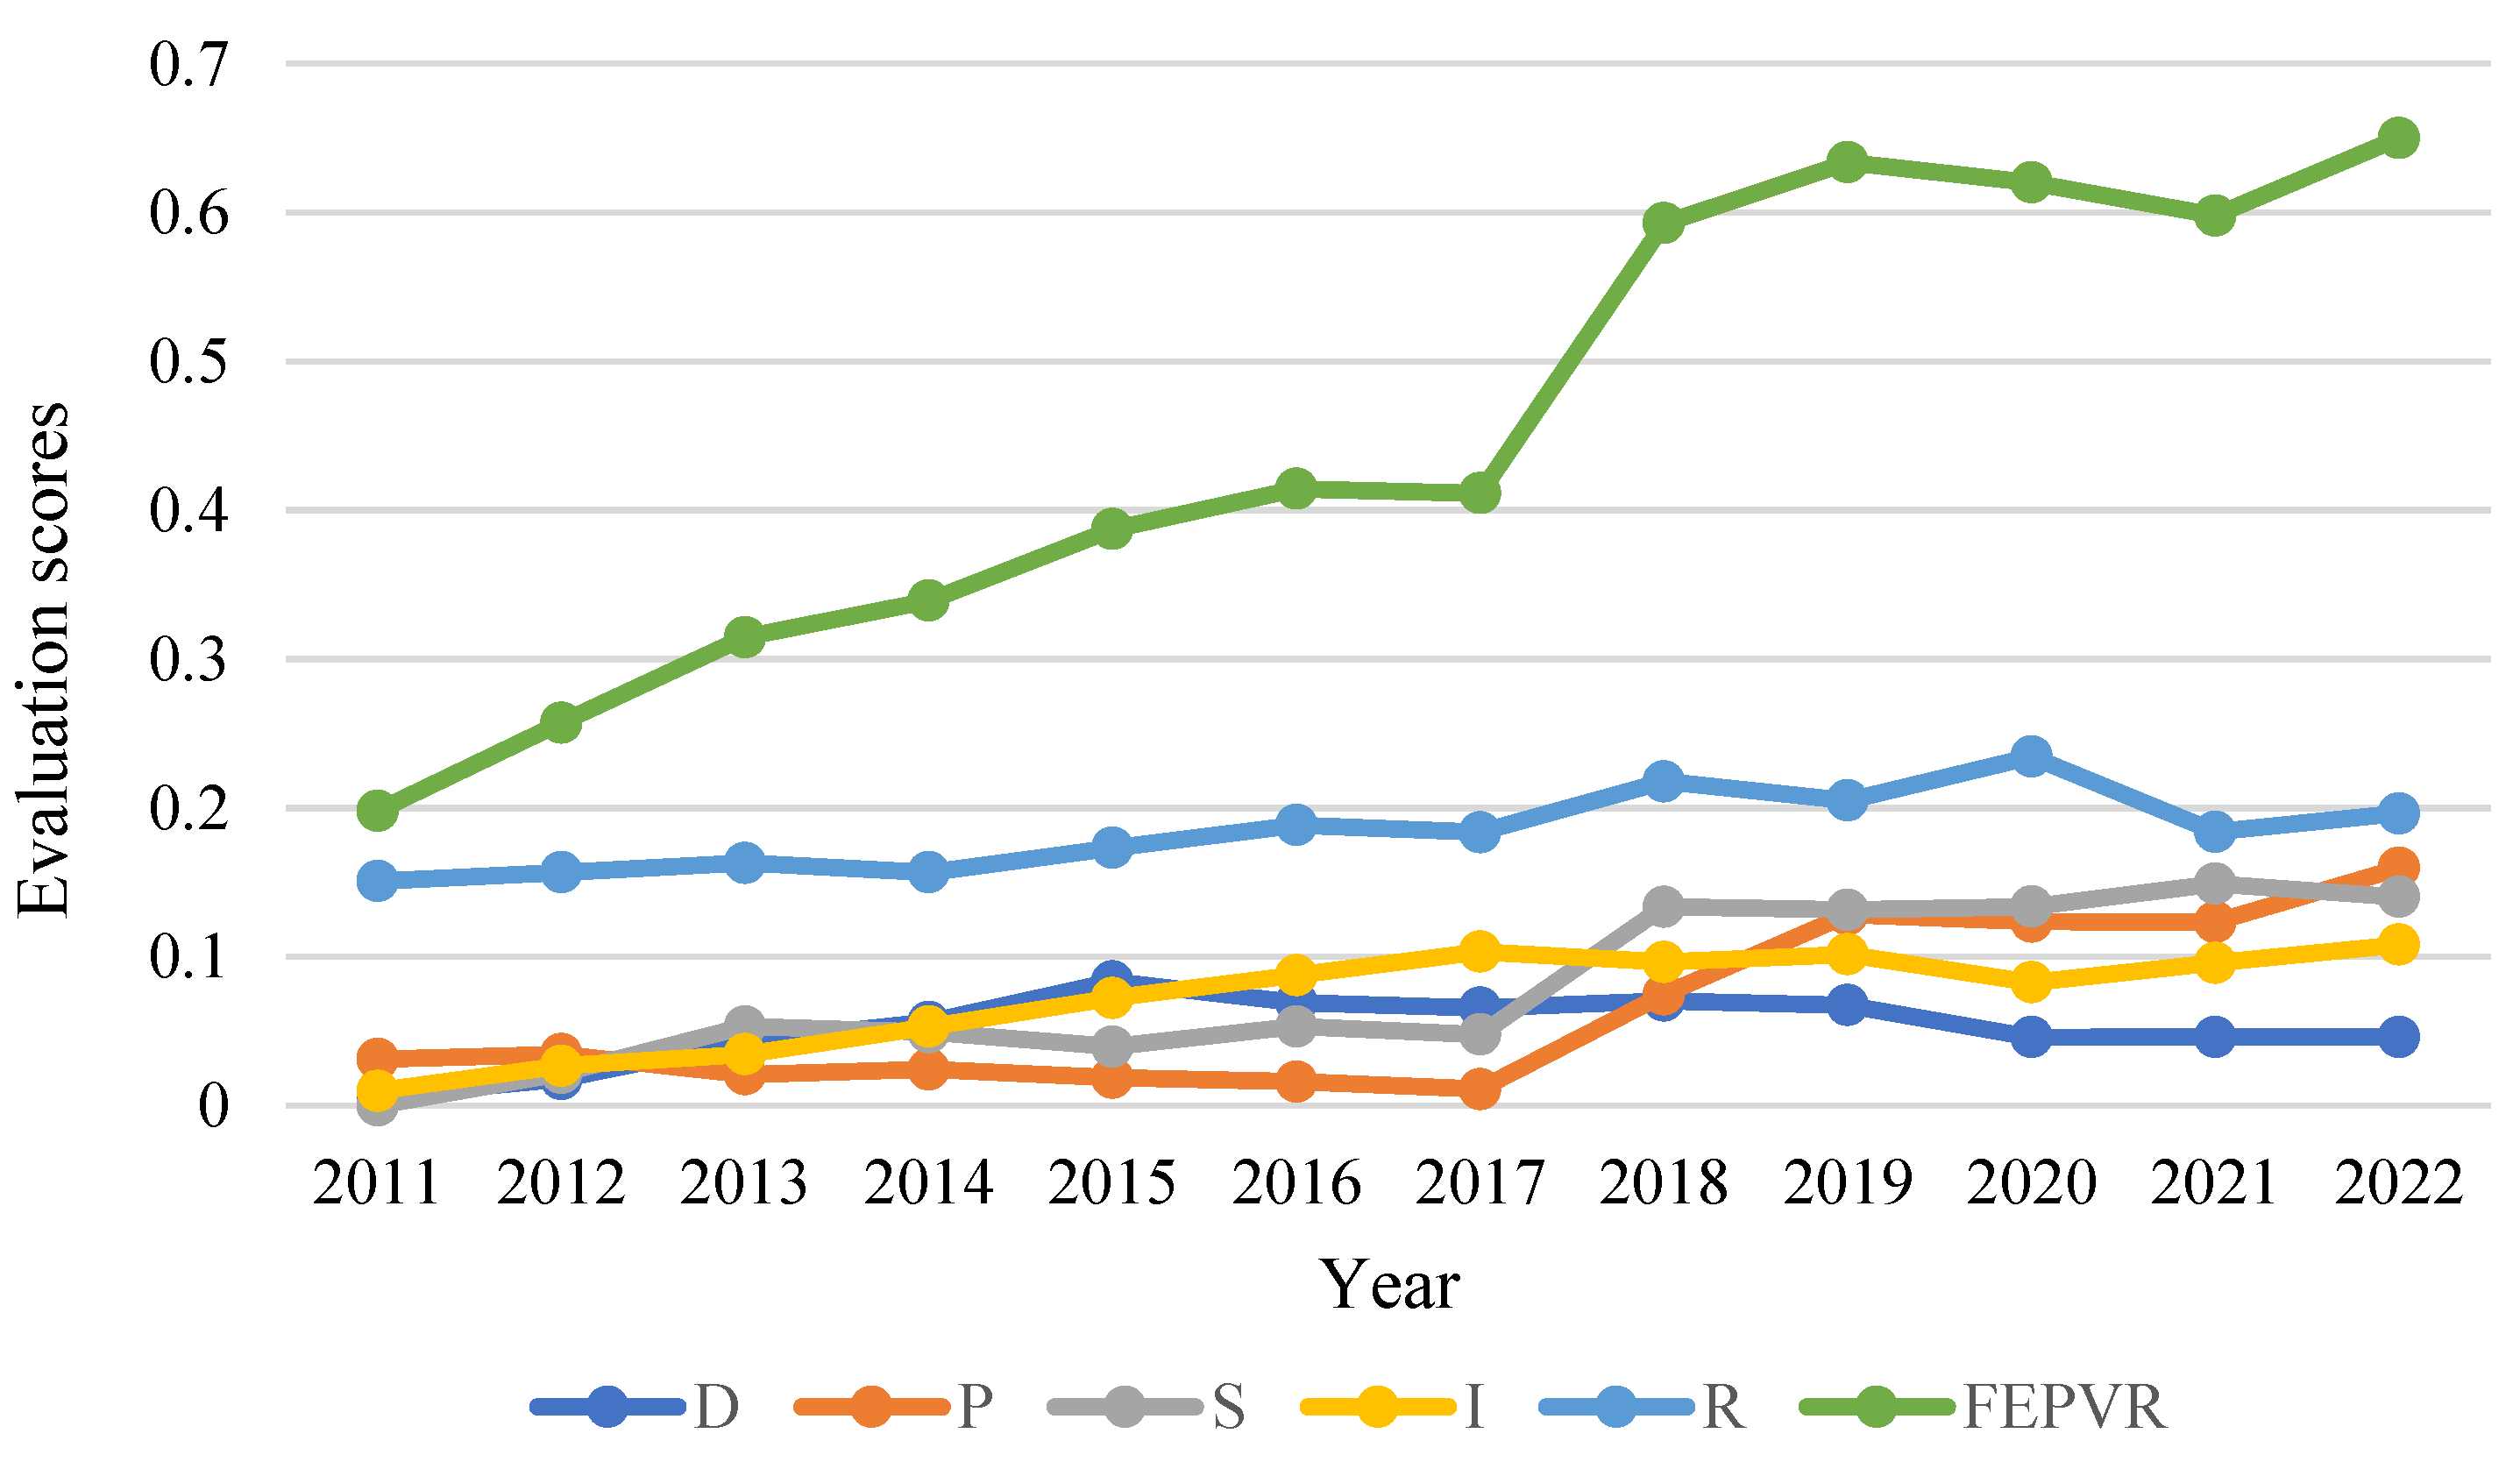
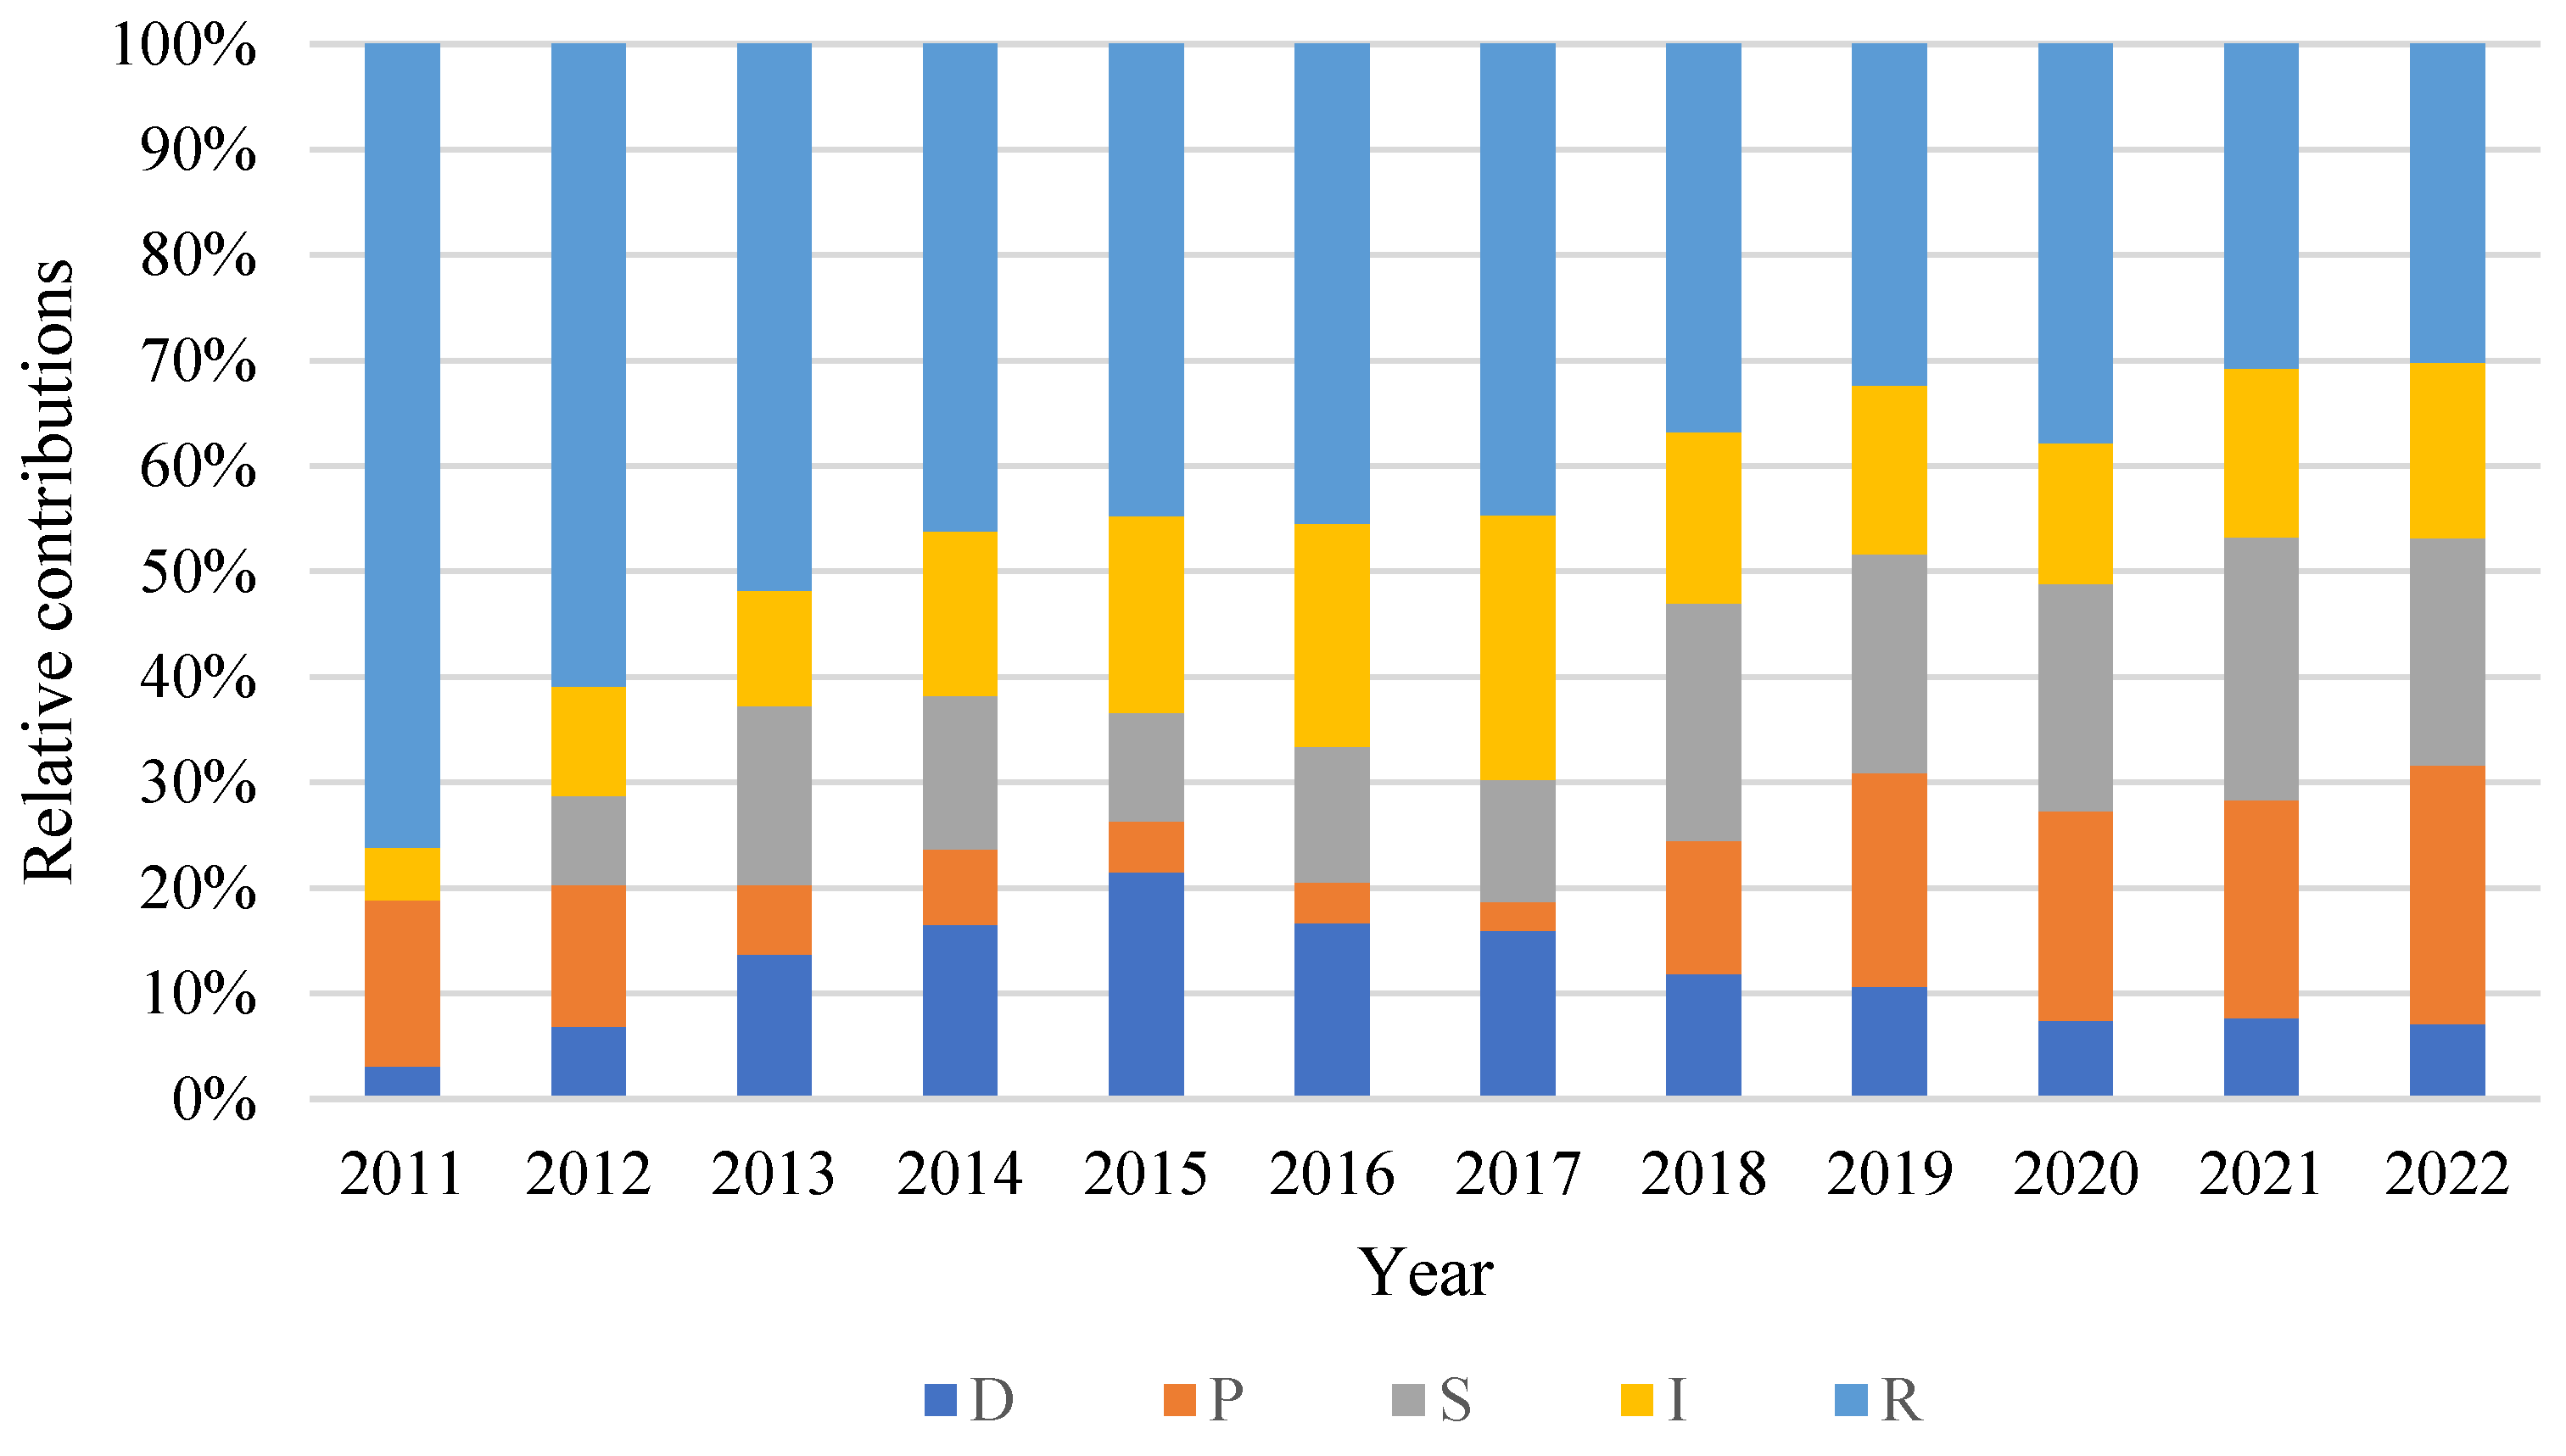
4.2. Temporal Trends in the Effectiveness of FFEPVR in China

Overall, the effectiveness of FEPVR showed an upward trend (Figure 2), with the composite index increasing from 0.1980 in 2011 to 0.6501 in 2022, indicating that China has made good progress in FEPVR. Meanwhile, it could also be seen that there were several distinct temporal features of this process: 2011–2016 was a period of slow development, 2017–2018 was a period of fast development, 2019–2021 was a short period of fallback, and the upward trend continued in 2022.
The effectiveness scores of the different subsystems all showed fluctuations, but the changes were small (Figure 2). Except for the Response subsystem, the effectiveness scores of the remaining subsystems were low. The average effectiveness scores for the Drive subsystem, Pressure subsystem, State subsystem, Influence subsystem, and Response subsystem were 0.0514, 0.0638, 0.0794, 0.0727, and 0.1841, respectively. They confirmed that FEPVR had an important human contribution, i.e., forest ecosystems did not convert values spontaneously but required a variety of anthropogenic measures to intervene and guide them. At the same time, it could also be seen that the effectiveness of all subsystems still had significant room for improvement, especially the Driver subsystem. Its effectiveness score has shown a downward trend since 2015, which reflected that FEPVR was facing challenges brought about by economic, demographic, and social changes.
In addition, as shown in Figure 3, the relative contribution of the subsystems to the overall effectiveness varies over time. The contribution of the Response subsystem to overall effectiveness decreased, with the relative contribution decreasing from 76.15% in 2011 to 30.19% in 2022. Correspondingly, the contribution of the State subsystem and the Impact subsystem to overall effectiveness increased, with relative contributions increasing from 1.00% and 5.01% in 2011 to 21.57% and 16.61% in 2022, respectively. The relative contribution of the Driver subsystem showed an increasing trend, followed by a decreasing trend, with the maximum value occurring in 2015 (21.52%). The relative contribution of the Pressure subsystem showed a decreasing trend, followed by an increasing trend, with the maximum value occurring in 2022 (21.57%). This phenomenon indicated that, as the most flexible of all subsystems, the Response subsystem improved or adjusted the other subsystems to varying degrees in different ways, especially with obvious effects on the State subsystem and the Impact subsystem. It also meant that as the ecological advantages of forests became more obvious, the ecological dividend was gradually released, and it was no longer necessary to rely excessively on human factor inputs.

4.3. Situations of Coupling Coordination between Different Subsystems

The results of the coupling coordination degree between the different subsystems are shown in Figure 4. It can be seen that the coupling coordination of different subsystems gradually improved, but there was still much potential for enhancement. D–P, P–S, and S–I were similar, and the coupling coordination degree was at a low level, indicating that the Driver subsystem still faced a large “system friction” when transmitting to the Impact subsystem. I–R, R–D, and R–P were similar, and the coupling coordination degree was large but relatively stable, reflecting the role of the continuous output of “human labor” in leading the driving force and reducing the pressure. The coupling coordination situation of R-S and the whole system (D–P–S–I–R) was similar.

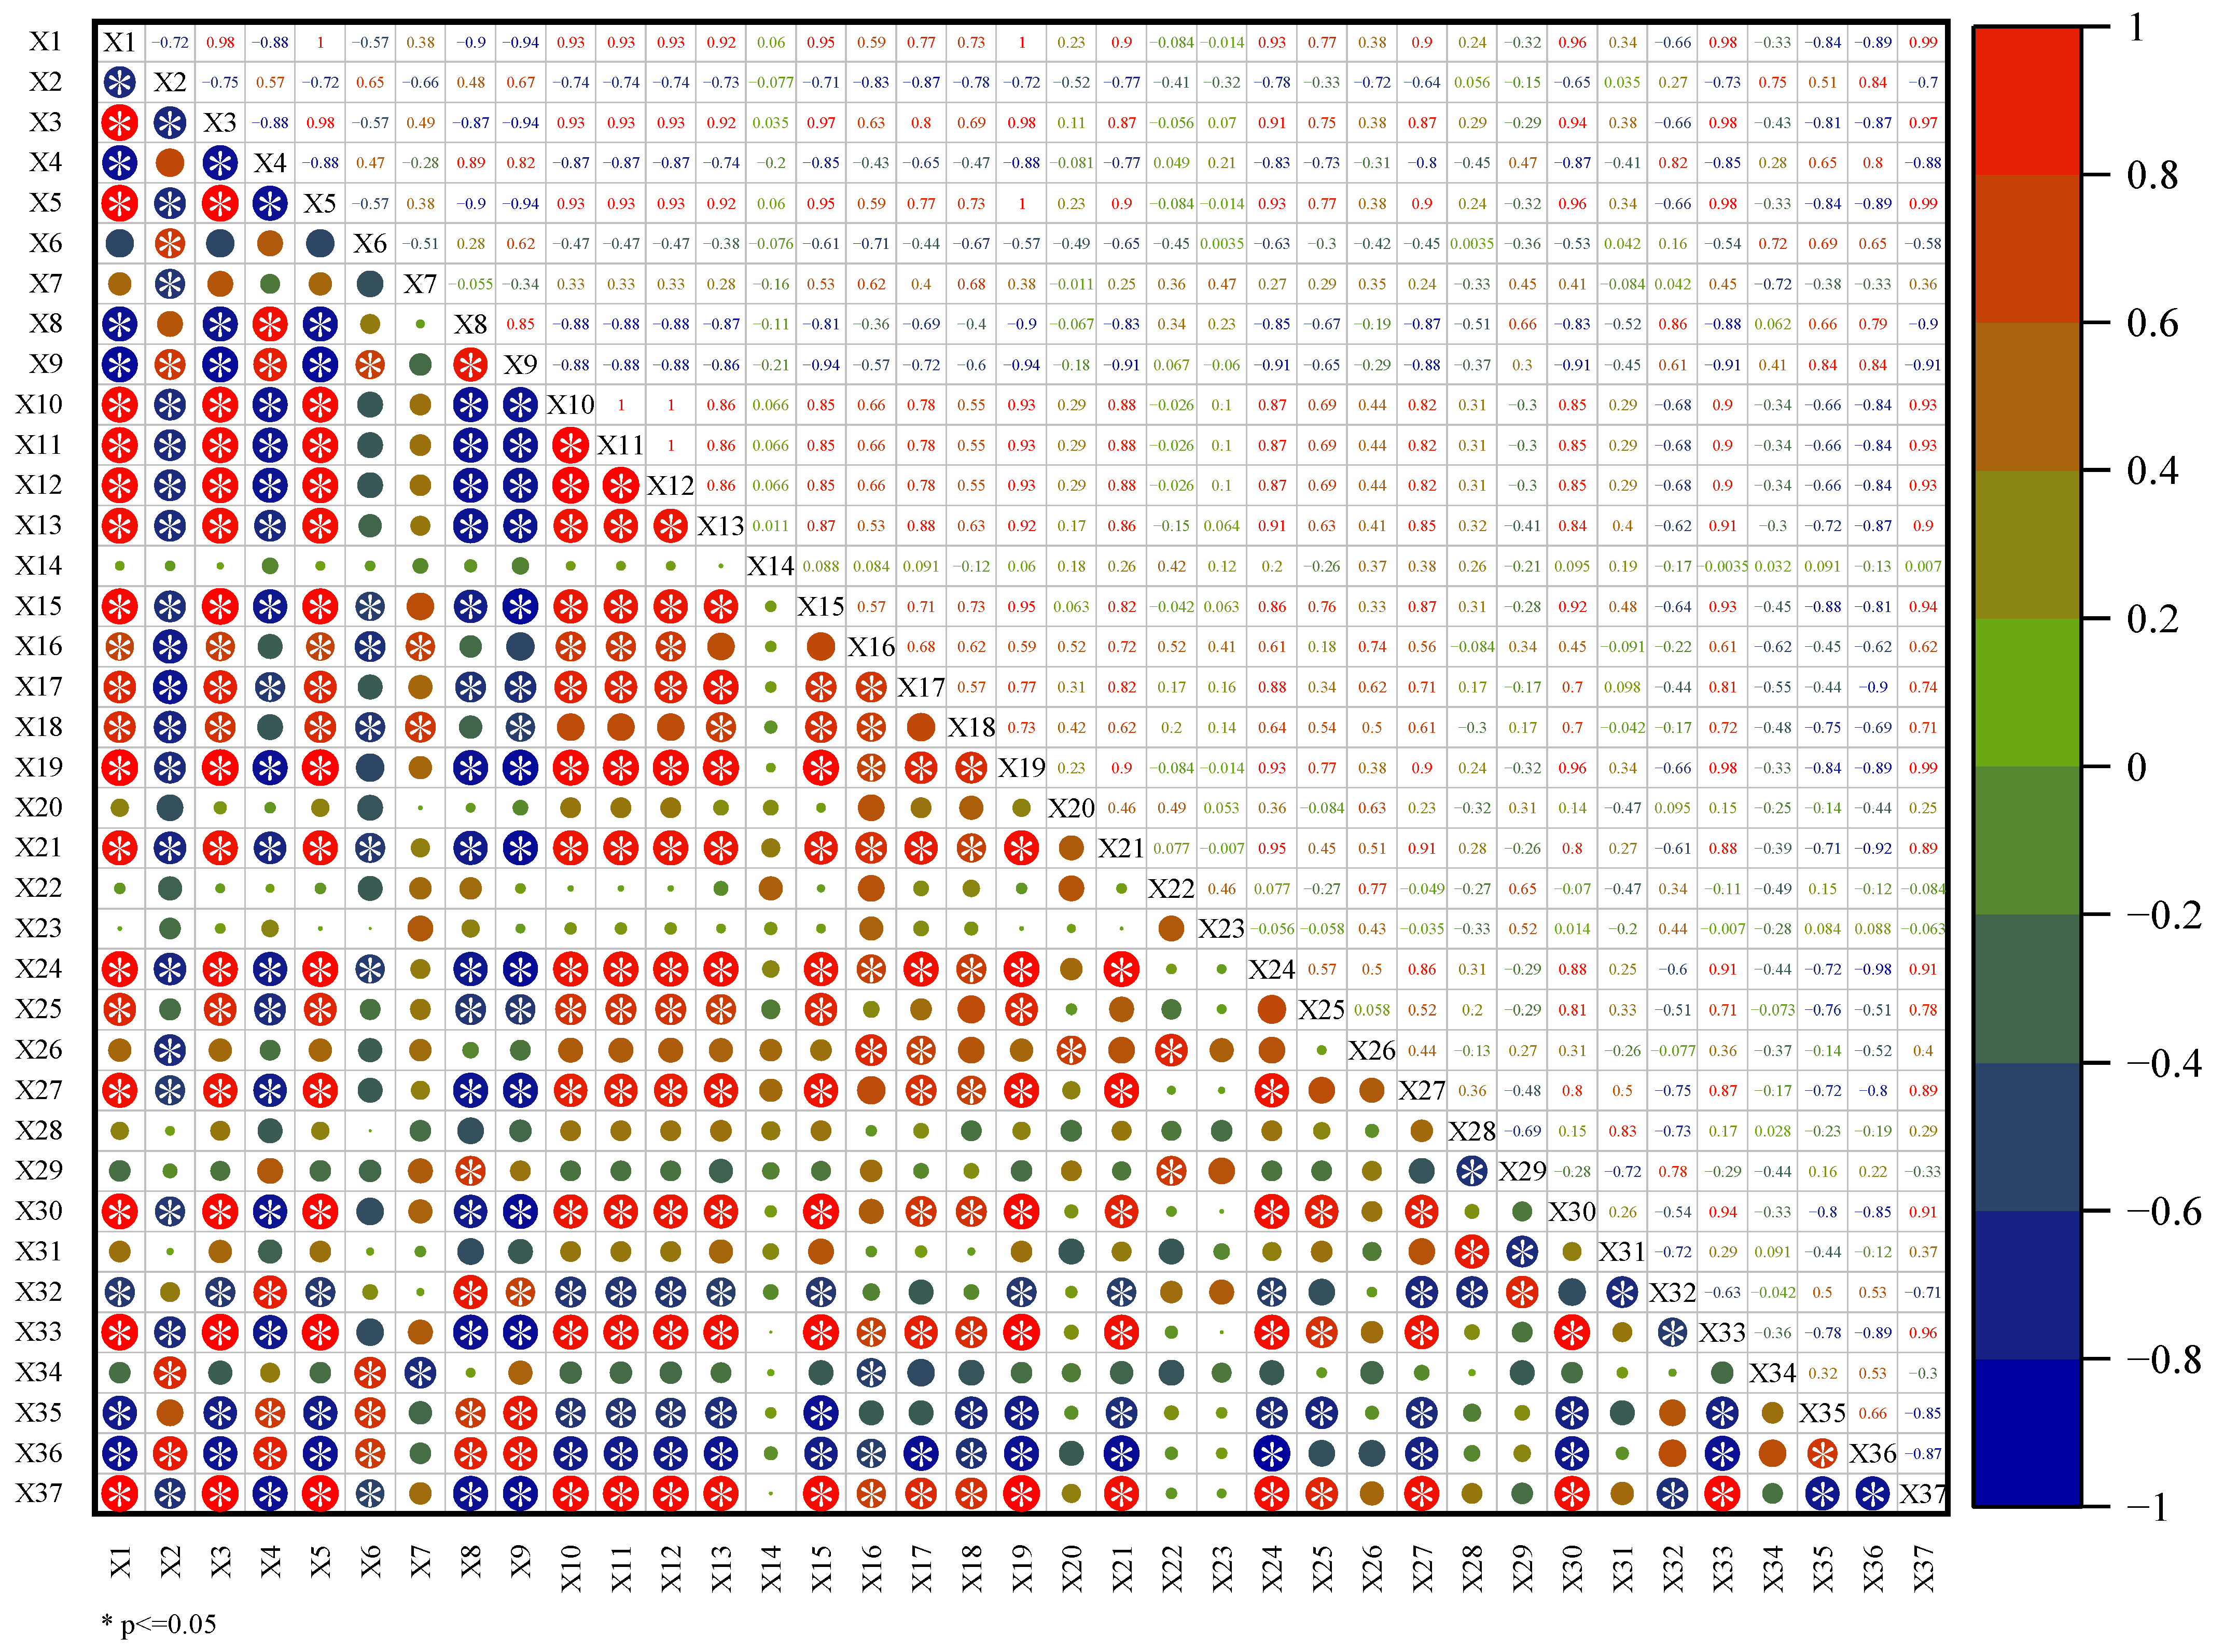
4.4. Trade-Offs and Synergies between Different Indicators

The correlation between the evaluation indicators is shown in Figure 5. The proportion of correlation between indicators was as follows: non-significant relationship (52.4%) > synergistic relationship (27.8%) > trade-off relationship (19.8%), indicating that most of the indicators kept strong independence and that the synergistic effect was not fully played. From the perspective of the standardized layer, the proportion of indicator correlation of the Driver subsystem was as follows: trade-off relationship (40.0%) > non-significant relationship (33.3%) > synergistic relationship (26.7%); the indicator correlation of the Pressure subsystem showed a non-significant relationship (66.7%), and the others showed a synergistic relationship. The indicator correlation of the State subsystem showed a synergistic relationship (60.0%), and the others showed a non-significant relationship; the indicator correlation of the Impact subsystem showed a synergistic relationship (61.9%), and the others showed a non-significant relationship. The indicator correlation of the Response subsystem was as follows: non-significant relationship (69.2%) > trade-off relationship (15.8%) > synergistic relationship (15.0%). The correlation profile of indicators varied across subsystems, reflecting the internal complexity of FEPVR.

5. Discussion

5.1. Reasonableness of Evaluation Results

5.1.1. FEPVR Trends Were Similar to General EPVR

Xie et al. [47] found that the comprehensive effectiveness of EPVR in China increased from 0.1481 in 2011 to 0.7680 in 2021, and there were two distinct periods of development, namely, the slow exploration period (2011–2016) and the rapid development period (2017–2021), similar to the results of this study. We found that the overall development trend of FEPVR in China was consistent with the trend of general EPVR. The difference was that FEPVR showed a significant fallback (2019–2021) after the rapid development period (2017–2018).

5.1.2. FEPVR Would Be Affected by the Realistic Context of EPVR

As an important component of EPVR, the effectiveness of FEPVR would be affected by the degree of EPVR development [32,33,34,35,36,39]. From 2011 to 2016, the development of EPVR was very slow due to an insufficient understanding of EPs, EPVR, and other related basic concepts and the failure to develop effective models and development paths [14,23,32], which also made it difficult to generate endogenous dynamics of EPVR in the forest domain (FEPVR). With the deepening of the practice, the Chinese government issued Several Opinions on Improving the Strategy and System of Main Functional Areas in August 2017 [14,22], which explicitly required localities to transform the concept of eco-product value into practical actions, and Xi Jinping’s speech at the Symposium on Promoting the Development of the Yangtze River Economic Belt in April 2018 explicitly put forward the direction of the development and specific requirements for EPVR [71], which gave the EPVR an unprecedented development prospect, and created a favorable external environment for the rapid development of FEPVR. From 2019 to 2021, impacted by COVID-19, social and economic resources were tilted toward epidemic prevention and control [72,73], and the consumption of FEPs decreased [74], leading to a falling trend in the effectiveness of FEPVR, but the decline was small.

5.1.3. Key Forestry Initiatives Advanced Substantial Progress in FEPVR

FEPVR was closely linked to the characteristics of forestry itself [33,35,36]. First, forestry was characterized by a long production and management cycle, high investment costs, and high operational risks and was prone to financing constraints [75]. Therefore, financial support was crucial. Green finance could attract social capital into different processes of FEPVR, including production, distribution, exchange, and consumption, and reduce the risk of cash flow breaks in the operation of forest ecological projects [76]. To this end, in August 2016, the Chinese government issued the Guiding Opinions on Building a Green Financial System [77], set up a green development fund, expanded investment in green industries through the Public-Private-Partnership (PPP) model, and gradually improved forest-related disaster insurance systems, such as natural disaster insurance and weather index insurance [78].
Second, due to the characteristics of forest resources, such as decentralization and cross-regionality, they were prone to the problem of unclear property rights attribution [79]. However, the process of evolving from forest ecological resources to FEPs was often closely linked to forest ecological assets [31]. The formation of forest ecological assets could not be separated from the clarification of property rights over forest resources [48]. Only in this way could the use value of forest ecological resources be transformed into the value of production factors, participate in production activities, and create conditions for FEPVR (market exchange value) [80]. To this end, in November 2016, the Opinions on Improving the Collective Forest Rights System was issued [81] to further clarify the property rights of forestry, strengthen the protection of forest rights and interests, and gradually establish a mechanism for the operation of the separation of ownership, contracting, and management rights of forest land.
Third, when FEPs flowed into the market for trading, consumers played an important role in this process. Increasing consumer recognition of FEPs would help enhance the stability of FEPVR [82]. Consumption guidance and tips were often provided internationally through Eco-Label, which is essentially an environmental performance certification introduced by government agencies and other social organizations [83]. To this end, in September 2017, the State Forestry Administration issued the Notice on the Implementation of Forest Eco-label Product Construction Project [84,85], which made specific deployment for the establishment of the evaluation system and marketing and circulation system of forest Eco-Label products, and attached the General Rules for National Forest Eco-Label Products to the document to provide norms and guidance for the actual work.

5.2. Comparison to Other Studies

5.2.1. Stabilized Forest Ecosystems Were a Fundamental Condition for FEPVR

FEPs originate from forest ecosystems [32,36]. To ensure the sustainability of the supply capacity of FEPs, the stability of forest ecosystems needs to be continuously enhanced so that the structure and function of forest ecosystems can better serve the production process of high-quality FEPs and enhance the potential of FEPVR [34,39]. Therefore, ecological restoration should be carried out for the areas with fragile forest ecological environments [32,36]. For example, after ecological restoration, the quality of karst forest ecosystems improved comprehensively, laying a solid foundation for the development and operation of the forest ecological industry [86]. However, ecological restoration could not blindly pursue “pure greening” and focus only on forest quantity. The sustainable output of forest ecosystem services also needs to rely on good forest management and accurate improvement of forest quality [87]. Many countries in Europe have incorporated elements of sustainable forest management and multifunctional forest management into core forest policies, such as the New EU Forest Strategy for 2030 [88]. In addition to the ecological projects mentioned in the Section 1, China has also been making efforts to promote the implementation of the Forest Quality Precision Improvement Project [89]. A typical case was that Nanping City in Fujian Province improved the yield of forest land and the ecological benefits of forests through the implementation of a fine-quality improvement project for national reserve forests [90].

5.2.2. Ecosystem Service Value (ESV) of Forests Was the Potential of the FEPVR

In order to clearly quantify the value of EPs, scholars have attempted to carry out ESV accounting and valuation work and present it in the form of currency value [91]. Currently, common methods include the equivalent factor method [92], functional value method [93], and energy analysis method [94], all of which are applicable to forest ecosystems. Meanwhile, the international community has taken a series of actions to promote ESV accounting and application, including The Economics of Ecosystems and Biodiversity (TEEB) [95] proposed by the European Union, the Wealth Accounting and Valuation of Ecosystem Services (WAVES) [96] proposed by the World Bank, and the System of Environmental-Economic Accounting-Central Framework (SEEA-CF) [97] and System of Environmental-Economic Accounting-Ecosystem Services (SEEA-EA) [98] published by the United Nations Statistical Division. In fact, these actions have provided valuable experience for the development of the value accounting of EPs in the field of forests. Accordingly, referring to international accounting ideas and methods, China released a national standard called Specifications for Assessment of Forest Ecosystem Services (GB/T 38582-2020) in 2020 [99]. To meet the development form of EPVR, in 2022, China issued a guideline document called Specification on Accounting for Gross Ecological Product Value, in which the method of accounting for the value of FEPs was clarified [100]. This greatly facilitated the formation of the price mechanism for FEPs and was conducive to the advancement of FEPVR.
Some scholars have already studied the ESV of forests in China. Xu et al. [101] showed that from 2001 to 2020, forest ESV in China showed an increasing trend, with an average annual forest ESV of RMB 9.99 trillion. The average annual forest ESVs in the last 10 years (2011–2020) were significantly higher than those in the previous 10 years (2001–2010). Similarly, Wang and Niu [102] found that the forest ESV of China’s eighth forest inventory (2009–2013) and ninth forest inventory (2014–2018) were RMB 12.68 trillion and RMB 15.88 trillion per year, respectively. Therefore, the increase in forest ESV in China will provide a broader prospect for FEPVR.

5.2.3. Specific Pathways and Models Were Practice Means for FEPVR

According to the difficulty of value realization, the paths of FEPVR could be classified as direct and indirect paths [35]. Specifically, the direct path refers to the process by which forest ecological resources could be directly transformed into FEPs and their value could be realized in the market without relying on other forms, especially applicable to material supply FEPs [33]. For example, high-quality forest fruits, beverages, spices, and medicinal herbs could be cultivated by utilizing the region’s unique ecological environment and resource advantages [39]. The indirect path refers to the process of adding value to forest ecological resources through the rational allocation of forest ecological assets, technological means, industrial combinations, innovative policies, and financial instruments, which usually involve the productization of cultural and regulation services provided by forest ecosystems [80], for example, the development of forest eco-tourism through concessions and the development of forest carbon sink products through environmental regulation, establishing a “Forest Ecology+” model [31].
According to the different participants, the paths of FEPVR could be classified as governmental and market paths [103]. Generally speaking, to improve the efficiency of resource allocation, the market path should be the preferred path for FEPVR. However, in economically underdeveloped remote mountainous areas, the market mechanism for FEPs was not sound, and it was difficult for social capital to participate in it [39]. So, it was still necessary to internalize the externalities of FEPs through the governmental path, which was highlighted in the forest ecological compensation model [80]. The government could adjust the regional allocation of funds using fiscal transfers to pay for ecological services or provide ecological compensation to those contributing to the protection of forest ecosystems, such as the Conservation Plan for the Amazon Protection Area [104] and the National Forest Fund Program of Costa Rica [105].
The market path includes the ecological industrialization model, the ecological resource index and property rights trading model, and the ecological protection, restoration, and value-added model [23,106]. First, eco-industrialization is a process of continuously adjusting and optimizing the structure of the forestry industry by taking good forest ecology as the core production factor and promoting the evolution of FEPs in the direction of industrialization [23,39]. For example, Japan has been vigorously developing the forest recreation and nutrition industries [107]. Second, the FEB is a concrete practice of the ecological resources index and property rights trading model, which has received widespread attention [40]. In fact, it is a forest asset operation and management platform that promotes the flow of forest ecological resource property rights and facilitates the assetization of forest ecological resources by clarifying forest land property rights, carrying out forest resource reserve assessment and forest asset assessment, and grafting financial instruments [31,80]. Third, social capital could enter the forest ecological restoration project in an orderly manner and be developed based on the original industry, such as eco-tourism, eco-education, eco-picking, and other experiential eco-industries, to extend the industrial chain and improve the added value of the industry [39,108].

5.3. Analysis of Research Contributions and Limitations and Future Research Perspectives

5.3.1. Research Contributions

Based on previous insights about EPVR effectiveness research, this study focused on the forestry domain, designed a FEPVR effectiveness evaluation index system that matched the characteristics of China’s forestry development by selecting reasonable forestry statistical indicators, and conducted empirical analyses, which contributed to both theory and practice.
(1)
Theoretical Contributions
EPVR could be seen as a concrete practice for the implementation of Nature-based Solutions (NbSs) and the realization of ESV in China [15,106]. FEPVR could be seen as an extension of these two aspects in the forestry field. First, this study contributed to our understanding of EPVR, examined the FEPVR process from a multidimensional perspective with the help of system theory viewpoints, which contributed to the deepening of the understanding of FEPVR, filled the gaps in the index system of FEPVR effectiveness evaluation, and made the theoretical system more complete. Second, it promoted the application of the DPSIR model in the development of the forestry industry and forest governance and consolidated and verified the labor theory of value, the ecological capital theory, the resource value theory, and the “Two Mountains” theory [11,13,109,110]. Third, it expanded global ecosystem service research, enriched relevant empirical results, and strengthened the link between society and forest ecosystems, which could lay the foundation for integration into the social–ecological system (SES) framework [111].
(2)
Practical Contributions
First, this study provides an effective tool that could evaluate the progress of China’s FEPVR regularly and facilitate continuous data monitoring. The FEPVR effectiveness index could also be used as an important indicator in the regional sustainable development evaluation system [112]. Second, it followed the result-oriented logic in constructing the evaluation index system, which helped point out the optimization direction of FEPVR and provided policy inspiration for decision-makers so that purposeful and targeted measures could be taken to optimize the process of the different segments and explore new development modes and promotion paths. Third, it could provide a new window for the international community to understand China’s ecological civilization construction [11], which demonstrates the practical features of ESV in China as well as the innovative approaches to forestry transformation and ecological governance. It also provides new ideas for the rational utilization of ecological resources and the transformation of ecological advantages into economic development advantages.

5.3.2. Limitations and Future Research Perspectives

On the one hand, although this study tried its best to obtain indicators related to FEPVR, some indicators were not included in the evaluation index system due to a lack of data, for example, the amount of forestry carbon sink trading and the operational effect of the FEB [40]. At the same time, due to the difficulty of quantification, some factors had a greater impact on China’s forestry development, such as the forest chief scheme [113] and the game situation of stakeholders [114] (government, forest farmers, and enterprises), and were not evaluated properly. On the other hand, this study used the entropy weight method to determine the weights of the indicators to ensure a high degree of objectivity. However, this might also be affected by data variability, and in the future, consideration could be given to combining the Delphi method for comparison while balancing both professionalism and objectivity. In addition, FEPVR is a changing systematic project. In the future, indicators reflecting the quality of forest assets and the results of value accounting of FEPs should be included according to their development characteristics, thereby appropriately amending and improving the existing indicator system.

6. Conclusions and Recommendations

6.1. Conclusions

This study constructed a quantitative evaluation index system for FEPVR effectiveness based on the DPSIR model and explored the historical development trend of FEPVR in China through empirical analysis to test the rationality of the index system; the main conclusions are as follows.
In general, FEPVR in China has already made good progress and gradually shifted from slow exploration to rapid development, with 2017 marking an important turning point. The comprehensive evaluation index of FEPVR increased from 0.1980 in 2011 to 0.6501 in 2022. The Response subsystem effectiveness scored the highest and was the primary factor advancing the increase in the composite index, but its contribution to overall system effectiveness decreased over time. Correspondingly, the State and Impact subsystems increased their contribution to the overall effectiveness. Although the coupling coordination between different subsystems gradually improved, it was still at a low level. There were obvious differences in the correlation of indicators in different subsystems, and the correlation between indicators was dominated by a non-significant relationship with a synergistic relationship at a low level; so, there was still a need to strengthen policy guidance in the future and promote the formation of all-factor synergies.

6.2. Recommendations

6.2.1. Enhancing the Sustainable Supply of FEPs

A scientific forest ecological compensation program will play an important role in forest ecosystem protection and sustainable development [80,104,105]. The proportion of national financial investment to forestry investment completion (X27) and the proportion of investment in forest ecological restoration and management to forestry investment completion (X28) should be continuously enhanced, and the input of funds for ecological compensation should be increased. The cost of ecological protection and restoration should be used as the basis for the design of the ecological compensation scheme, the scope of the application of ecological compensation should be continuously expanded, and the compensation standard for key forestry projects and public welfare forests should be enhanced to increase the ecological supply. Also, the livelihood and development of the indigenous people in forest areas should be properly resolved through an innovative compensation system for migration and an employment system for eco-forest rangers.
To enhance the dynamic observation of the quantity and quality of FEPs, the long-term monitoring of forest ecosystems and the identification and registration of rights to forest resources should be carried out [48,80]. On the one hand, it is not only necessary to integrate the existing forest ecological positioning observatory data, improve the forest resources survey methodology, and enhance the assessment accuracy but also to formulate a classification system and a list of product catalogs of FEPs as soon as possible based on the basic resource data to inform forest management. On the other hand, the prerequisite for the assetization of forest resources is that the quantity of resources and the boundaries of ownership are clear [90,106]. In the future, a multifunctional database of FEPs’ attributes should be established by combining emerging digital technologies, such as big data, blockchain, and cloud platforms.

6.2.2. Cultivating the Consumer Market for FEPs

The market share of FEPs can be enhanced by a distinctive eco-industry model [23,39]. Under the premise of ensuring forest ecological security and sustainable utilization of forest resources, based on the conditions of forest resource endowment, it should promote the linkage development of primary, secondary, and tertiary industries in forestry and strive to build a whole industry chain of FEPs. Not only should the focus be on the development of characteristic crop farming, such as fruits, flowers, and medicinal herbs, but several processing bases for FEPs should also be cultivated. As society advances, people are increasingly attracted to experiential services and cultural services [32]. Therefore, it is necessary to strengthen the construction of forest parks, forest towns, and forest cities and to promote the integrated development of forest recreation and forest eco-tourism industries, such as nature education, forest experiences, forest healthcare, and mountain sports, to continuously satisfy consumer demand.
The construction of a perfect market circulation system can effectively enhance the degree of FEP marketization. It is necessary to focus on the role of the enterprise as the market’s main body and to guide the private sector with the conditions to actively participate in forestry ecological projects through the PPP model or the Eco-environment Oriented Development (EOD) model [115]. At the same time, it should continue to promote the work related to forest rights mortgage and forest insurance and consider introducing financial instruments such as futures and bonds to enhance the vitality of market financing. In addition, the development of new brands of FEPs other than Forest Eco-label Products and Geographical Indications of Forest Products should also be continued, and the implementation of Forest Stewardship Council (FSC) certification should be strengthened to increase market visibility and recognition.

6.2.3. Improving the Forestry Carbon Trading Mechanism

Most material supply and cultural service FEPs can unlock their economic benefits through the eco-industry approach mentioned above, but regulating service FEPs are characterized by strong externalities, and their economic value is not obvious [36]. At present, to mitigate global climate change, the international community has jointly signed the Kyoto Protocol and established the “REDD+” (Reducing Emissions from Deforestation and forest Degradation, plus the sustainable management of forests, and the conservation and enhancement of forest carbon stocks) framework [116]. Correspondingly, China is vigorously implementing a “dual-carbon” strategy [117]. Forestry carbon trading is seen as an important way to realize the goals of this strategy and has great prospects for development.
Due to the limitation of data availability, this study did not include the forestry carbon sink trading amount in the evaluation system. In the future, we should improve the forestry carbon trading mechanism, promote the inclusion of forestry carbon sinks into the carbon emission trading system, and develop various forms of forestry carbon sink products [106]. First, a market access system should be established to release price signals for forestry carbon sink products and allow different market players to purchase these products through specific market trading platforms. Second, from the supply side of the market, it is important to gradually improve the methodology of validated forest carbon projects so that it can be applied to project development and to ensure the scientific and rational nature of the implementation process. Third, from the market demand side, in addition to taking emission control enterprises as the main target, we should also improve the carbon neutral capacity of forestry carbon sink products in some large-scale activities, such as concerts and sports events, and continuously enrich the application scenarios of the products.

Author Contributions

Conceptualization, X.X. and R.Z.; methodology, X.X.; software, X.X.; validation, X.X., S.C. and R.Z.; formal analysis, X.X.; data curation, X.X.; writing—original draft preparation, X.X.; writing—review and editing, S.C. and R.Z.; supervision, S.C. and R.Z.; project administration, S.C.; funding acquisition, S.C. and R.Z. All authors have read and agreed to the published version of the manuscript.

Funding

This research was funded by the Fundamental Research Funds of the Chinese Academy of Forestry (No. CAFYBB2022MC001), the National Social Science Foundation of China (No. 22BGL313), and the Fourth Batch of Forestry and Grassland Science and Technology Innovation Youth Talent Project: Mechanism of Value-Added of Ecological Product Value Realization and Effectiveness Evaluation (No. 500102-3068).

Data Availability Statement

Data are contained within the article.

Conflicts of Interest

The authors declare no conflicts of interest.

Abbreviations

ESsEcological services
EPsEcological products
EPVREcological product value realization
SDGsSustainable Development Goals
FEPsForest ecological products
FEPVRForest Ecological Product Value Realization
FEBForest Ecological Bank
DPSIRDriver–Pressure–State–Impact–Response
TOPSISTechnology for Order Preference by Similarity to an Ideal Solution
PPPPublic-Private-Partnership
ESVEcosystem service value
TEEBThe Economics of Ecosystems and Biodiversity
WAVESWealth Accounting and Valuation of Ecosystem Services
SEEA-CFSystem of Environmental-Economic Accounting-Central Framework
SEEA-EASystem of Environmental-Economic Accounting-Ecosystem Services
NbSsNature-based Solutions
SESsSocial–ecological systems
EODEco-environment Oriented Development
FSCForest Stewardship Council
REDD+Reducing Emissions from Deforestation and forest Degradation, plus the sustainable management of forests, and the conservation and enhancement of forest carbon stocks

References

  1. Scharlemann, J.P.W.; Brock, R.C.; Balfour, N.; Brown, C.; Burgess, N.D.; Guth, M.K.; Ingram, D.J.; Lane, R.; Martin, J.G.C.; Wicander, S.; et al. Towards understanding interactions between Sustainable Development Goals: The role of environment–human linkages. Sustain. Sci. 2020, 15, 1573–1584. [Google Scholar] [CrossRef]
  2. Bennett, E.M.; Peterson, G.D.; Gordon, L.J. Understanding relationships among multiple ecosystem services. Ecol. Lett. 2009, 12, 1394–1404. [Google Scholar] [CrossRef] [PubMed]
  3. Hernández-Blanco, M.; Costanza, R.; Chen, H.; DeGroot, D.; Jarvis, D.; Kubiszewski, I.; Montoya, J.; Sangha, K.; Stoeckl, N.; Turner, K.; et al. Ecosystem health, ecosystem services, and the well-being of humans and the rest of nature. Glob. Chang. Biol. 2022, 28, 5027–5040. [Google Scholar] [CrossRef] [PubMed]
  4. Torres, A.V.; Tiwari, C.; Atkinson, S.F. Progress in ecosystem services research: A guide for scholars and practitioners. Ecosyst. Serv. 2021, 49, 101267. [Google Scholar] [CrossRef]
  5. Zhang, C.; Li, J.; Zhou, Z. Ecosystem service cascade: Concept, review, application and prospect. Ecol. Indic. 2022, 137, 108766. [Google Scholar] [CrossRef]
  6. Costanza, R.; De Groot, R.; Braat, L.; Kubiszewski, I.; Fioramonti, L.; Sutton, P.; Farber, S.; Grasso, M. Twenty years of ecosystem services: How far have we come and how far do we still need to go? Ecosyst. Serv. 2017, 28, 1–16. [Google Scholar] [CrossRef]
  7. Jayachandran, S. How economic development influences the environment. Annu. Rev. Econ. 2022, 14, 229–252. [Google Scholar] [CrossRef]
  8. Henderson, K.; Loreau, M. A model of Sustainable Development Goals: Challenges and opportunities in promoting human well-being and environmental sustainability. Ecol. Model. 2023, 475, 110164. [Google Scholar] [CrossRef]
  9. Barbier, E.B. The evolution of economic views on natural resource scarcity. Rev. Environ. Econ. Policy 2021, 15, 24–44. [Google Scholar] [CrossRef]
  10. Wunder, S.; Börner, J.; Ezzine-de-Blas, D.; Feder, S.; Pagiola, S. Payments for environmental services: Past performance and pending potentials. Annu. Rev. Resour. Econ. 2020, 12, 209–234. [Google Scholar] [CrossRef]
  11. Xue, B.; Han, B.; Li, H.; Gou, X.; Yang, H.; Thomas, H.; Stückrad, S. Understanding ecological civilization in China: From political context to science. Ambio 2023, 52, 1895–1909. [Google Scholar] [CrossRef] [PubMed]
  12. Li, L.; Fan, Z.; Xiong, K.; Shen, H.; Guo, Q.; Dan, W.; Li, R. Current situation and prospects of the studies of ecological industries and ecological products in eco-fragile areas. Environ. Res. 2021, 201, 111613. [Google Scholar] [CrossRef] [PubMed]
  13. Andueza, L. Value, (use) values, and the ecologies of capital: On social form, meaning, and the contested production of nature. Prog. Hum. Geogr. 2021, 45, 1105–1125. [Google Scholar] [CrossRef]
  14. Liu, J.; Su, X.; Liu, Y.; Shui, W. A Review of Research on Progress in the Theory and Practice of Eco-Product Value Realization. Land 2024, 13, 316. [Google Scholar] [CrossRef]
  15. Xu, Y.; Zhao, W.; Zhang, Z. The practice of nature-based solutions in China: Ecosystem product value realization. Curr. Opin. Environ. 2023, 36, 100514. [Google Scholar] [CrossRef]
  16. Jin, C.; Lu, Y. Review and prospect of research on value realization of ecological products in China. Econ. Geogr. 2021, 41, 207–213. (In Chinese) [Google Scholar]
  17. Zhang, L.; Yu, H.; Hao, C.; Wang, H.; Luo, R. Redefinition and Connotation Analysis of Ecosystem Product. Res. Environ. Sci. 2021, 34, 655–660. (In Chinese) [Google Scholar]
  18. Ma, G.; Wang, J.; Yu, F.; Yang, W.; Ning, J.; Peng, F.; Cao, D. Framework construction and application of China’s Gross Economic-Ecological Product accounting. J. Environ. Manage. 2020, 264, 109852. [Google Scholar] [CrossRef] [PubMed]
  19. Shen, P.; Wu, L.; Huo, Z.; Zhang, J. A Study on the Spatial Pattern of the Ecological Product Value of China’s County-Level Regions Based on GEP Evaluation. Int. J. Environ. Res. Public Health 2023, 20, 3181. [Google Scholar] [CrossRef]
  20. Zhang, L.; Yu, H.; Hao, C.; Wang, H. Practice Model and Path of Ecosystem Product Value Realization. Res. Environ. Sci. 2021, 34, 1407–1416. (In Chinese) [Google Scholar]
  21. Huang, Y.; Ma, R.; Zhou, W.; Yuan, Y.; Ren, J.; Cao, Y. Risk assessment and regulation between the supply and demand of ecological products: A comprehensive framework and case study. Ecol. Indic. 2023, 154, 110617. [Google Scholar] [CrossRef]
  22. Wang, K.; Liu, P.; Sun, F.; Wang, S.; Zhang, G.; Zhang, T.; Chen, G.; Liu, J.; Wang, G.; Cao, S. Progress in realizing the value of ecological products in China and its practice in Shandong Province. Sustainability 2023, 15, 9480. [Google Scholar] [CrossRef]
  23. Yang, B.; Zhang, Y.; Xiong, K.; Huang, H.; Yang, Y. A Review of Eco-Product Value Realization and Eco-Industry with Enlightenment toward the Forest Ecosystem Services in Karst Ecological Restoration. Forests 2023, 14, 729. [Google Scholar] [CrossRef]
  24. de Mello, N.G.R.; Gulinck, H.; Van den Broeck, P.; Parra, C. Social-ecological sustainability of non-timber forest products: A review and theoretical considerations for future research. For. Policy Econ. 2020, 112, 102109. [Google Scholar] [CrossRef]
  25. Zhu, J.; Song, L. A review of ecological mechanisms for management practices of protective forests. J. For. Res. 2021, 32, 435–448. [Google Scholar] [CrossRef]
  26. Chen, R.; Gao, Y.; Zhang, R.; Zhang, Z.; Zhang, W.; Meng, H.; Zhang, T. How Does the Experience of Forest Recreation Spaces in Different Seasons Affect the Physical and Mental Recovery of Users? Int. J. Environ. Res. Public Health 2023, 20, 2357. [Google Scholar] [CrossRef]
  27. Transforming Our World: The 2030 Agenda for Sustainable Development. Available online: https://sdgs.un.org/publications/transforming-our-world-2030-agenda-sustainable-development-17981 (accessed on 25 April 2024).
  28. Global Forest Resources Assessment 2020. Available online: https://www.fao.org/3/CA8753EN/CA8753EN.pdf (accessed on 11 January 2024).
  29. Chen, C.; Park, T.; Wang, X.; Piao, S.; Xu, B.; Chaturvedi, R.K.; Myneni, R.B. China and India lead in greening of the world through land-use management. Nat. Sustain. 2019, 2, 122–129. [Google Scholar] [CrossRef] [PubMed]
  30. China’s Green Development in the New Era. Available online: https://www.gov.cn/zhengce/2023-01/19/content_5737923.htm (accessed on 20 January 2024).
  31. Fang, Q.S.; Li, H.X. The concept delimitation, the value realization process, and the realization path of the capitalization of forest ecological resources. Nat. Resour. Forum 2021, 45, 424–440. [Google Scholar] [CrossRef]
  32. Wang, J.; Tian, G. Sustainability of Forest Eco-Products: Comprehensive Analysis and Future Research Directions. Forests 2023, 14, 2008. [Google Scholar] [CrossRef]
  33. Huang, W.; Chen, R.; Chen, W. Temporal and Spatial Analysis of the Changes in the Supply of Ecological Products in State-Owned Forest Farms after the Reform. Forests 2023, 14, 917. [Google Scholar] [CrossRef]
  34. Maier, C.; Hebermehl, W.; Grossmann, C.M.; Loft, L.; Mann, C.; Hernández-Morcillo, M. Innovations for securing forest ecosystem service provision in Europe—A systematic literature review. Ecosyst. Serv. 2021, 52, 101374. [Google Scholar] [CrossRef]
  35. Wang, N.; Xu, C.; Kong, F. Value Realization and Optimization Path of Forest Ecological Products—Case Study from Zhejiang Province, China. Int. J. Environ. Res. Public Health 2022, 19, 7538. [Google Scholar] [CrossRef] [PubMed]
  36. Wang, J.; Liu, W.; Kong, F. Research on Forest Ecological Product Value Evaluation and Conversion Efficiency: Case Study from Pearl River Delta, China. Land 2023, 12, 1803. [Google Scholar] [CrossRef]
  37. Ke, S.; Zhang, Z.; Wang, Y. China’s forest carbon sinks and mitigation potential from carbon sequestration trading perspective. Ecol. Indic. 2023, 148, 110054. [Google Scholar] [CrossRef]
  38. Zhang, X.; Yao, S. Spatial convergence and differentiation characteristics of ecological efficiency of forestry carbon sink: Evidence from China. Geosystems Geoenvironment 2024, 3, 100241. [Google Scholar] [CrossRef]
  39. Zhang, Z.; Xiong, K.; Zhang, Y.; Ning, Y. Research Progress on Forest Eco-Product Value Realization and Eco-Industry: The Inspiration for Planted Forests in Karst Desertification Control. Forests 2024, 15, 517. [Google Scholar] [CrossRef]
  40. Xu, D.; Wang, Y.; Wu, L.; Zhang, W. Evaluation of the Degree of the Value Realization of Ecological Products of the Forest Ecological Bank in Shunchang County. Forests 2023, 14, 2269. [Google Scholar] [CrossRef]
  41. Cheng, C.Y.; Ge, C.Z.; Du, Y.C.; Li, J.D. Green Gold Index accounting for Quzhou City in Zhejiang Province. Acta Ecol. Sin. 2019, 39, 37–44. (In Chinese) [Google Scholar]
  42. Lin, Y.; Xu, W.; Li, P.; Wang, X.; Ouyang, Z. Assessing the realization of the values of ecosystem products: A case study of Lishi, China. Acta Ecol. Sin. 2023, 43, 189–197. (In Chinese) [Google Scholar]
  43. Wang, X.; Zhang, Q.; Qian, G.; Wang, H. Evaluation on the effectiveness of eco-product value realization. J. Arid Land Resour. Environ. 2023, 37, 9–15. (In Chinese) [Google Scholar]
  44. Yu, D.; Xiong, M. The Evaluation of Regional Abilities on the Realization of Ecological Products’ Value. Ecol. Environ. Sci. 2023, 32, 397–406. (In Chinese) [Google Scholar]
  45. Lei, S.; Meng, X.; Hou, C.; Ye, L.; Deng, H.; Chai, Y.; Han, Y. Ecological products value realization mechanism and effectiveness evaluation in the Yangtze River Basin. J. Environ. Eng. Technol. 2022, 12, 399–407. (In Chinese) [Google Scholar]
  46. Li, J.; Chen, G.; Lei, J.; Miao, X.; Lei, Y. Capability Evaluation and Promotion Path of Value Realization of Ecological Products in the Upper Reaches of the Yangtze River. J. Southwest Univ. Soc. Sci. 2023, 7, 1–8. (In Chinese) [Google Scholar]
  47. Xie, X.; Chen, S.; Zhao, R. A Preliminary Evaluation of the Effectiveness of Ecological Product Value Realization in China Based on the DPSIR Model. Sustainability 2023, 15, 15572. [Google Scholar] [CrossRef]
  48. Chen, Q.; Li, Z.; Xie, H.; Wu, M.; Pan, Y.; Luo, S. How can ecological product value realization contribute to landscape sustainability? Landsc. Ecol. 2024, 39, 15. [Google Scholar] [CrossRef]
  49. Yang, Y.; Xiong, K.; Huang, H.; Xiao, J.; Yang, B.; Zhang, Y. A Commented Review of Eco-Product Value Realization and Ecological Industry and Its Enlightenment for Agroforestry Ecosystem Services in the Karst Ecological Restoration. Forests 2023, 14, 448. [Google Scholar] [CrossRef]
  50. Campos, F.S.; David, J.; Lourenço-de-Moraes, R.; Rodrigues, P.; Silva, B.; da Silva, C.V.; Cabral, P. The economic and ecological benefits of saving ecosystems to protect services. J. Clean. Prod. 2021, 311, 127551. [Google Scholar] [CrossRef]
  51. Peng, T.; Deng, H. Evaluating urban resource and environment carrying capacity by using an innovative indicator system based on eco-civilization—A case study of Guiyang. Environ. Sci. Pollut. Res. 2021, 28, 6941–6955. [Google Scholar] [CrossRef] [PubMed]
  52. China Statistical Yearbook. Available online: https://www.stats.gov.cn/sj/ndsj/ (accessed on 2 March 2024).
  53. China Forestry Statistical Yearbook. Available online: https://www.forestry.gov.cn/c/www/tjnj.jhtml (accessed on 8 March 2024).
  54. Statistical Bulletin on National Economic and Social Development in China. Available online: https://www.stats.gov.cn/sj/tjgb/ndtjgb/qgndtjgb/ (accessed on 5 March 2024).
  55. Bulletin on the State of Land Greening in China. Available online: https://www.forestry.gov.cn/c/www/gtlhbg.jhtml (accessed on 10 March 2024).
  56. Bulletin on Soil and Water Conservation in China. Available online: http://www.mwr.gov.cn/sj/tjgb/zgstbcgb/ (accessed on 12 March 2024).
  57. National Forestry and Grassland Administration. China Forest Resources Report, 1st ed.; China Forestry Publishing House: Beijing, China, 2019; pp. 248–265. [Google Scholar]
  58. National Forestry and Grassland Administration. China Forestry Development Report, 1st ed.; China Forestry Publishing House: Beijing, China, 2023; pp. 135–154. [Google Scholar]
  59. National Forestry and Grassland Administration; China Banking Insurance Regulatory Commission. The Development Report on Forest Insurance in China, 1st ed.; China Forestry Publishing House: Beijing, China, 2023; pp. 110–126. [Google Scholar]
  60. Science and Technology Development Center of the National Forestry and Grassland Administration; Intellectual Property Research Center of the National Forestry and Grassland Administration. China Forestry and Grassland Intellectual Property Report, 1st ed.; China Forestry Publishing House: Beijing, China, 2023; pp. 79–108. [Google Scholar]
  61. Zhu, Y.; Tian, D.; Yan, F. Effectiveness of entropy weight method in decision-making. Math. Probl. Eng. 2020, 2020, 3564835. [Google Scholar] [CrossRef]
  62. Çelikbilek, Y.; Tüysüz, F. An in-depth review of theory of the TOPSIS method: An experimental analysis. J. Manag. Anal. 2020, 7, 281–300. [Google Scholar] [CrossRef]
  63. De Pascale, A.; Arbolino, R.; Szopik-Depczyńska, K.; Limosani, M.; Ioppolo, G. A systematic review for measuring circular economy: The 61 indicators. J. Clean. Prod. 2021, 281, 124942. [Google Scholar] [CrossRef]
  64. Cheng, M.; Li, Q.; Wen, Z. Coupling coordination degree analysis and driving factors of innovation network and eco-efficiency in China. Environ. Impact Assess. Rev. 2023, 99, 107008. [Google Scholar] [CrossRef]
  65. Li, J.; Sun, W.; Li, M.; Meng, L. Coupling coordination degree of production, living and ecological spaces and its influencing factors in the Yellow River Basin. J. Clean. Prod. 2021, 298, 126803. [Google Scholar] [CrossRef]
  66. Gan, L.; Shi, H.; Hu, Y.; Lev, B.; Lan, H. Coupling coordination degree for urbanization city-industry integration level: Sichuan case. Sustain. Cities Soc. 2020, 58, 102136. [Google Scholar] [CrossRef]
  67. Hegre, H.; Petrova, K.; Von Uexkull, N. Synergies and trade-offs in reaching the sustainable development goals. Sustainability 2020, 12, 8729. [Google Scholar] [CrossRef]
  68. Liu, J.; Jin, X.; Xu, W.; Yang, F.; Wang, S.; Zhou, Y. Assessing trade-offs and synergies among multiple land use functional efficiencies: Integrating ideal reference and key indicators for sustainable landscape management. Appl. Geogr. 2023, 158, 103037. [Google Scholar] [CrossRef]
  69. van den Heuvel, E.; Zhan, Z. Myths about linear and monotonic associations: Pearson’s r, Spearman’s ρ, and Kendall’s τ. Am. Stat. 2022, 76, 44–52. [Google Scholar] [CrossRef]
  70. Zhu, J.; Zhai, Y.; Feng, S.; Tan, Y.; Wei, W. Trade-offs and synergies among air-pollution-related SDGs as well as interactions between air-pollution-related SDGs and other SDGs. J. Clean. Prod. 2022, 331, 129890. [Google Scholar] [CrossRef]
  71. Xie, Z. China’s historical evolution of environmental protection along with the forty years’ reform and opening-up. Environ. Sci. Ecotechnol. 2020, 1, 100001. [Google Scholar] [CrossRef]
  72. Wu, F.; Liu, G.; Guo, N.; Li, Z.; Deng, X. The impact of COVID-19 on China’s regional economies and industries. J. Geogr. Sci. 2021, 31, 565–583. [Google Scholar] [CrossRef]
  73. Tan, L.; Wu, X.; Guo, J.; Santibanez-Gonzalez, E.D. Assessing the Impacts of COVID-19 on the Industrial Sectors and Economy of China. Risk Anal. 2022, 42, 21–39. [Google Scholar] [CrossRef]
  74. Wunder, S.; Kaimowitz, D.; Jensen, S.; Feder, S. Coronavirus, macroeconomy, and forests: What likely impacts? For. Policy Econ. 2021, 131, 102536. [Google Scholar] [CrossRef] [PubMed]
  75. Lu, S.; Sun, H.; Zhou, Y.; Qin, F.; Guan, X. Examining the impact of forestry policy on poor and non-poor farmers’ income and production input in collective forest areas in China. J. Clean. Prod. 2020, 276, 123784. [Google Scholar] [CrossRef]
  76. Song, M.; Du, J. Mechanisms for realizing the ecological products value: Green finance intervention and support. Int. J. Prod. Econ. 2024, 271, 109210. [Google Scholar] [CrossRef]
  77. Guiding Opinions on Building a Green Financial System. Available online: https://www.mee.gov.cn/gkml/hbb/gwy/201611/t20161124_368163.htm (accessed on 10 March 2024).
  78. Feng, X.; Dai, Y. An innovative type of forest insurance in China based on the robust approach. For. Policy Econ. 2019, 104, 23–32. [Google Scholar] [CrossRef]
  79. Tiebel, M.; Mölder, A.; Plieninger, T. Conservation perspectives of small-scale private forest owners in Europe: A systematic review. Ambio 2022, 51, 836–848. [Google Scholar] [CrossRef]
  80. Chen, S.; Lan, Z.; Su, S. Analysis on the sustainable realization path of natural resource asset value. Nat. Resour. Conserv. Res. 2022, 5, 73–85. [Google Scholar] [CrossRef]
  81. Xu, T.; Zhang, X.; Agrawal, A.; Liu, J. Decentralizing while centralizing: An explanation of China’s collective forestry reform since the 1980s. For. Policy Econ. 2020, 119, 102268. [Google Scholar] [CrossRef]
  82. Hojnik, J.; Ruzzier, M.; Konečnik Ruzzier, M. Transition towards Sustainability: Adoption of Eco-Products among Consumers. Sustainability 2019, 11, 4308. [Google Scholar] [CrossRef]
  83. Delmas, M.A.; Gergaud, O. Sustainable practices and product quality: Is there value in eco-label certification? The case of wine. Ecol. Econ. 2021, 183, 106953. [Google Scholar] [CrossRef]
  84. Notice on the Implementation of Forest Eco-Label Product Construction Project. Available online: https://www.gov.cn/xinwen/2017-10/10/content_5230794.htm (accessed on 10 March 2024).
  85. Chen, J.; Wang, L.; Li, L.; Magalhães, J.; Song, W.; Lu, W.; Xiong, L.; Chang, W.Y.; Sun, Y. Effect of Forest Certification on International Trade in Forest Products. Forests 2020, 11, 1270. [Google Scholar] [CrossRef]
  86. Xiong, K.; He, C.; Zhang, M.; Pu, J. A New Advance on the Improvement of Forest Ecosystem Functions in the Karst Desertification Control. Forests 2023, 14, 2115. [Google Scholar] [CrossRef]
  87. Rautio, P.; Lideskog, H.; Bergsten, U.; Karlberg, M. Perspectives: Lean forestry–A paradigm shift from economies of scale to precise and sustainable use of ecosystem services in forests. For. Ecol. Manage. 2023, 530, 120766. [Google Scholar] [CrossRef]
  88. Abeli, T.; Di Giulio, A. Risks of massive tree planting in Europe should be considered by the EU Forestry Strategy 2030. Restor. Ecol. 2023, 31, e13834. [Google Scholar] [CrossRef]
  89. Cai, Y.; Zhang, F.; Duan, P.; Jim, C.Y.; Chan, N.W.; Shi, J.; Liu, C.; Wang, J.; Bahtebay, J.; Ma, X. Vegetation cover changes in China induced by ecological restoration-protection projects and land-use changes from 2000 to 2020. Catena 2022, 217, 106530. [Google Scholar] [CrossRef]
  90. Huang, Y.; Lou, G.; Yao, J. Research on the Profit Contribution of Forest Ecological Benefits Based on Policy and Market-Tools Compensation Projects in Nanping. Sustainability 2023, 15, 5465. [Google Scholar] [CrossRef]
  91. Grammatikopoulou, I.; Vačkářová, D. The value of forest ecosystem services: A meta-analysis at the European scale and application to national ecosystem accounting. Ecosyst. Serv. 2021, 48, 101262. [Google Scholar] [CrossRef]
  92. Jia, Y.; Liu, Y.; Zhang, S. Evaluation of agricultural ecosystem service value in arid and semiarid regions of northwest China based on the equivalent factor method. Environ. Process. 2021, 8, 713–727. [Google Scholar] [CrossRef]
  93. Li, F.; Wang, F.; Liu, H.; Huang, K.; Yu, Y.; Huang, B. A comparative analysis of ecosystem service valuation methods: Taking Beijing, China as a case. Ecol. Indic. 2023, 154, 110872. [Google Scholar] [CrossRef]
  94. Yang, Q.; Liu, G.; Giannetti, B.F.; Agostinho, F.; Almeida, C.M.; Casazza, M. Emergy-based ecosystem services valuation and classification management applied to China’s grasslands. Ecosyst. Serv. 2020, 42, 101073. [Google Scholar] [CrossRef]
  95. The Economics of Ecosystems and Biodiversity. Available online: https://teebweb.org/ (accessed on 20 May 2024).
  96. Wealth Accounting and Valuation of Ecosystem Services. Available online: https://www.wavespartnership.org/ (accessed on 22 May 2024).
  97. SEEA Central Framework. Available online: https://seea.un.org/content/seea-central-framework (accessed on 25 May 2024).
  98. Ecosystem Accounting. Available online: https://seea.un.org/ecosystem-accounting/ (accessed on 25 May 2024).
  99. GB/T 38582—2020; Specifications for Assessment of Forest Ecosystem Services. General Administration of Quality Supervision, Inspection and Quarantine; State Administration for Standardization; China Standard Press: Beijing, China, 2020.
  100. National Development and Reform Commission; National Bureau of Statistics. Specification on Accounting for Gross Ecological Product Value, 1st ed.; People’s Press: Beijing, China, 2022; pp. 13–34. [Google Scholar]
  101. Xu, Y.; Xiao, F. Assessing Changes in the Value of Forest Ecosystem Services in Response to Climate Change in China. Sustainability 2022, 14, 4773. [Google Scholar] [CrossRef]
  102. Wang, B.; Niu, X. A Study on the Spatial and Temporal Evolution of Forest Ecological Products in China over the Past Forty Years, 1st ed.; Chinese Forestry Publishing House: Beijing, China, 2023; pp. 95–96. [Google Scholar]
  103. Liu, J.; Mou, D. Research Progress of Ecological Product Value and Its Realization Mechanism. Ecol. Econ. 2020, 36, 207–212. [Google Scholar]
  104. Gonçalves-Souza, D.; Vilela, B.; Phalan, B.; Dobrovolski, R. The role of protected areas in maintaining natural vegetation in Brazil. Sci. Adv. 2021, 7, eabh2932. [Google Scholar] [CrossRef] [PubMed]
  105. Liagre, L.; Pettenella, D.; Pra, A.; Ortiz, F.C.; Arguedas, A.G.; Chien, C.N. How can national forest funds catalyse the provision of ecosystem services? Lessons learned from Costa Rica, Vietnam, and Morocco. Ecosyst. Serv. 2021, 47, 101228. [Google Scholar] [CrossRef]
  106. Liu, S.; Dong, Y.; Liu, H.; Wang, F.; Yu, L. Review of Valuation of Forest Ecosystem Services and Realization Approaches in China. Land 2023, 12, 1102. [Google Scholar] [CrossRef]
  107. Takahashi, T.; Asano, S.; Uchida, Y.; Takemura, K.; Fukushima, S.; Matsushita, K.; Okuda, N. Effects of forests and forest-related activities on the subjective well-being of residents in a Japanese watershed: An econometric analysis through the capability approach. For. Policy Econ. 2022, 139, 102723. [Google Scholar] [CrossRef]
  108. Zhang, W.; Xu, D. Benefits evaluation of ecological restoration projects based on value realization of ecological products. J. Environ. Manag. 2024, 352, 120139. [Google Scholar] [CrossRef] [PubMed]
  109. Pirgmaier, E. The value of value theory for ecological economics. Ecol. Econ. 2021, 179, 106790. [Google Scholar] [CrossRef] [PubMed]
  110. Ma, L.; Hong, Y.; Chen, X. Can Green Economy and Ecological Welfare Achieve Synergistic Development? The Perspective of the “Two Mountains” Theory. Int. J. Environ. Res. Public Health 2022, 19, 6460. [Google Scholar] [CrossRef] [PubMed]
  111. Nagel, B.; Partelow, S. A methodological guide for applying the social-ecological system (SES) framework: A review of quantitative approaches. Ecol. Soc. 2022, 27, 39. [Google Scholar] [CrossRef]
  112. Xu, Z.; Chau, S.N.; Chen, X.; Zhang, J.; Li, Y.; Dietz, T.; Wang, J.; Winkler, J.A.; Fan, F.; Huang, B.; et al. Assessing progress towards sustainable development over space and time. Nature 2020, 577, 74–78. [Google Scholar] [CrossRef]
  113. Xu, Z. A Study of Forest Chief Scheme Implementation in China. World For. Res. 2020, 35, 117–122. (In Chinese) [Google Scholar]
  114. Zhou, R.; Wang, J.; Huang, Z. Evolutionary Game Analysis of the Participants in the Realization of Ecological Product Value. SHS Web Conf. 2023, 158, 01022. [Google Scholar] [CrossRef]
  115. Liu, S.; Dong, Y.; McConkey, K.R.; Tran, L.S.P.; Wang, F.; Liu, H.; Wu, G. Scientific concept and practices of life community of mountains, rivers, forests, farmlands, lakes, grasslands, and deserts in China. Ambio 2023, 52, 1939–1951. [Google Scholar] [CrossRef] [PubMed]
  116. Kim, D.H.; Kim, D.H.; Kim, H.S.; Kim, S.I.; Lee, D.H. Determinants of bilateral REDD+ cooperation recipients in Kyoto Protocol regime and their implications in Paris Agreement regime. Forests 2020, 11, 751. [Google Scholar] [CrossRef]
  117. Qi, X.; Han, Y. Research on the evolutionary strategy of carbon market under “dual carbon” goal: From the perspective of dynamic quota allocation. Energy 2023, 274, 127265. [Google Scholar] [CrossRef]
Figure 1. The logic of the indicator system for the evaluation of FEPVR effectiveness.
Forests 15 01236 g001
Figure 2. Comprehensive effectiveness score of FEPVR in China and effectiveness scores of different subsystems from 2011 to 2022.
Forests 15 01236 g002
Figure 3. Relative contributions of FEPVR subsystems from 2011 to 2022.
Forests 15 01236 g003
Figure 4. Coupling coordination degree between subsystems from 2011 to 2022.
Forests 15 01236 g004
Figure 5. Correlation between different evaluation indicators.
Forests 15 01236 g005
Table 1. The FEPVR effectiveness evaluation index system based on the DPSIR model.
Standard LayerFactor LayerIndicator LayerUnitAttribute
Driver (D)Economic development (D1)Per capita GDP (X1)104 yuanPositive
Engel coefficient (X2)%Negative
Population growth (D2)Population density (X3)Persons/km2Moderate
Natural population growth rate (X4)Moderate
Social structure (D3)Urbanization rate (X5)%Moderate
Gini coefficient (X6)Negative
Pressure (P)Resource depletion (P1)Market consumption of wood products (X7)104 m3Negative
Ecological damage (P2)Ratio of soil erosion area to total land area (X8)%Negative
Ratio of desertified and sandified areas to total land area (X9)%Negative
State (S)Resource reserves (S1)Forest coverage (X10)%Positive
Forest stock (X11)%Positive
Ratio of forestry land area to total land area (X12)%Positive
Ecological security (S2)Ratio of the forest nature reserve area to total land area (X13)%Positive
Number of major forest fires (X14)Negative
Impact (I)Ecological industrialization (I1)Ratio of forest ecological primary product output value to primary industry output value of forestry (X15) %Positive
Ratio of forest ecological processed product output value to secondary industry output value of forestry (X16) %Positive
Ratio of forest ecological servicing product output value to the tertiary output value of forestry (X17)%Positive
Social life (I2)Area of forest parks per capita (X18) m2Positive
Average annual wage of employed forestry staff (X19)YuanPositive
Number of additional forest cities (X20)Positive
Number of additional eco-cultural villages (X21)Positive
Response (R)Ecological supply (R1)Total area of afforestation (X22)HectarePositive
Total area of forest tending (X23)HectarePositive
Prevention rate of forest harmful organisms (X24)%Positive
Area of integrated soil erosion control (X25)104 km2Positive
Area of rehabilitated sandified land (X26)HectarePositive
Fiscal support (R2)Proportion of national financial investment to forestry investment completion (X27)%Positive
Proportion of investment in forest ecological restoration and management to forestry investment completion (X28)%Positive
Green finance (R3)Proportion of forest area covered by forest right mortgage loan to total forest area (X29)%Positive
Proportion of forest area covered by forest insurance to total forest area (X30)%Positive
Market cultivation (R4)Number of geographical indications for forest products (X31)Positive
Research and education (R5)Proportion of invention patents in forestry to total forestry patents (X32)%Positive
Number of higher education graduates in forestry during the year (X33)Positive
Infrastructure development (R6)Number of new forestry workstations built during the year (X34)Positive
Sum of forestry workstations with new office rooms, transportation, and computers during the year (X35)Positive
Environmental regulation (R7)Forestry administrative case processing rate (X36)Positive
Review and approval of the area of forest land used for construction projects (X37)HectarePositive
Notes: (1) Forest ecological primary products include economic forest products and ornamental plants. (2) Forest ecological processed products refer to non-timber forest processed products. (3) The output value of forest ecological servicing products includes the output value of forestry-related tourism and leisure services and forestry-related ecological services.
Table 2. Data sources required for empirical analysis.
NumberData TypesDetailsSources
1Statistical yearbooksChina Statistical Yearbook, China Forestry Statistical Yearbook[52,53]
2Statistical bulletinsChina Statistical Bulletin on National Economic and Social Development, China Bulletin on the State of Land Greening, and China Bulletin on Soil and Water Conservation[54,55,56]
3Development reportsChina Forest Resources Report, China Forestry and Grassland Development Report, The Development Report on Forest Insurance in China, and China Forestry and Grassland Intellectual Property Report[57,58,59,60]
Table 3. Weights of indicators at different layers of the evaluation index system.
Standard LayerFactor LayerIndicator LayerWeight
D (0.1735)D1 (0.0412)X10.0256
X20.0156
D2 (0.0839)X30.0507
X40.0332
D3 (0.0484)X50.0339
X60.0145
P (0.1625)P1 (0.0345)X70.0345
P2 (0.1280)X80.0810
X90.0470
S (0.1490)S1 (0.0808)X100.0223
X110.0245
X120.0340
S2 (0.0682)X130.0485
X140.0197
I (0.1400)I1 (0.0499)X150.0254
X160.0122
X170.0123
I2 (0.0901)X180.0278
X190.0256
X200.0218
X210.0149
R (0.3750)R1 (0.0920)X220.0162
X230.0136
X240.0280
X250.0141
X260.0201
R2 (0.0554)X270.0398
X280.0156
R3 (0.0307)X290.0205
X300.0102
R4 (0.0173)X310.0173
R5 (0.0567)X320.0211
X330.0356
R6 (0.0646)X340.0280
X350.0366
R7 (0.0583)X360.0280
X370.0303
Note: The values in parentheses are the weights of the standard and factor layers.
Disclaimer/Publisher’s Note: The statements, opinions and data contained in all publications are solely those of the individual author(s) and contributor(s) and not of MDPI and/or the editor(s). MDPI and/or the editor(s) disclaim responsibility for any injury to people or property resulting from any ideas, methods, instructions or products referred to in the content.

