Article

Mapping Characteristics in Vaccinium uliginosum Populations Predicted Using Filtered Machine Learning Modeling

1
State Key Laboratory of Black Soils Conservation and Utilization, Northeast Institute of Geography and Agroecology, Chinese Academy of Sciences, Harbin 150081, China
2
Institute of Rural Revitalization Science and Technology, Heilongjiang Academy of Agricultural Sciences, Harbin 150028, China
3
Huma Cold Temperature Plant Germplasm Resources Protection Field Scientific Observation and Research Station of Heilongjiang Province, Northeast Institute of Geography and Agroecology, Chinese Academy of Sciences, Huma 165100, China
4
Liaoning Institute of Pomology, Yingkou 115009, China
5
College of Horticultural and Plant Protection, Inner Mongolia Key Laboratory of Wild Peculiar Vegetable Germplasm Resource and Germplasm Enhancement, Inner Mongolia Agricultural University, Hohhot 010011, China
*
Authors to whom correspondence should be addressed.
These authors contributed equally to this work.
Forests 2024, 15(7), 1252; https://doi.org/10.3390/f15071252
Submission received: 11 June 2024 / Revised: 4 July 2024 / Accepted: 8 July 2024 / Published: 18 July 2024
(This article belongs to the Section Wood Science and Forest Products)

Abstract

:
Bog bilberry (Vaccinium uliginosum L.) is considered a highly valued non-wood forest product (NWFP) species with edible and medicinal uses in East Asia. It grows in the northeastern forests of China, where stand attributes and structure jointly determine its population characteristics and individuals’ growth. Mapping the regional distributions of its population characteristics can be beneficial in the management of its natural resources, and this mapping should be predicted using machine learning modeling to obtain accurate results. In this study, a total of 60 stands were randomly chosen and screened to investigate natural bog bilberry populations in the eastern mountains of Heilongjiang and Jilin provinces in northeastern China. Individual height, canopy cover area, and fresh weight all increased in stands at higher latitudes, and shoot height was also higher in the eastern stands. The rootstock grove density showed a polynomial quadratic distribution pattern along increasing topographical gradients, resulting in a minimum density of 0.43–0.52 groves m−2 in stands in the southern part (44.3016° N, 129.4558° E) of Heilongjiang. Multivariate linear regression indicated that the bog bilberry density was depressed by host forest tree species diversity; this was assessed using both the Simpson and Shannon–Wiener indices, which also showed polynomial quadratic distribution patterns (with a modeling minimum of 0.27 and a maximum of 1.21, respectively) in response to the increase in latitude. Structural equation models identified positive contributions of tree diameter at breast height and latitude to shoot height and a negative contribution of longitude to the bog bilberry canopy area. Random forest modeling indicated that dense populations with heavy individuals were distributed in eastern Heilongjiang, and large-canopy individuals were distributed in Mudanjiang and Tonghua. In conclusion, bog bilberry populations showed better attributes in northeastern stands where host forest trees had low species diversity, but the dominant species had strong trunks.

1. Introduction

Non-wood forest products (NWFPs) are natural products “derived from forests, trees, and wild species that are gaining traction across agriculture–economic activities” [1]. NWFPs are an instrument for achieving the second Sustainable Development Goal by contributing to the end of hunger, achievement of food security, and improvement of nutrition [2]. For NWFPs, host forests provide not only their habitat but also a natural greenhouse with human interactions [3]. Forest stand structure shapes the production and quality of NWFPs, which are easily determined by anthropogenic activities in land use management [4]. Furthermore, it has been confirmed that the determinants of NWFPs are mainly accounted for by forest structure factors [5] and beneath-canopy environmental conditions [6]. Hence, geographical variations in these two facets likely tend to shape the spatial distribution of the population characteristics of NWFPs [5,7]. To achieve a sustainable strategy for NWFP development, it is sensible to plan forest management by synthesizing regional information from stands at different locations [8,9]. In comparison with tree inventories, lists of natural reserves for NWFPs are less documented [10]. New forest stand investigations are far less than sufficient for specific species listed as NWFPs across the geographical ranges covering their natural habitats.
Bog bilberry (Vaccinium uliginosum L.) is a type of highly valued shrub distributed in most habitats of northern forested lands and associated territories containing peatland, moorland, and tundra [11,12]. It has long been artificially cultivated as a valued local NWFP species due to the abundant economic income that it provides for households in northern countries through berry production (Figure 1) [11]. For example, in 2019, berry production in an area of 3.5 million hectares in northeastern forests accounted for over 15% of that on a nationwide level [13]. Bog bilberry’s natural habitats in forested peatlands coincide with that of Ledum palustre, which modifies the soil microbial community and impacts nutrient availability [14]. The suitable distribution of this species was proven to be small in its original habitats [15], which caused it to be brought out of its natural habitat and onto farmlands [3]. Due to artificial exploration, its population has been introduced to surrounding farmlands, but these populations showed destitute nutrient utilization after their introduction [3]. According to successful cases of the commercial development of bog bilberry in the Philippines, more investment in cultivational practices on forested lands is being encouraged [16]. This is well suited to the conditions of the understory layer in the northeastern forests of China, where a ban on commercial logging has been enacted [17,18]. Berry production in these forests contributes to maintaining the desired income of local households [19]. Remote sensing techniques have been well incorporated into the management of bog bilberry resources [11,15], but spatial resolution and temporal frequency are technical obstacles that are unlikely to be overcome in the near future. Sustainable production requires scientific evidence on dependent effects from field investigations in host forests and data on stand structures.
A host forest harbors a stand for the habitat of plants that produce NWFPs; production can go along with stand development, and both can be predicted using objective plant population characteristics [20,21]. The stand structure matters for forest stability due to biodiversity conservation, natural productivity, and protection against abiotic stressors [22,23,24]. The growth of individuals of a dominant tree species in a stand can protect NWFP species in the understory from competition by invasive species, thus aiding in regeneration [25]. Host forests, however, can also coordinate self-growth to control the possible overconsumption of supporting resources by understory saplings [5]. The diversity of tree species among dominant stems is a key factor with a positive effect on forest productivity [22,23]. Tree species richness was also found to benefit understory berry production with a hump-shaped curve [26]. However, the fruiting of bog bilberry suffers severe interruptions due to anthropogenic activities, which largely alter fruit setting [11]. In natural habitats distributed in southern Heilongjiang and in the western Changbai Mountains, the fruit harvest for bog bilberry occurs only in a very short time during the growing season [3]. It is almost impossible to distinguish one stand from another when screening for human interruptions. Vegetative growth is a more reliable parameter for evaluating a host forest’s effects because the vegetative stage rarely suffers from uncontrolled anthropogenic interruptions, and micro-habitat competition can be monitored and controlled well using current approaches [14]. Therefore, the stand structure, including host forest species diversity, can be critical information using which bog bilberry population characteristics are predicted.
Mapping the spatial distributions of objective population parameters is an efficient approach for managing natural NWFP resources at the regional scale. The model should first be prepared using resource characteristic variables and independent parameters of the host forest structure. General linear models (GLMs) were initially used with a regression to describe this relationship [3,6]. Multivariate linear regression (MLR) was frequently used to predict driving forces from multiple stand factors to assess objective plant performance [5,27]. It has merits in testing the driving contributions from all inputted variables to the dependent variables by making comparisons among parameter estimates using independent factors. For example, MLR was successfully used to predict multiple driving forces across meteorological and edaphic factors and their effects on foliar nutrient economics in introduced bog bilberry populations [3]. However, MLR is limited by its high collinearity, as it cannot accept reserves of independent variables to pass critical significant values. Therefore, univariate regression (UR) may also result in more desired modeling yields than the results provided by MLR [28]. An investigation in northeastern forests in China indicated that UR can efficiently indicate forest–shrub relationships when using a spectrum of dependent variables with high collinearity [6]. However, GLM-series algorithms have a fatal limit in that all independent variables have to follow normal distribution patterns. This shortcoming can be easily overcome by machine learning algorithms because computers are trained using a prepared set of data, and such algorithms are rarely impacted by the data distribution [11,29]. Another study took Chrysophyllum albidum as an NWFP species and found that machine learning algorithms resulted in better regression performance than that of GLM for distribution prediction [30]. These are sufficient to suggest that modeling using machine learning has the full potential to be used to predict bog bilberry population characteristics according to host forest stand parameters.
To fill the knowledge gap, a field investigation was conducted in forests in northeastern China, and a total of 60 stands with dominant occurrences of bog bilberry were targeted. Bog bilberry population characteristics, host forest structures, tree diversity, and stand topography were measured in the field so as to detect their relationships and the driving factors contributing to bog bilberry population characteristics. The objective of this study was to model the berry–forest relationship using machine learning algorithms by conducting model filtering, validation, and a comparison with MLR. Subsequently, the distributions of bog bilberry populations in forests in northeastern China were mapped using predicted values with driving forces revealed by the forest stand structure and topography. Thereafter, based on the modeling results, it is expected that specific locations with suitable conditions for raising bog bilberry to an optimal state can be predicted due to the driving effects of forest structure.

2. Materials and Methods
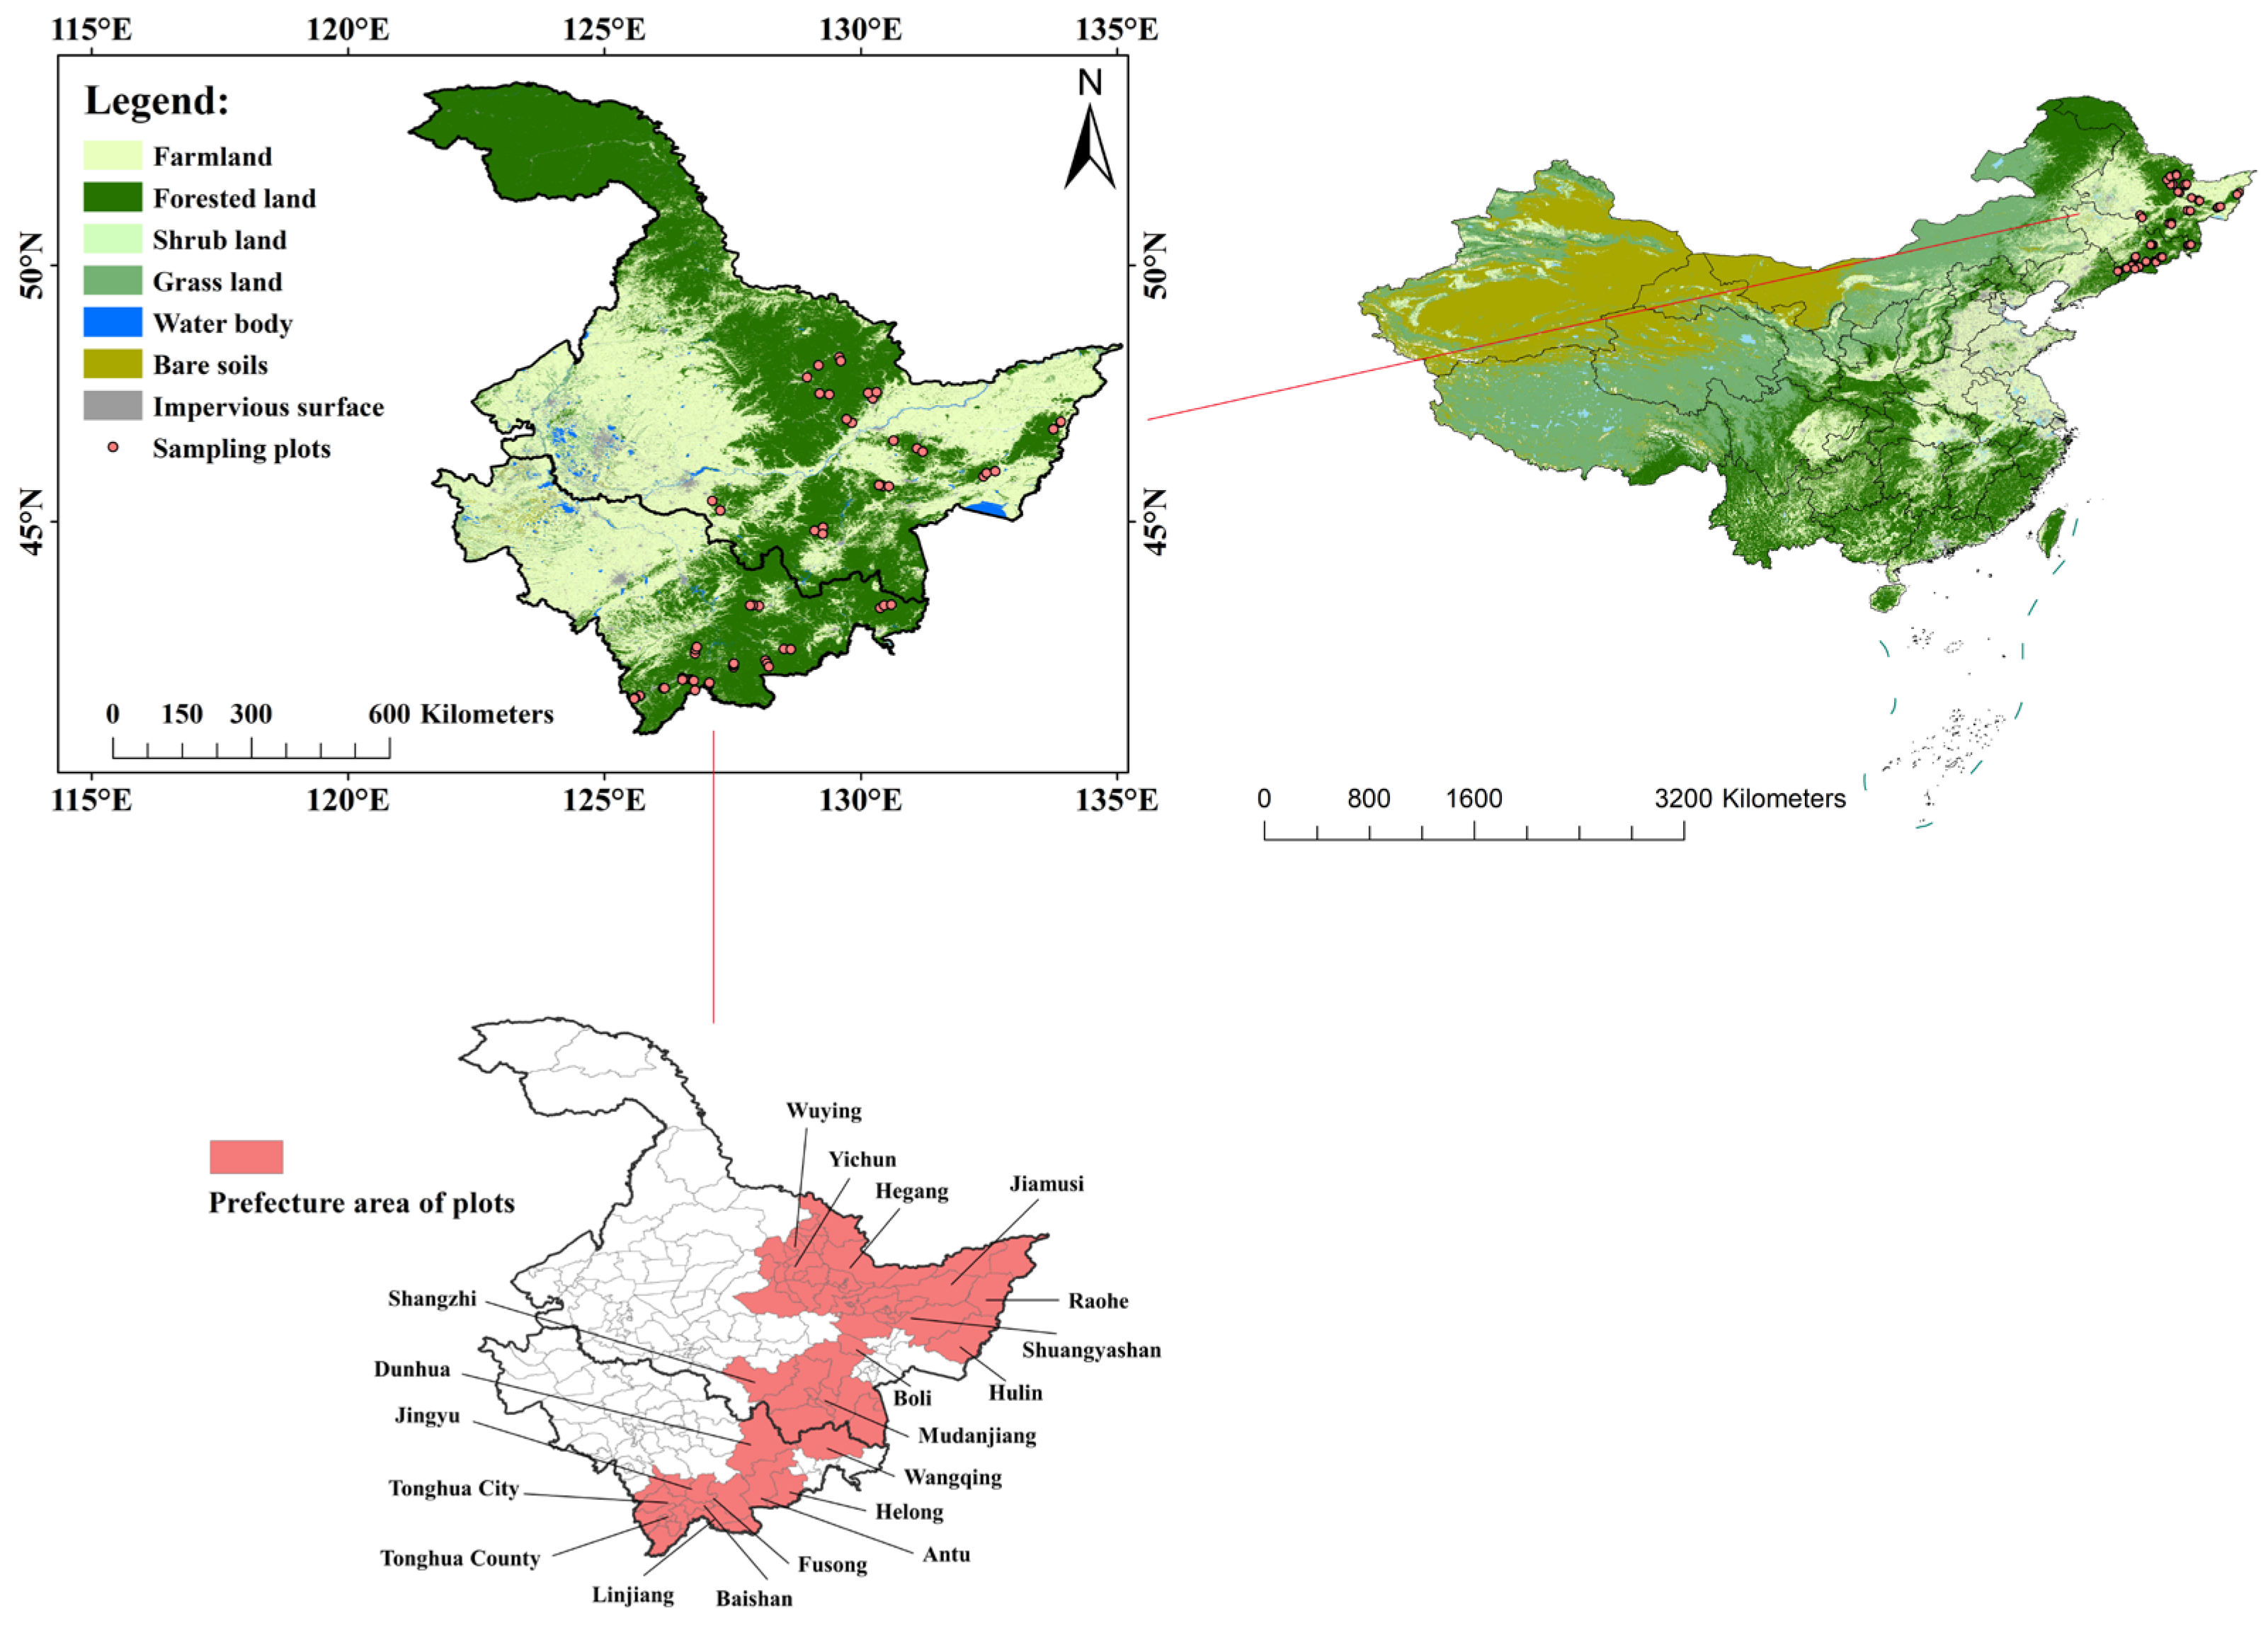
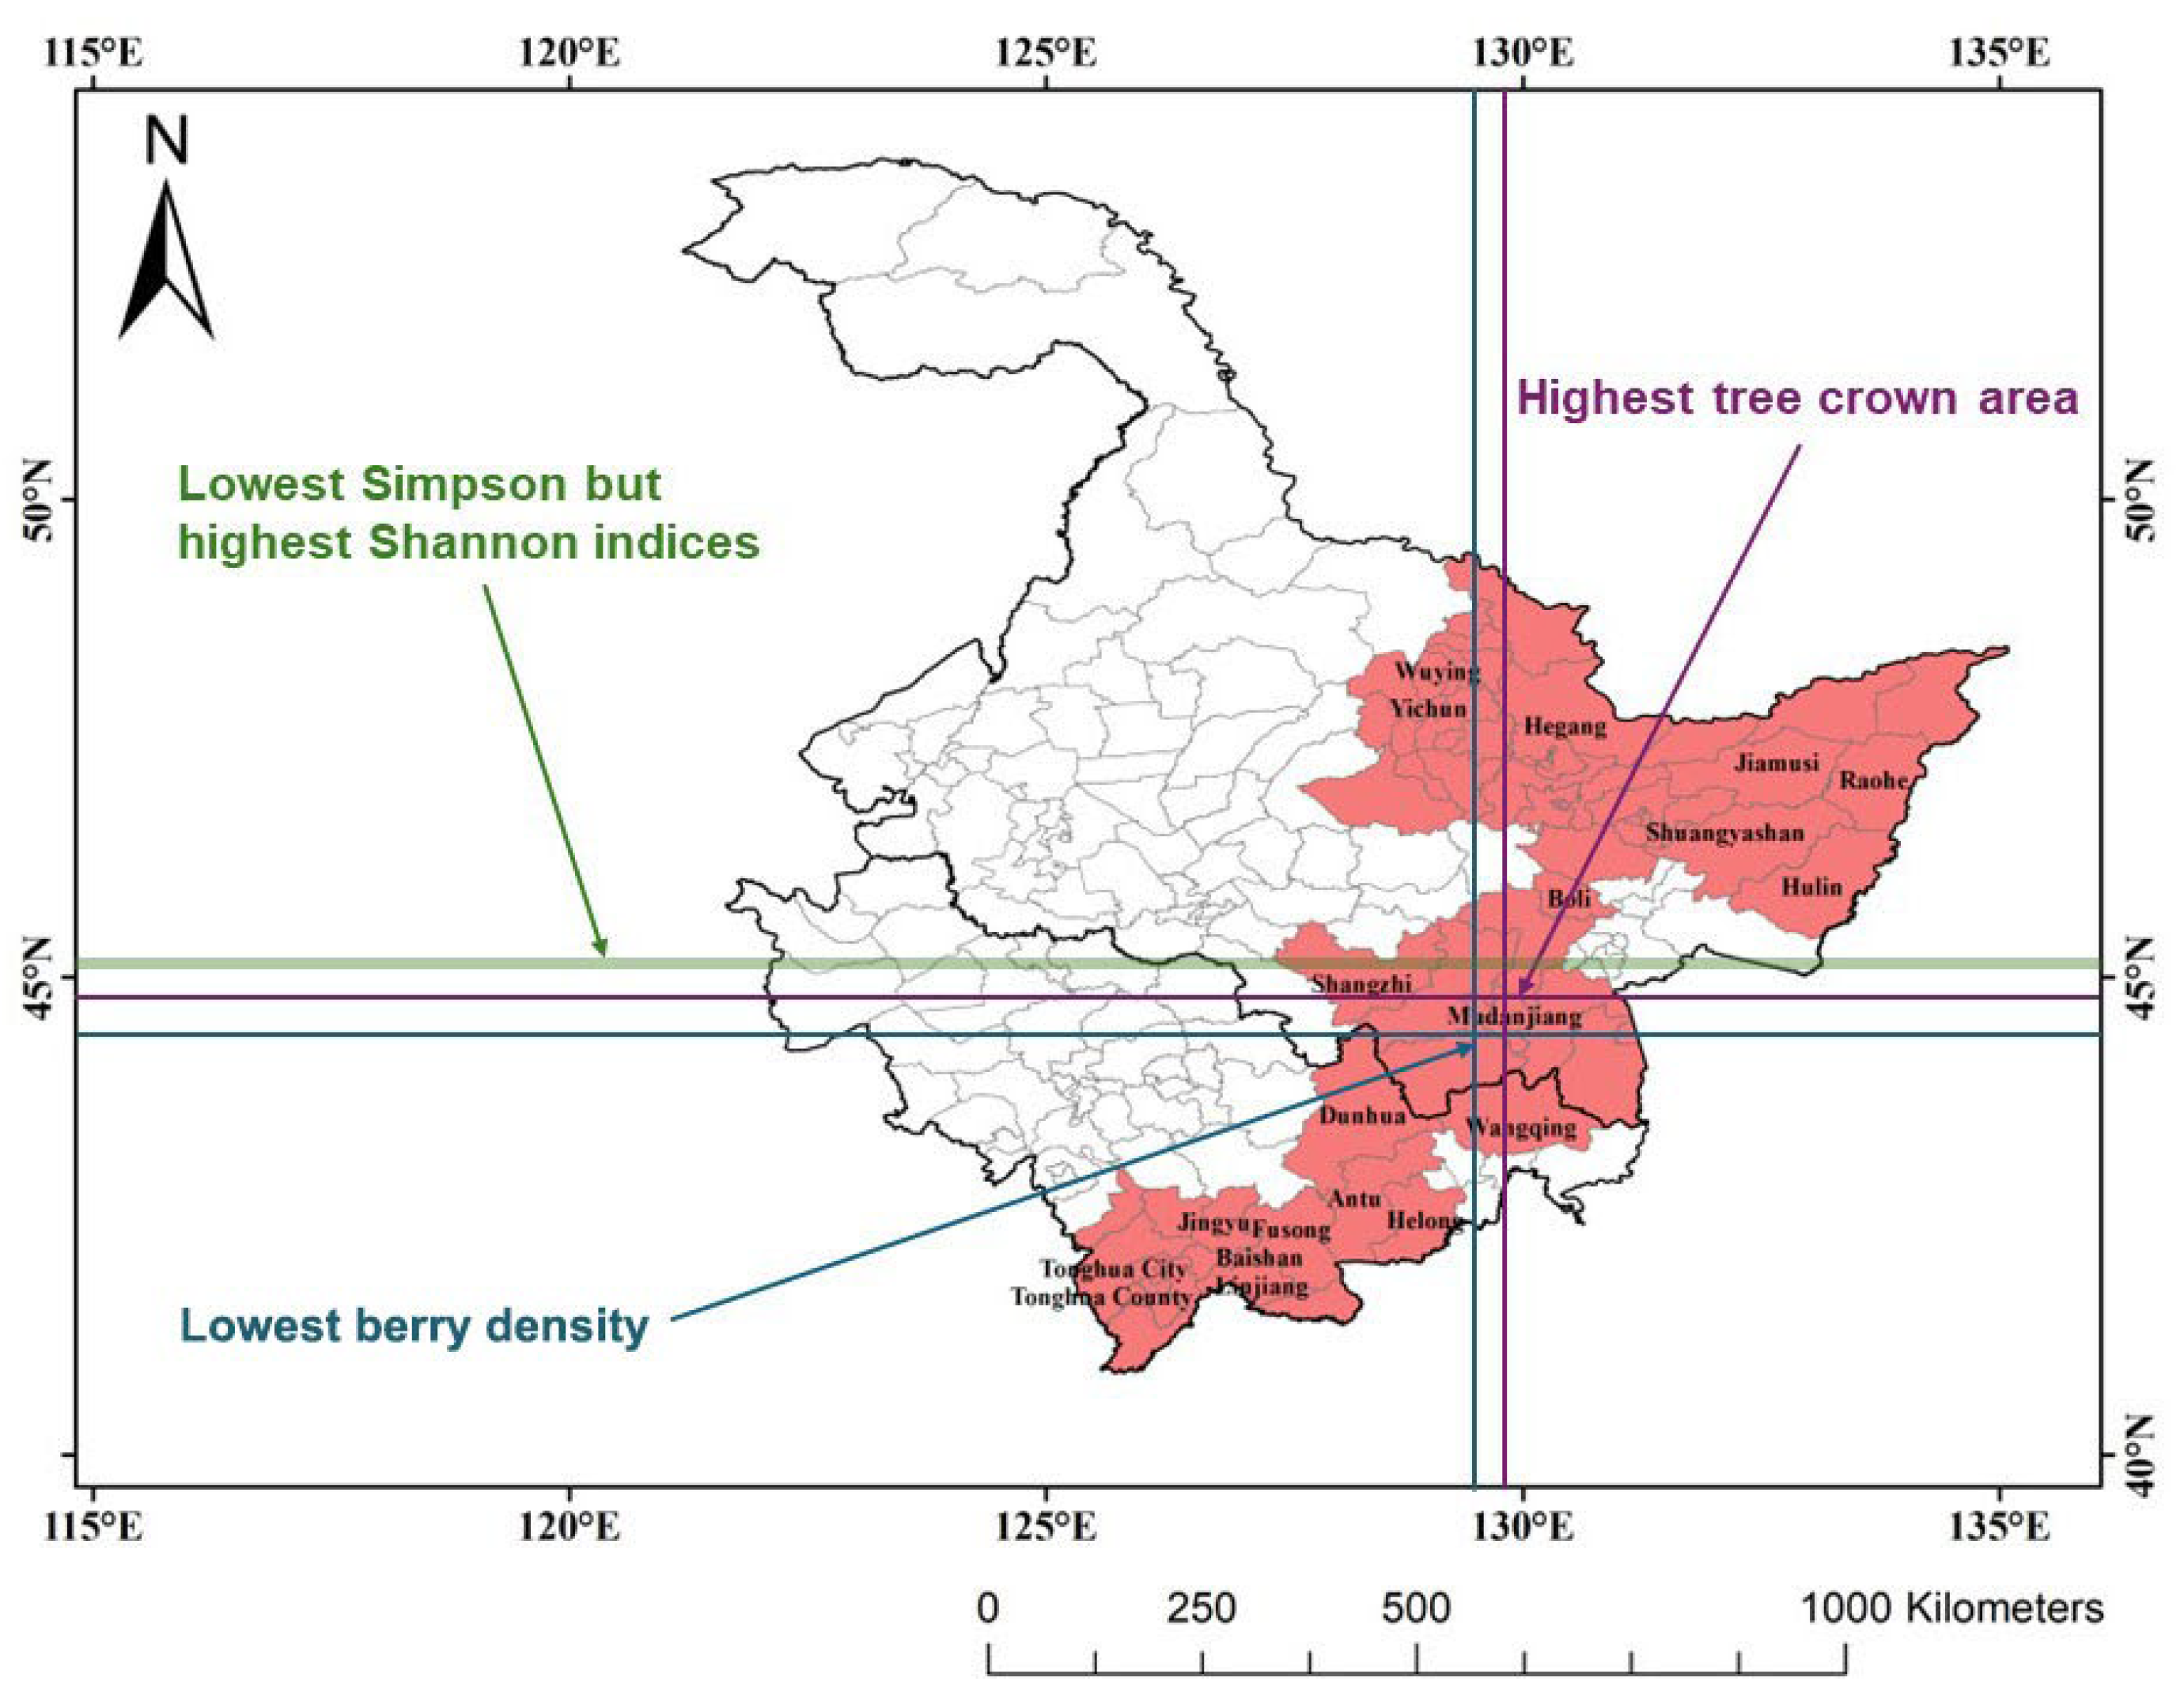
2.1. Study Area

The study area was in the eastern forests of Heilongjiang and Jilin provinces in northeastern China. Prefectures from Tonghua County (41°19′ N, 125°17′ E) in the south to Wuying County (49°16′ N, 129°54′ E) in the north were involved (Figure 2). This area is characterized by a temperate monsoon climate with an annual ilin provinces in northtween −4.7 °C and 10.7 °C. The annual average rainfall is 866 mm, and the relative air humidity is 65%. The local mountains are mainly dominated by four types of forests, namely, larch plantations (Larix gemelini Rupr. and L. olgensis A. Henry), evergreen forests (Pinus tabulaeformis Carr., Picea jezoensis (Siebold and Zucc.) Carr., Abies nephrolepis (Trautv. ex Maxim.) Maxim., and Picea koraiensis Nakai), Korean pine forests (Pinus koraiensis Siebold and Zucc.), and mixed deciduous broadleaf forests dominated by Quercus mongolica Fisch. ex Ledeb., Quercus wutaishansea Mary, Fraxinus mandshurica Rupr., Juglans mandshurica Maxim., Acer mandshuricum Maxim., Betula platyphylla Sukaczev, and Populus davidiana Dode [6,31,32].

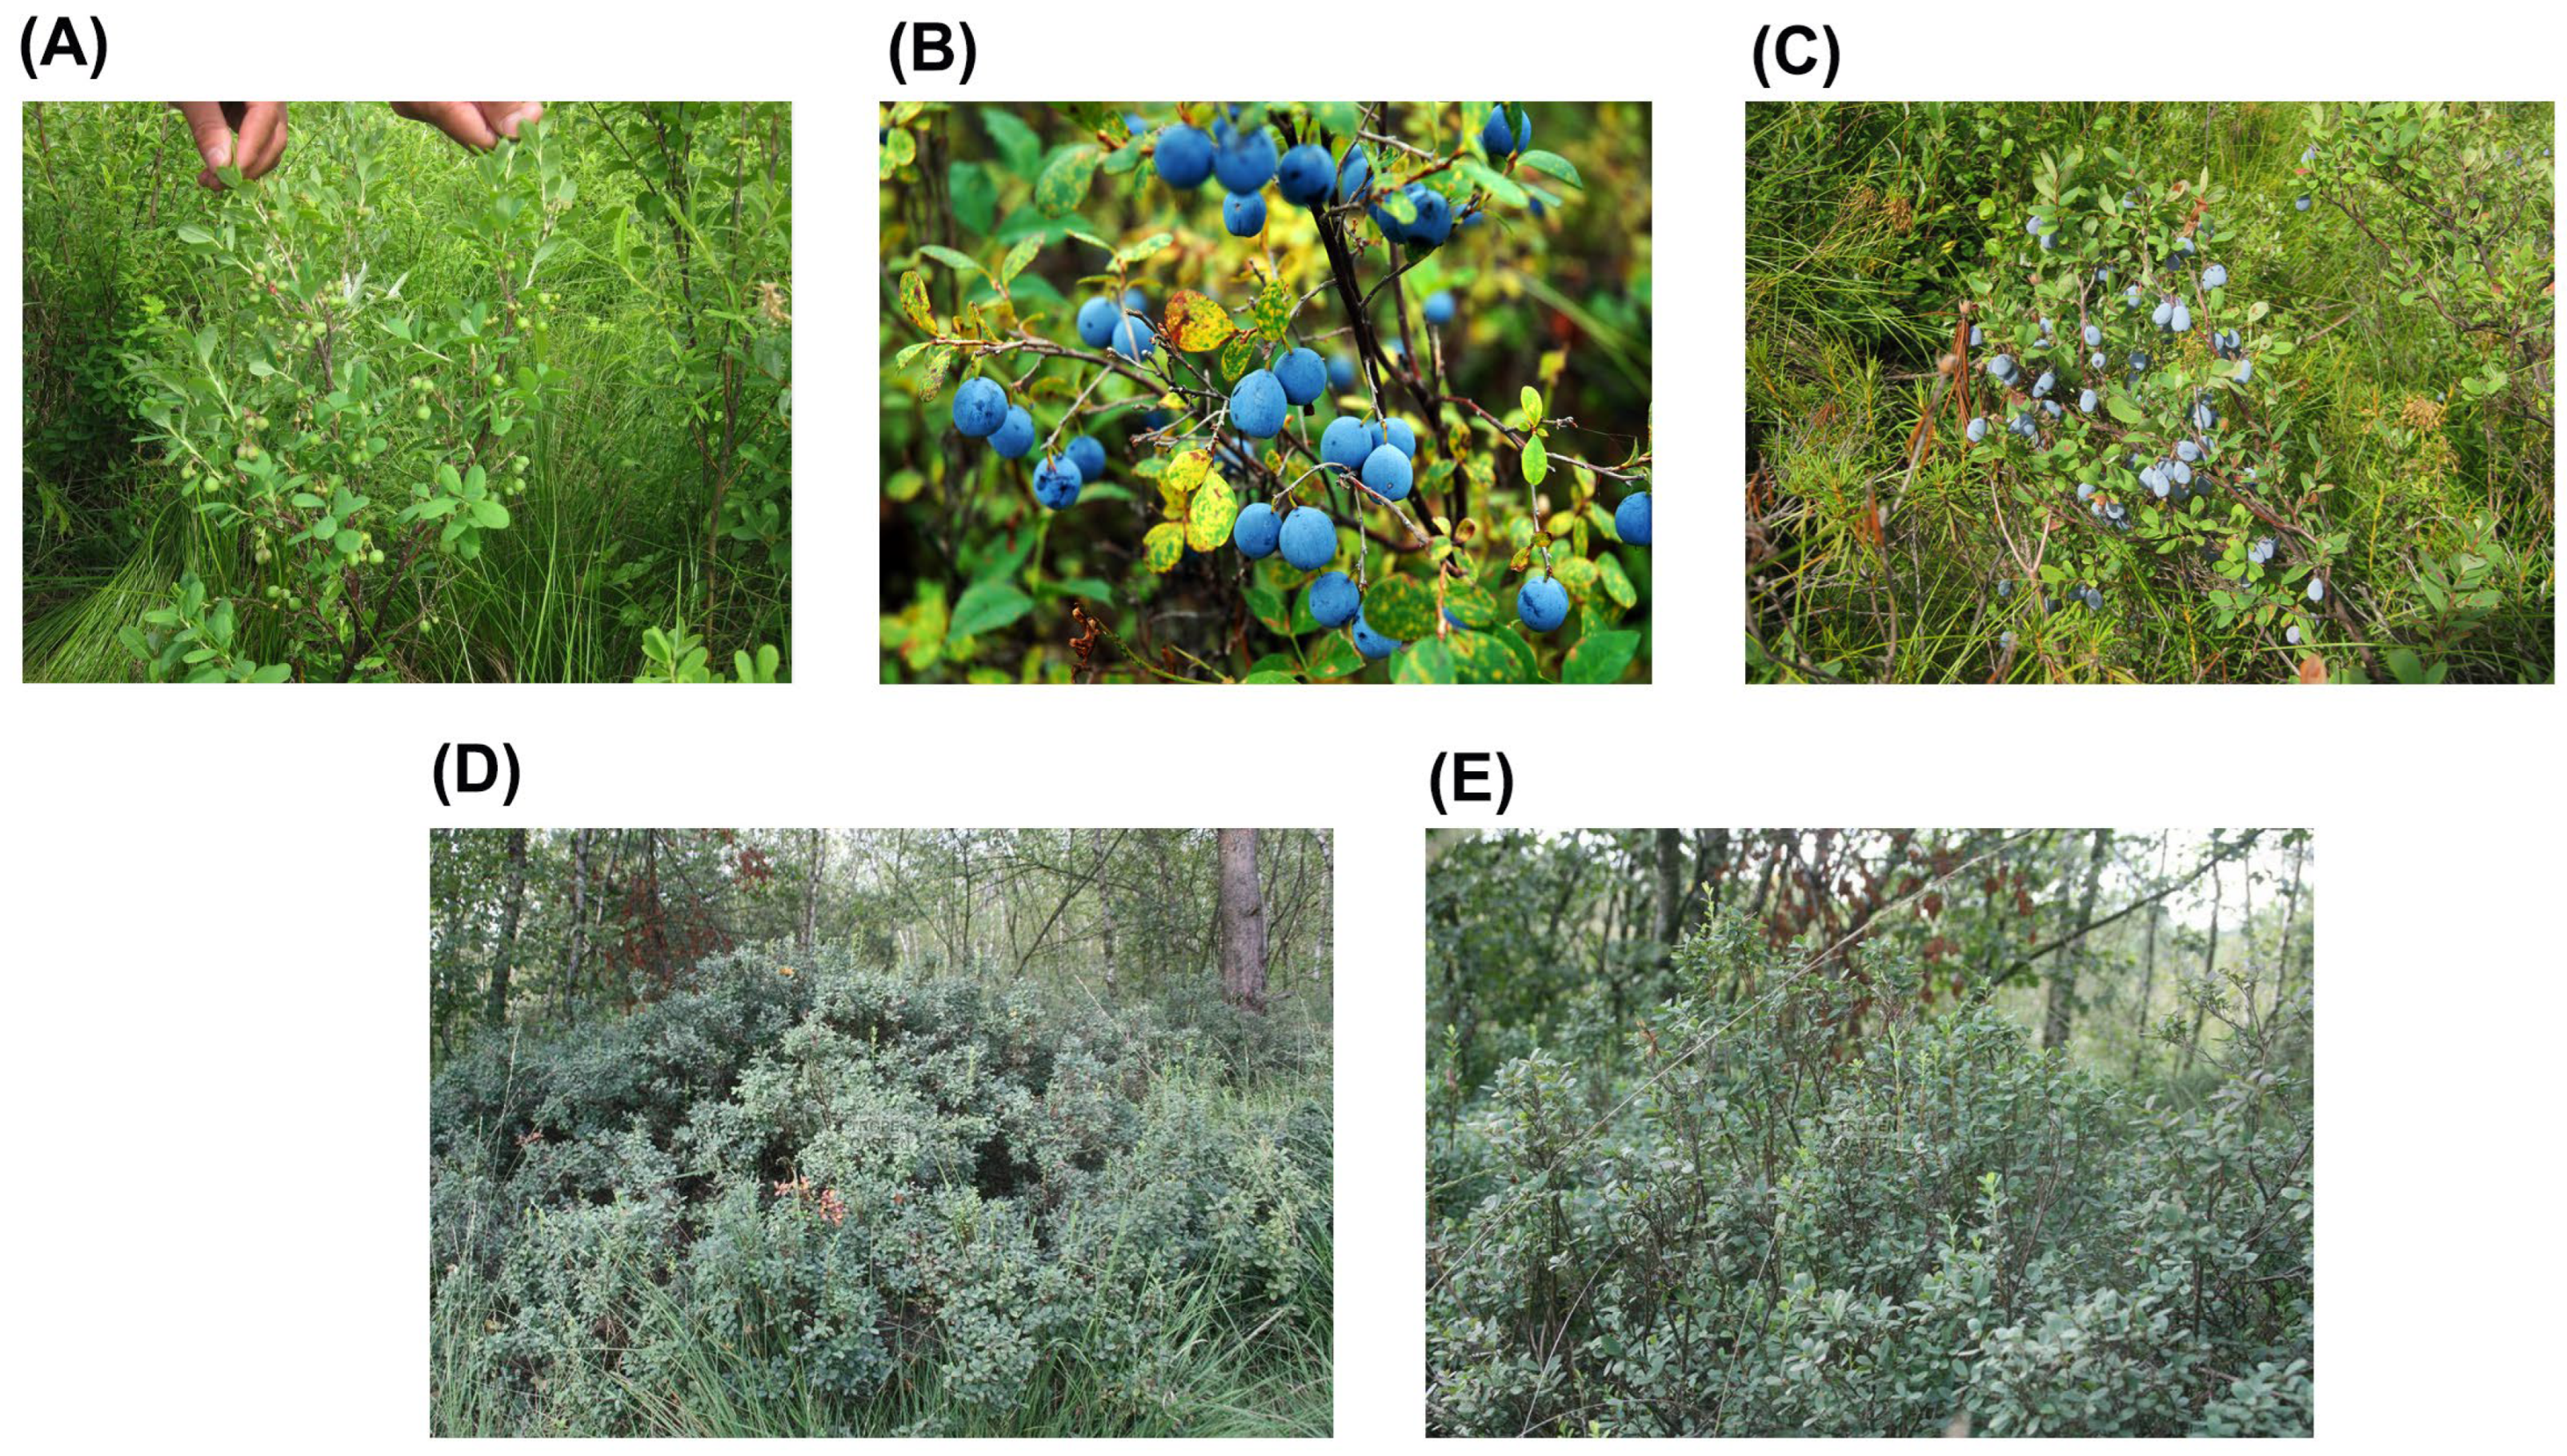
2.2. Field Investigation

A field investigation was conducted in July of 2018 when bog bilberry grew to a fully vegetative state in that year [3]. A survey was conducted prior to the field investigation by mailing questionnaires to prefecture-level forest bureaus (Supplementary Table S2). Briefly, the managers of the forest bureaus were invited by paying them an emolument to answer whether they were aware of the occurrence of bog bilberry in the montane forests of their prefecture. They were invited to give more details about the estimated occurrence and the specific location of the stand. A total of 23 prefectures were targeted as potential areas, and 21 of the forest bureau managers returned the questionnaires.
Each bog bilberry population was investigated in three 600 m2 plots (20 m × 30 m). Every two adjacent plots were set at least 3 km away from each other to prevent homogeneous performance [33]. All trees were measured in each plot for their height, diameter at breast height (DBH), canopy area, canopy density, and stem density. Tree species were also recorded to estimate the diversity index. Two belt transects (width × length: 5 m × 30 m) were set within a plot, with each belt 5 m away from the plot edge or the other belt. All bog bilberry groves were measured for their number, height, and crown area. Aboveground parts of bog bilberry in the two belts were harvested to measure their fresh weight. Landsat 8 OLI images were used as a source of remote evaluation data. Elevation was evaluated using a digital elevation model (DEM) from the dataset of the Aster GDEM 30 m satellite [34]. The slope was estimated in the DEM model using ArcGIS 10.2 (Eris Branch, Shanghai, China).

2.3. Variable Calculation

To quantify the vegetative content of the stands, the normalized difference vegetation index (NDVI) was calculated as follows:
N D V I = B a n d N I R B a n d R e d B a n d N I R + B a n d R e d
where BandNIR is the near-infrared band (band 8), and BandRed is band 4 in red light reflectance. Tree species diversity was assessed using the Simpson (D’) [35] and Shannon–Wiener indices (H’) [36], which were calculated as follows:
D = i = 1 j n i × ( n i 1 ) N i × ( N i 1 )
H = 1 × i = 1 j n i N i × l n n i N i
where ni is the number of objective tree species up to a final order of j, and N is the total number of all species in a stand.

2.4. Statistical Analysis and Mapping Process

All statistics were calculated using SPSS ver. 20.0 (IBM Inc., Amonk, NY, USA). Correlation analysis was used to assess the relationships between stand parameters and latitude or longitude gradients. Multivariate linear regression (MLR) was used to detect combined contributions of stand attributes and topographic factors to bog bilberry variables. Finally, structural equation models (SEMs) were employed to reveal the inner relationships of latent factors (stands, bog bilberry, and forests) and bog bilberry population variables.
Random forest (RF) was employed as the algorithm for a machine learning model to regress the bog bilberry variables against the host forest and stand parameters. In order to address the issue of the data being over-varied and in an imbalanced scattered range, which could limit modeling performance [37], the raw data (x) were transformed as follows:
β = l o g 5 ( x + 5 )
where β is the transformed value used for RF regression, which was then transformed back to x when being used for mapping. The regressed results were validated using the SMOGN fold-stratified cross-process [38]. In detail, the results found in the 60 plots were randomly separated into six folds, and each had 10 individual observations. RF was repeated to train a model to predict values (PVs), which were used for comparison with measured values (MVs). The recovery rate of PVs divided by MVs can be referred to as a validation result. Critical values of recovery rates higher than 70% were accepted for validation [30]. PVs were mapped in prefecture-level regions of the eastern forests in the study area, which were divided into 25 km2 grids (5 km × 5 km) (total number of grids: n = 13,625) (Supplementary Figure S1). The prefecture-level regions were taken as the basic units for mapping both in the field investigations and the remote evaluation.

3. Results

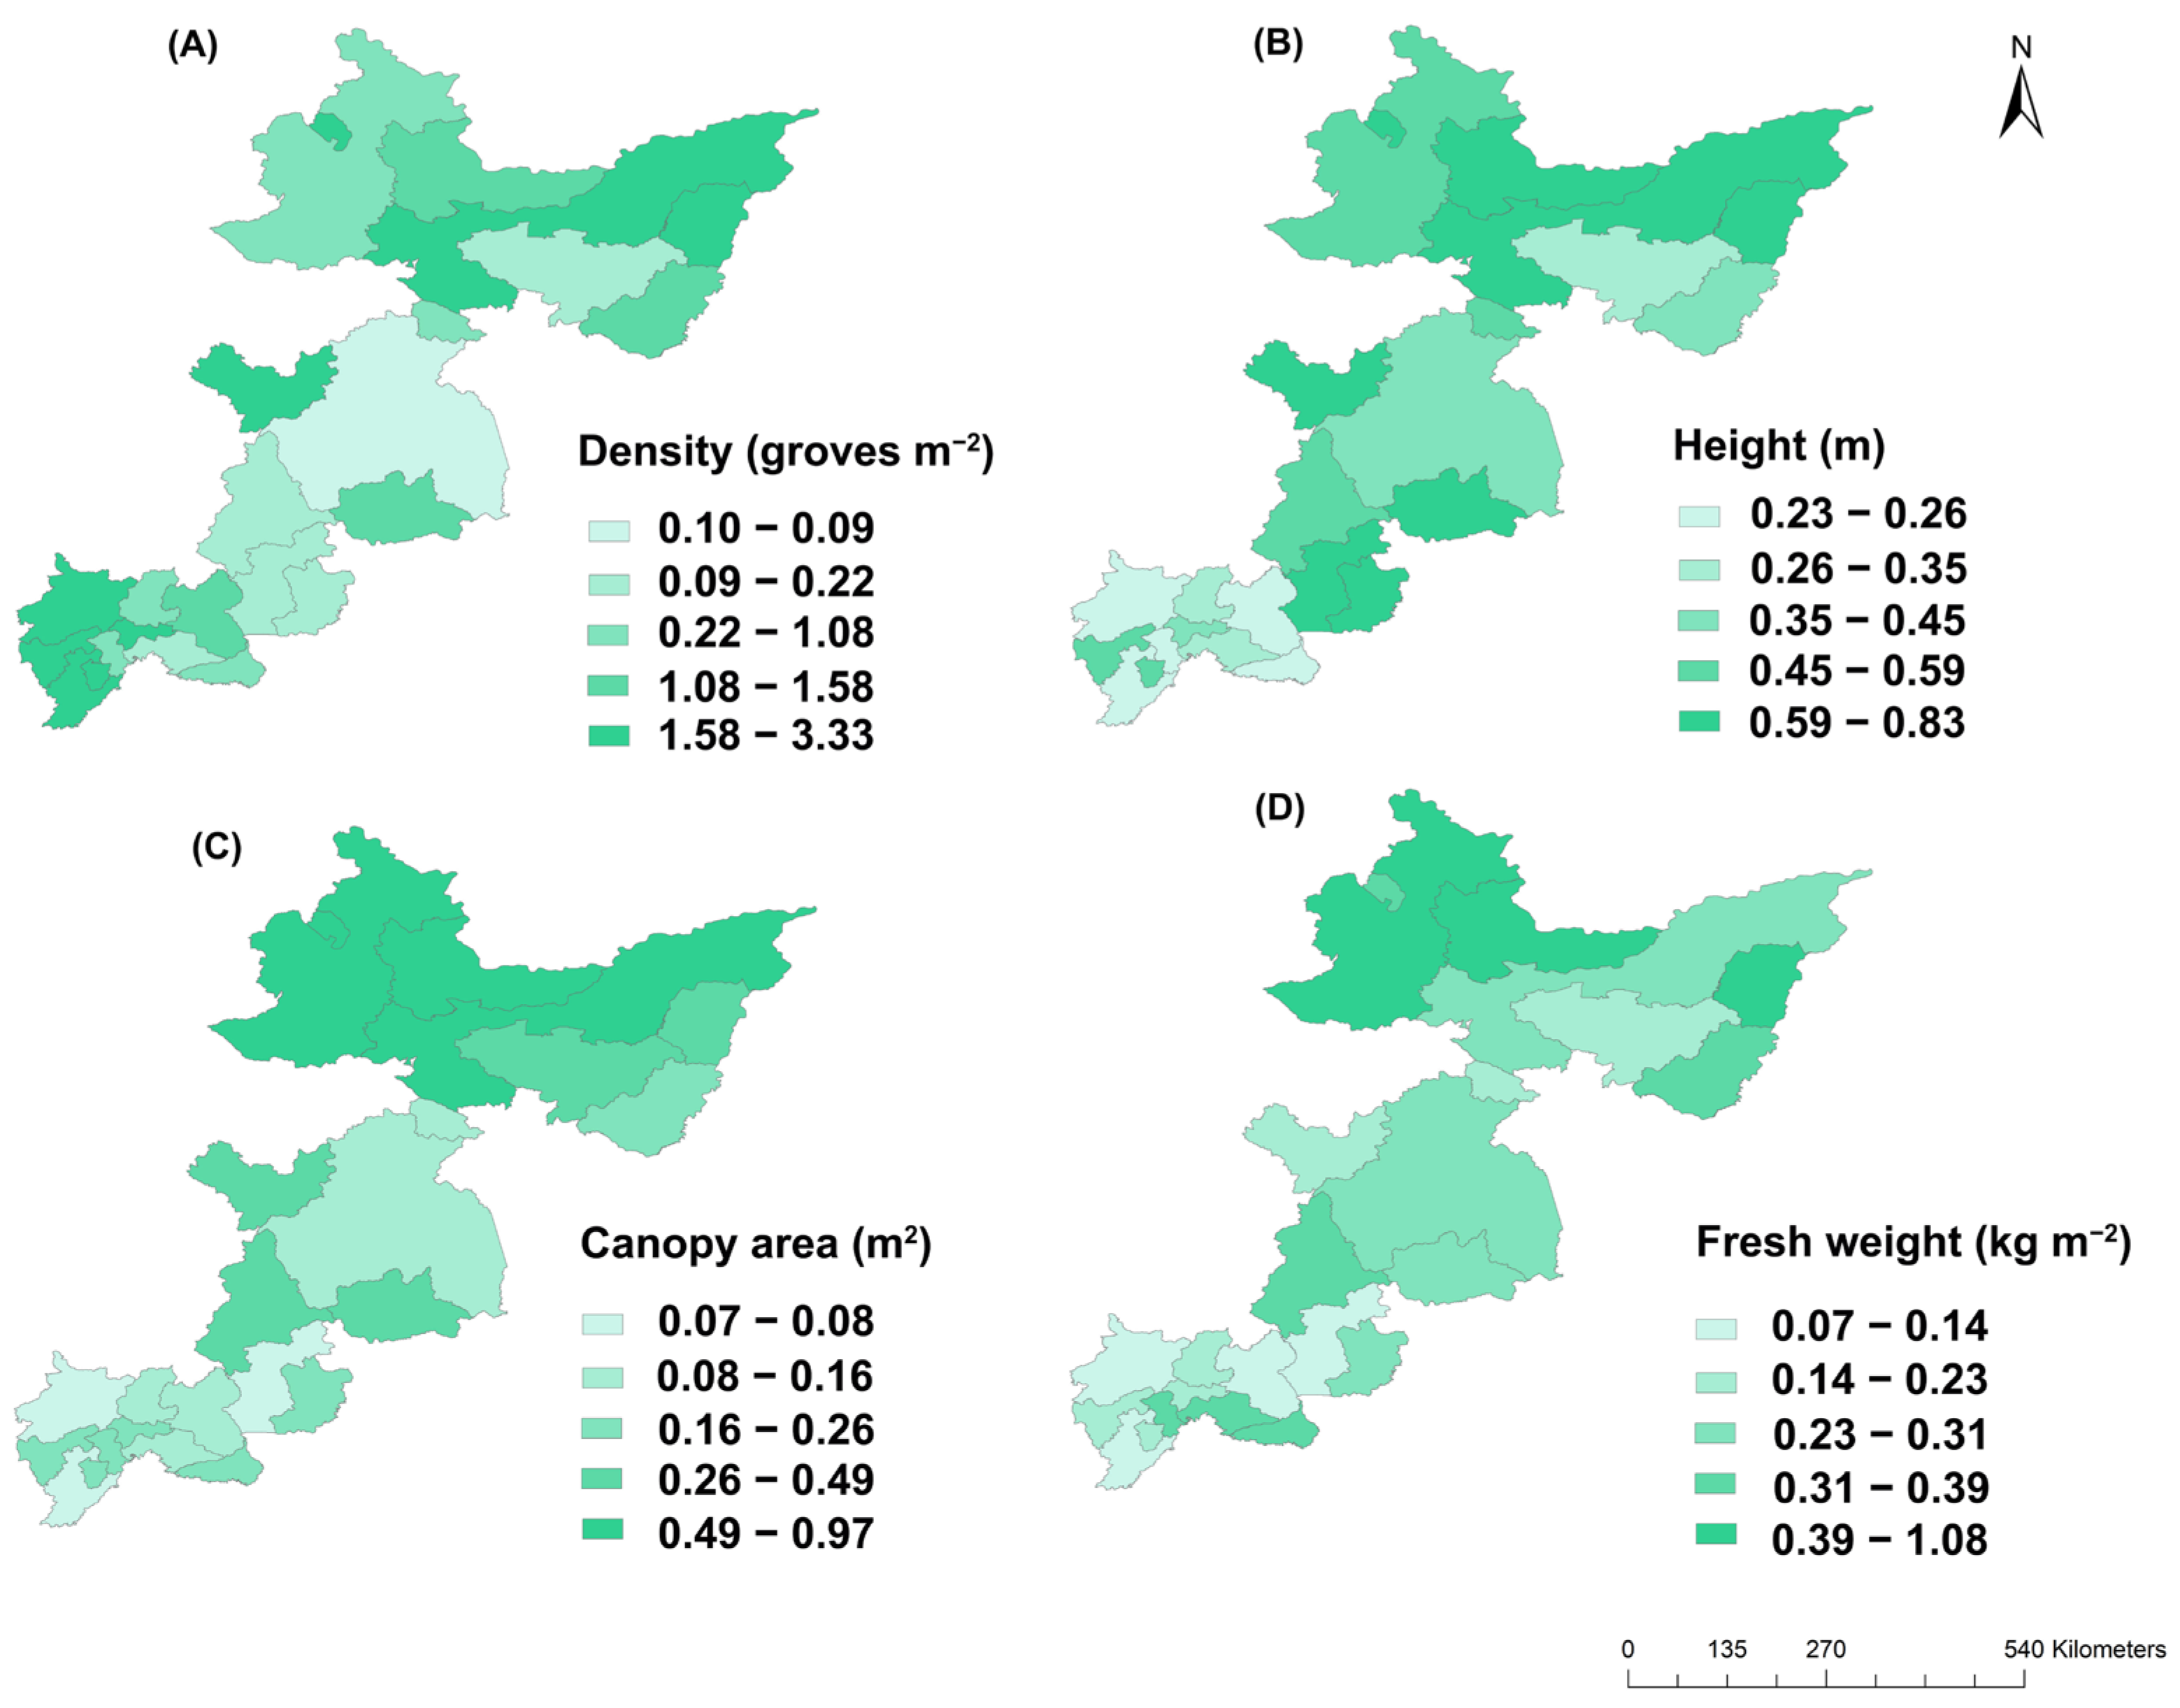
3.1. Spatial Distributions of Bog Bilberry Variables

The bog bilberry density was lower in the central part of the study area, which contained the prefecture of Mudanjaing (Figure 3A). The bog bilberry density was high (~3 groves m−2) in three discrete areas: the combined areas of Jiamusi and Raohe (north), Shangzhi (middle), and Tonghua (south). The bog bilberry height was generally higher in the northern parts than in the south, except for that in Shuangyashan, which was lower than 0.3 m (Figure 3B). The bog bilberry canopy area also showed a general decreasing trend from the north (e.g., Wuying, 0.83 m2) to the south (e.g., Tonghua, 0.07 m2) (Figure 3C). Most regions in the study area showed moderate to low levels (≤0.23 kg m−2) of the fresh weight of bog bilberry, but those in Wuying and Yichun were higher than most of the rest of the regions (Figure 3D).

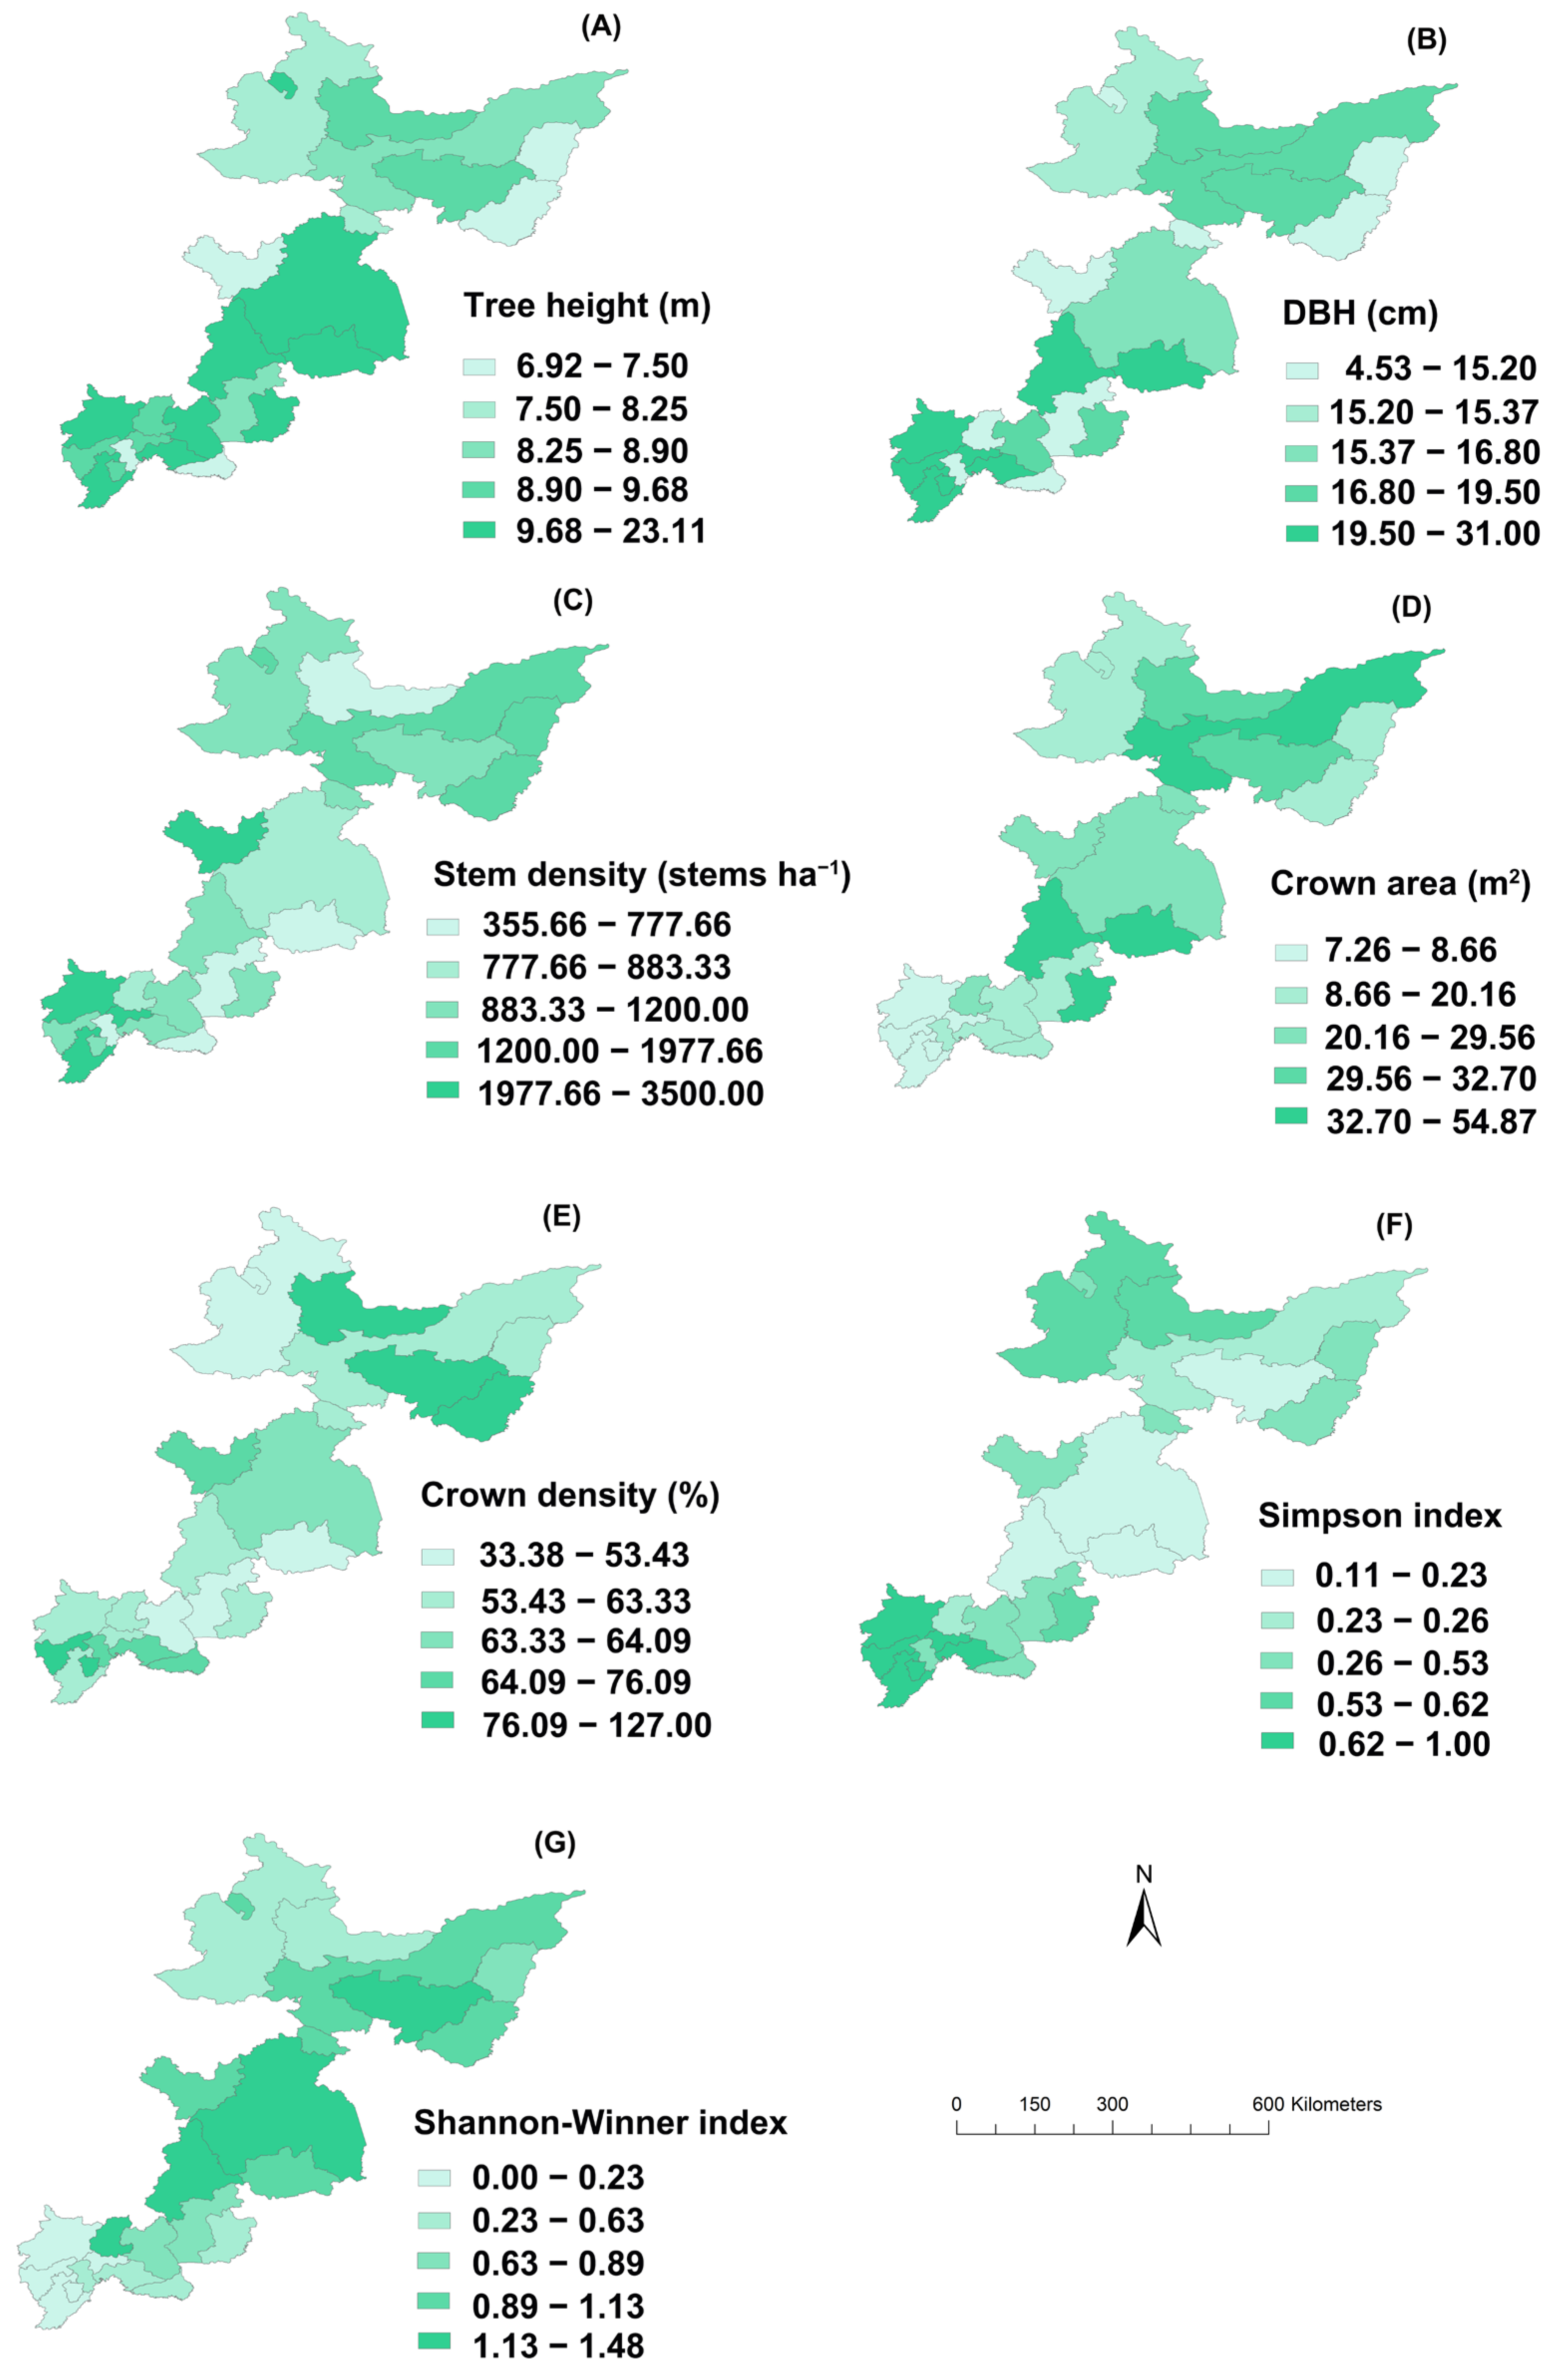
3.2. Spatial Distributions of Forest Stand Attributes

The tree height was generally higher in the central part of the study area (Mudanjiang, Dunhua, and Wangqing; over 9 m) than in the rest of the parts (Figure 4A). DBH was generally higher in stands in Jilin province than in those in Heilongjiang province (Figure 4B). For example, the DBH in Dunhua, Wangqing, Tonghua, and Linjiang was higher than 16 cm. The stem density was alternately high and low among the prefectures along the latitudinal gradient (Figure 4C). For example, the stem density was as high as 1977.67 stems ha−1 in Jiamusi, as opposed to the low level of 777.67 stems ha−1 in Hegang. Shangzhi had a high density of 3500.00 stems ha−1, as opposed to the low density of 883.33 stems ha−1 in Mudanjiang. The crown area tended to be higher in the central part and lower around the edges of the study area (Figure 4D). The crown density had moderate to low levels in most regions of the study area, while some parts had high levels, such as Hegang, Shuangyashan, and Hulin (Figure 4E). The tree species diversity estimated with the Simpson index was high at the northern and southern ends of the study area and lower in most of the central part (Figure 4F). In contrast, the Shannon–Wiener diversity index was higher in the central part than at the edges (Figure 4G).

3.3. Relationships between Bog Bilberry Variables and Stand Latitude

The changes in bog bilberry density according to the increase in stand latitude could be fit with a polynomial quadratic curve (Figure 5A), and the changes in bog bilberry height, crown area, and fresh weight could all be fit with linear curves (Figure 5B–D). According to coefficients of the polynomial quadratic curve used to fit the bog bilberry density (Table 1), when the latitude of a stand was 44.3016° N, the bog bilberry density could theoretically reach the lowest level of 0.43 groves m−2.
Forest tree height and DBH showed negative relationships with latitude (Figure 5F,G). With the increase in stand latitude, tree crown area, the Simpson index, and the Shannon index (Figure 5H,J,K) could all be fit with curves of polynomial quadratic models. According to the coefficients shown in Table 1, the tree crown area could theoretically reach a maximum of 31.88 m2 at a stand location with a latitude of 44.9886° N (Figure 5H). The Simpson and Shannon indices showed contrasting trends along the increasing latitude gradients. Theoretically, when the stand latitude was 45.0458° N, the Simpson index could reach a minimum value of 0.27 (Figure 5J); when the latitude was 45.0101° N, the Shannon index could reach a maximum value of 1.21 (Figure 5K).

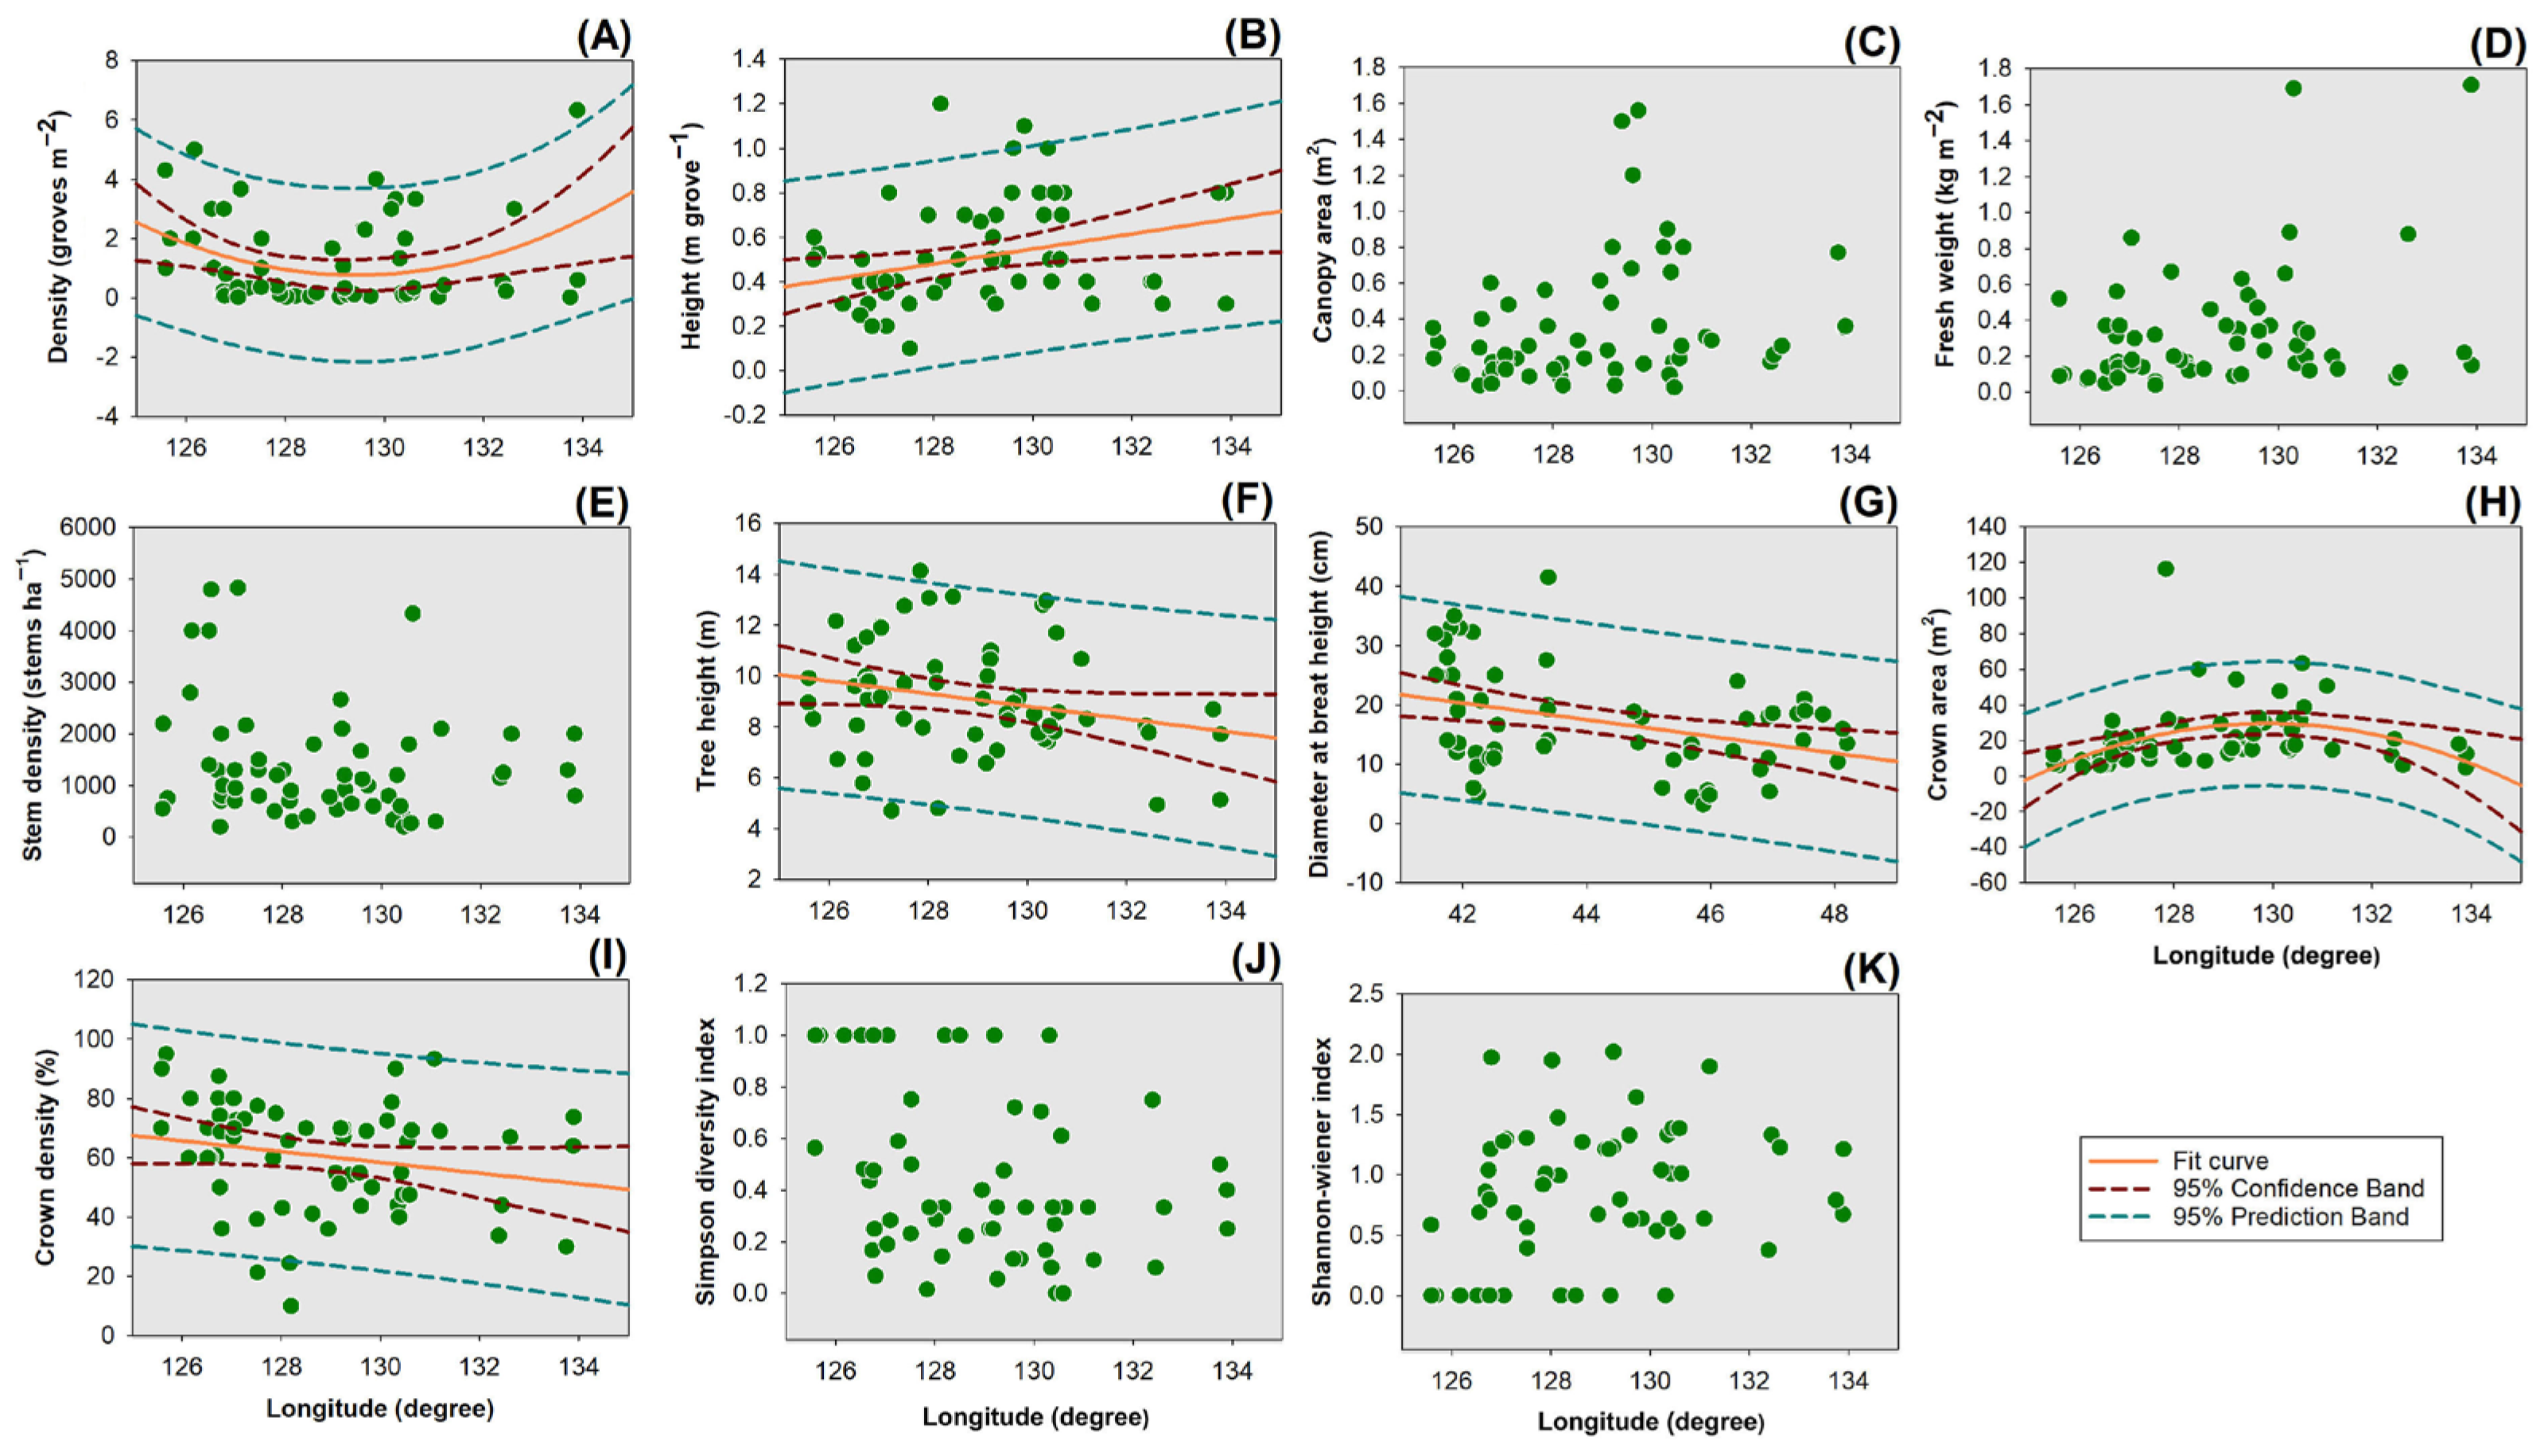
3.4. Relationships between Tree Variables and Stand Longitude

With the increase in stand longitude, the changes in bog bilberry density could be fit with a polynomial quadratic curve (Figure 6A), and the changes in bog bilberry height can be fit with a linear curve (Figure 6B). According to the coefficients in Table 2, when the stand longitude reached 129.4558° E, the bog bilberry density reached a minimum value of 0.52 (Figure 6A).
The forest trees had negative relationships of height (Figure 6F), DBH (Figure 6G), and crown density (Figure 6I) with the longitude of stands. The relationship between tree crown area and longitude could be fit with a polynomial quadratic curve (Figure 6H). When the stand longitude was 129.8887° E, the tree crown area could reach a theoretical maximum value of 28.88 m2 (Table 2).
Mudanjiang was found to be the prefecture in which all indicated values were concentrated (Figure 7). At its position with a latitude of 44.3016° N and a longitude of 129.4558° E, it had the lowest bog bilberry density in the study area. At a latitude of 44.9886° N and a longitude of 129.8887° E, the host forest tree crown area reached the maximum level. In the belt between the latitudes of 45.0101° N and 45.0458° N, the lowest Simpson index and the highest Shannon index were found.

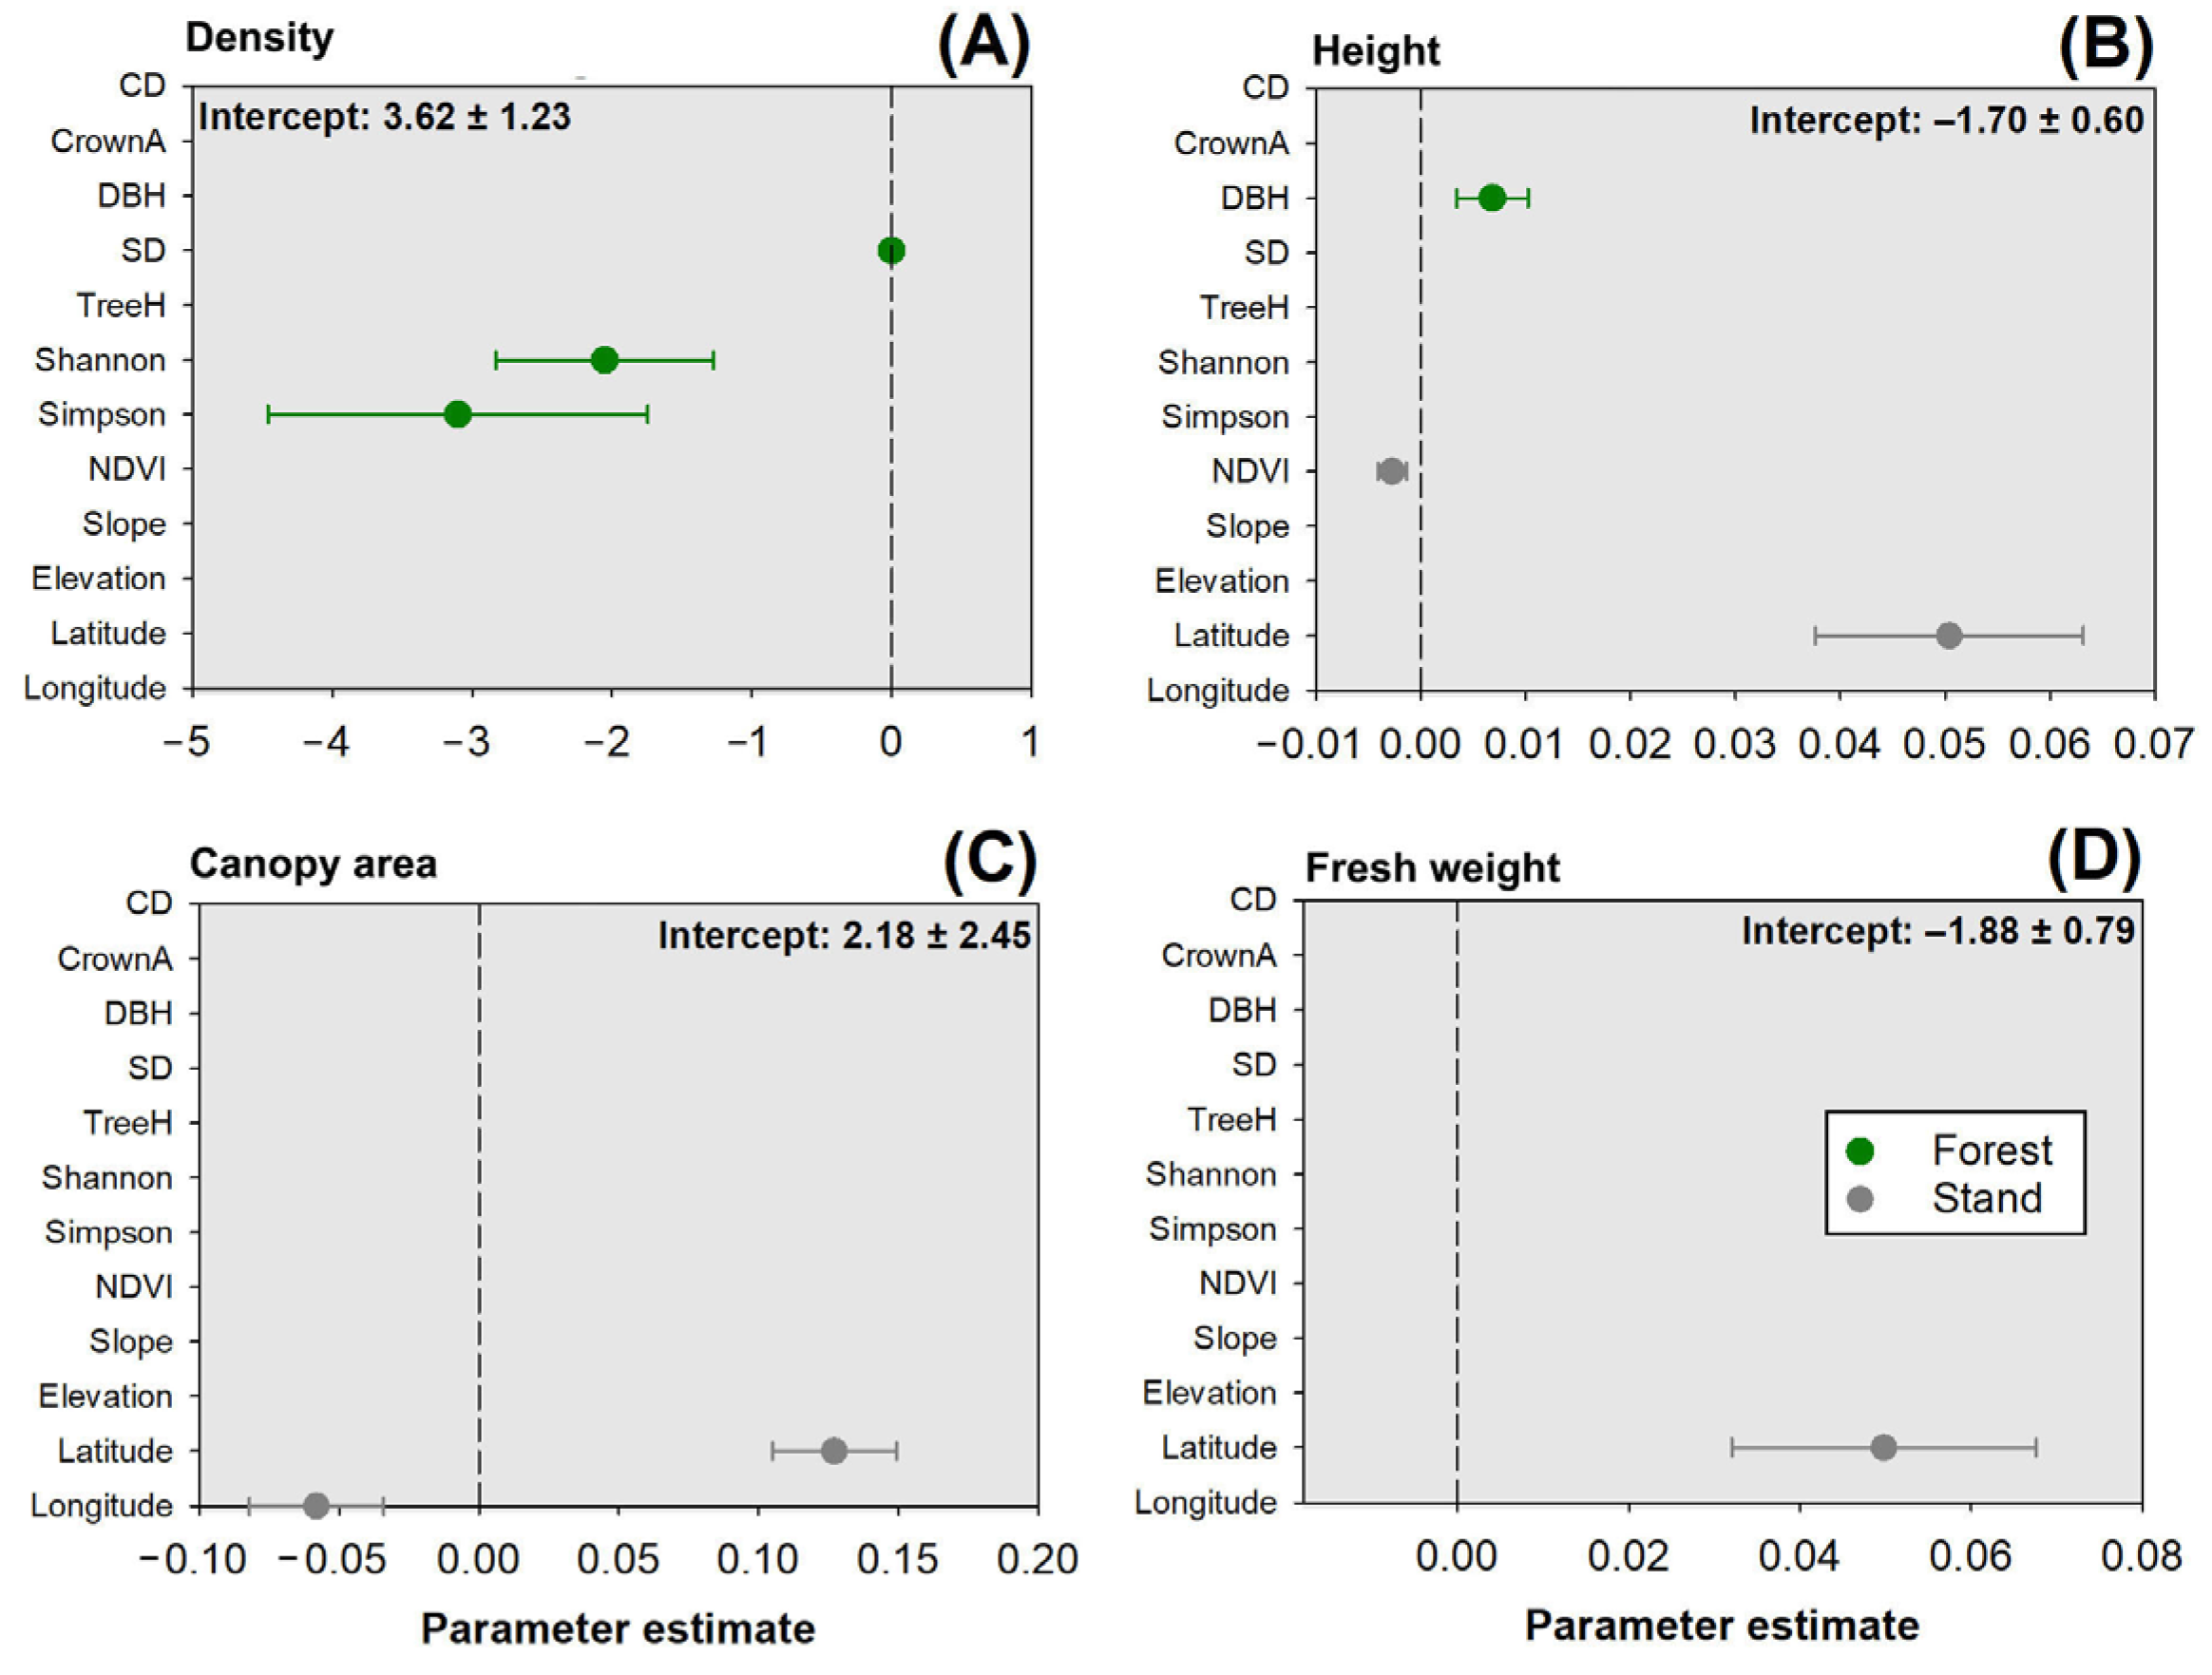
3.5. Multivariate Linear Regression Analysis

The stem density of trees had a tiny positive contribution (parameter estimate [PE] = (5.44 ± 1.65) × 10−4) to bog bilberry density, while both the Simpson and Shannon indices showed negative contributions (Figure 8A). The NDVI had a negative contribution to bog bilberry height, but both the DBH and stand latitude showed positive contributions (Figure 8B). Again, the latitude had another positive contribution to the bog bilberry canopy area, and the longitude showed a negative contribution (Figure 8C). Latitude was the only parameter that had a positive contribution to bog bilberry fresh weight (Figure 8D).

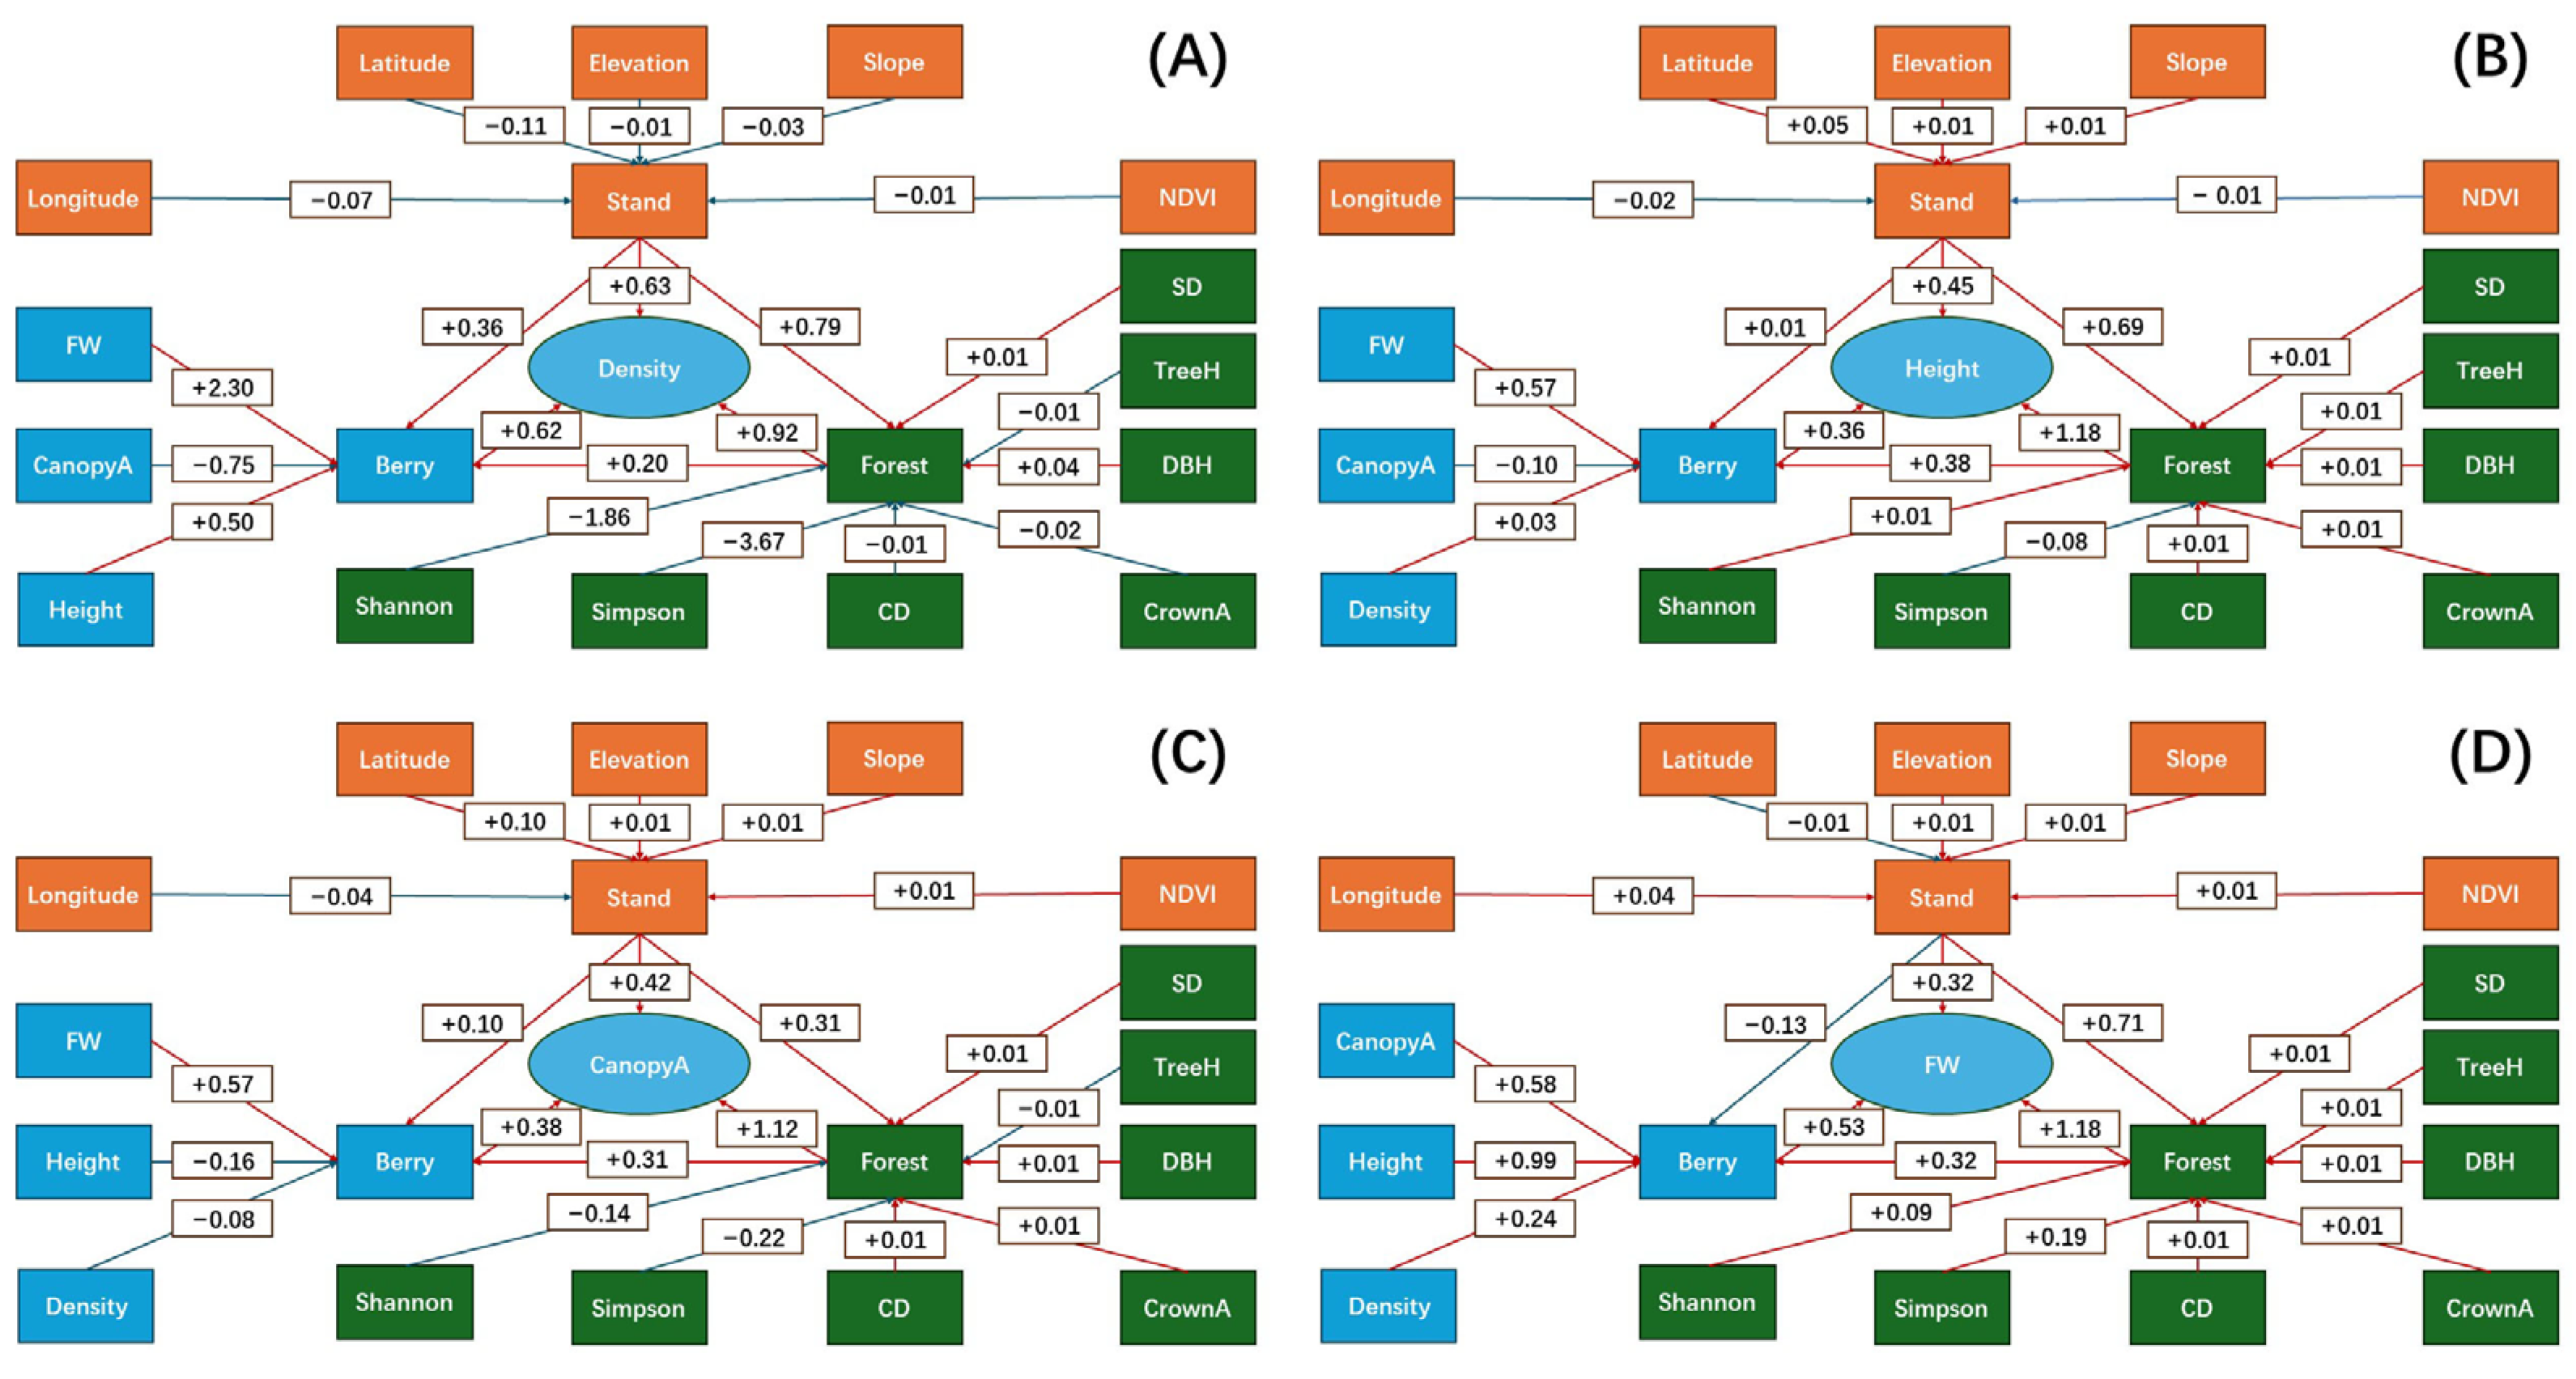
3.6. Structural Equation Model Analysis

Bog bilberry grove density was positively affected by all three latent factors of stand attributes (Stand), forest structure (Forest), and Bog bilberry population characteristics (Bog bilberry) (Figure 9A–D). Stand had a positive effect on Forest, which continuously had a positive effect on Bog bilberry. Stand made positive contributions to Bog bilberry for most Bog bilberry diameters (Figure 9A–C), but the contribution of Stand to Bog bilberry was negative for fresh weight (Figure 9D).
Compared with the effect magnitudes of Stand and Bog bilberry (about +0.6), that of Forest was greater (+0.92) (Figure 9A). Stem density contributed to Forest with a low positive magnitude, and DBH made a greater positive contribution (+0.04) to Forest. All of the other forest structure variables contributed to Forest with negative effects. All three factors of latitude, longitude, and elevation also contributed to Stand with negative effects. For Bog bilberry, the canopy area had a negative effect, but the fresh weight and bog bilberry height both contributed to positive effects (Figure 9A).
The factors of stem density, tree height, crown area, and the Shannon index made positive but tiny contributions to Forest, while DBH made a stronger positive contribution (Figure 9B). The Simpson index made a negative contribution to Forest. The stand attributes of latitude, elevation, and slope made positive contributions to Stand, which was negatively affected by longitude and the NDVI. Bog bilberry canopy area had a negative effect on Bog bilberry, while the factors of fresh weight and density had positive effects.
The stem density, DBH, and crown area made positive contributions to Forest, while the tree height, Shannon index, and Simpson index made negative contributions (Figure 9C). Nearly all stand factors made positive contributions to Stand, except for longitude. Fresh weight made a positive contribution to Bog bilberry, and height and density made negative contributions.
All forest structure parameters made positive contributions to Forest (Figure 9D). Most stand attributes made positive contributions to Stand, except for a negative contribution from latitude. Canopy area, height, and grove density all made positive contributions to Bog bilberry.

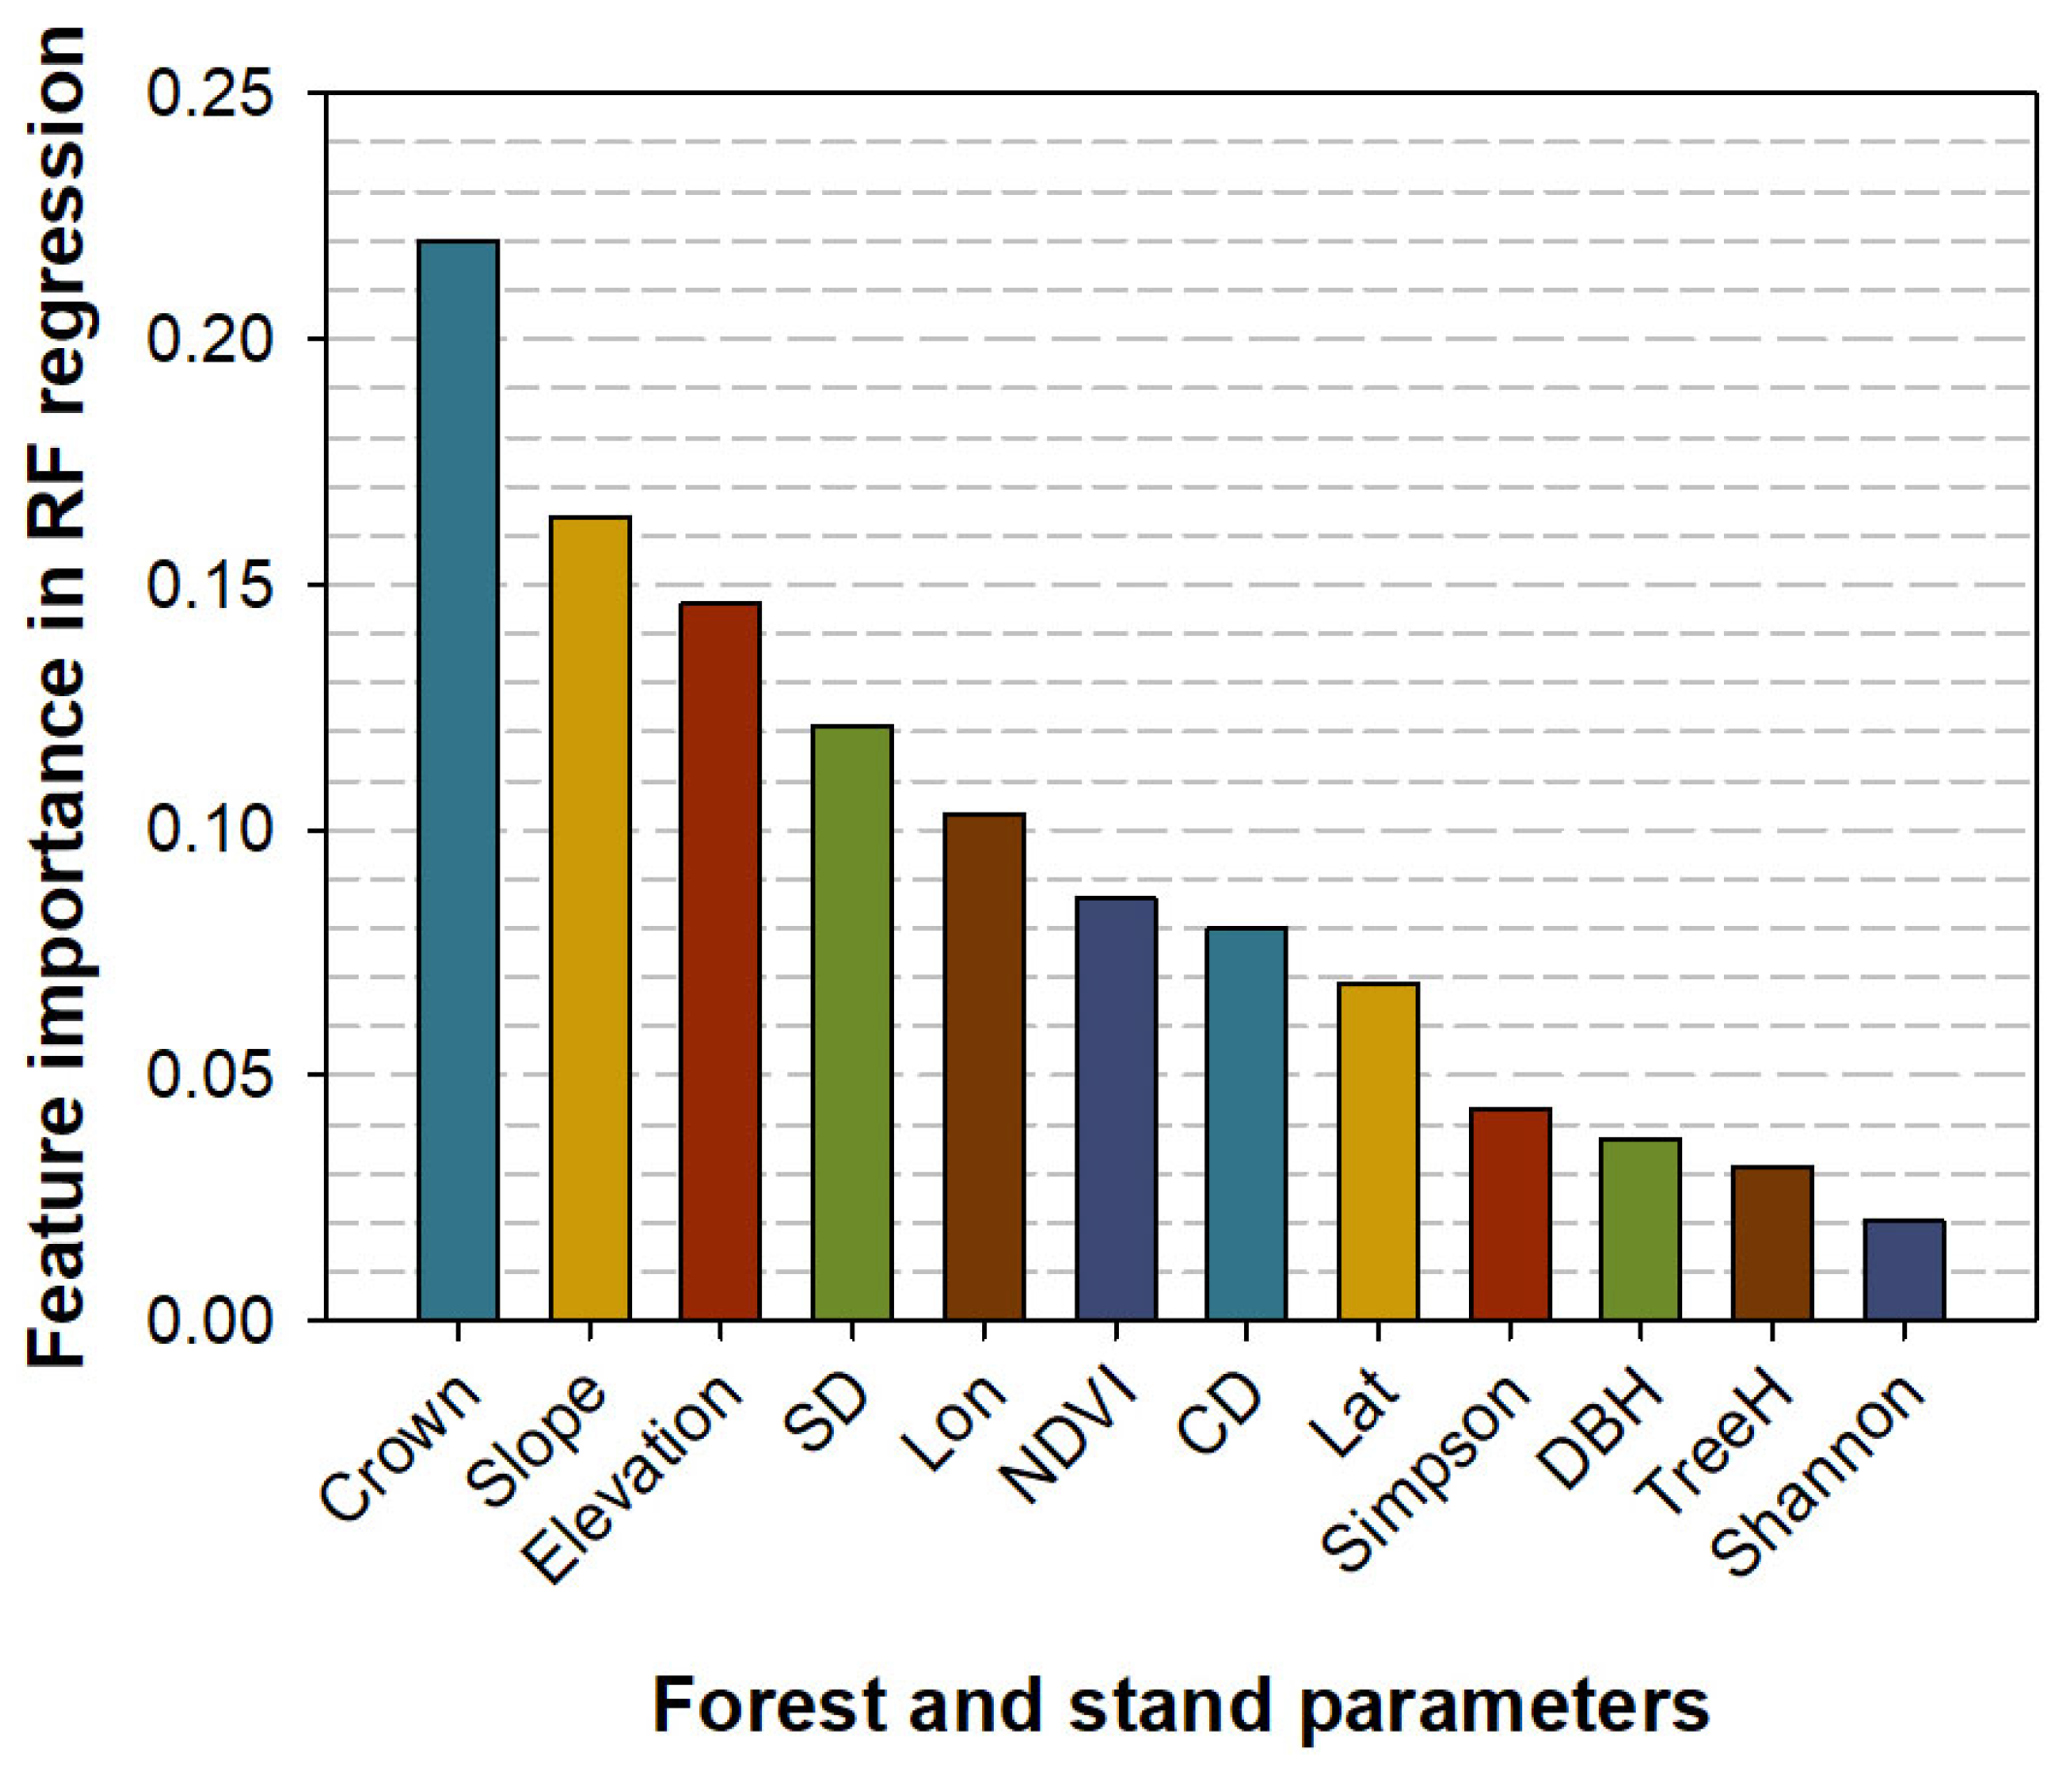
3.7. Machine Learning Model Regression

Using the transformed data from Equation (4), RF resulted in a high determinant coefficient (R2) for all bog bilberry variables that were over 58.5% (Table 3). Technical errors were well controlled, meaning that the root mean squared error (RMSE) was generally lower than 0.02, except that for density (0.045); the mean square error (MSE) was controlled to be lower than 0.003, and the mean absolute error (MAE) was always lower than 0.03. Fold cross-validation was carried out (Supplementary Figure S2). The recovery rates between PVs and MVs were 78.86% for density, 78.21% for canopy area, and 75.81% for fresh weight of bog bilberry, which all fulfilled the critical validation criterion of 70%, but this criterion was not fulfilled for height (65.52%). Together, these results demonstrate that the model is well-established and can be used for the following analyses.
Averaged values of feature importance for the forest and stand parameters are shown in Figure 10. In the regression of four bog bilberry variables, the crown area had the highest feature importance value, followed by the slope and elevation of stands. The stem density was listed as the fourth highest, and the stand longitude was listed as the fifth. The rest of the forest and stand parameters were predicted to have feature importance values of <0.10, as they showed smaller contributions to prediction.

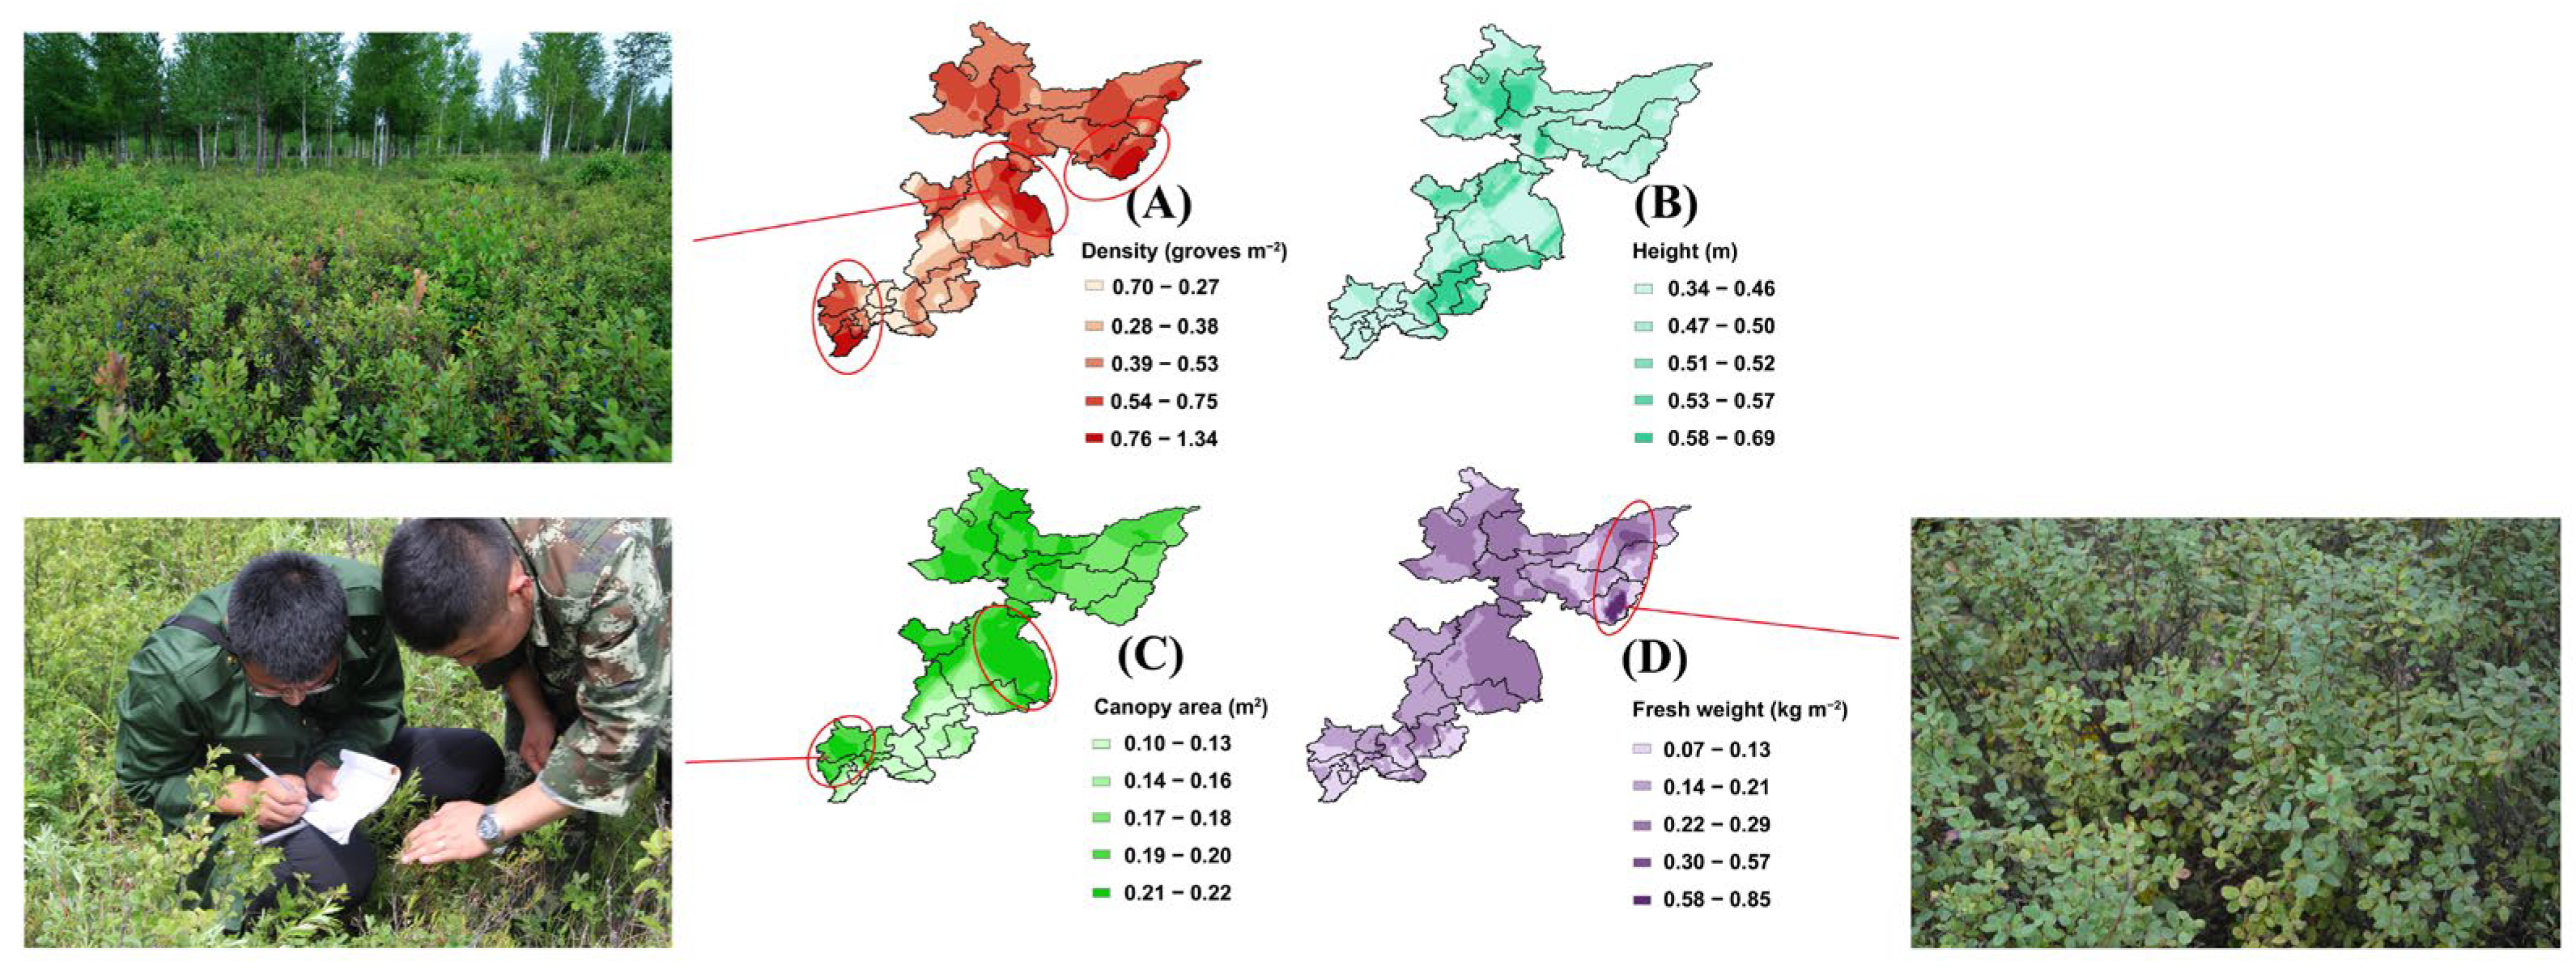
3.8. Spatial Distributions of Predicted Bog Bilberry Population Characteristics

The grove density of bog bilberry was predicted to be high in three regions: Hulin and Mudanjiang in Heilongjiang and Tonghua in Jilin (Figure 11A). A typical population with high grove density was found in Hulin, which was characterized by a secondary forest formed from a red pine (P. koraiensis) plantation combined with white birch (B. platyphylla). The regressed data on height failed to pass the validation, and the distribution is shown in Figure 11B. The canopy area was predicted to be large in Mudanjiang and Tonghua as well (Figure 11C). In Tonghua, a bog bilberry population with a large canopy area and a low grove density was targeted. Hence, the floor layer was fully occupied by weeds, which were frequently covered by bog bilberry canopies. The fresh weight was predicted to be great in eastern Heilongjiang, covering Hulin and the interface between Jiamusi and Raohe (Figure 11D). A typical population was found in Raohe, where a heavy shoot fresh weight resulted from small vegetative organs (leaves, twigs, and growing green branches) but long and strong woody branches and sprouts. It was the large proportion of woody tissues that accounted for the fresh weight.

4. Discussion

4.1. Geographical Distributions of Bog Bilberry Population Characteristics

The bog bilberry height, canopy area, and aboveground fresh weight all showed an increasing trend along the latitudinal gradient, but only the bog bilberry height showed another positive relationship with longitude. Hence, the latitudinal gradient determined height elongation, canopy growth, and fresh weight in bog bilberry individuals. Bog bilberry is a shrub dwelling in forests that are subjected to cold climates, and its best habitats may have been moved northwards due to climatic warming [39]. It was indicated that temperature and precipitation are two key factors that jointly determine its distribution [15]. Hence, the spatial responses of meteorological conditions governed its host forest structure and further determined its population distribution. Jin et al. investigated boreal forests and indicated that increasing latitude changed the type of forest that was more beneficial for the growth of bog bilberry individuals and plant diversity in the shrub layers [40]. Bog bilberry height also showed a positive response to the increase in longitude. Hence, the shoot height was the only parameter that showed a higher level in the northeastern plots than in the southwestern stands. This makes sense because the northeastern plots were placed near the Wusuli River in an area that was very moist and had frequent rainfall, which appeared to benefit the growth of bog bilberry.
The bog bilberry grove density did not show any geographical responses to topographical gradients. Instead, it increased in a U-shaped curve along increasing latitudinal or longitudinal gradients, which resulted in a minimum grove density in the southern part of Heilongjiang province. The region with the lowest bog bilberry density was also predicted within an area that had very low suitability for bog bilberry. These findings partly agree with those from a previous study on bog bilberry in the Changbai Mountains, for which a negative response curve was found [41], and they partly agree with another study conducted in the Greater Xing’an Mountains [40]. It was the stand attribute of low tree species diversity that led to low bog bilberry density. This was because the bog bilberry density was jointly driven by negative forces from the Simpson and Shannon indices, both of which were not linearly correlated along topographical gradients and were negatively related to each other. In the indicated region, the Simpson index was higher than the minimum level, indicating that a few species tended to dominate the host forests. In contrast, the Shannon index was lower than the minimum level in this region, indicating a less even distribution of tree species [36]. Overall, the bog bilberry populations distributed in the northern parts of Heilongjiang province showed superior attributes to those in Jilin province.

4.2. Geographical Changes in Host Forest Structures

In host forests, both the tree height and DBH showed negative responses to increases in latitude and longitude, resulting in forests in the southwestern parts growing with tall and strong trunks and those in the northeastern parts having thinner trunks. Multivariate regression indicated that DBH had a positive contribution to bog bilberry height, which resulted from a strong and positive contribution of DBH to the Forest latent factor and continuously benefitted bog bilberry growth. However, this does not mean that we found a positive relationship between DBH and bog bilberry height. DBH had effects on bog bilberry height mostly due to its positive contribution to forest stand structure, where soil fertility probably promoted the growth of bog bilberry height [3]. We can surmise that forests with dominant trees that have strong trunks are accompanied by bog bilberry individuals with tall shoots, both of which are indicators of a high-quality stand.
The tree crown area was another parameter that showed an extreme value at a place that was close to the stand that was indicated as having the lowest bog bilberry density. We did not find a relationship between the tree crown area and the bog bilberry population according to the multivariate regression models. In the structural equation models, however, the tree crown area imposed potentially positive impacts on bog bilberry density by contributing to the latent factor in the comprehensive forest structure. The coverage area of tree crowns, however, also had potentially positive impacts on bog bilberry height, canopy area, and fresh weight in this way. This benefit can be explained as a series of positive effects that shaped high performance in the humus and micro-habitat [42]. Even so, the place that was indicated to have the highest tree crown area had low habitat suitability for bog bilberry. This was due to other factors with stronger limiting forces, such as the NDVI and longitude. As a stand attribute, the NDVI had a negative effect on bog bilberry height, and longitude limited the bog bilberry canopy area. Thus, in habitats in Heilongjiang and Jilin provinces, stands with medium to high levels of habitat suitability were mainly distributed in the western parts. The NDVI made a negative contribution to Stand, which continuously limited bog bilberry height. The trend of this potential effect agreed with that of the Simpson index, suggesting that it was the decline in the number of dominant tree species that reduced vegetative coverage and lowered the stand NDVI level.

4.3. Spatial Distribution of Population Characteristics Predicted by the Machine Learning Model

Regions around the Hulin–Raohe area in eastern Heilongjiang were predicted to have great shoot productivity with dense individuals. However, these regions already harbored enriched reserves of bog bilberry populations with dense and heavy individuals, which were predicted to result from the high level of large tree crown shading and high slope. Although bog bilberry can dwell in stands with full sunlight exposure, it requires highly moist edaphic conditions to avoid water loss in the rhizospheric environment [14]. In montane forest habitats, however, the soil moisture was less sufficient than in peatland or moorland habitats. Hence, it was necessary to receive canopy shading provided by large trees, especially on sharp slopes.
The northern part of Mudanjiang was predicted to have a high canopy area for bog bilberry individuals. This area was also indicated to have a high population density by the machine learning model, and its southern part was predicted to have the lowest canopy density by correlation. These results complemented others found previously and together illustrate that high population density was more likely to occur in forest stands with large tree crowns but moderate to low tree diversities. A similar region with high berry density was also predicted to be distributed in the southern part of the study area in Tonghua of Jilin. The correlation analysis failed to indicate this area due to the low fitting rates of the univariate regressions. Machine learning indicated this region by regressing against multiple independent factors.

4.4. Limitations of the Present Study

The current study has three main limitations. Firstly, the study area could be enlarged by increasing the sampling plots in the northern area up to Great Khingan. This area may also be conditioned by an environment that benefits the medicinal quality of the local bog bilberry. Secondly, our investigation took place prior to the fruiting season; hence, reproduction may modify the shoot morphology that was found in the vegetative growing stage. An earlier time, such as May and June, may have been more suitable for a field investigation. Thirdly, the satellite data used for mapping were in a resolution of 30 m × 30 m, and forest stands were plotted with 20 m × 20 m, which resulted in a 10 m difference. The field plots were set to facilitate an understanding of the size “mu” in Chinese (600 m2) for local populations as reported by forest bureaus (Supplementary Table S2). It has been proven that plot sizes of 20 m and 30 m may not cause significant differences [43], and 30 m plots were also employed in 20 m transects in the Eastern Oregon Agricultural Research Center for rangeland investigations [44]. Even so, we still suggest that future studies employ 30 m plots for field investigations. In addition, further work employing spatial datasets of public land use to target areas of interest for specific land cover types is suggested, as this can eliminate errors caused by self-analyzing data. Finally, although our stands were screened for apparent artificial interruptions, the bog bilberry populations should have also been screened from being disturbed. As bog bilberry has several merits due to its edible quality and high medicinal properties, its populations are frequently subjected to field sampling for sale. This is not banned by local policies, as host forests are not disturbed. Further work should be conducted with a consideration of investigation in natural preserves where understory plants are also free from human disturbance. An enhanced vegetation index can be considered for extracting spatial data in vegetation layers in forests.

5. Conclusions

In this study, a total of 60 plots were investigated to characterize the attributes of bog bilberry populations in the Heilongjiang and Jilin provinces in northeastern China (~41°–49° N). In this area, bog bilberry growth and fresh weight accumulation benefitted from an increase in latitude to the north. The height of bog bilberry shoots was mostly greater in the northeastern stands near the Wusuli River than in southwestern plots on the western slope of the Changbai Mountains. Bog bilberry population density was limited by high tree species diversity, which was assessed using both the Simpson and Shannon indices. Bog bilberry grove density was indicated to be the lowest in Mudanjiang in southern Heilongjiang province (44.3016° N, 129.4558° E). Overall, dense populations of bog bilberry with large individual canopies tended to concentrate in the southern parts of Heilongjiang and the southwestern part of Jilin, where forests were dominated by a few tree species with strong trunks. Eastern Heilongjiang was predicted to be a recommended place for harboring dense populations with heavy fresh-weight productivity. Our methodology and results can be referred to by other studies on the management of bog bilberry plant resources and the investigation and sustainable utilization of NWFP plants.

Supplementary Materials

The following supporting information can be downloaded at https://www.mdpi.com/article/10.3390/f15071252/s1, Table S1: Summary of webpage links for images derived from internet sources in Figure 1. Table S2: Details in questionnaires used in a survey of managers of prefectural forest bureaus in Jilin and Heilongjiang provinces, northeastern China. Figure S1: A nomograph showing the study area divided into 13,625 grids (5 km × 5 km). Figure S2: Comparisons of differences between measured values (black) and predicted values (white) for density, height, canopy area (Canopy), and fresh weight (FW) of Vaccinium uliginosum.

Author Contributions

Conceptualization, Y.D. and C.L.; Methodology, Y.D. and X.W. (Xin Wei); Software, N.W. and D.Z.; Validation, Y.D. and C.L.; Formal Analysis, Y.D.; Investigation, W.Z., Y.Y., X.W. (Xingdong Wang), Y.X., and X.Z.; Resources, Y.D. and C.L.; Data Curation, X.W. (Xin Wei) and N.W.; Writing—Original Draft Preparation, Y.D.; Writing—Review and Editing, C.L.; Visualization, X.W. (Xin Wei) and N.W.; Supervision, Y.D. and C.L.; Project Administration, Y.D. and C.L.; Funding Acquisition, Y.D. and C.L. All authors have read and agreed to the published version of the manuscript.

Funding

This research was funded by the China Agriculture Research System of MOF and MARA (grant number: CARS-29), the Liaoning Provincial Science and Technology Department (Liaoning Province “Reveal the List and Be in Charge” Science and Technology Breakthrough Project) (grant number: 2021JH1/10400036), and the National Key Research and Development Program of China (grant number: 2022YFD1600502-04, 2022YFF1300503).

Data Availability Statement

Data are available upon request due to restrictions in grant policies. All readers can see our funders and grant numbers with our affiliations related to these data limit policies. The data presented in this study are available from the corresponding author upon request because the corresponding author is also the manager of parts of the grants.

Acknowledgments

The workers who took part in the field investigation and provided assistance for computer use are acknowledged.

Conflicts of Interest

The authors declare no conflicts of interest.

References

  1. FAO. Latin American and Caribbean Forestry Commission—33rd Session; LACFC Secretariat; FAO: Rome, Italy, 2023. [Google Scholar]
  2. United Nations. The Sustainable Development Goals Report 2022; United Nations: New York, NY, USA, 2022. [Google Scholar]
  3. Duan, Y.D.; Guo, B.T.; Zhang, L.; Li, J.X.; Li, S.; Zhao, W.B.; Yang, G.; Zhou, S.; Zhou, C.; Song, P.; et al. Interactive climate-soil forces shape the spatial distribution of foliar N:P stoichiometry in Vaccinium uliginosum planted in agroforests of Northeast China. Front. Ecol. Evol. 2022, 10, 1065680. [Google Scholar] [CrossRef]
  4. Piras, F.; Santoro, A. Land use changes in globally important cultural forests. The case of two traditionally managed forests for non-wood forest products (NWFPs) in China and Japan. Biodivers. Conserv. 2023. [Google Scholar] [CrossRef]
  5. Wei, H.X.; Chen, G.S.; Chen, X.; Zhao, H.T. Geographical distribution of Aralia elata characteristics correlated with topography and forest structure in Heilongjiang and Jilin Provinces, Northeast China. J. For. Res. 2021, 32, 1115–1125. [Google Scholar] [CrossRef]
  6. Wei, H.X.; Chen, X.; Chen, G.S.; Zhao, H.T. Foliar nutrient and carbohydrate in Aralia elata can be modified by understory light quality in forests with different structures at Northeast China. Ann. For. Res. 2019, 62, 125–137. [Google Scholar] [CrossRef]
  7. Guo, S.L.; Wei, H.X.; Li, J.P.; Fan, R.F.; Xu, M.Y.; Chen, X.; Wang, Z.Y. Geographical Distribution and Environmental Correlates of Eleutherosides and Isofraxidin in Eleutherococcus senticosus from Natural Populations in Forests at Northeast China. Forests 2019, 10, 872. [Google Scholar] [CrossRef]
  8. Sheppard, J.P.; Chamberlain, J.; Agundez, D.; Bhattacharya, P.; Chirwa, P.W.; Gontcharov, A.; Sagona, W.C.J.; Shen, H.-L.; Tadesse, W.; Mutke, S. Sustainable Forest Management Beyond the Timber-Oriented Status Quo: Transitioning to Co-production of Timber and Non-wood Forest Products-a Global Perspective. Curr. For. Rep. 2020, 6, 26–40. [Google Scholar] [CrossRef]
  9. Spies, T.A.; Long, J.W.; Charnley, S.; Hessburg, P.F.; Marcot, B.G.; Reeves, G.H.; Lesmeister, D.B.; Reilly, M.J.; Cerveny, L.K.; Stine, P.A.; et al. Twenty-five years of the Northwest Forest Plan: What have we learned? Front. Ecol. Environ. 2019, 17, 511–520. [Google Scholar] [CrossRef]
  10. Ghanbari, S.; Vaezin, S.M.H.; Shamekhi, T.; Eastin, I.L.; Lovric, N.; Aghai, M.M. The Economic and Biological Benefits of Non-wood Forest Products to Local Communities in Iran. Econ. Bot. 2020, 74, 59–73. [Google Scholar] [CrossRef]
  11. Qu, H.C.; Xiang, R.; Obsie, E.Y.; Wei, D.W.; Drummond, F. Parameterization and Calibration of Wild Blueberry Machine Learning Models to Predict Fruit-Set in the Northeast China Bog Blueberry Agroecosystem. Agronomy 2021, 11, 1736. [Google Scholar] [CrossRef]
  12. Song, Y.Y.; Song, C.C.; Ren, J.S.; Tan, W.W.; Jin, S.F.; Jiang, L. Influence of nitrogen additions on litter decomposition, nutrient dynamics, and enzymatic activity of two plant species in a peatland in Northeast China. Sci. Total Environ. 2018, 625, 640–646. [Google Scholar] [CrossRef]
  13. Jiang, J.; Wei, J.; Yu, H.; He, S. The Developing Blueberry Industry in China. In The Developing Blueberry Industry in China; IntechOpen: London, UK, 2019. [Google Scholar]
  14. Duan, Y.; Fu, X.; Zhou, X.; Gao, D.; Zhang, L.; Wu, F. Removal of Dominant Species Impairs Nitrogen Utilization in Co-Existing Ledum palustre and Vaccinium uliginosum Communities Subjected to Five-Year Continuous Interruptions. Agronomy 2022, 12, 932. [Google Scholar] [CrossRef]
  15. Li, Q.; Qi, Y.; Wang, Q.; Wang, D. Prediction of the Potential Distribution of Vaccinium uliginosum in China Based on the Maxent Niche Model. Horticulturae 2022, 8, 1202. [Google Scholar] [CrossRef]
  16. Tumaneng-Diete, T.; Ferguson, I.S.; MacLaren, D. Log export restrictions and trade policies in the Philippines: Bane or blessing to sustainable forest management? For. Policy Econ. 2005, 7, 187–198. [Google Scholar] [CrossRef]
  17. Liu, K.; Liang, Y.; He, H.S.; Wang, W.J.; Huang, C.; Zong, S.W.; Wang, L.; Xiao, J.; Du, H. Long-Term Impacts of China’s New Commercial Harvest Exclusion Policy on Ecosystem Services and Biodiversity in the Temperate Forests of Northeast China. Sustainability 2018, 10, 1071. [Google Scholar] [CrossRef]
  18. Zhao, Z.F.; Guo, Y.L.; Zhu, F.X.; Jiang, Y. Prediction of the impact of climate change on fast-growing timber trees in China. For. Ecol. Manag. 2021, 501, 119653. [Google Scholar] [CrossRef]
  19. Geng, Y.D.; Sun, S.B.; Yeo-Chang, Y. Impact of Forest Logging Ban on the Welfare of Local Communities in Northeast China. Forests 2021, 12, 3. [Google Scholar] [CrossRef]
  20. Alldredge, M.W.; Peek, J.M.; Wall, W.A. Shrub community development and annual productivity trends over a 100-year period on an industrial forest of Northern Idaho. For. Ecol. Manag. 2001, 152, 259–273. [Google Scholar] [CrossRef]
  21. Bona, A.; Brzezinski, D.; Jadwiszczak, K.A. Genetic Diversity and Fine-Scale Spatial Genetic Structure of the Endangered Shrub Birch (Betula humilis Schrk.) Populations in Protected and Unprotected Areas. Diversity 2022, 14, 684. [Google Scholar] [CrossRef]
  22. Ouyang, S.; Xiang, W.; Gou, M.; Chen, L.; Lei, P.; Xiao, W.; Deng, X.; Zeng, L.; Li, J.; Zhang, T.; et al. Stability in subtropical forests: The role of tree species diversity, stand structure, environmental and socio-economic conditions. Glob. Ecol. Biogeogr. 2021, 30, 500–513. [Google Scholar] [CrossRef]
  23. Guo, Z.W.; Wang, X.P.; Fan, D.Y. Ecosystem functioning and stability are mainly driven by stand structural attributes and biodiversity, respectively, in a tropical forest in Southwestern China. For. Ecol. Manag. 2021, 481, 118696. [Google Scholar] [CrossRef]
  24. Wang, T.; Dong, L.B.; Liu, Z.G. Stand structure is more important for forest productivity stability than tree, understory plant and soil biota species diversity. Front. For. Glob. Change 2024, 7, 1354508. [Google Scholar] [CrossRef]
  25. Woziwoda, B.; Dyderski, M.K.; Jagodzinski, A.M. Effects of land use change and Quercus rubra introduction on Vaccinium myrtillus performance in Pinus sylvestris forests. For. Ecol. Manag. 2019, 440, 1–11. [Google Scholar] [CrossRef]
  26. Gamfeldt, L.; Snäll, T.; Bagchi, R.; Jonsson, M.; Gustafsson, L.; Kjellander, P.; Ruiz-Jaen, M.C.; Fröberg, M.; Stendahl, J.; Philipson, C.D.; et al. Higher levels of multiple ecosystem services are found in forests with more tree species. Nat. Commun. 2013, 4, 1340. [Google Scholar] [CrossRef]
  27. SAS Institute Inc. SAS/STAT® 14.3 User’s Guide; SAS Institute Inc.: Cary, NC, USA, 2017. [Google Scholar]
  28. Topic, V.; Butorac, L.; Jelic, G.; Peric, S.; Rosavec, R. Biomass of hop hornbeam (Ostrya carpinifolia Scop.) shrub on Velebit. Period. Biol. 2008, 110, 151–156. [Google Scholar]
  29. Dangeti, P. Statistics for Machine Learning; Packt Publishing Ltd.: Birmingham, UK, 2017. [Google Scholar]
  30. Ganglo, J.C. Ecological niche model transferability of the white star apple (Chrysophyllum albidum G. Don) in the context of climate and global changes. Sci. Rep. 2023, 13, 2430. [Google Scholar] [CrossRef]
  31. Wang, X.; Ouyang, S.; Sun, O.J.; Fang, J. Forest biomass patterns across northeast China are strongly shaped by forest height. For. Ecol. Manag. 2013, 293, 149–160. [Google Scholar] [CrossRef]
  32. Dong, L.B.; Wei, H.Y.; Liu, Z.G. Optimizing Forest Spatial Structure with Neighborhood-Based Indices: Four Case Studies from Northeast China. Forests 2020, 11, 413. [Google Scholar] [CrossRef]
  33. Wang, Y.G.; Sun, X.Y.; Li, S.Y.; Wei, B. Lignin and Cellulose Contents in Chinese Red Pine (Pinus tabuliformis Carr.) Plantations Varied in Stand Structure, Soil Property, and Regional Climate. Forests 2024, 15, 240. [Google Scholar] [CrossRef]
  34. NASA EarthData. NASA EarthData. Available online: https://search.earthdata.nasa.gov/search/?ac=true&m=0.0703125!0!2!1!0!0%2C2 (accessed on 3 July 2024).
  35. Onaindia, M.; Dominguez, I.; Albizu, I.; Garbisu, C.; Amezaga, I. Vegetation diversity and vertical structure as indicators of forest disturbance. For. Ecol. Manag. 2004, 195, 341–354. [Google Scholar] [CrossRef]
  36. Sharma, A.; Cory, B.; McKeithen, J.; Frazier, J. Structural diversity of the longleaf pine ecosystem. For. Ecol. Manag. 2020, 462, 117987. [Google Scholar] [CrossRef]
  37. Ha, T.N.; Lubo-Robles, D.; Marfurt, K.J.; Wallet, B.C. An in-depth analysis of logarithmic data transformation and per-class normalization in machine learning: Application to unsupervised classification of a turbidite system in the Canterbury Basin, New Zealand, and supervised classification of salt in the Eugene Island minibasin, Gulf of Mexico. Interpretation 2021, 9, T685–T710. [Google Scholar] [CrossRef]
  38. Branco, P.; Torgo, L.; Ribeiro, R.P. SMOGN: A Pre-processing Approach for Imbalanced Regression. In Proceedings of the First International Workshop on Learning with Imbalanced Domains: Theory and Applications, Skopje, Macedonia, 22 September 2017; pp. 36–50. [Google Scholar]
  39. Kudo, G.; Suzuki, S. Warming effects on growth, production, and vegetation structure of alpine shrubs: A five-year experiment in northern Japan. Oecologia 2003, 135, 280–287. [Google Scholar] [CrossRef] [PubMed]
  40. Jin, Y.S.; Hu, Y.K.; Wang, J.; Liu, D.D.; Lin, Y.H.; Liu, G.; Zhang, Y.H.; Zhou, Z.Q. Diversity of Understory Communities in Boreal Forests: Influences of Forest Type, Latitude, and Spatial Scale. Forests 2019, 10, 1003. [Google Scholar] [CrossRef]
  41. Wang, Y.; Yang, H.B.; Zhong, S.; Liu, X.; Li, T.; Zong, C.W. Variations in Sugar and Organic Acid Content of Fruit Harvested from Different Vaccinium uliginosum Populations in the Changbai Mountains of China. J. Am. Soc. Hortic. Sci. 2019, 144, 420–428. [Google Scholar] [CrossRef]
  42. Woods, C.L.; Cardelús, C.L.; DeWalt, S.J. Microhabitat associations of vascular epiphytes in a wet tropical forest canopy. J. Ecol. 2015, 103, 421–430. [Google Scholar] [CrossRef]
  43. Wang, G.; Gertner, G.; Xiao, X.; Wente, S.; Anderson, A.B. Appropriate plot size and spatial resolution for mapping multiple vegetation types. Photogramm. Eng. Remote Sens. 2001, 67, 575–584. [Google Scholar]
  44. Jones, M.O.; Allred, B.W.; Naugle, D.E.; Maestas, J.D.; Donnelly, P.; Metz, L.J.; Karl, J.; Smith, R.; Bestelmeyer, B.; Boyd, C.; et al. Innovation in rangeland monitoring: Annual, 30 m, plant functional type percent cover maps for U.S. rangelands, 1984–2017. Ecosphere 2018, 9, e02430. [Google Scholar] [CrossRef]
Figure 1. Typical features of bog bilberry (Vaccinium uliginosum L.) groves with fruit formation in wetlands (A), a hardwood forest in Heilongjiang (B), a pine forest in Jilin (C) with vegetative growth among Aline pines (D), and broadleaf forests (E) in central Europe. Images (AC) were photographed by Dr. Yadong Duan among existing populations in forests of northeastern China. Detailed descriptions of the populations are provided in Supplementary Table S1.
Forests 15 01252 g001
Figure 2. Forests in the study area of northeastern China with sampling plots located in prefecture areas.
Forests 15 01252 g002
Figure 3. Spatial distributions of bog bilberry (Vaccinium uliginosum) density (A), height (B), canopy area (C), and fresh weight of aboveground parts (D) in montane forests of northeastern China.
Forests 15 01252 g003
Figure 4. Spatial distributions of host forest stand attributes: tree height (A), diameter at breast height (DBH) (B), stem density (C), crown area (D), crown density (E), Simpson index (F), and Shannon–Wiener index (G).
Forests 15 01252 g004
Figure 5. Changes in bog bilberry (AD) and host forest (EK) variables along a latitudinal gradient across 60 stands in northeastern China. The full lines in orange indicate fit curves with 95% confidence bands indicated by dashed lines with a dark red color and 95% prediction bands in a dark blue color, according to Z statistics. The fit curve models are shown in Table 1.
Forests 15 01252 g005
Figure 6. Changes in bog bilberry (AD) and host forest (EK) variables along a longitudinal gradient across 60 stands in northeastern China. The full lines in orange indicate fit curves with 95% confidence bands indicated by dashed lines in a dark red color and 95% prediction bands in a dark blue color, according to Z statistics. The fit curve models are shown in Table 2.
Forests 15 01252 g006
Figure 7. Indicated regions with critical bog bilberry and tree values predicted using combined latitude and longitude values synthesized from Figure 4 and Figure 5. The crossed lines in dark blue indicate the plot with the lowest bog bilberry density; the crossed lines in purple indicate the plot with the highest tree crown area; the belt in light green indicates a transect with the lowest Simpson index but the highest Shannon index for tree species.
Forests 15 01252 g007
Figure 8. Multivariate linear regression of bog bilberry density (A), bog bilberry height (B), bog bilberry canopy area (C), and bog bilberry fresh weight (D) with respect to stand and forest attributes. Dots indicate parameter estimates in the same rows, and bars mark standard errors. Forest attributes are colored in green, and stand attributes are in gray. CD, crown density; CrownA, crown area; DBH, diameter at breast height; SD, stem density; TreeH, tree height.
Forests 15 01252 g008
Figure 9. Structural equation model estimations of bog bilberry parameters—density (A), height (B), canopy area (C), and fresh weight (D)—with respect to the latent factors of stand attributes, forest structure, and bog bilberry (V. uliginosum) population characteristics. Values framed in boxes indicate magnitudes of effects from a driving factor (start of an arrow) on a dependent variable (end of an arrow). Arrows in red indicate positive effects, and arrows in blue indicate negative effects. CD, crown density; CrownA, crown area; DBH, diameter at breast height; SD, stem density; TreeH, tree height.
Forests 15 01252 g009
Figure 10. Averaged values of feature importance for forest and stand parameters indicated by random forest modeling.
Forests 15 01252 g010
Figure 11. Spatial distributions of the predicted grove density (A), individual height (B), canopy area (C), and fresh weight (FW) (D). Circles in red outline ranges with high predicted values for specific variables. Because the predicted values of height failed to pass the validation, its spatial distribution is not recommended. The typical field performance of populations is shown on the side.
Forests 15 01252 g011
Table 1. Coefficients of the fit curve models for changes in bog bilberry or forest variables along latitudinal gradients in 60 stands in northeastern China.
Dependent VariablesFit Curve ModelR2pbay0
Bog bilberry
DensityPolynomial quadratic 10.35090.0133−12.750.14282.85
HeightLinear 20.21260.0039-0.05−1.61
Canopy areaLinear0.3505<0.0001-0.09−3.52
Fresh weightLinear0.34520.0203-0.05−1.88
Tree
HeightLinear0.08200.0002-−0.2721.25
DBHLinear0.14080.0002-−1.4179.37
Crown areaPolynomial quadratic0.35260.0134156.49−1.74−3488.23
Simpson indexPolynomial quadratic0.28130.0001−4.140.0593.40
Shannon indexPolynomial quadratic0.26550.00027.10−0.08−158.63
1 Polynomial quadratic model: f = ax2 + bx + y0; 2 linear model: f = ax + y0.
Table 2. Coefficients in the fit curve models for changes in bog bilberry or forest variables along longitudinal gradients in 60 stands in northeastern China.
Dependent VariablesFit Curve ModelR2pbay0
Bog bilberry
DensityPolynomial quadratic 10.32040.0133−23.460.091518.87
HeightLinear 20.30400.0359-0.03−3.86
Tree
HeightLinear0.24100.0182-−0.2541.10
DBHLinear0.40560.0006-−1.64227.76
Crown areaPolynomial quadratic0.40690.0024346.52−1.33−22,475.46
Crown densityLinear0.21210.0419-−1.82295.02
1 Polynomial quadratic model: f = ax2 + bx + y0; 2 linear model: f = ax + y0.
Table 3. Modeling performance by the random forest algorithm for regressing bog bilberry variables.
Berry VariablesRMSE 1MSE 2MAE 3R2 4
Density0.0453220.0020540.023210.585016
Height0.0145390.0002110.0079610.730527
Canopy0.0129550.0001680.0069670.786526
Fresh weight0.0173530.0003010.0072020.636299
1 RMSE, root mean squared error; 2 MSE, mean square error; 3 MAE, mean absolute error; 4 R2, determinant coefficient.
Disclaimer/Publisher’s Note: The statements, opinions and data contained in all publications are solely those of the individual author(s) and contributor(s) and not of MDPI and/or the editor(s). MDPI and/or the editor(s) disclaim responsibility for any injury to people or property resulting from any ideas, methods, instructions or products referred to in the content.

