Article

Variation in Niche and Interspecific Associations across Elevations in Subtropical Forest Communities of the Wuyi Mountains, Southeastern China

1
College of Forestry, Fujian Agriculture and Forestry University, Fuzhou 350002, China
2
College of Transportation and Civil Engineering, Fujian Agriculture and Forestry University, Fuzhou 350002, China
3
College of Life Sciences, Zhejiang Normal University, Jinhua 321004, China
4
College of Ecology and Resources Engineering, Wuyi University, Nanping 354300, China
*
Authors to whom correspondence should be addressed.
Forests 2024, 15(7), 1256; https://doi.org/10.3390/f15071256
Submission received: 26 May 2024 / Revised: 11 July 2024 / Accepted: 17 July 2024 / Published: 19 July 2024

Abstract

:
Elucidating changes in the structure and function of plant communities along different elevation ranges will help researchers to analyze the strategies plant communities use in environments and processes influencing niche differentiation. The aims of this paper are to reveal the underlying mechanisms and ecological processes governing the development of subtropical forest ecosystem plant communities. This paper analyzes the forest vegetation of the Wuyi Mountains across the following three elevation ranges: low elevation, mid elevation, and high elevation, spanning from 560 to 2150 m. Twenty and twenty-three dominant tree and shrub layer species, respectively, were identified based on their importance values, and their niches and species associations were further analyzed based on the elevation range. The results showed interspecific associations between tree and shrub species, with the strongest associations observed at mid-elevations. The analysis of niche width and overlap showed that the number of pairs of species with a higher degree of niche overlap decreased with increasing elevation, suggesting that resource use varied at different elevations for both tree and shrub layer species, which may be related to the adaptive capacity of plants at different elevations to the environment and resource use strategies. These findings should contribute to a deeper understanding of the ecological functioning and structural framework of plant communities on Wuyi Mountain.

1. Introduction

During forest community assembly, different plant species show various kinds of interdependence and associations; their abundance and diversity change significantly over time and space. These changes affect the stability of forest ecosystems [1,2,3]. The niche of a species reflects its ability to use environmental resources and interact with other species [4]. Niche is therefore an important driver of species coexistence and assembly change in plant communities [5]. Interspecific association provides a static description of the interrelationships between the species that make up a plant community over a certain period of time and represents a qualitative association based on binary data that tests whether two species are related. The convergence of species to the environment and their interaction during community assembly frequently give rise to interspecific associations. This statement suggests that these entities play a crucial role not only in the establishment and progression of a community but also in demarcating the said community and describing how different species interact with each other [6]. Research on plant niches and interspecific associations can aid in identifying associations between plant species, predicting population changes, and revealing mechanisms of plant substitution during community assembly. This research holds valuable theoretical and practical applications, including applications related to vegetation recovery and restoration, environmental and biodiversity conservation, preventing the creation of degraded ecosystems and managing those that are created, and the implementation of related policies and regulations.
Various environmental factors play crucial roles in shaping plant niches and interspecific associations [7,8]. For example, in the Amazon region, species niche breadth increases proportionally with their niche position across different soil nutrient gradients [9]. Demographic trade-offs may emerge along edaphic gradients and consequently aid in species sorting among soil-related habitats in Bornean rainforests [10]. Additionally, soil nutrients and water quality exert a significant impact on interspecies associations among mangroves in East Lampung, Indonesia [11]. These studies illustrate that niches and associations between species undergo changes along environmental ranges. In mountainous ecosystems, environmental factors such as vegetation, climate, and soil undergo significant changes with increasing elevation, presenting an ideal platform for investigating the distribution patterns of biodiversity along elevation ranges and their responses to changes in the environment [12,13]. By examining the alterations in plant ecological niches and interspecific associations across elevation ranges, we can gain insights into the mechanisms by which species distributions and community assemblages respond to environmental changes. This, in turn, allows us to develop more effective conservation and management strategies [14].
Subtropical mountain forests boast rich plant diversity [15], which contributes to the formation of several global biodiversity hotspots [16]. These areas are ideal for studying biodiversity patterns and the biotic and abiotic drivers of community assembly [17]. Current research has examined how some subtropical plant communities respond to environmental ranges, but the underlying mechanisms and theories remain controversial. Kröber [18] highlighted a stronger correlation between the environment and species in Chinese subtropical forests than between the species themselves. Pei [19] also asserted that niches play a significant role in plant community aggregation across different habitats within the subtropical region. However, Umaña [20] found that some growth-related traits, such as leaf area or wood density, exhibited minimal variation along elevation ranges in the subtropics. This finding may suggest that niches and interspecific associations of certain central subtropical plants do not change significantly with elevation. Nonetheless, further exploration and research are necessary to gain a better understanding of how plant communities change with elevation in a subtropical region.
The Wuyi Mountains preserved relatively complete primitive forests [21]. This forest ecosystem exhibits extensive plant stratification, with the dominant species at each level being prominent and changing significantly with an increase in elevation. This type of environment can be studied to effectively characterize the response of plants to environmental factors, including hydrothermal gradients. Additionally, the mountains offer a suitable location to investigate plant communities and conduct related research in the vertical zone spectrum of the middle subtropic region [22]. This setting provides a natural site to analyze the vertical zonation spectrum of plant communities in a typical central subtropical region. Currently, there is extensive research on vegetation productivity [23,24,25], forest stoichiometry characteristics [26,27,28], soil microbial community structure [29], and plant economic spectrum [30] across different elevations in the Wuyi Mountains. Nevertheless, studies on interspecific associations within plant communities and their responses to environmental changes along different elevation ranges are relatively scarce.
The present study involved conducting a species survey of the forest ecosystem on Wuyi Mountain, which was originally a natural reserve area. The interspecific associations and niches of tree and shrub layer plants at various elevation ranges were analyzed. This study aimed to answer the following questions: (1) What are the characteristics of niches and interspecific associations in plant communities on Wuyi Mountain at different elevations? (2) How do changes in niches and interspecific associations in this region respond to ecosystem responses to environmental change? The final objective of this study is to establish a preliminary understanding of the intricate associations between ecosystems and the environment. The insights obtained will provide a solid research foundation for the development of scientifically informed conservation strategies for Wuyi Mountain.

2. Materials and Methods
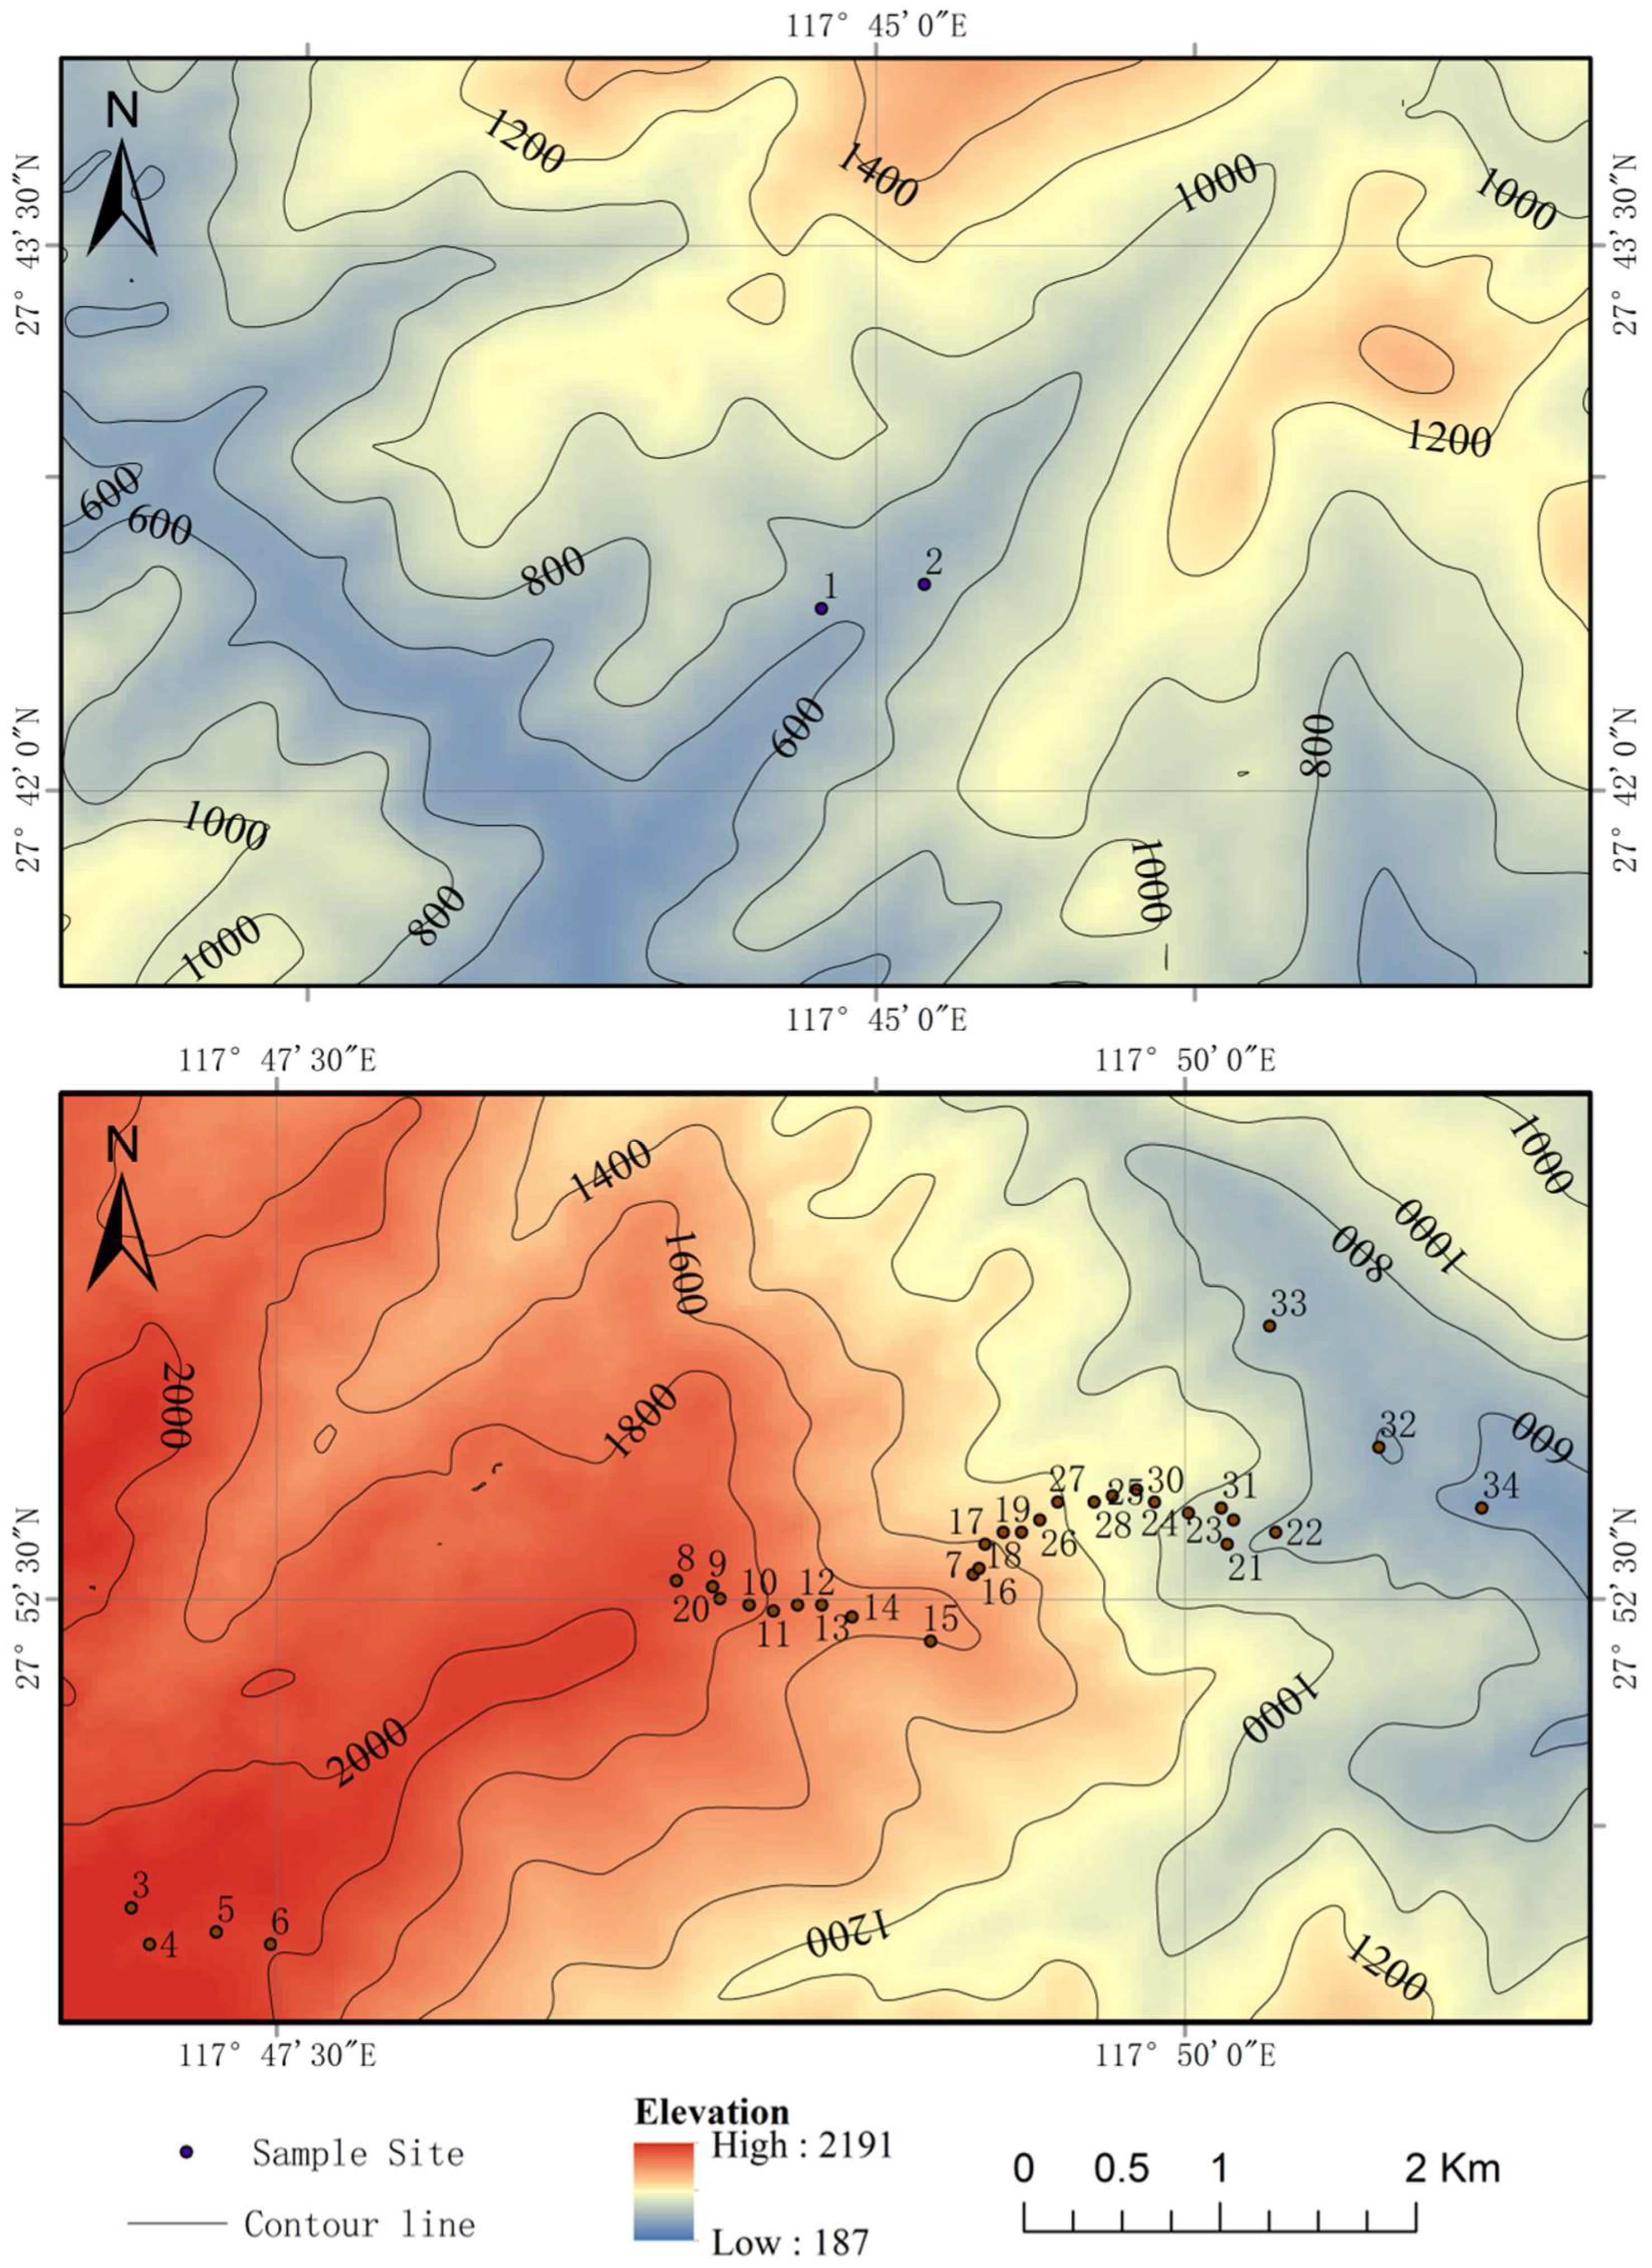
2.1. The Study Area

The Wuyi Mountain National Nature Reserve is located in northwestern Fujian Province at 27°33′ N–27°54′ N, 117°27′ E–117°51′ E. The reserve covers a total area of 100,000 hectares, making it the largest and most complete subtropical primary forest ecosystem within the subtropical latitude zone globally. The region features abundant natural resources and is a crucial area for global biodiversity conservation [31]. The typical subtropical monsoon climate includes abundant rainfall, reaching up to 2152 mm annually. The annual average evaporation is 998 mm, while the relative humidity ranges from 78% to 84%. The temperature ranges from −15 °C to 18 °C. The frost-free period lasts 252–257 days per year. Additionally, the Huanggang Mountain, the highest peak in the area, is not only the main peak of the Wuyi Mountain range but is also the highest peak in Southeastern China, with a vertical increase in elevation of 450–2158 m above mean sea level. The southeast slope is relatively gentle, while the northwest slope is steep. The evergreen broad-leaved forest in the area is rich in plant species, with notable dominant species. The differences in the dominance of the dominant species in different parts of this region are significant, while the distribution of the vertical vegetation belt spectrum is complete. The primary forest types along the elevation range from low to high elevation are evergreen broad-leaved forest, coniferous forest, and subalpine dwarf forest. The main dominant tree species include Castanopsis carlesii (Hemsl.) Hayata., Quercus glauca Thunb., Pinus massoniana Lamb., Cunninghamia lanceolata (Lamb.) Hook., Pinus taiwanensis Hayata, and Taxus wallichiana var. mairei (Lemée and H. Lév.) L. K. Fu and Nan Li, which are warm or temperate tree species [32,33].

2.2. Plot Establishment and Data Collection

From May to August 2015, 34 plots measuring 20 m × 30 m each were established in the Wuyi Mountain range and were located at elevations ranging from 560 m to 2150 m in areas where the forest structure was intact (Figure 1). The vertical spacing between plots ranged from 20 to 100 m (mostly 50 m). In addition, five 2 m × 2 m shrub layer subplots were established at the center and corners of each plot. A total of 34 quadrats in the tree layer (20 m × 30 m) and 170 quadrats in the shrub layer (2 m × 2 m) were established. The selected data included species name, number of individuals in a plot, coverage, diameter at breast height, tree height, crown height, crown width, and base diameter. The woody plants with a diameter at breast height (DBH) less than or equal to 5 cm at 1.3 m in the shrub sample plots were identified as shrub layer plants, and the woody plants with a DBH greater than 5 cm were identified as tree layer plants [34,35]. The shrub layer characteristics that were recorded included species name, number of individuals in a plot, coverage, height, crown width, and basal diameter (cluster diameter). Moreover, the geographical coordinates, elevation, slope, aspect, forest type, and other environmental characteristics of each plot were recorded. Sample plots 3 and 4 were part of a subalpine meadow that consisted of shrubs and had no trees.
In this study, a total of 206 tree species from 103 genera and 56 families were surveyed. Dominant families in the tree layer included Theaceae, Fagaceae, and Lauraceae. Additionally, 163 shrub species from 92 genera and 49 families were surveyed, with the dominant families being Theaceae, Rosaceae, and Ericaceae. Among these, 20 tree species and 23 shrub species had importance values exceeding 1%. The combined importance values of these 20 tree species and 23 shrub species accounted for 81.07% and 53.81% of the total importance values in the tree and shrub layers, respectively. Consequently, these species were selected for subsequent niche and association analysis; the survey results are presented in Table 1.
The plots were classified into three types (Table 2) using multiple regression trees, with elevation as independent variables and the species and quantity of trees and shrubs within each quadrate as dependent variables [36,37,38]. These plots were divided into three elevation ranges, and they were named H1 (low-elevation range), H2 (medium-elevation range), and H3 (high-elevation range). The 10 H1 plots were located in low-elevation habitats, each featuring evergreen broad-leaved forests. The 10 H2 plots at the middle elevation had broad-leaved mixed forests, whereas the 14 H3 plots were located at high elevations with coniferous forests.

2.3. Data Analysis

2.3.1. Calculation of Importance Values

The main species of each plot were determined according to the species importance values, as follows [39]:
I V = R a + R f + R d 3
R a = a i i = 1 s a i ,   R f = f i i = 1 s f i ,   R d = d i i = 1 s d i ,
where I V , R a , R f , and R d represent the importance value, relative density, relative frequency, and relative dominance of a specific species, respectively. a i is the number of individuals in population i, f i is the number of quadrats in which the population i appears, d i is the basal area at the height of 1.3 m of population i, and S is the total number of species.

2.3.2. Determination of Interspecific Association

The quantitative study of interspecific associations originated from the pioneering of the discipline of probability theory and mathematical statistics at the beginning of the 20th century. Different calculation methods were proposed successively, but all of them used the 2 × 2 association table (Table 3) to calculate the occurrence of species in a specific plot [40]. The association coefficient (AC) was used as the basis for the χ2 statistic to determine interspecific associations [41,42].
First, the overall connectivity of tree and shrub species within the plant community of each plot in both the tree and shrub layers was tested based on the variance ratio (VR). The significance of VR was assessed using the W statistic test, as follows:
P i = n i / N
δ T 2 = i = 1 s P i 1 P i ,   S T 2 = 1 N j = 1 N ( T j t ) 2 ,  
V R = S T 2 / δ T 2 ,   W = N × V R
where VR represents the overall species association, N is the total number of sample plots, T j is the number of species in a specific plot j, t is the average species count per plot, S is the total species count, and P i is the number of plots where species i is present. Under the null hypothesis of independence (VR = 1), all species are considered unrelated. Therefore, VR > 1 indicates a positive association, while VR < 1 indicates a negative association. In addition, W represents the W statistic, VR is the total species association number, and N is the total number of sample plots. If χ 0.95 ( N ) 2 < W < χ 0.05 ( N ) 2 , this indicates that the overall species association is insignificant (p > 0.05). Otherwise, it signifies a significant association (p < 0.05) [43].
A χ2 test was used to determine whether any two species were related. Since the sampling method was non-continuous and the original data consisted of binary values indicating the presence or absence of events, the χ2 value for non-continuous data was calculated using Yates’ correction formula, as follows [44]:
χ 2 = ( | a d b c | 0.5 n ) 2 n ( a + b ) ( a + c ) ( b + d ) ( c + d )
where n is the number of sampling species. When χ2 < 3.841, the interspecific association is independent; when χ2 > 6.635, a significant ecological association exists between any two species; and when 3.841 < χ2 < 6.635, there is a certain ecological association between species. Table 3 presents the measurements of the interspecific associations between any two species A and B. In that table, a represents the number of sample plots in which the paired species co-occur, d represents the number of sample plots in which neither of the paired species occurs, and b and c represent the number of sample plots in which species B and A occur, respectively. The sum of a, b, c, and d equals the total number of sample plots. When ad > bc, then the interspecific association is a positive connection, and if ad < bc, it is a negative connection. If χ2 > 3.841 (0.01 < p < 0.05), this means that a strong interspecific association exists, and if χ2 > 6.635 (p < 0.01), this indicates that an extremely significant interspecific association exists [44].
Following qualitative interspecific associativity using the χ2 test, AC is commonly used to further determine the degree of associativity of species pairs [45,46], which are calculated as follows:
If adbc, then AC = (ad − bc)/(a + b)(b + d)]
If bc > ad and da, then AC = (ad − bc)/(a + b)(a + c)]
If bc < ad and d < a, then AC = (ad − bc)/(b + d)(d + c)]
where the range of values for AC is [−1, 1]. The closer the value of AC is to 1, the greater the positive connection between any two species is. Conversely, the closer the AC value is to −1, the stronger the negative association between any two species is. When the value of AC is 0, the species are entirely independent [47,48].

2.3.3. Calculation of Niche Width and Niche Overlap

The niche width of tree and shrub species in the sample plots was calculated using the Levins’ index, as follows [49]:
B i = 1 j = 1 r P i j 2
where B i represents the niche width value of species i, which falls within the range of [0–1], with larger values indicating a broader niche for the species; P i j 2 represents the proportion of the ith species’ resource use relative to all resources of type j, and r represents the number of resource types, i.e., the total number of sample plots.
The niche overlap values of tree and shrub species in the sample plots were calculated using the niche overlap index, as follows [50]:
O i k = j = 1 r P i j P k j j = 1 r P i j 2 j = 1 r P k j 2
where O i k is the niche overlap index between species i and k; and P i j and P k j are the proportion of resources j used by species i or k, respectively.
In this study, niche and interspecific associations were computed using the “spaa” and “corrplot” packages in R 4.3.1. The plots were generated using R 4.3.1 and OriginPro 2024 [51].

3. Results

3.1. Variations in Interspecific Associations with the Elevation Gradient

The overall interspecific associations between the tree and shrub layers within the Wuyi Mountains are detailed in Table 4. Most plot communities exhibited VR values greater than 1.00, with the exception of the shrub layer community in the H3 plot. The tree and shrub layers in H1 showed significant positive associations, as did the shrub layer in H2 and the tree layer in H3. Meanwhile, the tree layer in H2 showed an insignificant positive association, and the shrub layer in H3 exhibited an insignificant negative association.
The results of the Chi-squared and the W tests are in agreement, indicating a lack of significant associations among the majority of species. In the tree layer, the locations of the prevalence of species pairs exhibiting significant associations could be ranked as follows: high-elevation > low-elevation > mid-elevation ranges. In contrast, the proportion of species pairs showing a significant association declined with increasing elevation within the shrub layer. The peaks of species pairs exhibiting highly significant associations in both the tree and shrub layers occurred in the high-elevation range at 16% and 4%, respectively.
The interspecific associations between the tree and shrub species in each plot indicated by the AC values (Figure 2) showed that overall, more species pairs in the tree layer exhibited positive associations than negative associations. The proportion of species pairs in the tree layer exhibiting significant positive associations at all three elevations was relatively high. In the mid-elevation range, the proportions of species pairs with both significant positive and negative associations in the tree layer were the highest, accounting for 35.71% and 33.77% of the total species pairs at that elevation, respectively. However, the proportions of species pairs with significant positive and negative associations in the shrub layer increased as the elevation rose.

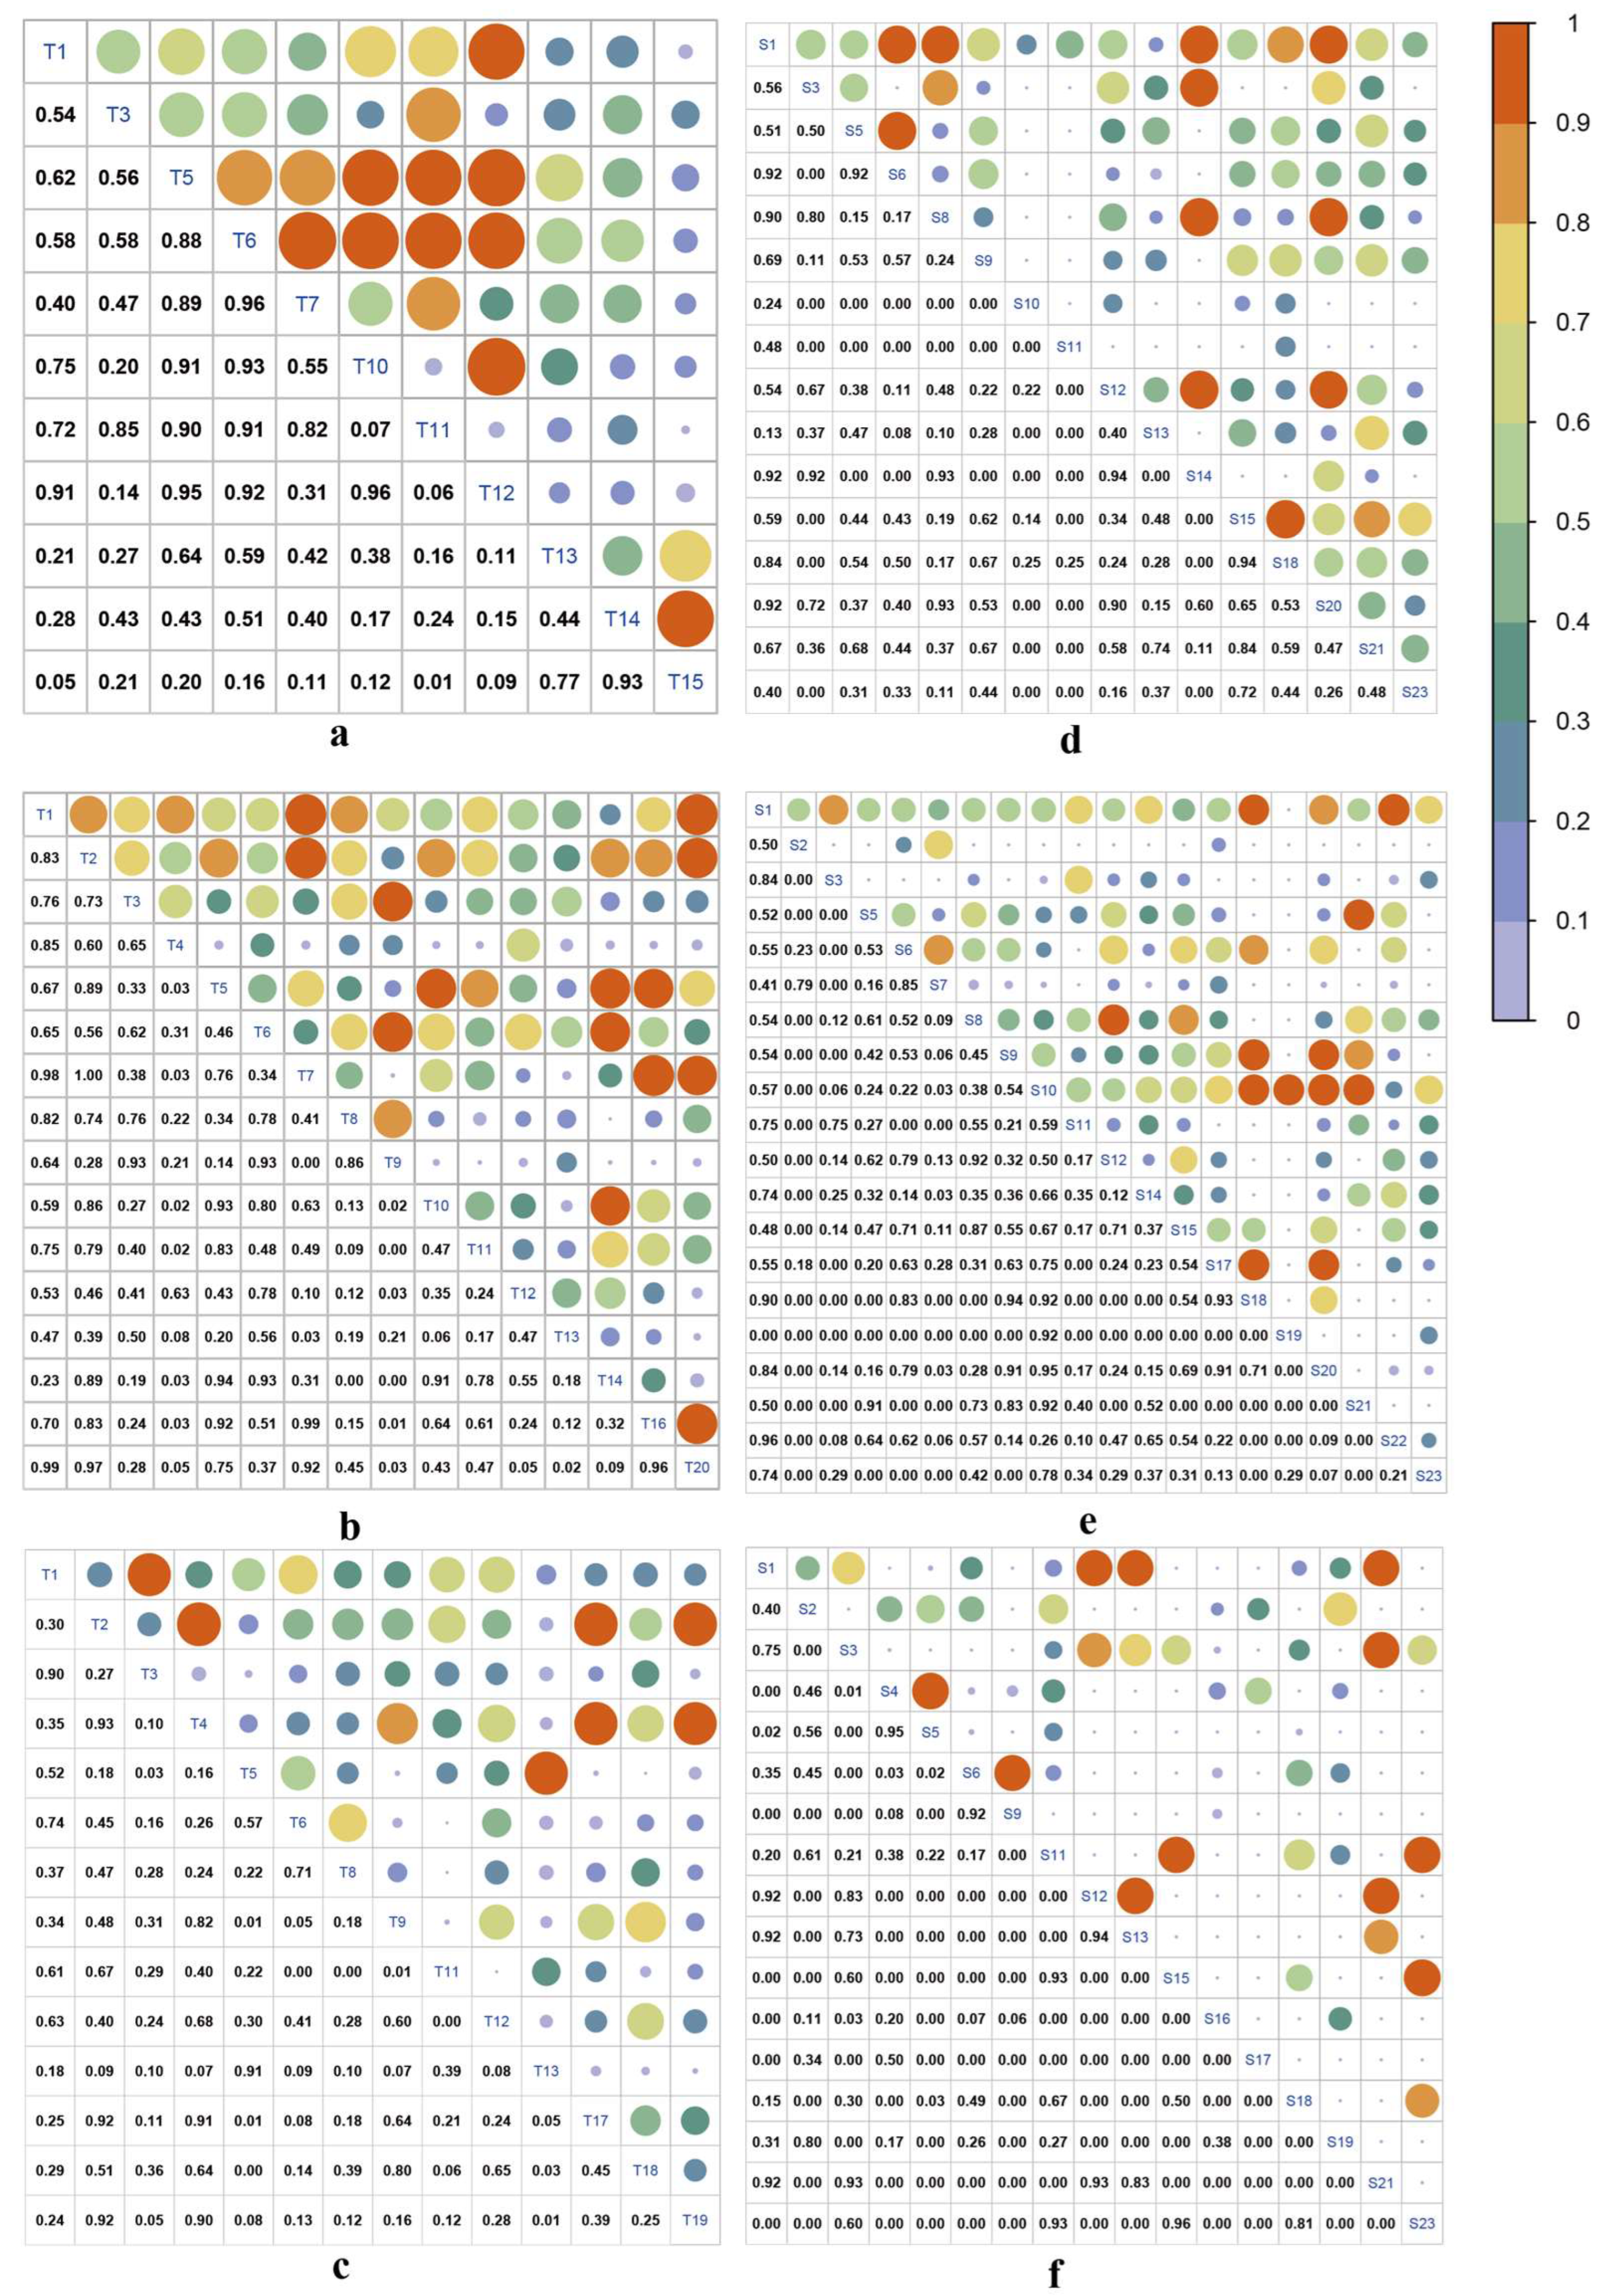
3.2. Niche Width Analysis

The niche width of various species calculated using the Levins’s index (Figure 3) showed that tree species with relatively larger niche widths included the following: in the low-elevation range, Castanopsis eyrei, Quercus glauca, Vaccinium sprengelii, and Rhododendron ovatum; in the mid-elevation range, Rhododendron latoucheae, Pinus taiwanensis, Vaccinium sprengelii, and Schima superba; at high-elevation range, Pinus taiwanensis, Enkianthus quinqueflorus, Rhododendron latoucheae, and Quercus multinervis. Detailed data are shown in Appendix A.
Among shrub species, those with larger niche widths included the following: in the low-elevation range, Itea omeiensis, Rhododendron ovatum, Begonia acetosella, and Laurocerasus spinulosa; in the mid-elevation range, Vaccinium sprengelii, Begonia acetosella, Rhododendron simiarum, and Rhododendron tsoi; in the high-elevation range, Enkianthus quinqueflorus, Litsea cubeba, Stranvaesia davidiana, and Vaccinium japonicum.
In general, the width of the niche of the Ericaceae was the broadest in both the tree and shrub layers. The Fagaceae demonstrated greater dominance in the tree layer at lower elevations, while the Pinaceae and Ericaceae gradually increased their dominance as the elevation increased. Within the shrub layer, species composition was more complex at lower elevations, with larger niche widths for several families, while Ericaceae species had particularly complex species composition at middle and high elevations.
The niche overlap index analysis (Figure 4) showed that in the tree layer, the niche overlap values of Rhododendron ovatum and Vaccinium sprengelii with several dominant species at low elevations reached 0.9, which may suggest intense competition with other species. In the mid-elevation range, Rhododendron latoucheae and Pinus taiwanensis, as well as in the high-elevation range, Pinus taiwanensis and Enkianthus quinqueflorus, exhibited higher overlap values with other dominant species.
In the shrub layer, Begonia acetosella competes with most other dominant species at both low and mid elevations. In the high-elevation range, most shrub layer-dominant species show lower niche overlap values with each other, suggesting less intense competition among shrub species in high-elevation ranges.

4. Discussion

4.1. Regulation Mechanisms of Interspecific Associations Along Environmental Ranges

Interspecific associations are an important part of the structural and quantitative characteristics of a community [52]. Studying plant interspecific associations allows researchers to understand the interactions between different species and the way various plants adapt to the environment [53]. The results of the present study show that the number of significantly positively correlated species pairs among dominant species in tree layers at all three different elevations exceeded that of negatively correlated species pairs. However, most dominant species lacked associations with each other. Consistent findings were obtained in some previous studies, as follows: Jin [53] found that interspecific associations among plants were not apparent in the region of the Taihang Mountains. In comparison to the low-elevation range, the number of species pairs exhibiting positive or negative associations decreased at middle and high-elevation ranges. Dai [54] observed that interspecific associations among different tree species at varying elevations in the forest-grassland ecotone were not significant. They pointed out that there was no evidence of exclusion caused by interspecific competition within the local plant community. Nguyen [55] also suggested that the association patterns among dominant tree species were largely independent. This indicates that the tree communities at different elevations in the Wuyi Mountains are in relatively stable successional stages, with community structures approaching completeness, yet maintaining certain mutualistic associations [2].
The total number of negative connectivity pairs among dominant species in the shrub layer surpassed that of positive connectivity pairs in the present study. Additionally, as the elevation increased, the proportion of shrub species pairs exhibiting significantly positive and negative associations gradually increased. This trend may be caused by the influence of tree layer plants on shrub layer plants. The competition for resources between the shrub and tree layer plants was asymmetric, with the tree layer exerting pressure on the understory through factors such as sunlight, rainfall, and soil nutrients, which ultimately led to a reduction in competitive traits in the understory [45]. Our study observed a decrease in the number of tall broadleaf trees and an increase in the number of coniferous trees at medium elevations, while tall trees were sparser at high elevations than at low elevations. This indicates a reduction in competitive pressures from middle- to high-elevation tree layers, thereby enabling shrub layer plants to gain access to a greater abundance of resources, such as sunlight and rainfall. This could intensify competition between species in the shrub layer, resulting in more species pairs showing negative associations.
Compared to low- and high-elevation sites, the mid-elevation range stands out due to its more pronounced characteristics. In this zone, a higher proportion of species pairs was observed that show significant positive and negative associations among tree layer plant communities than at other elevations. Additionally, both tree and shrub layer species richness and diversity peaked in the mid-elevation range. These findings align with previous research; for instance, in the southern part of the Taihang Mountains [2], at lower and higher elevations, both tree and shrub layer species richness and diversity exhibited an overall non-significant negative interspecific association, while at moderate elevations, this type of species richness and diversity demonstrated a non-significant positive association. According to Tetemke [56] and Bruun [57], the association between species richness and elevation does not follow a linear pattern but rather peaks at moderate elevations. One possible explanation for the coexistence of a higher number of species at the mid-elevation is the greater availability of resources [58,59]. High-elevation ranges are distinguished by a number of factors that are generally considered to be unsuitable for plant growth. These include low temperatures, short growing seasons, unstable substrates, intense radiation, and strong winds [60]. Consequently, in alpine habitats with more extreme environments, plant communities are highly susceptible to any environmental changes, rendering this environment one of the least suitable habitats for plant growth and development [61]. Conversely, lower elevation ranges are characterized by warmer and moister conditions, which are conducive to plant survival. However, these ranges are dominated by species such as Quercus glauca and Castanopsis eyrei, which exert strong limitations on the growth of other species [57]. This results in lower species richness and interspecific associations compared to middle elevation ranges. This phenomenon is reflected by the indicators of species diversity and higher biodiversity in the mid-elevation range, which point to a more stable and balanced community structure in the range [62]. Different species maximize resource use through niche differentiation [63,64], leading to stronger overall interspecific associations in the community [65].

4.2. Response of Niche Overlap to Environmental Ranges

Niche width primarily reflects the extent to which species use resources, with a broader niche indicating a higher degree of resource use [66,67]. It is generally believed that plants capable of using a variety of resources have a greater likelihood of surviving across different environmental gradients and coexisting with a greater number of species [68]. The results showed that several dominant species consistently exhibited wide niches at various elevations within the study sites. Examples include Rhododendron latoucheae, Vaccinium sprengelii, Schima superba, and Rhododendron ovatum in the tree layer, as well as Begonia acetosella, Tauntonia obovatifoliolata, Itea omeiensis, and Rhododendron simsii in the shrub layer. These plants were well-suited for growth in environments with moderate sunlight exposure while avoiding direct sunlight. Consequently, they could effectively use spatial resources beneath the canopy of evergreen broad-leaved forests or mixed needle-leaf and broad-leaved forests. Moreover, their smaller size resulted in lower competition pressure from neighboring species, allowing them to coexist with numerous species while possessing strong habitat utilization capabilities [69]. This may explain their broader niche width at different elevations. Additionally, it is noteworthy that the niche width of the most dominant species within the study sites peaked at mid-elevation (11 tree species and 12 shrub species), confirming the previous idea that mid-elevation sites can accommodate more species.
Niche overlap serves as a reflection of the similarity in resource use and the degree of spatial position occupancy among different populations [70]. A higher degree of niche overlap indicates a greater similarity in the use of natural resources among species, potentially leading to more intense interspecific competition [71]. As the elevation increases, the proportion of species pairs in the Wuyi Mountain study sites in both the tree and shrub layers, with niche overlap values greater than 0.5, gradually decreases. This reduction was particularly pronounced in the high-elevation ranges, indicating significant differences in the environmental resource requirements among species at higher elevations compared to mid and low elevations.
Previous studies have suggested that the effects of competitive actions are diminished at high elevations or in harsh environments [72]. However, recent experimental results have challenged this perspective, indicating that competition still plays a crucial role in species coexistence in high-elevation environments [73]. The present study showed that tree layer plants with broader niche widths at various elevations generally exhibited varying degrees of niche overlap with the majority of dominant species in that range. Moreover, noticeable changes in niche overlap values were observed between the same species pairs as elevation increased, which aligns with their adaptability to diverse environments. Simultaneously, the divergent trends in the changes in niche overlap values among different species pairs imply that competition plays a role in the development of plant communities at different elevations.
It is important to note that niche width is not necessarily correlated with niche overlap. This is a result of the spatial heterogeneity of resources used by different species and their varying abilities to use them. Even species with narrow niche widths may exhibit a high level of niche overlap [74]. Our results support this viewpoint, as we observed instances of high niche overlap among species with narrow niche widths at various elevations. Species with narrow niches may share similar resource and habitat requirements, potentially leading to intense competition.

4.3. Relationship between Niche Overlap and Interspecific Associations

Interspecific associations and the degree of niche overlap are also related [75]. Species with significantly positive associations usually have similar environmental and resource requirements, leading to a relatively high degree of niche overlap values [76]. The present study suggested that most species pairs in the study sites exhibited similar trends in their interspecific associations and niche overlap values even though the elevational changed. However, not all species pairs showed a correlation between interspecific associations and the degree of niche overlap. Some species pairs in the study sites had a high degree of niche overlap values but weak interspecific associations, while others species pairs exhibited significant interspecific associations without niche overlap. This discrepancy may be related to the scale of this study. Zhang [77] discovered that the relationship between interspecific associations and the degree of niche overlap changed in the central Da Hinggan Mountains as the research scale increased. Wang [62] also observed that as the research scale increased, the niche overlap in the Bayinbuluke alpine meadow did not entirely reflect interspecific associations. Previous studies have shown that individual trees can only influence other plants within a certain range. If the distance between individual trees and other plant species exceeds that range, the influence of trees on other plants will be greatly reduced [78,79]. The size of the Wuyi Mountain site may have exceeded the range of influence of some plants. Although some species pairs existed in multiple sites simultaneously, they did not have significant interactions with each other. Therefore, their niche overlap values and interspecific association trends were not the same.

5. Conclusions

Based on the plant communities in the Wuyi Mountains, this study explores interspecies associations and niches among dominant species in the tree and shrub layers across three elevation ranges. The results indicate that at different elevation ranges, the number of significantly positively correlated dominant species pairs is higher in the tree layer than in negatively correlated pairs. In contrast, the opposite trend is observed in the shrub layer. With increasing elevation, the proportion of significantly negatively correlated species pairs in the shrub layer gradually increases, suggesting that elevation influences interspecies associations. Additionally, the niche overlap between the tree and shrub layers decreases with elevation, with significantly lower overlap at higher elevation ranges compared to mid- to low-elevation ranges. These findings indicate significant differences in resource requirements between species at higher and mid- to low-elevation ranges. Species that demonstrate significant positive associations typically exhibit higher ecological niche overlap. However, some species with high niche overlap display weaker interspecies associations and vice versa. This may be scale-dependent and suggests limitations in the extent of plant influence on other species.
The observed variability and occasional opposition in niche width responses across vertical layers (tree and shrub) underscore the complexity of ecological interactions within subtropical mountainous regions. These contrasting dynamics reflect differential resource utilization strategies and competitive pressures within these distinct vegetation strata. These insights suggest that the mechanisms governing species coexistence and community assembly in subtropical forests are multifaceted and influenced by elevation-driven environmental ranges. The findings not only contribute to a deeper understanding of Wuyi Mountain ecological processes but also offer valuable implications for broader applications in ecological conservation and management of subtropical mountainous regions worldwide.

Author Contributions

Conceptualization, J.H. and J.N.; methodology, J.H. and X.W.; validation, X.H. and J.L.; data curation, J.H. and Z.Z.; writing—original draft preparation, J.H.; writing—review and editing, J.L., J.N. and C.W.; supervision, J.L., Y.L. and J.N. All authors have read and agreed to the published version of the manuscript.

Funding

This research was funded by the National Natural Science Foundation of China (42071132).

Data Availability Statement

Data will be made available on request.

Acknowledgments

We wish to express our thanks for the support received from Wuyi Mountain National Nature Reserve in the construction of the plots, as well as in the sample collection.

Conflicts of Interest

The authors declare that the research was conducted in the absence of any commercial or financial relationships that could be construed as a potential conflict of interest.

Appendix A

Table A1. Levins’s niche width of dominant plant species in tree and shrub layers at three elevation ranges. A niche width of 0 means that the species does not occur at that elevation.
SpeciesNo.H1H2H3
Rhododendron latoucheae Franch.T12.457.564.43
Pinus taiwanensis HayataT207.336.12
Schima superba Gardner and Champ.T33.125.992.56
Enkianthus quinqueflorus Lour.T402.145.27
Rhododendron ovatum (Lindl.) Planch. ex Maxim.T54.214.51.98
Vaccinium sprengelii (G. Don) SleumerT64.846.441.89
Adinandra millettii (Hook. and Arn.) Benth. and Hook. f. ex HanceT73.293.320
Rhododendron taronense Hutch.T803.872.24
Rhododendron basilicum Balf. f. and W. W. Sm.T902.22.83
Rhododendron farrerae SweetT101.982.250
Eurya muricata DunnT111.873.432.27
Quercus multinervis (W. C. Cheng and T. Hong) J. Q. LiT121.352.873.52
Quercus glauca Thunb.T135.082.861.54
Castanopsis eyrei (Champ. ex Benth.) TutcherT146.621.580
Engelhardia roxburghiana Wall.T152.7800
Acer rubrum L.T1602.560
Tsuga chinensis (Franch.) E. Pritz.T17003.02
Rhododendron fortunei Lindl.T18003.51
Pyrus calleryana Decne.T19003.34
Clethra barbinervis Siebold and Zucc.T2002.280
Begonia acetosella CraibS13.386.522.46
Enkianthus quinqueflorus Lour.S201.013.86
Mahonia bealei (Fortune) Carr.S32.61.012.16
Vaccinium japonicum Miq.S4003.11
Eurya muricata DunnS52.462.911.10
Rhododendron simsii Planch.S61.063.602.92
Symplocos glomerata King ex GambleS701.560
Ilex wilsonii Loes.S82.133.870
Prunus mume Siebold and Zucc.S92.333.591.02
Vaccinium sprengelii (G. Don) SleumerS102.147.040
Litsea cubeba (Lour.) Pers.S111.041.643.77
Itea omeiensis C. K. Schneid.S124.262.331.01
Maesa japonica Maesa japonicaS134.8301.00
Rhododendron tsoi Merr.S141.004.120
Rhododendron ovatum (Lindl.) Planch. ex Maxim.S153.763.771.03
Stranvaesia davidiana Decne.S16003.46
Rhododendron simiarum HanceS1704.841.00
Rhododendron latoucheae Franch.S182.671.122.02
Rubus corchorifolius L. f.S1901.172.89
Vaccinium trichocladum Merr. and F. P. MetcalfS201.921.810
Prunus spinulosa Siebold and Zucc.S213.241.001.01
Smilax polycolea Warb.S2202.880
Stauntonia obovatifoliola subsp. urophylla (Hand.-Mazz.) H. N. QinS233.033.771.00

References

  1. Spehn, E.M.; Joshi, J.; Schmid, B.; Diemer, M.; Körner, C. Above-ground resource use increases with plant species richness in experimental grassland ecosystems. Funct. Ecol. 2000, 14, 326–337. [Google Scholar] [CrossRef]
  2. Liu, Z.; Zhu, Y.; Wang, J.; Ma, W.; Meng, J. Species association of the dominant tree species in an old-growth forest and implications for enrichment planting for the restoration of natural degraded forest in subtropical China. Forests 2019, 10, 957. [Google Scholar] [CrossRef]
  3. Tilman, D.; Downing, J.A. Biodiversity and stability in grasslands. Nature 1994, 367, 363–365. [Google Scholar] [CrossRef]
  4. Peralta, G.; Perry, G.L.; Vázquez, D.P.; Dehling, D.M.; Tylianakis, J.M. Strength of niche processes for species interactions is lower for generalists and exotic species. J. Anim. Ecol. 2020, 89, 2145–2155. [Google Scholar] [CrossRef] [PubMed]
  5. Falster, D.S.; Brännström, Å.; Westoby, M.; Dieckmann, U. Multitrait successional forest dynamics enable diverse competitive coexistence. Proc. Natl. Acad. Sci. USA 2017, 114, E2719–E2728. [Google Scholar] [CrossRef]
  6. Fox Jeremy, W.; Morin Peter, J. Effects of intra-and interspecific interactions on species responses to environmental change. J. Anim. Ecol. 2001, 70, 80–90. [Google Scholar] [CrossRef]
  7. Burke, I.C.; Lauenroth, W.K.; Riggle, R.; Brannen, P.; Madigan, B.; Beard, S. Spatial variability of soil properties in the shortgrass steppe: The relative importance of topography, grazing, microsite, and plant species in controlling spatial patterns. Ecosystems 1999, 2, 422–438. [Google Scholar] [CrossRef]
  8. Zhou, Q.; Shi, H.; Shu, X.; Xie, F.; Zhang, K.; Zhang, Q.; Dang, H. Spatial distribution and interspecific associations in a deciduous broad-leaved forest in north-central China. J. Veg. Sci. 2019, 30, 1153–1163. [Google Scholar] [CrossRef]
  9. Vleminckx, J.; Barrantes, O.V.; Fortunel, C.; Paine, C.T.; Bauman, D.; Engel, J.; Petronelli, P.; Dávila, N.; Rios, M.; Valderrama Sandoval, E.H. Niche breadth of Amazonian trees increases with niche optimum across broad edaphic gradients. Ecology 2023, 104, e4053. [Google Scholar] [CrossRef] [PubMed]
  10. Russo, S.E.; Brown, P.; Tan, S.; Davies, S.J. Interspecific demographic trade-offs and soil-related habitat associations of tree species along resource gradients. J. Ecol. 2008, 96, 192–203. [Google Scholar] [CrossRef]
  11. Marpaung, B.A.; Budiadi, B.; Pertiwiningrum, A.; Lestari, L.D.; Nurjanto, H.H.; Widiyatno, W. Interspecific associations of mangrove species and their preferences for edaphic factors and water quality. Biodiversitas J. Biol. Divers. 2022, 23, 4626–4635. [Google Scholar] [CrossRef]
  12. Bryant, J.A.; Lamanna, C.; Morlon, H.; Kerkhoff, A.J.; Enquist, B.J.; Green, J.L. Microbes on mountainsides: Contrasting elevational patterns of bacterial and plant diversity. Proc. Natl. Acad. Sci. USA 2008, 105, 11505–11511. [Google Scholar] [CrossRef] [PubMed]
  13. Kerfahi, D.; Dong, K.; Yang, Y.; Kim, H.; Takahashi, K.; Adams, J. Elevation trend in bacterial functional gene diversity decouples from taxonomic diversity. Catena 2021, 199, 105099. [Google Scholar] [CrossRef]
  14. Ahmad, M.; Sharma, P.; Rathee, S.; Singh, H.P.; Batish, D.R.; Lone, G.R.; Kaur, S.; Jaryan, V.; Kohli, R.K. Niche width analyses facilitate identification of high-risk endemic species at high altitudes in western Himalayas. Ecol. Indic. 2021, 126, 107653. [Google Scholar] [CrossRef]
  15. Yang, S.; Feng, C.; Ma, Y.; Wang, W.; Huang, C.; Qi, C.; Fu, S.; Chen, H.Y. Transition from N to P limited soil nutrients over time since restoration in degraded subtropical broadleaved mixed forests. For. Ecol. Manag. 2021, 494, 119298. [Google Scholar] [CrossRef]
  16. Myers, N.; Mittermeier, R.A.; Mittermeier, C.G.; Da Fonseca, G.A.; Kent, J. Biodiversity hotspots for conservation priorities. Nature 2000, 403, 853–858. [Google Scholar] [CrossRef]
  17. Körner, C. Why are there global gradients in species richness? Mountains might hold the answer. Trends Ecol. Evol. 2000, 15, 513–514. [Google Scholar] [CrossRef]
  18. Kröber, W.; Böhnke, M.; Welk, E.; Wirth, C.; Bruelheide, H. Leaf trait-environment relationships in a subtropical broadleaved forest in South-East China. PLoS ONE 2012, 7, e35742. [Google Scholar] [CrossRef]
  19. Pei, N.; Lian, J.-Y.; Erickson, D.L.; Swenson, N.G.; Kress, W.J.; Ye, W.-H.; Ge, X.-J. Exploring tree-habitat associations in a Chinese subtropical forest plot using a molecular phylogeny generated from DNA barcode loci. PLoS ONE 2011, 6, e21273. [Google Scholar] [CrossRef]
  20. Umaña, M.N.; Swenson, N.G. Intraspecific variation in traits and tree growth along an elevational gradient in a subtropical forest. Oecologia 2019, 191, 153–164. [Google Scholar] [CrossRef]
  21. Xu, P.; Li, Y.; Zhang, S.; Liu, B. Features of Rodent Species Diversity in Wuyi Mountain National Nature Reserve, Jiangxi Province, China. Pak. J. Zool. 2023, 55, 1501–2000. [Google Scholar] [CrossRef]
  22. Xu, X.; Zhou, Y.; Ruan, H.; Luo, Y.; Wang, J. Temperature sensitivity increases with soil organic carbon recalcitrance along an elevational gradient in the Wuyi Mountains, China. Soil Biol. Biochem. 2010, 42, 1811–1815. [Google Scholar] [CrossRef]
  23. Jin, X.; Lin, S.; Zhu, J.; Tan, F.; Zhang, H.; Chen, Q.; Hong, Y.; Liu, J.; Xu, D.; He, Z. Dominant Tree Species and Their Age Groups Drive Forest Carbon Storage in Wuyi Mountain National Park, China. Forests 2024, 15, 546. [Google Scholar] [CrossRef]
  24. Wang, J.; Liu, J.; Liu, C.; Ding, X.; Wang, Y. Species niche and interspecific associations alter flora structure along a fertilization gradient in an alpine meadow of Tianshan Mountain, Xinjiang. Ecol. Indic. 2023, 147, 109953. [Google Scholar] [CrossRef]
  25. Lu, S.; Xu, Y.; Fu, X.; Xiao, H.; Ding, W.; Zhang, Y. Patterns and drivers of soil respiration and vegetation at different altitudes in Southern China. Appl. Ecol. Environ. Res. 2019, 17, 3097–3106. [Google Scholar] [CrossRef]
  26. Chen, X.; Wang, M.; Li, M.; Sun, J.; Lyu, M.; Zhong, Q.; Cheng, D. Convergent nitrogen–phosphorus scaling relationships in different plant organs along an elevational gradient. AoB Plants 2020, 12, plaa021. [Google Scholar] [CrossRef] [PubMed]
  27. Wu, X.; Cao, Y.; Jiang, Y.; Chen, M.; Zhang, H.; Wu, P.; Ma, X. Dynamics of non-structural carbohydrates release in Chinese fir topsoil and canopy litter at different altitudes. Plants 2023, 12, 729. [Google Scholar] [CrossRef] [PubMed]
  28. Zhu, D.; Zhou, Y.; Peng, S.; Hua, W.; Luo, B.; Hui, D. Impacts of altitude on plant green leaf, fresh litter, and soil stoichiometry in subtropical forests. Front. For. Glob. Chang. 2024, 7, 1331623. [Google Scholar] [CrossRef]
  29. Yang, N.; Wang, Y.; Liu, B.; Zhang, J.; Hua, J.; Liu, D.; Bhople, P.; Zhang, Y.; Zhang, H.; Zhang, C. Exploration of soil microbial diversity and community structure along mid-subtropical elevation gradients in southeast China. Forests 2023, 14, 769. [Google Scholar] [CrossRef]
  30. Zhu, G.; Niklas, K.J.; Li, M.; Sun, J.; Lyu, M.; Chen, X.; Wang, M.; Zhong, Q.; Cheng, D. “Diminishing Returns” in the scaling between leaf area and twig size in three forest communities along an elevation gradient of Wuyi Mountain, China. Forests 2019, 10, 1138. [Google Scholar] [CrossRef]
  31. Walker, B.H. Biodiversity and ecological redundancy. Conserv. Biol. 1992, 6, 18–23. [Google Scholar] [CrossRef]
  32. Chen, S.; Xie, L.; Zhou, W.; Chen, H.; Xu, X.; Jiang, S.; Zang, M.; Peng, Y.; Chen, X.; Duan, Y. Species diversity has a positive interrelationship with aboveground biomass and a mismatch with productivity in a subtropical broadleaf forest on the Wuyi Mountains, China. Diversity 2022, 14, 952. [Google Scholar] [CrossRef]
  33. Wang, S.; Ruan, H.; Han, Y. Effects of microclimate, litter type, and mesh size on leaf litter decomposition along an elevation gradient in the Wuyi Mountains, China. Ecol. Res. 2010, 25, 1113–1120. [Google Scholar] [CrossRef]
  34. Chen, L.; Comita, L.S.; Wright, S.J.; Swenson, N.G.; Zimmerman, J.K.; Mi, X.; Hao, Z.; Ye, W.; Hubbell, S.P.; Kress, W.J. Forest tree neighborhoods are structured more by negative conspecific density dependence than by interactions among closely related species. Ecography 2018, 41, 1114–1123. [Google Scholar] [CrossRef]
  35. Ramírez, J.A.; Díaz, M. The role of temporal shrub encroachment for the maintenance of Spanish holm oak Quercus ilex dehesas. For. Ecol. Manag. 2008, 255, 1976–1983. [Google Scholar] [CrossRef]
  36. De’Ath, G. Classification and regression trees: A powerful yet simple technique for ecological data analysis. Ecology 2000, 81, 3178–3192. [Google Scholar] [CrossRef]
  37. Harms, K.E.; Condit, R.; Hubbell, S.P.; Foster, R.B. Habitat associations of trees and shrubs in a 50-ha neotropical forest plot. J. Ecol. 2001, 89, 947–959. [Google Scholar] [CrossRef]
  38. Valencia, R.; Foster, R.B.; Villa, G.; Condit, R.; Svenning, J.C.; Hernández, C.; Romoleroux, K.; Losos, E.; Magård, E.; Balslev, H. Tree species distributions and local habitat variation in the Amazon: Large forest plot in eastern Ecuador. J. Ecol. 2004, 92, 214–229. [Google Scholar] [CrossRef]
  39. Arbainsyah; de Iongh, H.; Kustiawan, W.; De Snoo, G. Structure, composition and diversity of plant communities in FSC-certified, selectively logged forests of different ages compared to primary rain forest. Biodivers. Conserv. 2014, 23, 2445–2472. [Google Scholar] [CrossRef]
  40. Kikvidze, Z. Plant species associations in alpine-subnival vegetation patches in the Central Caucasus. J. Veg. Sci. 1993, 4, 297–302. [Google Scholar] [CrossRef]
  41. Ofomata, V.; Overholt, W.; Van Huis, A.; Egwuatu, R.; Ngi-Song, A. Niche overlap and interspecific association between Chilo partellus and Chilo orichalcociliellus on the Kenya coast. Entomol. Exp. Et Appl. 1999, 93, 141–148. [Google Scholar] [CrossRef]
  42. Su, S.-j.; Liu, J.-f.; He, Z.-s.; Zheng, S.-q.; Hong, W.; Xu, D.-w. Ecological species groups and interspecific association of dominant tree species in Daiyun Mountain National Nature Reserve. J. Mt. Sci. 2015, 12, 637–646. [Google Scholar] [CrossRef]
  43. Rousset, O.; Lepart, J. Positive and negative interactions at different life stages of a colonizing species (Quercus humilis). J. Ecol. 2000, 88, 401–412. [Google Scholar] [CrossRef]
  44. Turkington, R.A.; Cavers, P.B.; Aarssen, L.W. Neighbour relationships in grass–legume communities. I. Interspecific contacts in four grassland communities near London, Ontario. Can. J. Bot. 1977, 55, 2701–2711. [Google Scholar] [CrossRef]
  45. de Jong, P.; Aarssen, L.W.; Turkington, R. The analysis of contact sampling data. Oecologia 1980, 45, 322–324. [Google Scholar] [CrossRef]
  46. Hurlbert, S.H. A coefficient of interspecific assciation. Ecology 1969, 50, 1–9. [Google Scholar] [CrossRef]
  47. Chai, Z.; Sun, C.; Wang, D.; Liu, W. Interspecific associations of dominant tree populations in a virgin old-growth oak forest in the Qinling Mountains, China. Bot. Stud. 2016, 57, 23. [Google Scholar] [CrossRef]
  48. Li, Y.; Xu, H.; Chen, D.; Luo, T.; Mo, J.; Luo, W.; Chen, H.; Jiang, Z. Division of ecological species groups and functional groups based on interspecific association—A case study of the tree layer in the tropical lowland rainforest of Jianfenling in Hainan Island, China. Front. For. China 2008, 3, 407–415. [Google Scholar] [CrossRef]
  49. Levins, R. Evolution in changing environments: Some theoretical explorations. BioScience 1969, 19, 659–660. [Google Scholar] [CrossRef]
  50. Pianka, E.R. The structure of lizard communities. Annu. Rev. Ecol. Syst. 1973, 4, 53–74. [Google Scholar] [CrossRef]
  51. Yang, J.; Su, P.; Zhou, Z.; Shi, R.; Ding, X. Environmental filtering rather than dispersal limitation dominated plant community assembly in the Zoige Plateau. Ecol. Evol. 2022, 12, e9117. [Google Scholar] [CrossRef]
  52. Zhang, W. Interspecific associations and community structure: A local survey and analysis in a grass community. Selforganizology 2014, 1, 89–129. [Google Scholar]
  53. Jin, S.S.; Zhang, Y.Y.; Zhou, M.L.; Dong, X.M.; Chang, C.H.; Wang, T.; Yan, D.F. Interspecific association and community stability of tree species in natural secondary forests at different altitude gradients in the southern Taihang Mountains. Forests 2022, 13, 373. [Google Scholar] [CrossRef]
  54. Dai, J.; Liu, H.; Xu, C.; Qi, Y.; Zhu, X.; Zhou, M.; Liu, B.; Wu, Y. Divergent hydraulic strategies explain the interspecific associations of co-occurring trees in forest–steppe ecotone. Forests 2020, 11, 942. [Google Scholar] [CrossRef]
  55. Nguyen, V.; Pham, V.; Bui, T.; Nguyen, H. Niche and Interspecific Association of Dominant Tree Species in an Evergreen Broadleaved Forest in Southern Vietnam. Mosc. Univ. Biol. Sci. Bull. 2023, 78, 89–99. [Google Scholar] [CrossRef]
  56. Tetemke, B.A.; Birhane, E.; Rannestad, M.M.; Eid, T. Species diversity and stand structural diversity of woody plants predominantly determine aboveground carbon stock of a dry Afromontane forest in Northern Ethiopia. For. Ecol. Manag. 2021, 500, 119634. [Google Scholar] [CrossRef]
  57. Bruun, H.H.; Moen, J.; Virtanen, R.; Grytnes, J.A.; Oksanen, L.; Angerbjörn, A. Effects of altitude and topography on species richness of vascular plants, bryophytes and lichens in alpine communities. J. Veg. Sci. 2010, 17, 37–46. [Google Scholar] [CrossRef]
  58. Brown, J.H. Mammals on mountainsides: Elevational patterns of diversity. Glob. Ecol. Biogeogr. 2001, 10, 101–109. [Google Scholar] [CrossRef]
  59. Lomolino, M.V. Elevation gradients of species-density: Historical and prospective views. Glob. Ecol. Biogeogr. 2001, 10, 3–13. [Google Scholar] [CrossRef]
  60. Körner, C. Concepts in alpine plant ecology. Plants 2023, 12, 2666. [Google Scholar] [CrossRef]
  61. Silvertown, J.; Charlesworth, D. Introduction to Plant Population Biology; John Wiley & Sons: Hoboken, NJ, USA, 2009. [Google Scholar]
  62. Wang, G.; Zhou, G.; Yang, L.; Li, Z. Distribution, species diversity and life-form spectra of plant communities along an altitudinal gradient in the northern slopes of Qilianshan Mountains, Gansu, China. Plant Ecol. 2003, 165, 169–181. [Google Scholar] [CrossRef]
  63. D’Andrea, R.; Ostling, A. Challenges in linking trait patterns to niche differentiation. Oikos 2016, 125, 1369–1385. [Google Scholar] [CrossRef]
  64. Levin, S.A. Community equilibria and stability, and an extension of the competitive exclusion principle. Am. Nat. 1970, 104, 413–423. [Google Scholar] [CrossRef]
  65. Abrams, P. The theory of limiting similarity. Annu. Rev. Ecol. Syst. 1983, 14, 359–376. [Google Scholar] [CrossRef]
  66. Silvertown, J. Plant coexistence and the niche. Trends Ecol. Evol. 2004, 19, 605–611. [Google Scholar] [CrossRef]
  67. Silvertown, J.; Dodd, M.E.; Gowing, D.J.; Mountford, J.O. Hydrologically defined niches reveal a basis for species richness in plant communities. Nature 1999, 400, 61–63. [Google Scholar] [CrossRef]
  68. Pandey, R.; Rawat, M.; Singh, V.; Yousefpour, R.; Reshi, Z.A. Large scale field-based evaluation of niche breadth, niche overlap and interspecific association of Western Himalayan temperate forest tree species. Ecol. Indic. 2023, 146, 109876. [Google Scholar] [CrossRef]
  69. Ricklefs, R.E. Competition and the structure of bird communities. Evolution 1975, 29, 581–585. [Google Scholar] [CrossRef]
  70. Müller, R.; Nowicki, C.; Barthlott, W.; Ibisch, P.L. Biodiversity and endemism mapping as a tool for regional conservation planning–case study of the Pleurothallidinae (Orchidaceae) of the Andean rain forests in Bolivia. Biodivers. Conserv. 2003, 12, 2005–2024. [Google Scholar] [CrossRef]
  71. Hurlbert, S.H. The measurement of niche overlap and some relatives. Ecology 1978, 59, 67–77. [Google Scholar] [CrossRef]
  72. Callaway, R.M.; Brooker, R.W.; Choler, P.; Kikvidze, Z.; Lortie, C.J.; Michalet, R.; Paolini, L.; Pugnaire, F.I.; Newingham, B.; Aschehoug, E.T. Positive interactions among alpine plants increase with stress. Nature 2002, 417, 844–848. [Google Scholar] [CrossRef] [PubMed]
  73. Lyu, S.; Alexander, J.M. Competition contributes to both warm and cool range edges. Nat. Commun. 2022, 13, 2502. [Google Scholar] [CrossRef] [PubMed]
  74. Wu, G.; Gao, J.; Ou, W.; Wan, J.; Li, X. Effects of the hummock–depression microhabitat on plant communities of alpine marshy meadows in the Yellow River Source Zone, China. J. Plant Ecol. 2022, 15, 111–128. [Google Scholar] [CrossRef]
  75. Banerji, A. Acquisition of adaptive traits via interspecific association: Ecological consequences and applications. Ecologies 2021, 2, 43–70. [Google Scholar] [CrossRef]
  76. Gu, L.; Gong, Z.-w.; Li, W.-z. Niches and interspecific associations of dominant populations in three changed stages of natural secondary forests on Loess Plateau, PR China. Sci. Rep. 2017, 7, 6604. [Google Scholar] [CrossRef] [PubMed]
  77. Zhang, L.; Dong, L.; Liu, Q.; Liu, Z. Spatial patterns and interspecific associations during natural regeneration in three types of secondary forest in the central part of the Greater Khingan Mountains, Heilongjiang Province, China. Forests 2020, 11, 152. [Google Scholar] [CrossRef]
  78. Condit, R.; Ashton, P.S.; Baker, P.; Bunyavejchewin, S.; Gunatilleke, S.; Gunatilleke, N.; Hubbell, S.P.; Foster, R.B.; Itoh, A.; LaFrankie, J.V. Spatial patterns in the distribution of tropical tree species. Science 2000, 288, 1414–1418. [Google Scholar] [CrossRef] [PubMed]
  79. Law, R.; Purves, D.W.; Murrell, D.J.; Dieckmann, U. Causes and effects of small-scale spatial structure in plant populations. Anal. Biochem. 2002. Available online: https://pure.iiasa.ac.at/6745/1/IR-02-040.pdf (accessed on 10 July 2024).
Figure 1. Distribution map of the 34 research sites on Wuyi Mountain National Nature Reserve. The number next to the sample site represents the sample site number, the vertical interval of the contour line is 200 m, and the number on it is the elevation of the contour line in meters.
Forests 15 01256 g001
Figure 2. Half-matrix diagram using association coefficient (AC) values of interspecific associations in the tree and shrub layers: sample plots (a) H1, (b) H2, and (c) H3 of the tree layer and (d) H1, (e) H2, and (f) H3 of the shrub layer. ▲ extreme significant positive association; ● significant positive association; Forests 15 01256 i001 non-significant positive association; □ non-significant negative association; ○ significant negative association; ▽ extreme significant negative association. The scientific names of trees and shrubs are shown in Table 1.
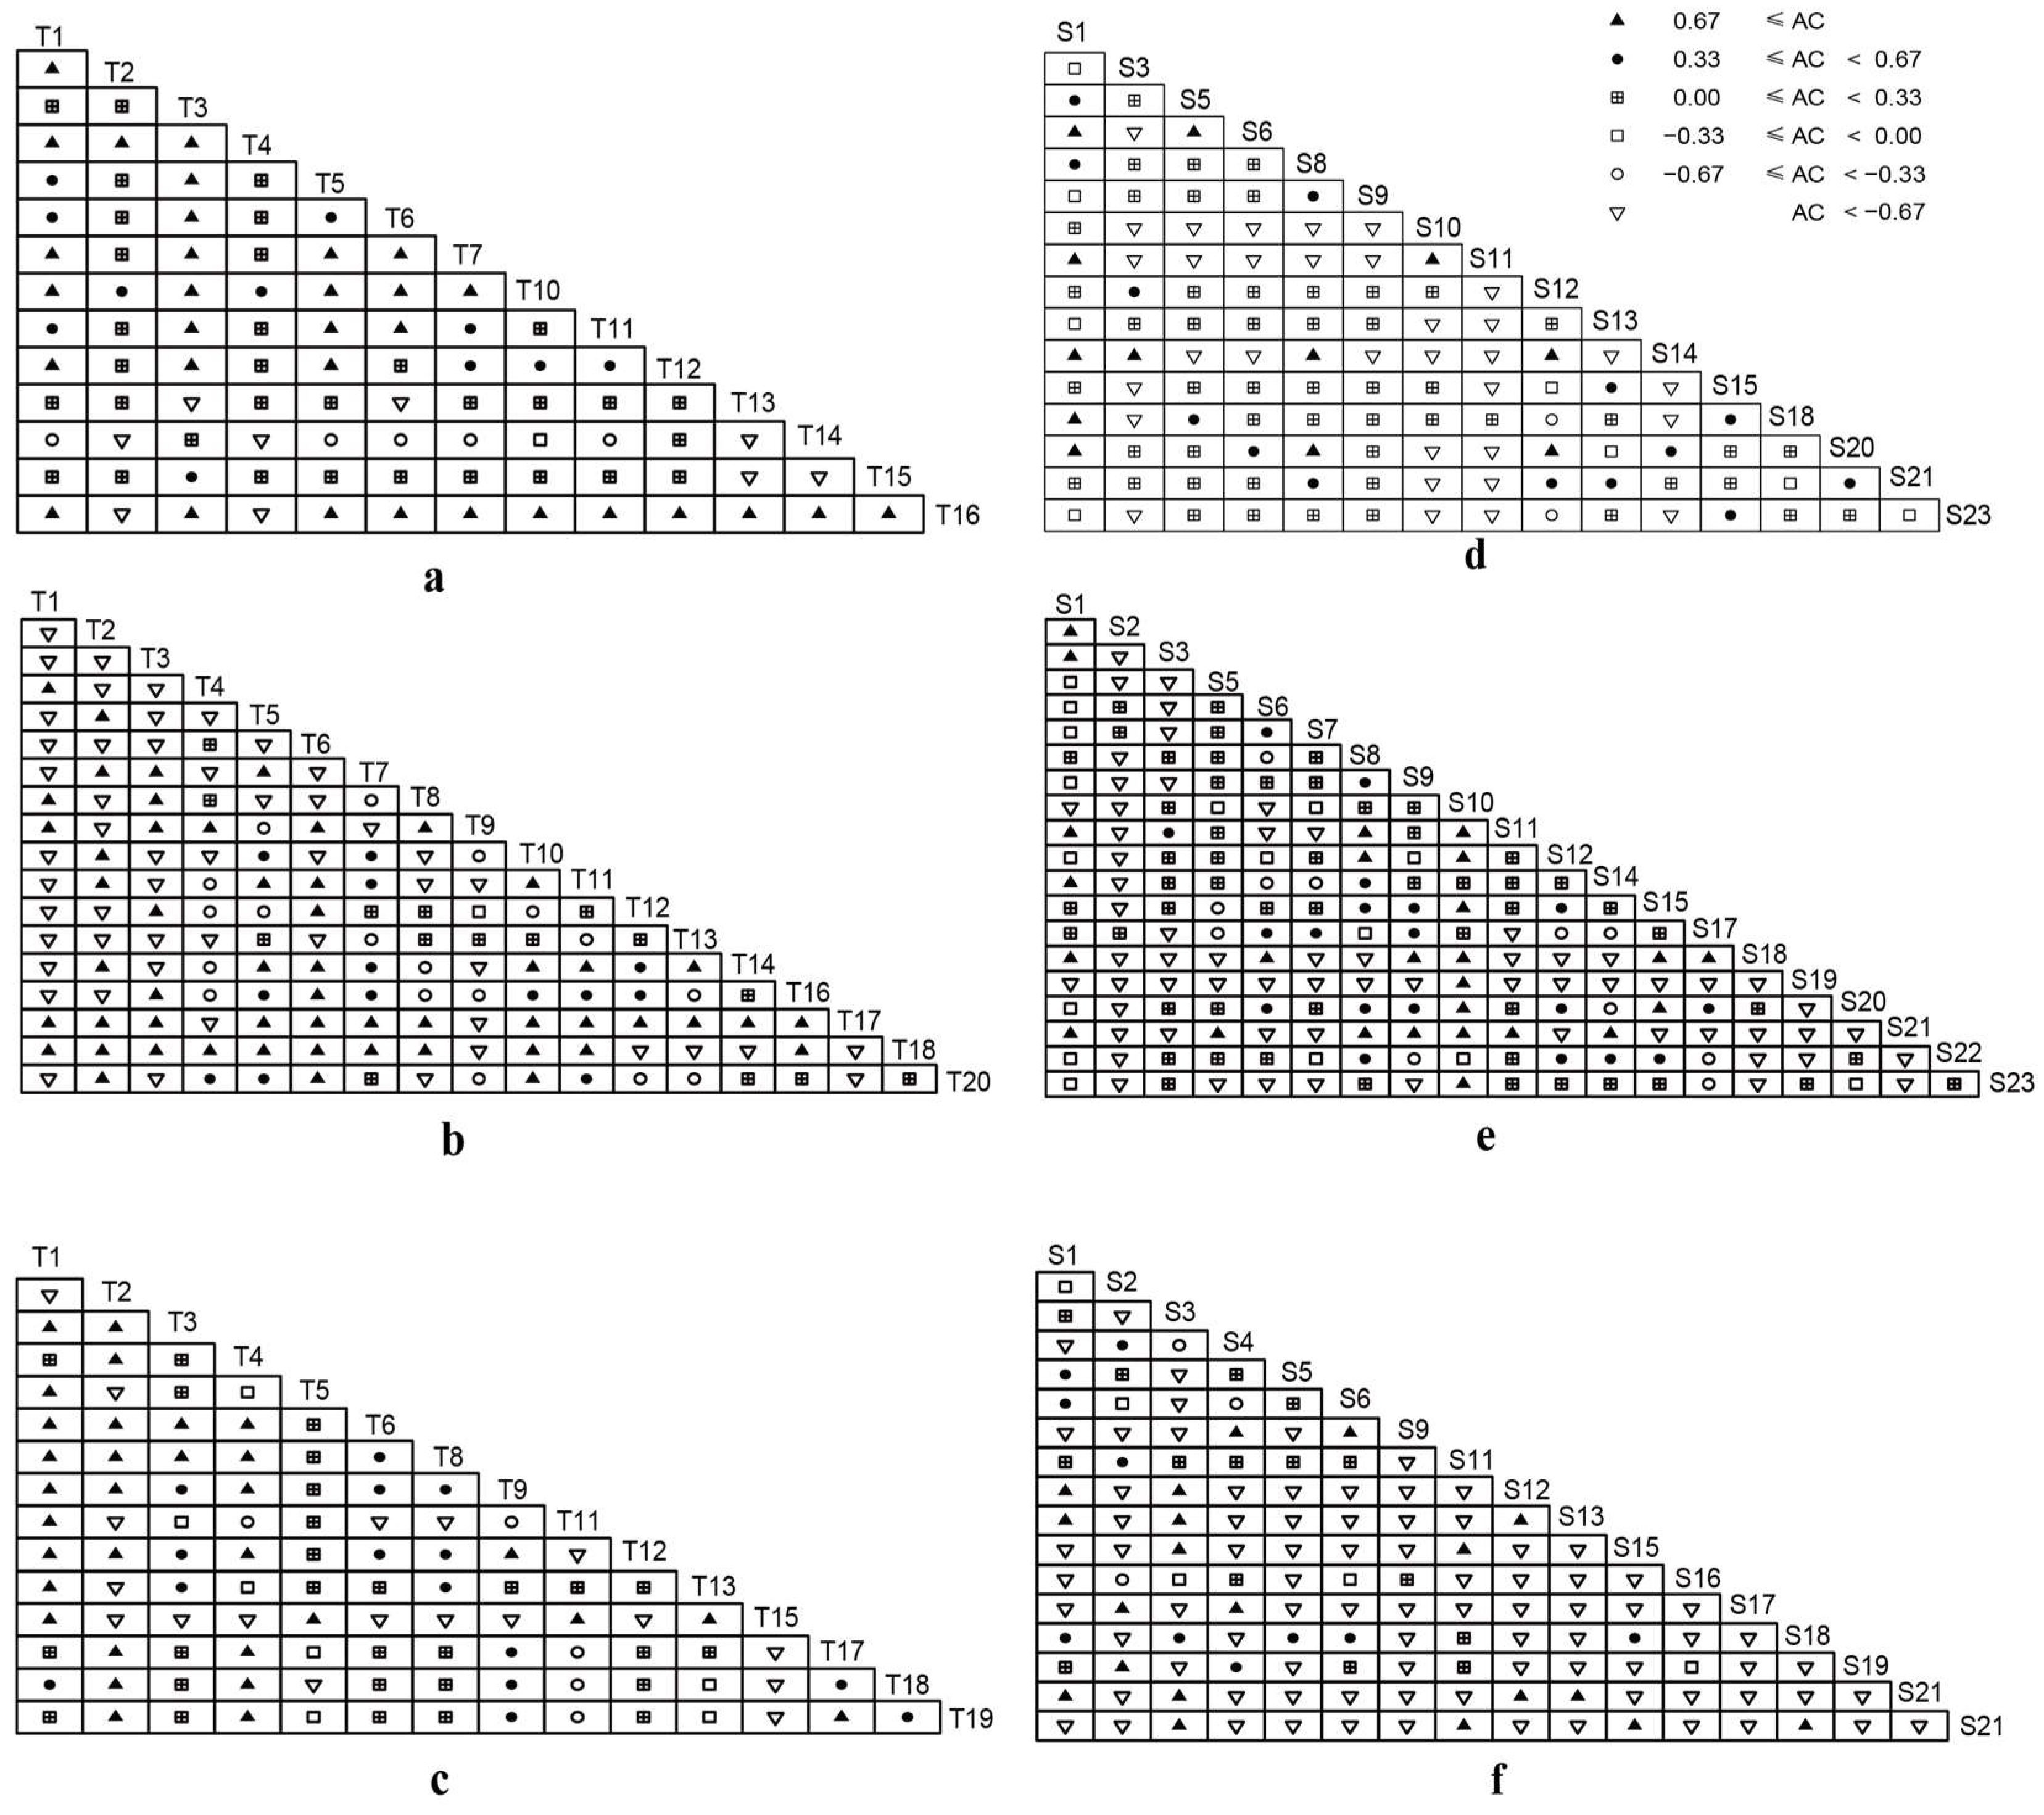
Forests 15 01256 g002
Figure 3. Levins’s niche width of dominant plant species in tree and shrub layers. Note: The scientific names of trees and shrubs are shown in Table 1. Each color block in the outer ring represents a species or an elevation range. The direction of the lines illustrates the dominant species presented in different elevations in these samples, and the thickness of the bar is proportional to the importance value of the dominant species of each sample.
Forests 15 01256 g003
Figure 4. Niche overlap analysis of dominant plant species in tree and shrub layers: sample plots (a) H1, (b) H2, and (c) H3 of the tree layer and (d) H1, (e) H2, and (f) H3 of the shrub layer. The size and color of the circles represent the value of the niche overlap. The legend on the right shows the colors of the niche overlap index from 0–1. The scientific names of trees and shrubs are shown in Table 1.
Forests 15 01256 g004
Table 1. Scientific names and importance values of dominant tree and shrub layer species.
Tree LayerShrub Layer
SpeciesFamilyNo.IV/%SpeciesFamilyNo.IV/%
Rhododendron latoucheae Franch.EricaceaeT119.11%Begonia acetosella CraibBegoniaceaeS15.92%
Pinus taiwanensis HayataPinaceaeT211.97%Enkianthus quinqueflorus Lour.EricaceaeS25.34%
Schima superba Gardner and Champ.TheaceaeT38.21%Mahonia bealei (Fortune) Carr.BerberidaceaeS33.69%
Enkianthus quinqueflorus Lour.EricaceaeT47.12%Vaccinium japonicum Miq.EricaceaeS43.50%
Rhododendron ovatum (Lindl.) Planch. ex Maxim.EricaceaeT55.15%Eurya muricata DunnPentaphylacaceaeS53.50%
Vaccinium sprengelii (G. Don) SleumerEricaceaeT64.62%Rhododendron simsii Planch.EricaceaeS63.30%
Adinandra millettii (Hook. and Arn.) Benth. and Hook. f. ex HancePentaphylacaceaeT73.33%Symplocos glomerata King ex GambleSymplocaceaeS72.72%
Rhododendron taronense Hutch.EricaceaeT83.29%Ilex wilsonii Loes.AquifoliaceaeS82.14%
Rhododendron basilicum Balf. f. and W. W. Sm.EricaceaeT93.14%Prunus mume Siebold and Zucc.RosaceaeS92.04%
Rhododendron farrerae SweetEricaceaeT102.09%Vaccinium sprengelii (G. Don) SleumerEricaceaeS101.94%
Eurya muricata DunnPentaphylacaceaeT111.75%Litsea cubeba (Lour.) Pers.LauraceaeS111.94%
Quercus multinervis (W. C. Cheng and T. Hong) J. Q. LiFagaceaeT121.61%Itea omeiensis C. K. Schneid.IteaceaeS121.84%
Quercus glauca Thunb.FagaceaeT131.47%Maesa japonica Maesa japonicaPrimulaceaeS131.75%
Castanopsis eyrei (Champ. ex Benth.) TutcherFagaceaeT141.35%Rhododendron tsoi Merr.EricaceaeS141.75%
Engelhardia roxburghiana Wall.JuglandaceaeT151.30%Rhododendron ovatum (Lindl.) Planch. ex Maxim.EricaceaeS151.65%
Acer rubrum L.SapindaceaeT161.21%Stranvaesia davidiana Decne.RosaceaeS161.55%
Tsuga chinensis (Franch.) E. Pritz.PinaceaeT171.20%Rhododendron simiarum HanceEricaceaeS171.55%
Rhododendron fortunei Lindl.EricaceaeT181.11%Rhododendron latoucheae Franch.EricaceaeS181.55%
Pyrus calleryana Decne.RosaceaeT191.05%Rubus corchorifolius L. f.RosaceaeS191.46%
Clethra barbinervis Siebold and Zucc.ClethraceaeT201.01%Vaccinium trichocladum Merr. and F. P. MetcalfEricaceaeS201.17%
Prunus spinulosa Siebold and Zucc.RosaceaeS211.17%
Smilax polycolea Warb.SmilacaceaeS221.17%
Stauntonia obovatifoliola subsp. urophylla (Hand.-Mazz.) H. N. QinLardizabalaceaeS231.17%
Table 2. Sample plot numbers, elevations, and forest community types in each of the three elevation ranges.
Elevation Range CategorySample Plot No.Elevation (m)Forest TypeMain Dominant Species
Tree LayerShrub Layer
H134560Evergreen broad-leaved forestsCastanopsis eyrei,
Quercus glauca,
Vaccinium sprengelii,
Rhododendron ovatum
Itea omeiensis,
Rhododendron ovatum,
Begonia acetosella,
Laurocerasus spinulosa
32600
1690
33710
2750
22790
21850
23900
31950
241000
H2251050Broad-leaved mixed forestsRhododendron latoucheae,
Pinus taiwanensis,
Vaccinium sprengelii,
Schima superba
Vaccinium sprengelii,
Begonia acetosella,
Rhododendron simiarum,
Rhododendron tsoi
301100
291150
281200
271250
261300
191350
181400
171450
161500
H371550Coniferous forestsPinus taiwanensis,
Enkianthus quinqueflorus,
Rhododendron latoucheae,
Quercus multinervis
Enkianthus quinqueflorus,
Litsea cubeba,
Stranvaesia davidiana,
Vaccinium japonicum
151600
141650
131700
121750
111800
101850
201900
91950
62000
82000
52050
42100
32150
Table 3. Measurement of the interspecific associations between species A and B.
Species A
YN
Species BYaba + b
Ncdc + d
a + cb + da + b + c + d
Note: a represents the number of sample plots in which the paired species co-occur, d represents the number of sample plots in which neither of the paired species occurs, and b and c represent the number of sample plots in which species A and B occur, respectively. The sum of a, b, c, and d equals the total number of sample plots.
Table 4. Overall associations among dominant species.
LayerHabitat CategoriesVariance Ratio (VR)Test Statistic (W) χ ( 0.95 , N ) 2 , χ ( 0.05 , N ) 2 Result
TreeH14.85248.5243.325, 16.918Significant positive association
H21.35713.5693.325, 16.918Non-significant positive association
H34.44153.2934.875, 19.675Significant positive association
ShrubH12.57025.7003.325, 16.918Significant positive association
H21.84718.4703.325, 16.918Significant positive association
H30.6829.5454.875, 19.675Non-significant negative association
Disclaimer/Publisher’s Note: The statements, opinions and data contained in all publications are solely those of the individual author(s) and contributor(s) and not of MDPI and/or the editor(s). MDPI and/or the editor(s) disclaim responsibility for any injury to people or property resulting from any ideas, methods, instructions or products referred to in the content.

