Article

Temporal Variations in Enzymatic and Non-Enzymatic Antioxidant Activity in Silver Birch (Betula pendula Roth.): The Genetic Component

by
Vaida Sirgedaitė-Šėžienė
,
Ieva Čėsnienė
and
Dorotėja Vaitiekūnaitė
*
Laboratory of Forest Plant Biotechnology, Institute of Forestry, Lithuanian Research Centre for Agriculture and Forestry, Liepu St. 1, LT-53101 Girionys, Lithuania
*
Author to whom correspondence should be addressed.
Forests 2024, 15(7), 1262; https://doi.org/10.3390/f15071262
Submission received: 23 June 2024 / Revised: 11 July 2024 / Accepted: 18 July 2024 / Published: 19 July 2024

Abstract

:
Betula pendula Roth. (silver birch) is a pioneer species in the Northern Hemisphere forests. It plays a significant role in various ecosystems, human industries, and biodiversity. Taking all this into account, understanding the genetic diversity within B. pendula populations is crucial for fully exploiting their potential, particularly regarding their production of phenolic compounds and antioxidants. We tested the non-enzymatic and enzymatic antioxidant activity in seven silver birch half-sib family leaves. Spectrophotometric data from leaf extracts showed that there was a significant variation between families in terms of total phenol content (TPC) and antioxidant enzyme (superoxide dismutase, peroxidase (POX), catalase, glutathione reductase, and ascorbate peroxidase) levels. The data were gathered during two consecutive seasons, resulting in a variance in antioxidant production, which generally increased in the tested families during the second year (except for POX) as opposed to the first vegetative season. For example, SOD levels increased in the second year by 15% to 243% and TPC increased by 46%–189%, depending on the half-sib family. A more thorough study of this variation should prove beneficial in various research fields, ranging from climate change to cosmetics.

1. Introduction

Birch trees, particularly Betula pendula Roth. (commonly known as silver birch), play significant roles in ecosystems, human industries, and biodiversity. Silver birch, widely distributed across Europe and parts of Asia, thrives in diverse habitats from boreal forests to temperate woodlands [1,2,3]. Its ecological and economic importance, coupled with its role in scientific research, underscores the need for detailed studies into its biological and chemical properties [1,2,4,5].
Betula pendula contributes profoundly to forest ecosystems. As a pioneer species, it often colonizes disturbed or open areas first, which facilitates the establishment of other species by improving soil conditions and providing cover. The tree’s ability to thrive in poor soils and its rapid growth help stabilize ecosystems, prevent soil erosion, and contribute to nutrient cycling through leaf litter decomposition [4,6]. The tree also supports a wide range of wildlife; its bark, leaves, and seeds provide food and habitat for numerous insects, birds, and mammals. The birch’s interaction with mycorrhizal fungi and other microorganisms enhances soil health and promotes biodiversity [2,4]. By supporting various trophic levels, Betula pendula enhances the complexity and resilience of the ecosystems it inhabits [4,6].
Historically and culturally, Betula pendula has been significant to human societies as well. Its wood is valued for its durability and versatility, used in construction, furniture making, and paper production. The tree’s bark has been utilized for its waterproof properties in traditional crafts and its leaves and sap for their medicinal benefits [1,7].
The importance of Betula pendula extends into various scientific fields as well [1,4,7,8,9,10]. Its adaptability and resilience make it an ideal model organism for studying ecological responses to climate change. By understanding how Betula pendula adapts to different environmental stresses, researchers can gain insights into forest dynamics and develop strategies for conservation and climate mitigation [6,11,12,13,14]. Furthermore, the bioactive compounds found in silver birch, such as betulin and other various phenolic compounds, have shown potential in treating inflammation, infections, and even cancer. Research into these compounds could lead to the development of new pharmaceuticals [1]. Moreover, Betula pendula is used in phytoremediation to detoxify soils contaminated with heavy metals or other toxins. Its ability to absorb and accumulate pollutants makes it valuable in cleaning up industrial sites [4,5].
Understanding the genetic diversity within Betula pendula populations is essential for harnessing its full potential. Studies on different birch species and genotypes and their phenolic and antioxidant production are particularly promising [9,15,16,17,18,19,20]. In trees, both enzymatic and non-enzymatic antioxidant systems play critical roles in mitigating oxidative stress caused by environmental factors [19]. Enzymatic antioxidants include superoxide dismutase (SOD), catalase (CAT), and various peroxidases, which catalyze reactions to neutralize reactive oxygen species (ROS). Non-enzymatic antioxidants encompass a diverse array of molecules such as ascorbic acid (vitamin C), glutathione, tocopherols (vitamin E), flavonoids, and phenolic compounds. These antioxidants work synergistically to scavenge free radicals, chelate metal ions, and regenerate other antioxidants, thereby protecting cellular components from oxidative damage. Studies have shown that the balance and efficiency of these antioxidant systems are crucial for the resilience and longevity of trees, enabling them to survive and thrive in diverse and often harsh environmental conditions [21,22]. Variations in these compounds among different genotypes of Betula pendula can provide insights into the tree’s adaptability and resilience [20].
Identifying genotypes with higher antioxidant production can lead to more resilient and disease-resistant trees, which is crucial for sustainable forestry [9,18,23,24]. On top of that, different phenolic profiles can influence soil chemistry and microbial communities, impacting overall forest health and productivity [25]. This knowledge can help in selecting genotypes for reforestation projects that aim to restore and enhance ecosystem functions. In addition, genotypes that produce higher levels of specific phenolic compounds may be more effective in developing therapeutics, biocontrol agents, etc. [7,9,15,19,23]. Understanding these variations can accelerate the discovery of natural compounds with pharmaceutical applications.
All in all, Betula pendula’s ecological, economic, and scientific importance cannot be overstated. Its contributions to ecosystem stability, biodiversity, and human welfare highlight the need for continued research. Studies on genetic variations in phenolic and antioxidant production promise to advance our understanding and application of this versatile species across various scientific fields, from ecology and environmental science to pharmacology and agriculture. Thus, the main aim of this study was to evaluate how the genetic diversity and growth patterns of Betula pendula species may influence its non-enzymatic and enzymatic antioxidant synthesis. Seven genotypes/half-sib families (individuals sharing one parent) were chosen. Their phenol levels as well as antioxidant enzyme activity were evaluated during two consecutive growing seasons.

2. Materials and Methods

2.1. Sowing Material and Growth Conditions

Silver birch seeds of seven different genetic groups/half-sib families were gathered from a dedicated second-generation silver birch seed orchard in the Dubrava regional division (Lithuania) in 2019 (coordinates—54°51′20.6″ N 24°03′04.8″ E; 70.57 M.A.S.L.). Families were named as the numbers 86, 125, 112, 171, 60, 179, and 73.
After collection, the seeds were kept for nearly a year in a fridge at +4 °C in moisture-proof bags for stratification. Seeds were then left at room temperature for 4 days prior to sowing. Birch seeds were sown randomly in 18-cell (6 × 6 × 13 cm) seedbeds filled with a commercial peat-based organic matter-rich soil (pH of 5.5–6.5) (SuliFlor SF2, Sulinkiai, Lithuania) and covered lightly with perlite. For two months, the emerging trees were kept in a greenhouse in a semi-controlled environment (25–32 °C/10 °C day/night). Two months post sowing, the small trees were transferred outdoors to a well-lit open area. After a year, they were repotted to larger containers (18 × 17 × 2 cm) using the same soil as before (SuliFlor SF2). Plants were watered as needed throughout the experiment.

2.2. Sampling

Samples were gathered twice, both times during October, after the end of the vegetation season (2020 and 2021). The first sampling was carried out prior to repotting to avoid any repotting-caused stress variation. Seedling height (aboveground) was measured and then leaves were collected from each half-sib family and transferred to the laboratory on ice as soon as possible. At least 20 individuals per group were sampled. Leaf samples of 0.1 g were then weighed for phenol and protein extractions and further processed. At least 3 biological replicates per group were taken. Biological replicates were measured 3 times each (i.e., three technical replicates).

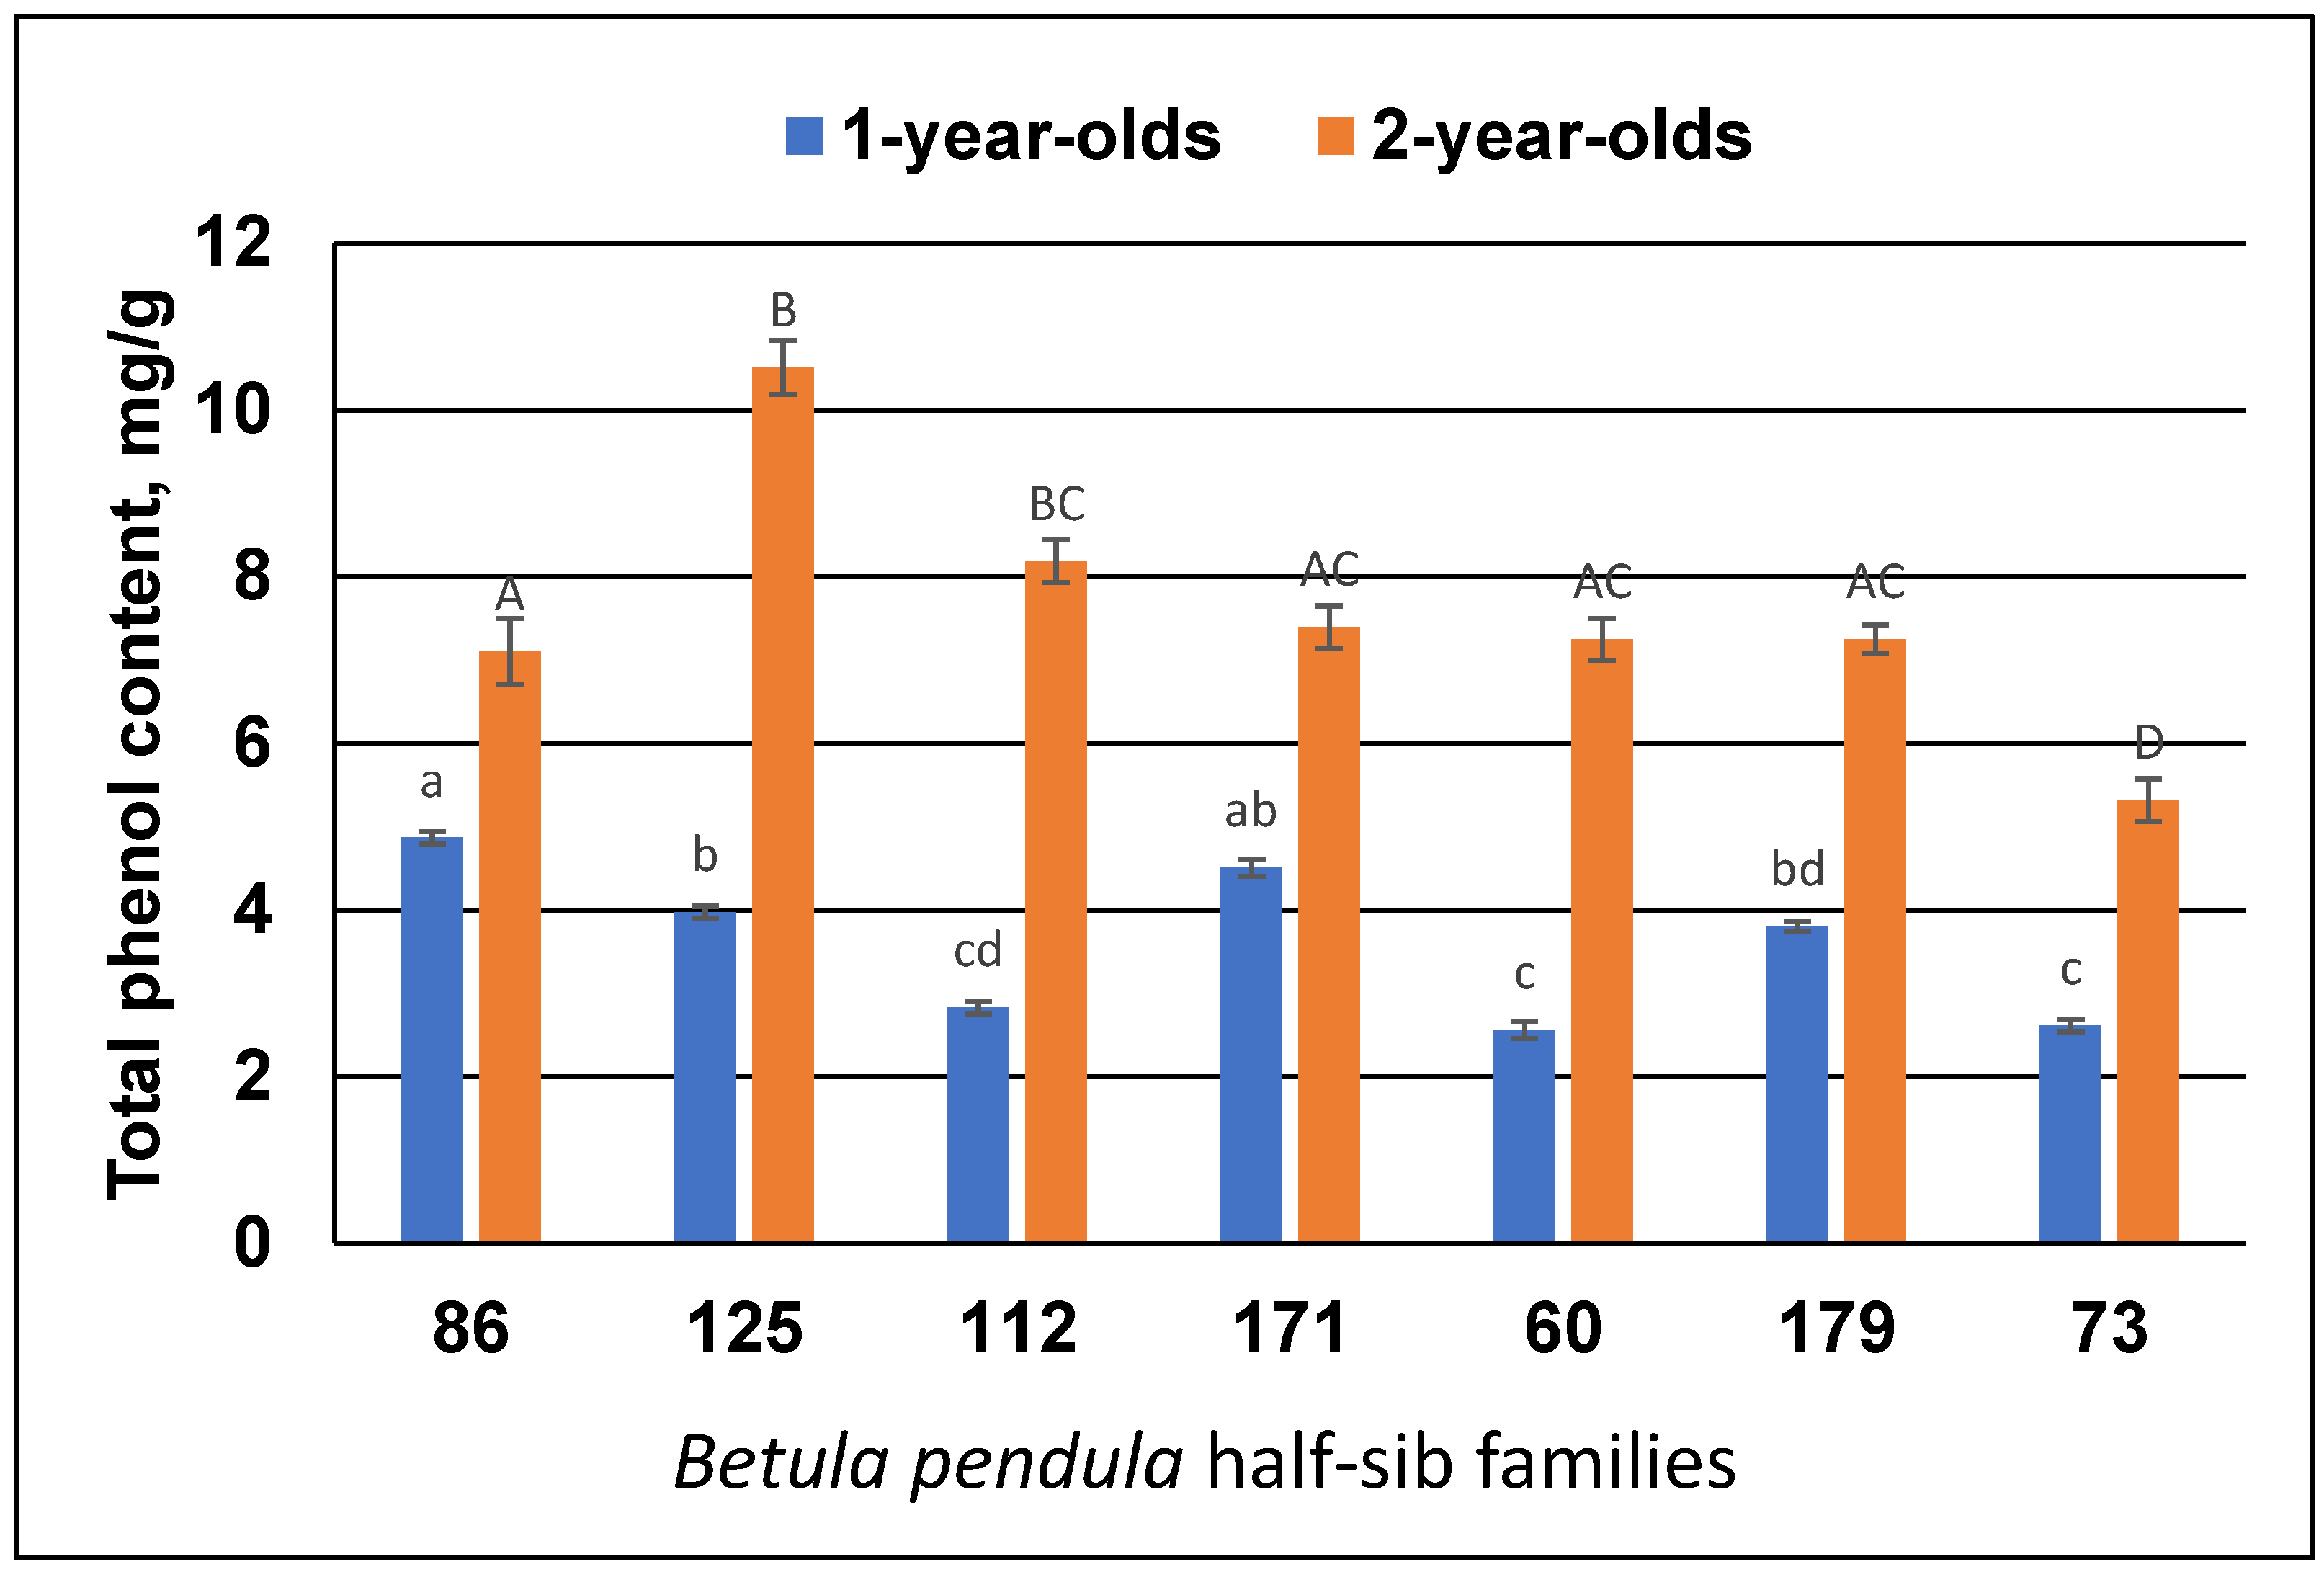
2.3. Total Phenol Content

2.3.1. Extract Preparation

A hundred milligrams of birch leaf biomass was pulverized using the “Precellys 24” (Bertin Technologies, Thiron-Gardais, France) tissue homogenizer at 1956× g for 30 s and then 2 mL of 80% (v/v in water) ethanol was added. The pulverized resuspended samples were centrifuged for half an hour at 21,910× g and +4 °C with a Hettich Universal 32R centrifuge (Andreas Hettich GmbH & Co. KG, Tuttlingen, Germany). The supernatant liquid was removed and used for further tests [26].

2.3.2. Phenol Analysis

The total phenol content (TPC) was measured by a SpectroStar Nano microplate reader from BMG Labtech, based in Offenburg, Germany. This analysis employed the Folin–Ciocalteu reagent, following a modified procedure detailed by Beniušytė et al. [26].

2.4. Antioxidant Enzymes

Levels of superoxide dismutase (SOD), ascorbate peroxidase (APX), catalase (CAT), peroxidase (POX), and glutathione reductase (GR) were investigated using the SpectroStar Nano microplate reader. Buffer, reagent, and solution preparation procedures and formulas are described for total proteins, APX, CAT, POX, and GR analyses in detail by Beniušytė et al. [26], and SOD analysis was carried out exactly as described by Čėsnienė et al. [27].

2.4.1. Extract Preparation

For protein extraction, the leaf samples were ground using liquid nitrogen with a pestle and mortar. Then, 5 mL of the extraction solution [26] was thoroughly mixed with the sample and centrifuged for an hour at 16,090× g and +4 °C. The extract was then filtered using Sephadex G-25 columns (Column PD-10, Cytiva, Gillingham, UK) (bulk filtrate). The extract before the filtering was used for total protein, SOD, and CAT analyses, while the extract after filtering was used for POX, APX, and GR.

2.4.2. Protein Analysis

For bulk protein analysis, extract (20 µL, before filtering) was combined with 180 µL of Biuret reagent and, after 5 min, 20 µL of Folin–Ciocalteau reagent (1:9 w/v) was added. Following this, the samples were kept at room temperature for 30 min. The absorption was measured at 660 nm. BSA (Bovine Serum Albumin) (>98%, Sigma-Aldrich, Burlington, MA, USA) was used as standard for the calibration curve (details in [26]).

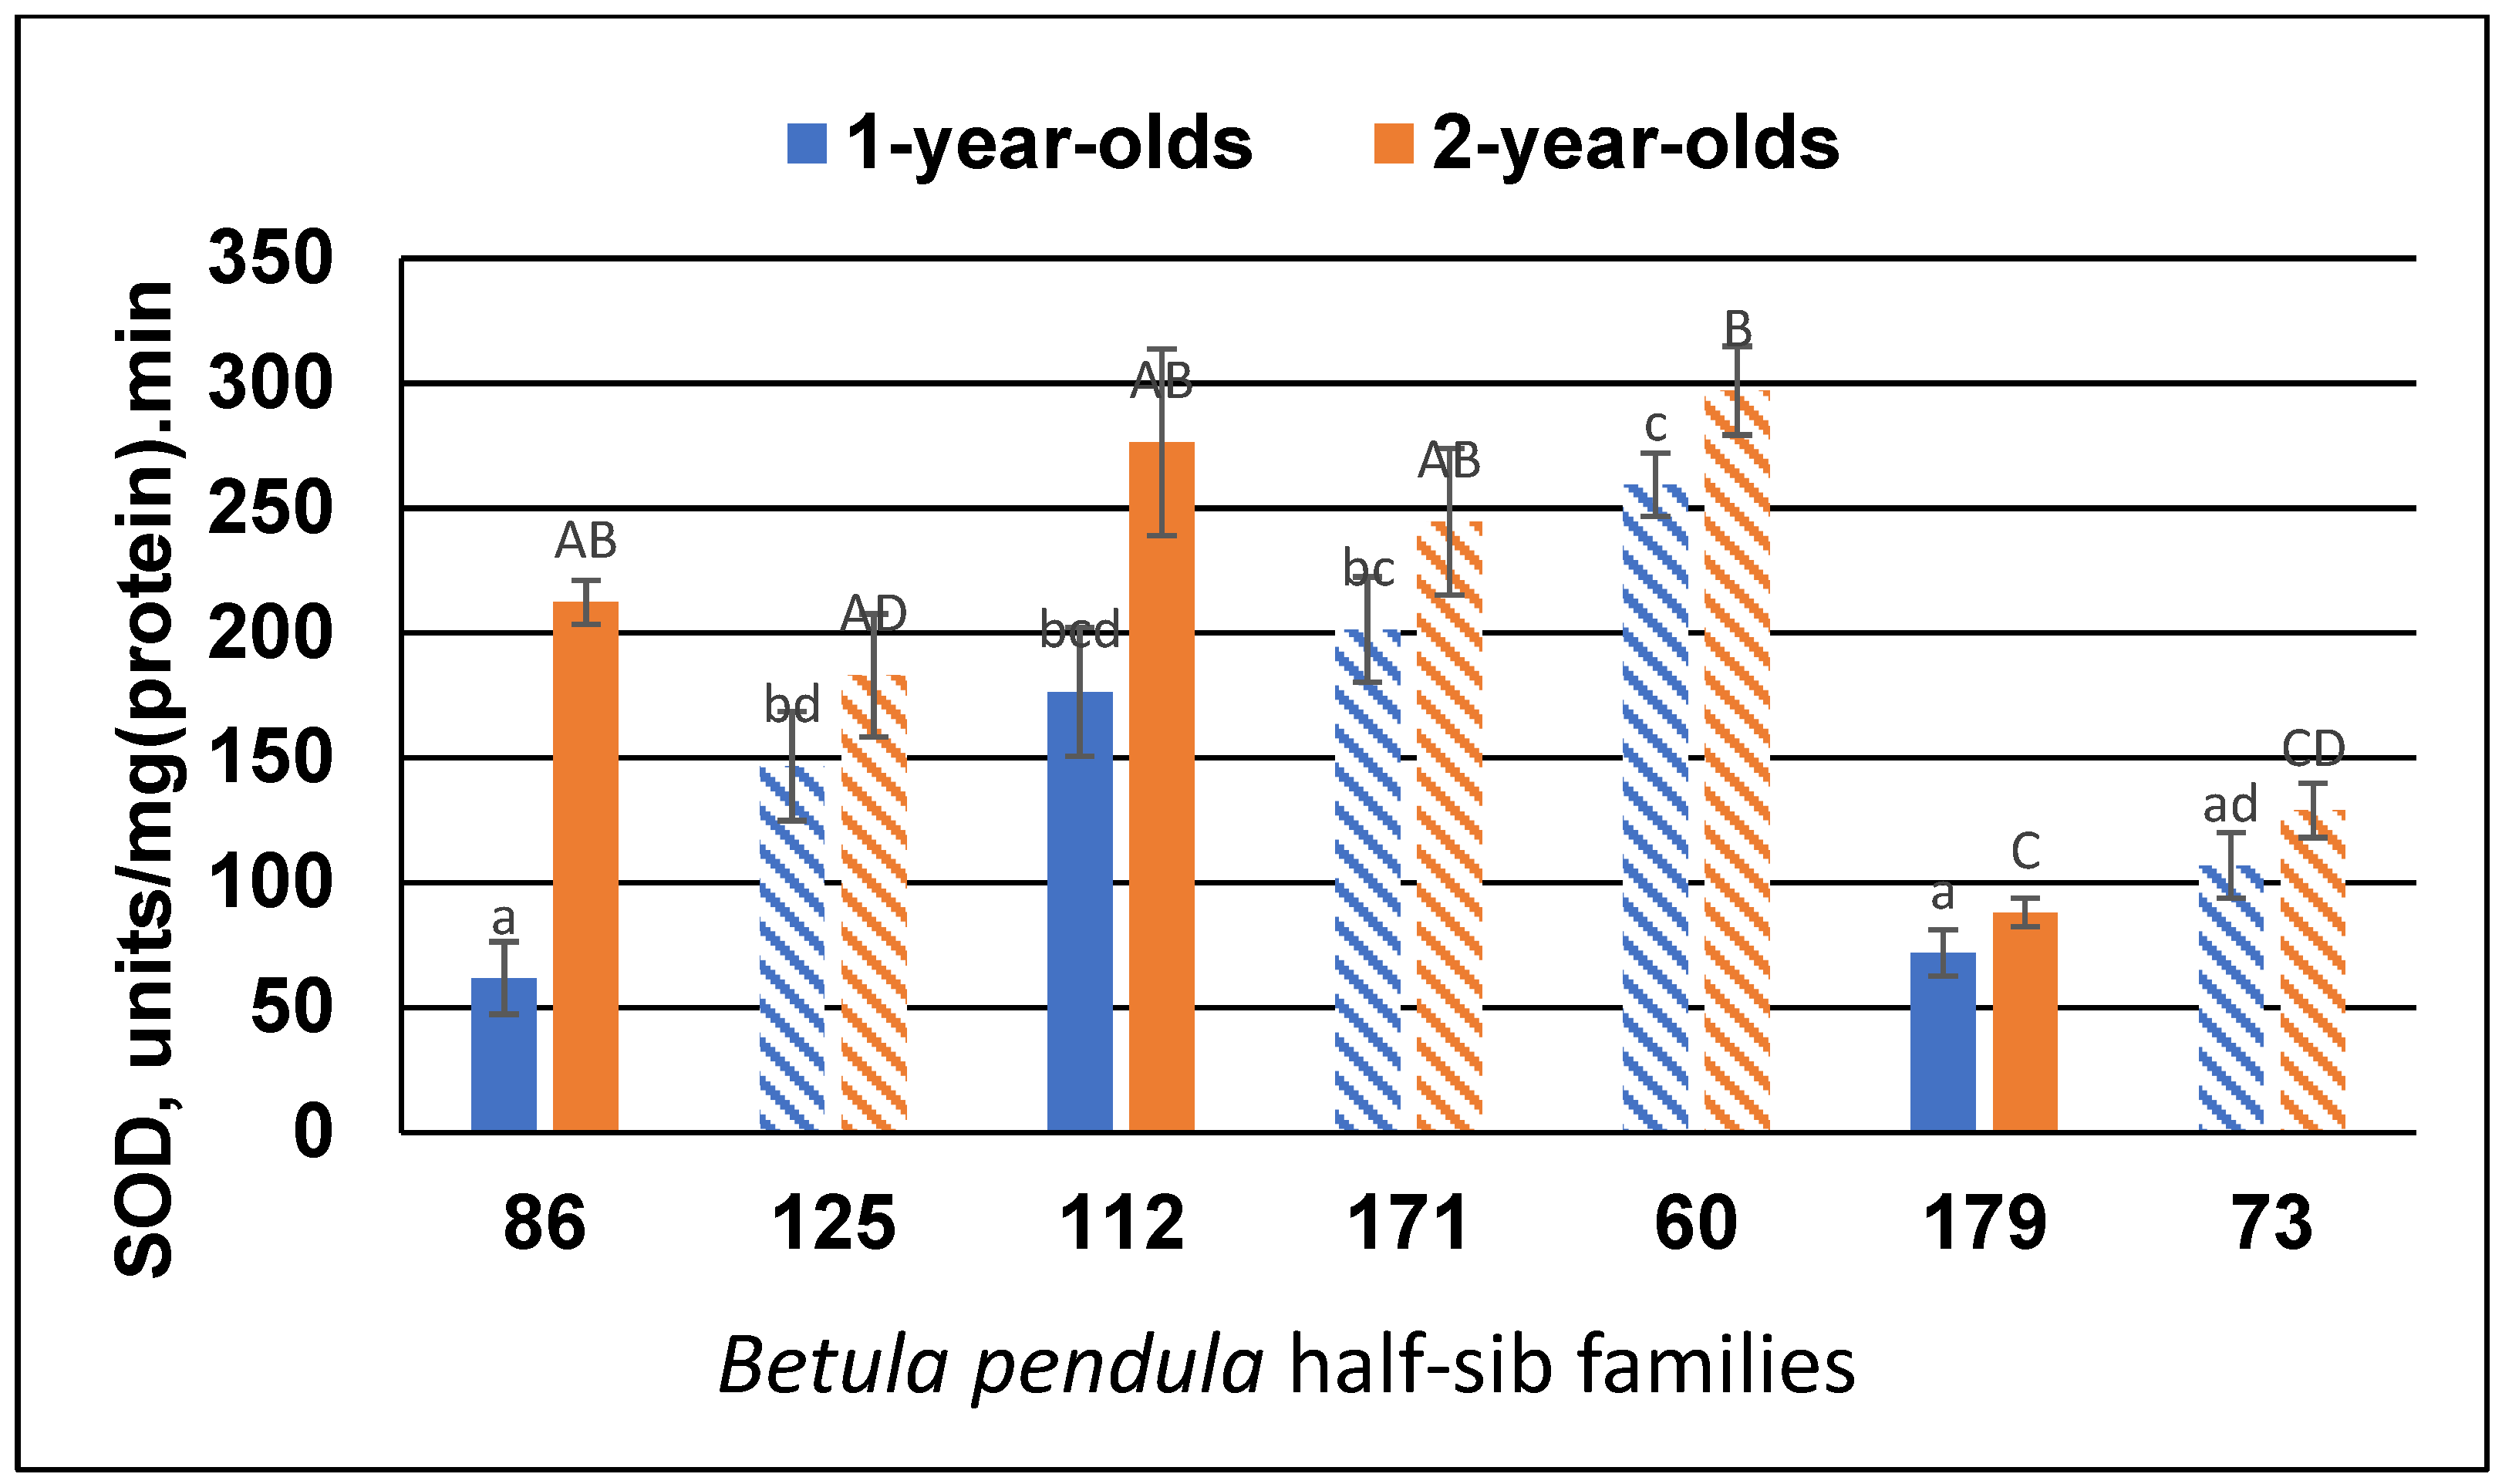
2.4.3. Superoxide Dismutase Analysis

The mixture consisted of 20 µL of the extract (before filtering) and 180 µL of the reagent as described by Čėsnienė et al. [27]. In order to activate the SOD radicals for this analysis, intense light was used (white light, irradiance 30 μmol m−2 s−2). The absorbance was measured at 550 nm. Based on the total protein concentration in the tissue, SOD activity was converted to its activity in the fresh biomass [27].

2.4.4. Catalase Analysis

The reaction mixture was composed of 20 µL of the extract (before filtering), 170 µL of K-phosphate buffer, and 10 µL of H2O2 solution. Analysis was performed immediately. Measurements of the change in CAT activity were taken at 240 nm 6 times every 35 s. Based on the total protein concentration in the leaf tissue, CAT activity was converted to its activity in fresh biomass [26].

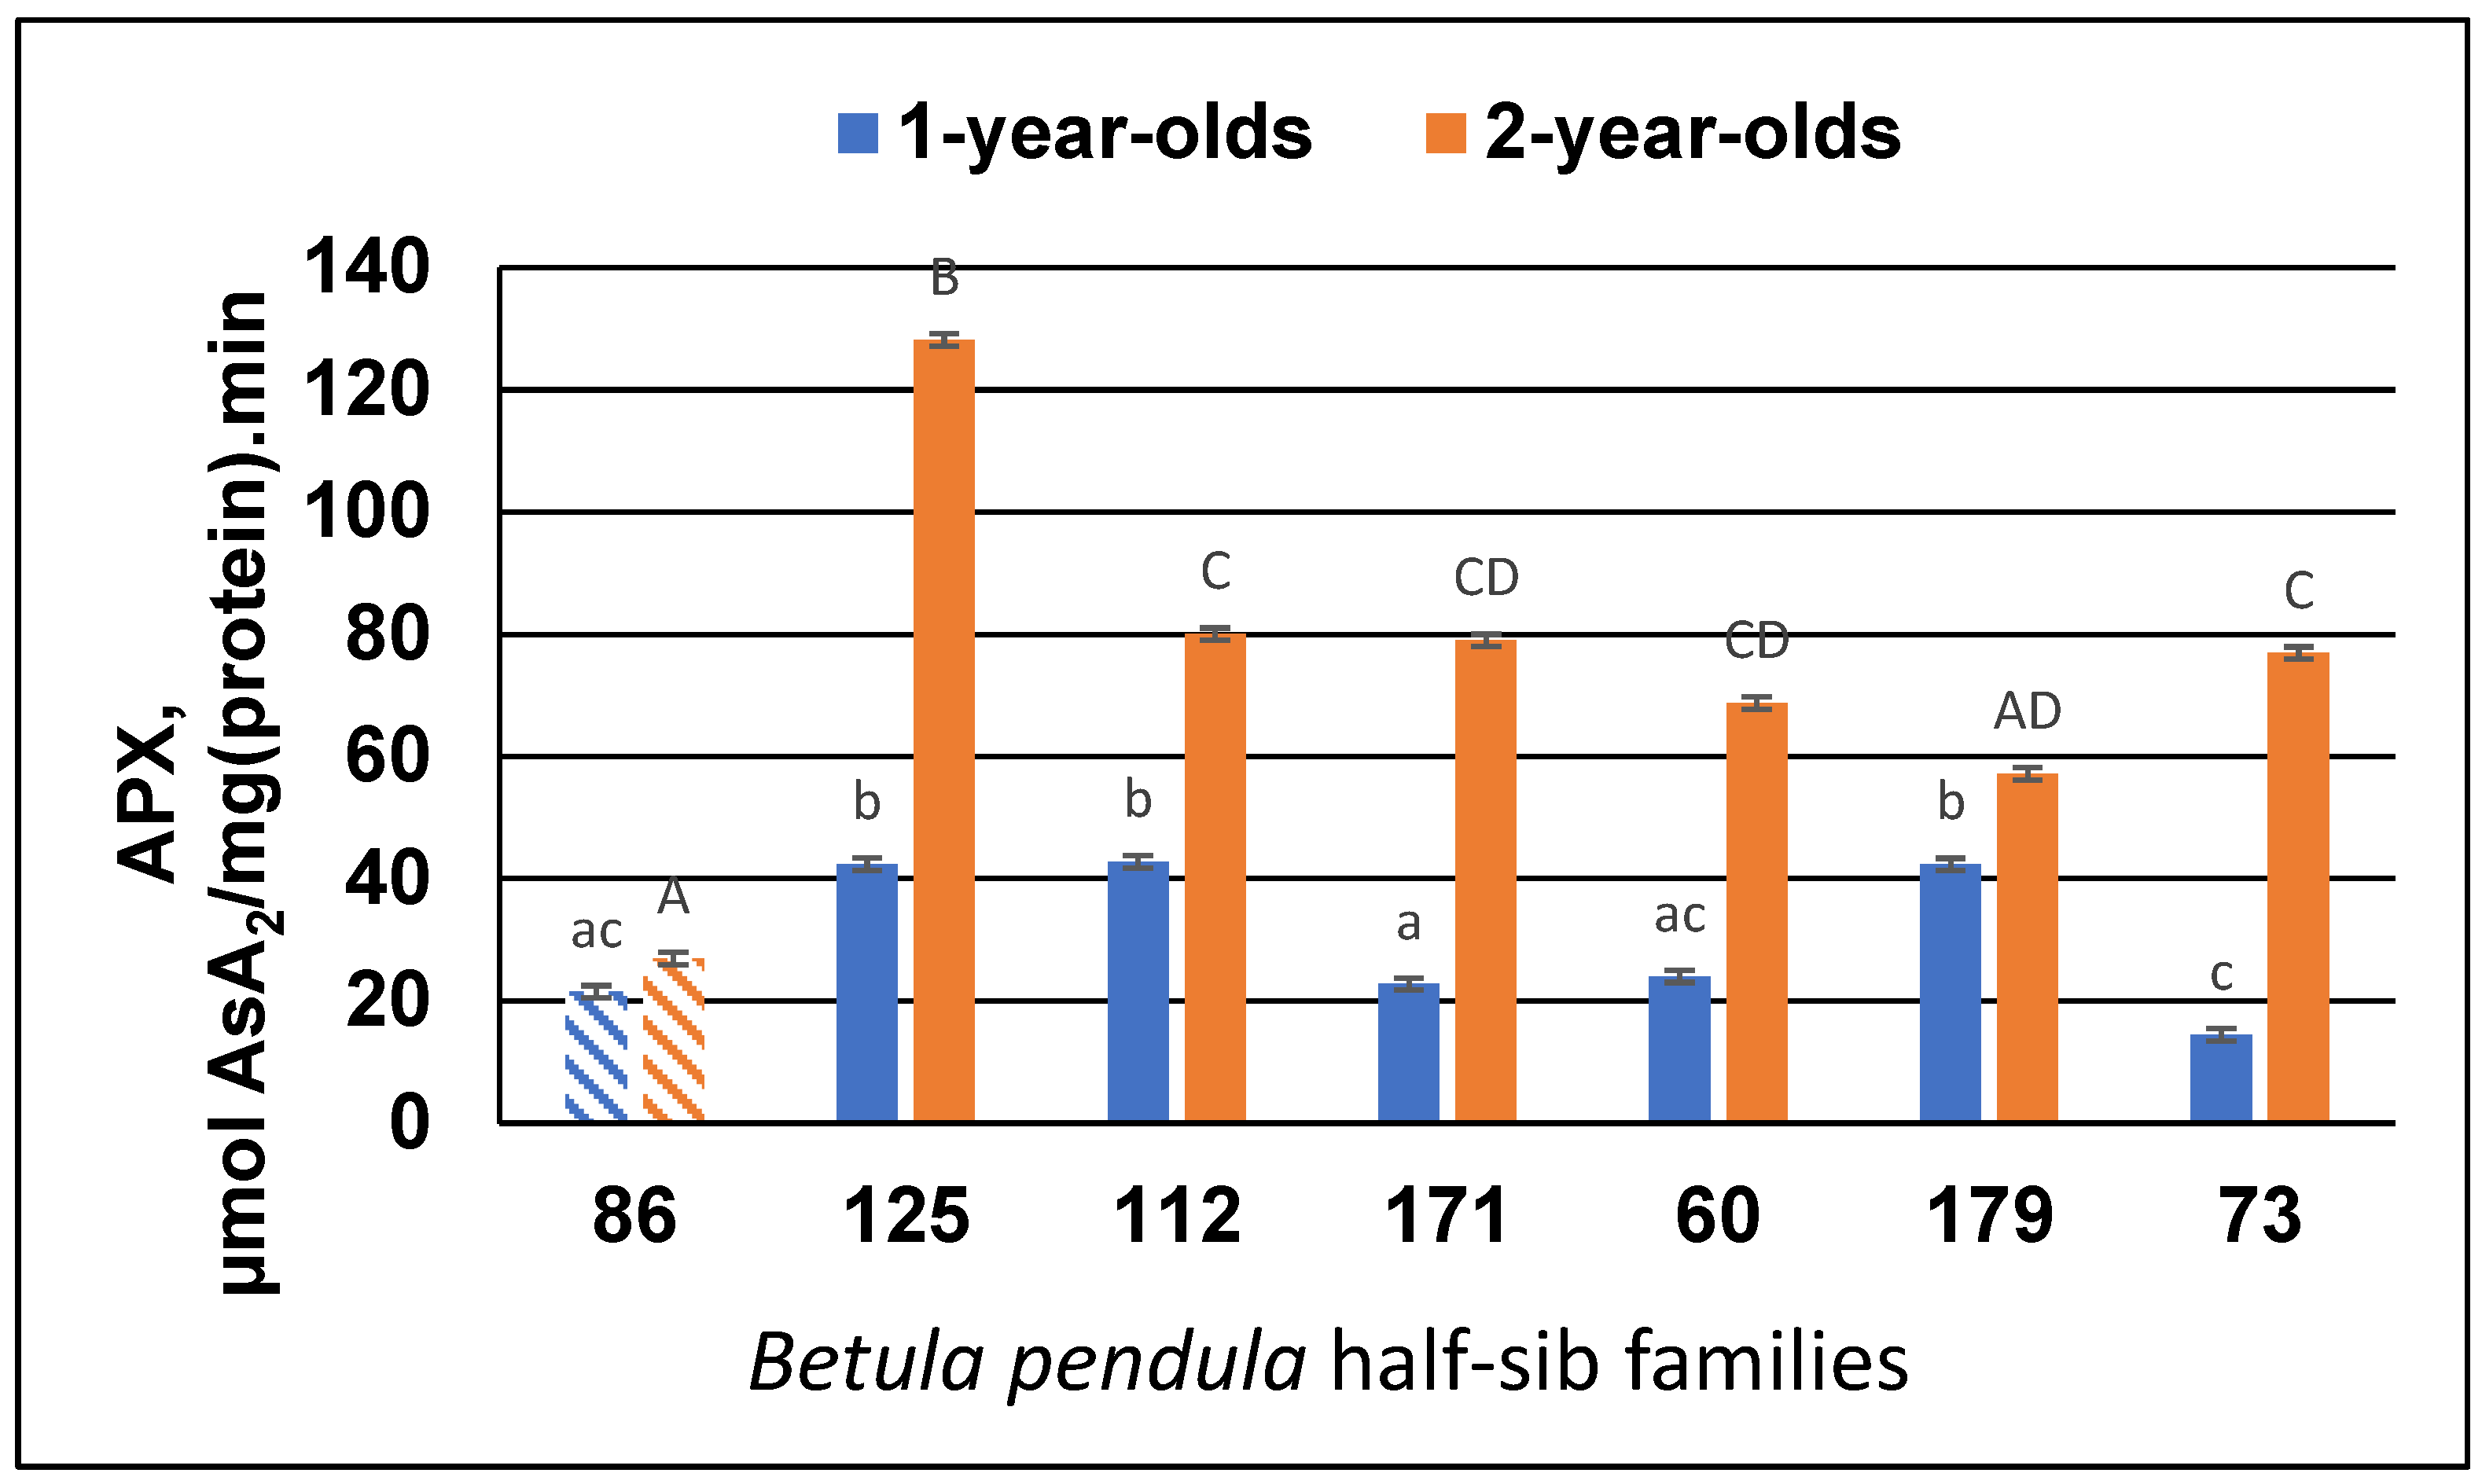
2.4.5. Ascorbate Peroxidase Analysis

The reaction mixture was composed of 20 µL of the extract (after filtering), 170 µL of reagent, and 10 µL of H2O2 solution. Analysis was performed immediately. Measurements of the change in APX activity were taken at 290 nm 6 times every 35 s. Based on the total protein concentration in the leaf tissue, APX activity was converted to its activity in the fresh biomass [26].

2.4.6. Peroxidase Analysis

The reaction mixture was composed of 20 µL of the extract (after filtering), 170 µL of reagent, and 10 µL of H2O2 solution. Analysis was performed immediately. Measurements of the change in POX activity were taken at 430 nm 6 times every 35 s. Based on the total protein concentration in the leaf tissue, POX activity was converted to its activity in the fresh biomass [26].

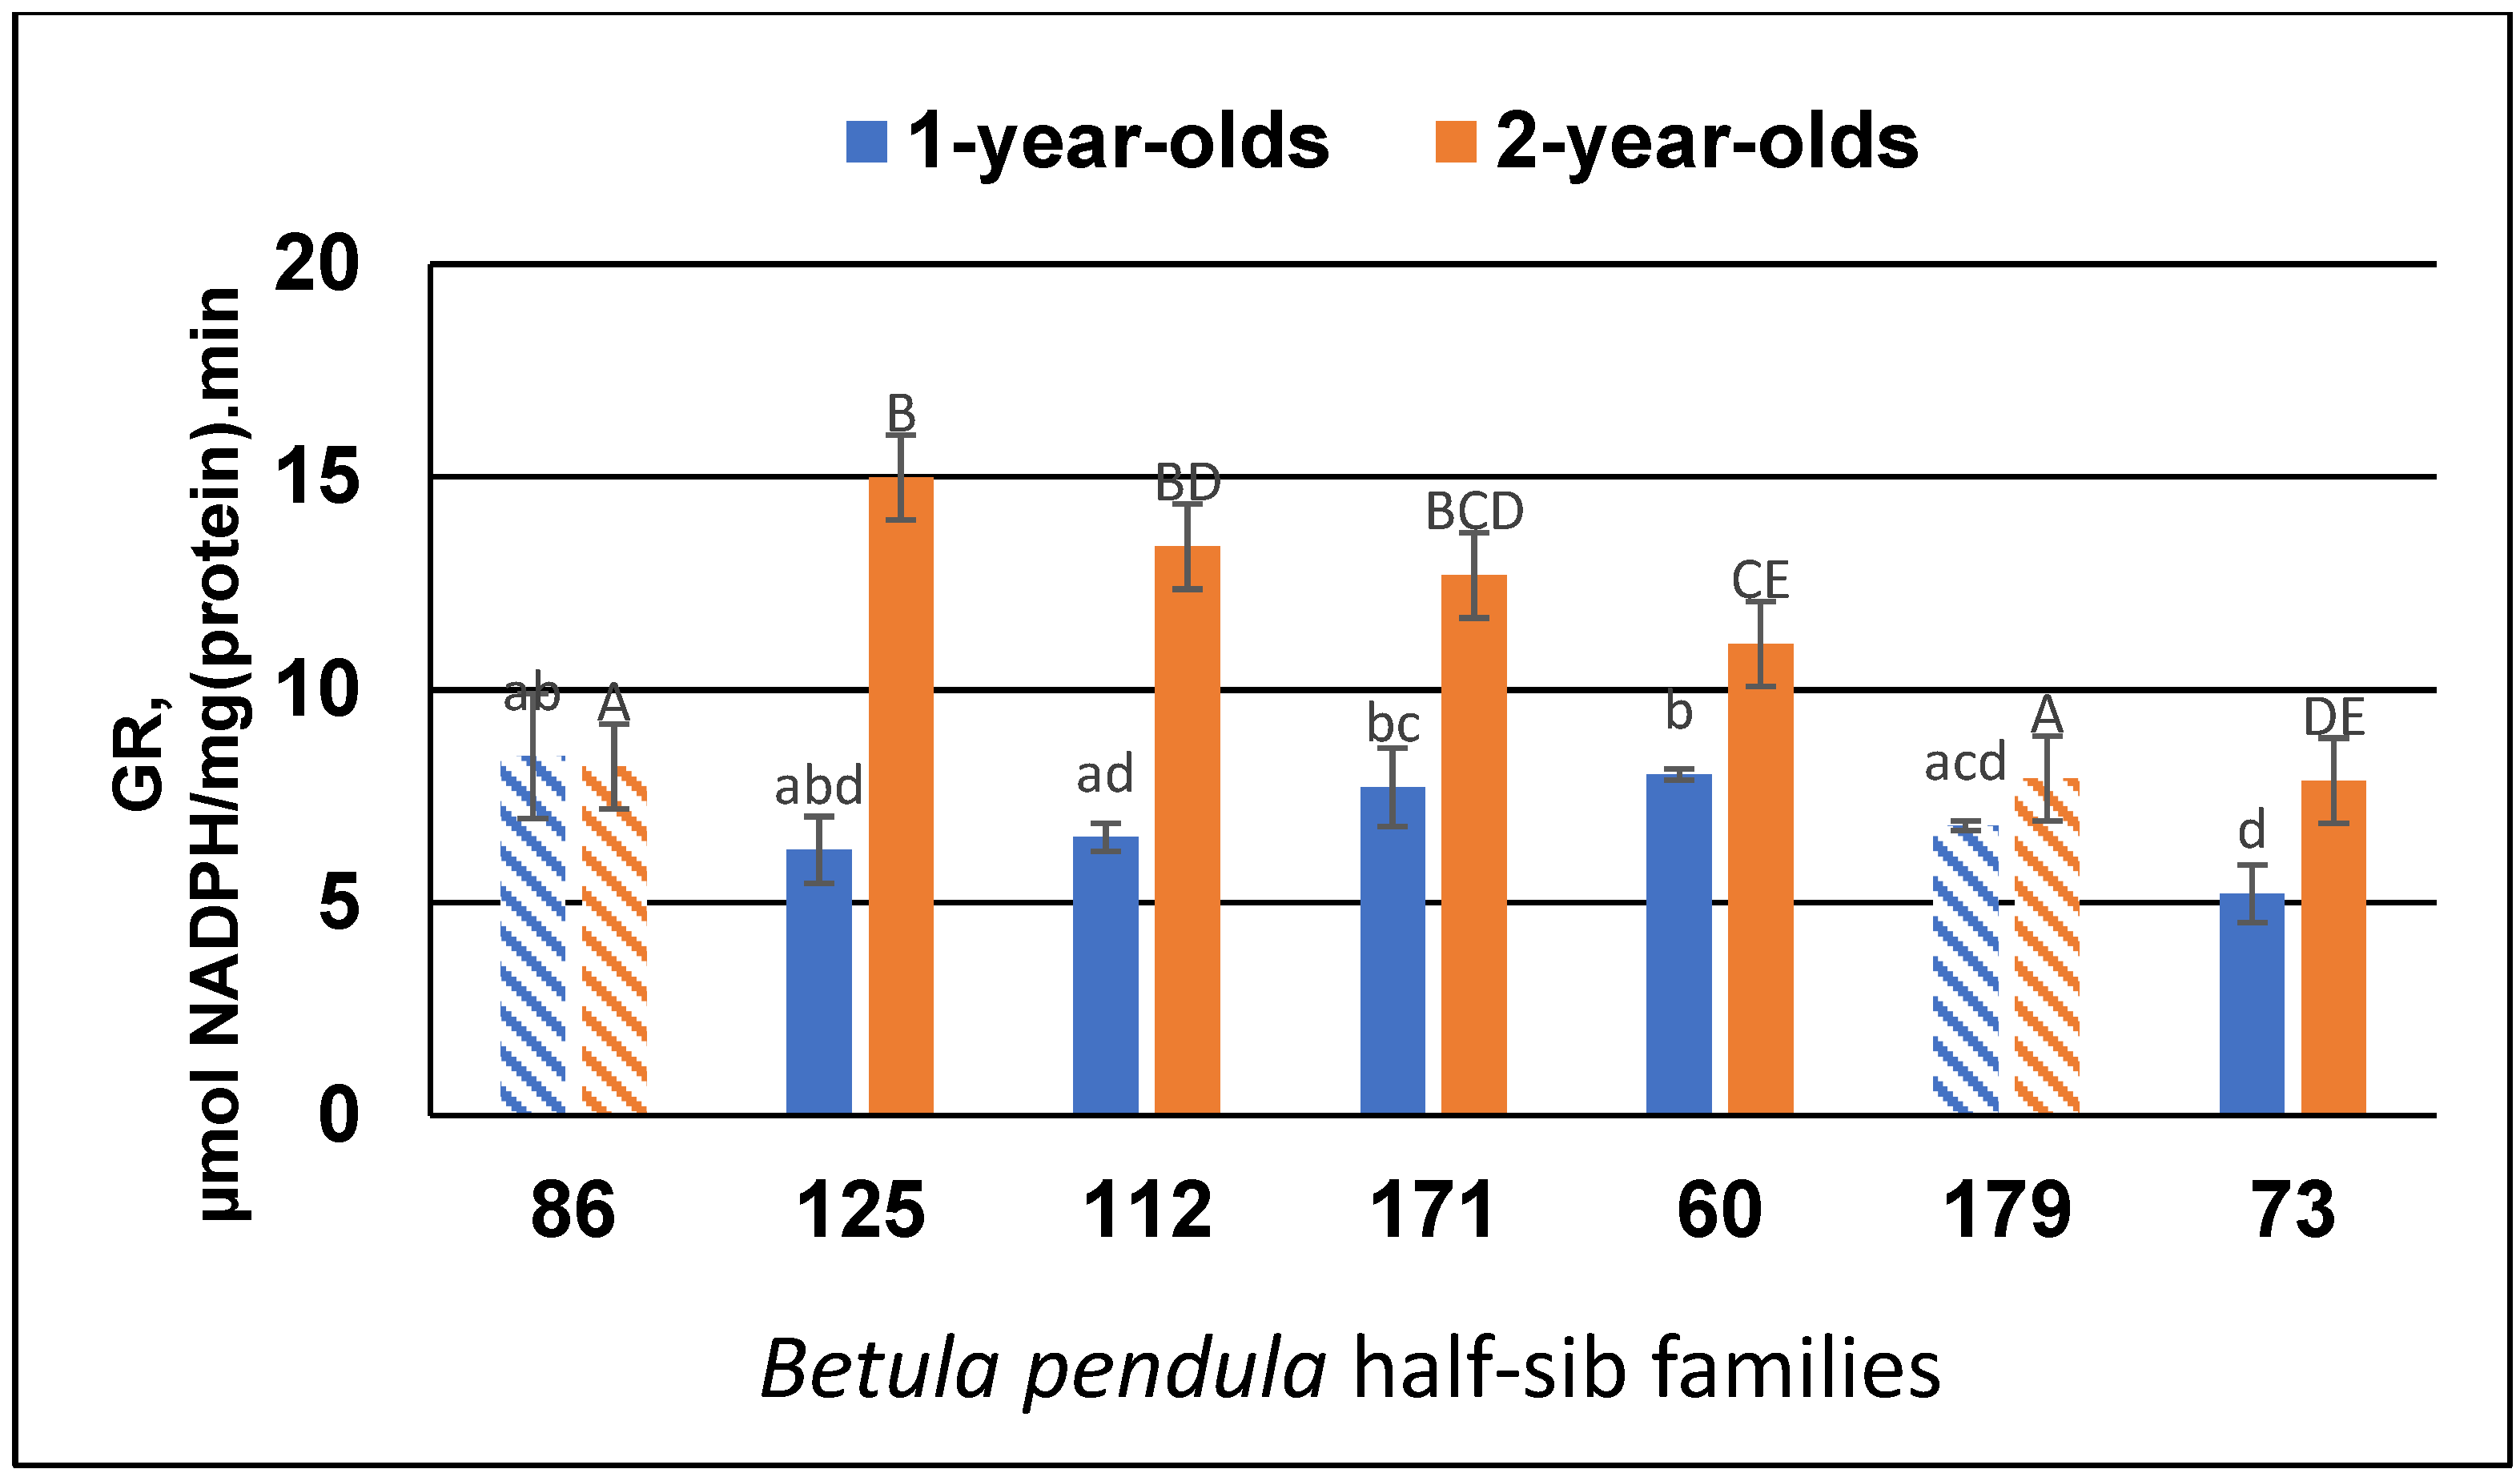
2.4.7. Glutathione Reductase Analysis

The reaction mixture was composed of 20 µL of the extract (after filtering), 160 µL of reagent, and 20 µL of 20 mM oxidized L-Glutathione substrate. Analysis was performed immediately. Measurements of the change in GR activity were taken at 340 nm 6 times every 35 s. Based on the total protein concentration in the leaf tissue, GR activity was converted to its activity in the fresh biomass [26].

2.5. Statistical Analysis

To compare the mean ranks of the groups, we used the Kruskal–Wallis H test to check for significant differences. For pairwise comparisons, we employed the post hoc Dunn’s test, conducted using SPSS version 28.0.1.1 (IBM Inc., Armonk, NY, USA). The significance level was set at 0.05, and the confidence level was set at 95%. Significance values were adjusted using the Bonferroni correction for multiple comparisons.

3. Results

3.1. Height and TPC

Over one vegetative season, the birch height increased from 54% to 166%, with an average of 126% across the seven tested groups. The relative increases were genotype-dependent, with the lowest increase in family 171 and the highest in family 179 (Figure 1). During 1 year, trees from family 86 grew on average by 14.1, 125–19.7, 112–24.3, 171–11.6, 60–18.3, 179–19.6, and 73–26.6 cm. As can be seen, differences between families within the 1st (Figure 1 and Figure 2) and 2nd (Figure 1) growing seasons can also be observed.
A similar trend of overall relative increase could also be seen in the levels of TPC, ranging from 46% to 189%, with an average of 120%. More specifically, the amounts of TPC varied between 2.6 and 4.9 mg/g of fresh weight in the first year and between 7.1 and 10.5 mg/g of fresh weight in the second year. Again, while the increase in phenolics was observed in all the half-sib families, there was a notable difference among them. Family 86 exhibited the lowest increase and family 112 exhibited the highest (Figure 3). Moreover, the variance between families can be noted too, with trees from family 86 enhancing TPC production on average by 2.2, 125–6.5, 112–5.4, 171–2.9, 60–4.7, 179–3.5, and 73–2.7 mg/g of fresh weight.

3.2. Antioxidant Enzyme Activity

While the data from growth and TPC showed a significant deviation between the vegetative seasons (bold colors in Figure 4, Figure 5, Figure 6, Figure 7 and Figure 8 indicate a significant difference (p < 0.05) between 1st years and 2nd years/vegetative seasons), the same trend was not always statistically significant, though still mostly true in the case of the tested enzyme (SOD, CAT, POX, APX, and GR) activity (Figure 4, Figure 5, Figure 6, Figure 7 and Figure 8). It is also worth noting that the level in TPC and enzyme activity was not always highest in the same families during the two vegetative seasons.
The overall SOD levels were always higher during the second season. The enzyme levels relatively increased ranging anywhere from 15% to 243%. The amounts of SOD varied between 61.9 and 259.3 units in the first year and between 88.1 and 297.1 units in the second year. The average increase was 42.5 units. Family 86 exhibited the highest boost and family 60 exhibited the lowest (Figure 4). The average increase was 58%; however, most tested half-sib families were within the lower 20% limits. Trees from family 86 produced on average 150.5, 125–36.3, 112–99.9, 171–43.2, 60–37.7, 179–16.1, and 73–22.1 units more of SOD than the previous year. Significant changes between the seasons were observed in three families—86, 112, and 179. Still, the variation within the same season between the families was notable as well, indicating a strong genetic component.
CAT enzyme levels also increased in all the 7 tested half-sib families, but only in 5 of them significantly so (Figure 5). In family 125, CAT levels increased by 17.2; in family 112, by 13.1; in family 171, by 7.9; in family 60, by 2.9; and in family 73, by 8.9 µmols. The escalation in CAT activity ranged from 13% to 165%, with an average relative increase of 68%. The amounts of CAT varied between 9.4 and 14.8 µmols in the first year and between 13.7 and 27.6 µmols in the second year. The largest change was noted in family 125, and the smallest was noted in family 179. A divergence between families was again shown.
APX activity was also elevated in the second growing season in all the families (Figure 6). Though an increase of 25% in family 86 was non-significant, the total relative increase was 173% on average and ranged from 25% to a staggering 431% in family 73. The amounts of APX varied between 14.5 and 42.8 µmols in the first year and between 27.0 and 128.2 µmols in the second year. Genetic divergence could once more be observed: in family 125, the amount increased by 85.8 µmols, and in families 112, 171, 60, 179, and 73, it increased by 37.3, 56.2, 44.7, 14.8, and 62.5 µmols.
Interestingly, while the TPC, SOD, CAT, and APX data suggested a steady increase in antioxidant enzyme activity levels with age, POX and GR data were less unilateral. POX levels decreased in families 86 (by 28%), 171 (16%), 60 (24%), and 179 (39%) and increased in 125 (47%), 112 (36%), and 73 (21%) (Figure 7). However, any significant change between growing seasons was only observed in families 125, 112, 60, and 179. The overall amounts of POX varied between 3.2 and 5.4 µmols in the first year and between 2.7 and 6.3 µmols in the second year. Yet again, genotype differences remained obvious.
As with the POX results, GR levels were also less even across the board. In family 86, a small 3% decrease could be observed, though it was insignificant. The other six tested birch half-sib families exhibited an increase in GR levels ranging from 16% to 140%, with an average increase of 69% (Figure 8). The amounts of GR varied between 5.2 and 8.4 µmols in the first year and between 7.9 and 15.0 µmols in the second year. Moreover, divergence at the family level could be observed too.

4. Discussion

The findings of an extensive study on how tree age affects the chemical composition of silver birch wood resulted in the conclusion that tree age significantly affects the contents of cellulose, pentosans, ash, and substances soluble in 1% NaOH [28]. While the current study did not focus on these compounds, similar results were achieved. As silver birch is utilized by various industries, understanding its chemical composition in relation to tree age has potential practical significance for its future applications—an idea commonly shared by the aforementioned researchers [28]. Further data on other tree species like pine, walnut, pink cedar, and beech also exhibit an age-linked differentiation in the production of secondary metabolites, like phenol compounds and antioxidants [29,30,31,32].
Moreover, this study showcased that different silver birch genetic families expressed varied levels of antioxidant enzymes and phenolics as well. As phenolic compounds are produced by plants to protect themselves against stressors of both abiotic and biotic nature [19], using trees with enhanced production would likely be beneficial in forestry. Phenol levels are linked with adaptation to climate change, pest/pathogen attacks and pollution. A study on Pinus sylvestris L. from 13 provenances indicated that there was significant variation in how different pine genotypes responded to pollution generated by fertilizer production [33]. Furthermore, a recent study on pine pathogen Heterobasidion annosum (Fr.) Bref. showed that there was a strong positive correlation between the resistance index and TPC concentration (r = 0.77, p = 0.0003), suggesting a direct link between plant resistance and TPC synthesis [24]. A study on silver birch also showcased that phenolics increased as a result of increased UV-B radiation, which, while not affecting growth initially (1st and 2nd growth seasons as opposed to the 3rd year), induced quercetin glycoside production in the 1st year and phenolic acid production in the 2nd [13]. Moreover, higher phenolics were further linked with heightened CO2 levels in B. pendula [14]. These results indicate that all the aforementioned stressors can be reliably linked to the production of enhanced antioxidants, specifically phenol compounds. As such, selecting tree genotypes with elevated phenol production capabilities might lead to better outcomes in terms of more resilient future forests.
Other potential areas, in which such data would be beneficial, are the pharmaceutical and nutraceutical industries, as well as cosmetics [1,7,8,10,15,34]. In this context, antioxidant production variations are of significant importance. Study results on the impact of cold plasma on antioxidant and phenol production in Picea abies (L.) H. Karst showed that certain phenolic acids and antioxidant activity overall increased or decreased in different tested half-sib families to varied degrees [35]. A similar antioxidant production dependency on tree genotype was also achieved for oak (Quercus robur L.) bark [36]. Muilerburg et al. demonstrated that different silver birch genotypes differed significantly in catechin, procyanidin trimer, and centrolobol glycoside production [9]. As an example, catechins are known to be powerful antioxidants. They have demonstrated positive antimicrobial, antiviral, anti-inflammatory, antiallergenic, and anticancer effects. Catechins were also shown to improve the penetration and absorption of functional foods and cosmetics into the body and skin, enhancing their effectiveness. Ongoing research into the potent antioxidant properties of catechins is expected to lead to significant advancements in the food, cosmetics, and pharmaceutical industries [37].
This was showcased by a recent study on olive trees by Mougiou et al. The levels of SOD were shown to be different after 4 days of cold stress in two tested varieties [38]. Similarly, Beniušytė et al. demonstrated a genotype-dependent response to jasmonic acid application. This resulted in varied antioxidant enzyme (POX, CAT, APX, GR) productions by the tested P. sylvestris seedlings [26].
As oxidative damage is one of the major indicators of stress, antioxidant enzyme production is of great consequence as well [29,39]. As noted for phenolics, data suggest that both genotype and age influence antioxidant enzyme production in silver birch. In most cases, this impact was positive. The work of Wieser et al. concluded that “…differences in the response to oxidative stress may be attributed to age…” in their study on Fagus sylvatica L. Furthermore, they suggested that it specifically increased with age [29]. A study by Turfan et al. showed that significant age-related differences in the chemical composition of Anatolian black pine (Pinus nigra subsp. pallasiana) needles were identified. Overall, the findings revealed that Anatolian black pine trees over 500 years old had the highest concentrations of APX, CAT, and SOD enzymes as opposed to pines of 200, 100, 50, and 25 years old [31]. On the other hand, in a later study on Juglans regia L., the results were opposite. The SOD concentration decreased with increasing age, while APX and CAT levels did not exhibit a trend either way [30]. Thus, while our study suggests that older trees may have higher levels of antioxidants, it is important to understand that this is not necessarily true for all tree species or all tree organs [30,32]. Also, our data cover only a relatively short period of time; thus, future studies should take all this into account.

5. Conclusions

All in all, the current study clearly shows that B. pendula phenol compound production and antioxidative enzyme synthesis are both age-dependent and genotype-dependent, regarding the first two years of the silver birch’s life. These data could prove beneficial in various research fields, ranging from climate change to cosmetics, where one could feasibly pick and choose which genotypes to use for a desired result. In terms of age, older birches produced more antioxidant compounds and, in terms of genotype, half-sib families 125 and 112 appeared to be the most productive, while family 112 also produced a relatively larger amount of biomass at the same time. Thus, it is recommended that future research in relevant fields take the genetic and age data into account.

Author Contributions

Conceptualization, V.S.-Š. and I.Č.; methodology, V.S.-Š. and I.Č.; software, I.Č. and D.V.; validation, V.S.-Š., I.Č. and D.V.; formal analysis, I.Č. and D.V.; investigation, I.Č.; resources, V.S.-Š. and I.Č.; data curation, I.Č. and D.V.; writing—original draft preparation, V.S.-Š., I.Č. and D.V.; writing—review and editing, V.S.-Š., I.Č. and D.V.; visualization, I.Č. and D.V.; supervision, V.S.-Š. All authors have read and agreed to the published version of the manuscript.

Funding

This research received no external funding.

Data Availability Statement

Data will be made available upon request.

Conflicts of Interest

The authors declare no conflicts of interest.

References

  1. Rastogi, S.; Pandey, M.M.; Rawat, A.K.S. Medicinal plants of the genus Betula—Traditional uses and a phytochemical-pharmacological review. J. Ethnopharmacol. 2015, 159, 62–83. [Google Scholar] [CrossRef] [PubMed]
  2. Hynynen, J.; Niemistö, P.; Viherä-Aarnio, A.; Brunner, A.; Hein, S.; Velling, P. Silviculture of birch (Betula pendula Roth and Betula pubescens Ehrh.) in Northern Europe. Forestry 2010, 83, 103–119. [Google Scholar] [CrossRef]
  3. Vanhellemont, M.; Van Acker, J.; Verheyen, K. Exploring life growth patterns in birch (Betula pendula). Scand. J. For. Res. 2016, 31, 561–567. [Google Scholar] [CrossRef]
  4. Jonczak, J.; Jankiewicz, U.; Kondras, M.; Kruczkowska, B.; Oktaba, L.; Oktaba, J.; Olejniczak, I.; Pawłowicz, E.; Polláková, N.; Raab, T.; et al. The influence of birch trees (Betula spp.) on soil environment—A review. For. Ecol. Manag. 2020, 477, 118486. [Google Scholar] [CrossRef]
  5. Lewis, J.; Qvarfort, U.; Sjöström, J. Betula pendula: A promising candidate for phytoremediation of tce in northern climates. Int. J. Phytoremediation 2015, 17, 9–15. [Google Scholar] [CrossRef]
  6. Dubois, H.; Verkasalo, E.; Claessens, H. Potential of birch (Betula pendula Roth and B. pubescens Ehrh.) for forestry and forest-based industry sector within the changing climatic and socio-economic context of western Europe. Forests 2020, 11, 336. [Google Scholar] [CrossRef]
  7. Nagybakay, N.E.; Sarapinaite, L.; Syrpas, M.; Venskutonis, P.R.; Kitryte-Syrpa, V. Optimization of pressurized ethanol extraction for efficient recovery of hyperoside and other valuable polar antioxidant-rich extracts from Betula pendula Roth leaves. Ind. Crop Prod. 2023, 205, 117565. [Google Scholar] [CrossRef]
  8. Germanò, M.; Cacciola, F.; Donato, P.; Dugo, P.; Certo, G.; D’Angelo, V.; Mondello, L.; Rapisarda, A. Betula pendula leaves: Polyphenolic characterization and potential innovative use in skin whitening products. Fitoterapia 2012, 83, 877–882. [Google Scholar] [CrossRef]
  9. Muilenburg, V.L.; Phelan, P.L.; Bonello, P. Inter- and intra-specific variation in stem phloem phenolics of paper birch (Betula papyrifera) and European white birch (Betula pendula). J. Chem. Ecol. 2011, 37, 1193–1202. [Google Scholar] [CrossRef]
  10. Dehelean, C.A.; Şoica, C.; Ledeţi, I.; Aluaş, M.; Zupko, I.; Gǎluşcan, A.; Cinta-Pinzaru, S.; Munteanu, M. Study of the betulin enriched birch bark extracts effects on human carcinoma cells and ear inflammation. Chem. Cent. J. 2012, 6, 137. [Google Scholar] [CrossRef]
  11. Kuparinen, A.; Savolainen, O.; Schurr, F.M. Increased mortality can promote evolutionary adaptation of forest trees to climate change. For. Ecol. Manag. 2010, 259, 1003–1008. [Google Scholar] [CrossRef]
  12. Heimonen, K.; Valtonen, A.; Kontunen-Soppela, S.; Keski-Saari, S.; Rousi, M.; Oksanen, E.; Roininen, H. Insect herbivore damage on latitudinally translocated silver birch (Betula pendula)—Predicting the effects of climate change. Clim. Change 2015, 131, 245–257. [Google Scholar] [CrossRef]
  13. Tegelberg, R.; Julkunen-Tiitto, R.; Aphalo, P.J. The effects of long-term elevated UV-B on the growth and phenolics of field-grown silver birch (Betula pendula). Glob. Chang. 2001, 7, 839–848. [Google Scholar] [CrossRef]
  14. Kuokkanen, K.; Julkunen-Tiitto, R.; Keinänen, M.; Niemelä, P.; Tahvanainen, J. The effect of elevated CO2 and temperature on the secondary chemistry of Betula pendula seedlings. Trees 2001, 15, 378–384. [Google Scholar] [CrossRef]
  15. Ostapiuk, A.; Kurach, Ł.; Strzemski, M.; Kurzepa, J.; Hordyjewska, A. Evaluation of antioxidative mechanisms in vitro and triterpenes composition of extracts from silver birch (Betula pendula Roth) and black birch (Betula obscura Kotula) barks by FT-IR and HPLC-PDA. Molecules 2021, 26, 4633. [Google Scholar] [CrossRef] [PubMed]
  16. Laitinen, M.; Julkunen-Tiitto, R. Variation in birch (Betula pendula) Shoot secondary chemistry due to genotype, environment, and ontogeny. J. Chem. Ecol. 2005, 31, 697–717. [Google Scholar] [CrossRef] [PubMed]
  17. Liimatainen, J.; Karonen, M.; Sinkkonen, J. Phenolic compounds of the inner bark of Betula pendula: Seasonal and genetic variation and induction by wounding. J. Chem. Ecol. 2012, 38, 1410–1418. [Google Scholar] [CrossRef] [PubMed]
  18. Likhanov, A.F.; Vasylyshyn, R.D.; Marchuk, Y.M.; Kurdyuk, O.M.; Honchar, H.Y. Consistency of phenolic profiles with taxonomic distribution and adaptation of birch species (Betula L.) to environmental conditions. Botany 2023, 101, 400–413. [Google Scholar] [CrossRef]
  19. Nurzynska-Wierdak, R. Phenolic compounds from new natural sources—Plant genotype and ontogenetic variation. Molecules 2023, 28, 1731. [Google Scholar] [CrossRef]
  20. Laitinen, M.; Julkunen-Tiitto, R. Variation in phenolic compounds within a birch (Betula pendula) population. J. Chem. Ecol. 2000, 26, 1609–1622. [Google Scholar] [CrossRef]
  21. Gill, S.S.; Tuteja, N. Reactive oxygen species and antioxidant machinery in abiotic stress tolerance in crop plants. Plant Physiol. Biochem. 2010, 48, 909–930. [Google Scholar] [CrossRef] [PubMed]
  22. Sharma, P.; Jha, A.B.; Dubey, R.S.; Pessarakli, M. Reactive oxygen species, oxidative damage, and antioxidative defense mechanism in plants under stressful conditions. J. Bot. 2012, 2012, 217037. [Google Scholar] [CrossRef]
  23. Mutikainen, P.; Walls, M.; Ovaska, J.; Keinanen, M.; Julkunen-Tiitto, R.; Vapaavuori, E. Herbivore resistance in Betula pendula: Effect of fertilization, defoliation, and plant genotype. Ecology 2000, 81, 49–65. [Google Scholar] [CrossRef]
  24. Marčiulynas, A.; Sirgedaitė-Šėžienė, V.; Žemaitis, P.; Jansons, Ā.; Baliuckas, V. Resistance of Scots pine half-sib families to Heterobasidion annosum in progeny field trials. Silva Fenn. 2020, 54, 10276. [Google Scholar] [CrossRef]
  25. Paaso, U.; Keski-Saari, S.; Keinänen, M.; Karvinen, H.; Silfver, T.; Cole, C.T. Intrapopulation genotypic variation of foliar secondary chemistry during leaf senescence and litter decomposition in silver birch (Betula pendula). Front. Plant Sci. 2017, 8, 1–14. [Google Scholar] [CrossRef] [PubMed]
  26. Beniušytė, E.; Čėsnienė, I.; Sirgedaitė-Šėžienė, V.; Vaitiekūnaitė, D. Genotype-dependent jasmonic acid effect on Pinus sylvestris L. growth and induced systemic resistance indicators. Plants 2023, 12, 255. [Google Scholar] [CrossRef] [PubMed]
  27. Čėsnienė, I.; Miškelytė, D.; Novickij, V.; Mildažienė, V.; Sirgedaitė-Šėžienė, V. Seed treatment with electromagnetic field induces different effects on emergence, growth and profiles of biochemical compounds in seven half-sib families of silver birch. Plants 2023, 12, 3048. [Google Scholar] [CrossRef] [PubMed]
  28. Lachowicz, H.; Wróblewska, H.; Wojtan, R.; Sajdak, M. The effect of tree age on the chemical composition of the wood of silver birch (Betula pendula Roth.) in Poland. Wood Sci. Technol. 2019, 53, 1135–1155. [Google Scholar] [CrossRef]
  29. Wieser, G.; Hecke, K.; Tausz, M.; Häberle, K.-H.; Grams, T.E.E.; Matyssek, R. The influence of microclimate and tree age on the defense capacity of European beech (Fagus sylvatica L.) against oxidative stress. Ann. For. Sci. 2003, 60, 131–135. [Google Scholar] [CrossRef]
  30. Turfan, N.; Savaci, G.; Sariyildiz, T. Variation in chemical compounds of walnut (Juglans regia L.) leaves with tree age. Artvin Çoruh Üniv. Orman. Fak. Derg. 2020, 21, 124–134. [Google Scholar] [CrossRef]
  31. Turfan, N.; Alay, M.; Sariyildiz, T. Effect of tree age on chemical compounds of ancient anatolian black pine (Pinus nigra subsp. pallasiana) needles in Northwest Turkey. IForest 2018, 11, 406–410. [Google Scholar] [CrossRef]
  32. Rosales-Castro, M.; Honorato-Salazar, J.A.; Reyes-Navarrete, M.G.; González-Laredo, R.F. Antioxidant phenolic compounds of ethanolic and aqueous extracts from pink cedar (Acrocarpus fraxinifolius Whight & Arn.) bark at two tree ages. J. Wood Chem. Technol. 2015, 35, 270–279. [Google Scholar] [CrossRef]
  33. Oleksyn, O.; Prus-Glowacki, W.; Giertych, M.; Reich, P.B. Relation between genetic diversity and pollution impact in a 1912 experiment with East European Pinus sylvestris provenances. Can. J. For. Res. 1994, 24, 2390–2394. [Google Scholar] [CrossRef]
  34. Vladimirov, M.S.; Nikolic, V.D.; Stanojevic, L.P.; Stanojevic, J.S.; Nikolic, L.B.; Danilovic, B.R.; Marinkovic, V.D. Chemical composition, antimicrobial andantioxidant activity of birch (Betula pendula Roth.) buds essential oil. J. Essent. Oil-Bear. Plants 2019, 22, 120–130. [Google Scholar] [CrossRef]
  35. Sirgedaitė-Šėžienė, V.; Lučinskaitė, I.; Mildažienė, V.; Ivankov, A.; Koga, K.; Shiratani, M.; Laužikė, K.; Baliuckas, V. Changes in content of bioactive compounds and antioxidant activity induced in needles of different half-sib families of norway spruce (Picea abies (L.) H. Karst) by seed treatment with cold plasma. Antioxidants 2022, 11, 1558. [Google Scholar] [CrossRef] [PubMed]
  36. Sirgedaitė-Šėžienė, V.; Čėsnienė, I.; Leleikaitė, G.; Baliuckas, V.; Vaitiekūnaitė, D. Phenolic and antioxidant compound accumulation of Quercus robur bark diverges based on tree genotype, phenology and extraction method. Life 2023, 13, 710. [Google Scholar] [CrossRef] [PubMed]
  37. Bae, J.; Kim, N.; Shin, Y.; Kim, S.-Y.; Kim, Y.-J. Activity of catechins and their applications. Biomed. Dermatol. 2020, 4, 8. [Google Scholar] [CrossRef]
  38. Mougiou, N.; Baalbaki, B.; Doupis, G.; Kavroulakis, N.; Poulios, S.; Vlachonasios, K.E.; Koubouris, G.C. The effect of low temperature on physiological, biochemical and flowering functions of olive tree in relation to genotype. Sustainability 2020, 12, 10065. [Google Scholar] [CrossRef]
  39. Tegischer, K.; Tausz, M.; Wieser, G.; Grill, D. Tree- and needle-age-dependent variations in antioxidants and photoprotective pigments in Norway spruce needles at the alpine timberline. Tree Physiol. 2002, 22, 591–596. [Google Scholar] [CrossRef]
Figure 1. Silver birch (Betula pendula) seedling height averages in 7 tested half-sib families (86, 125, 112, 171, 60, 179, and 73) during 1st and 2nd vegetation seasons. Different letters next to columns of the same color indicate significant differences (p < 0.05) between groups. Solid colors indicate a significant difference (p < 0.05) between the 1st years and 2nd years. Significance was calculated with the Kruskal–Wallis H test on ranks followed by pairwise comparisons with Dunn’s test.
Forests 15 01262 g001
Figure 2. Silver birch (Betula pendula) seedlings from 4 out of 7 tested half-sib families (from left to right: 171, 73, 125, 86) during 1st vegetation season 2 months after sprouting. Differences in height were already apparent in this stage.
Forests 15 01262 g002
Figure 3. Silver birch (Betula pendula) seedling total phenol content (TPC) averages in 7 tested half-sib families (86, 125, 112, 171, 60, 179, and 73) during 1st and 2nd vegetation seasons. Different letters next to columns of the same color indicate significant differences (p < 0.05) between groups. Solid colors indicate a significant difference (p < 0.05) between the 1st years and 2nd years. Significance was calculated with the Kruskal–Wallis H test on ranks followed by pairwise comparisons with Dunn’s test.
Forests 15 01262 g003
Figure 4. Superoxide dismutase (SOD) enzyme average content in 7 tested half-sib silver birch (Betula pendula) families (86, 125, 112, 171, 60, 179, and 73) during 1st and 2nd vegetation seasons. Different letters next to columns of the same color indicate significant differences (p < 0.05) between groups. Solid colors indicate a significant difference (p < 0.05) between the 1st years and 2nd years. Significance was calculated with the Kruskal–Wallis H test on ranks followed by pairwise comparisons with Dunn’s test.
Forests 15 01262 g004
Figure 5. Catalase (CAT) enzyme average content in 7 tested half-sib silver birch (Betula pendula) families (86, 125, 112, 171, 60, 179, and 73) during 1st and 2nd vegetation seasons. Different letters next to columns of the same color indicate significant differences (p < 0.05) between groups. Solid colors indicate a significant difference (p < 0.05) between 1st years and 2nd years. Significance was calculated with the Kruskal–Wallis H test on ranks followed by pairwise comparisons with Dunn’s test.
Forests 15 01262 g005
Figure 6. Ascorbate peroxidase (APX) enzyme average content in 7 tested half-sib silver birch (Betula pendula) families (86, 125, 112, 171, 60, 179, and 73) during 1st and 2nd vegetation seasons. Different letters next to columns of the same color indicate significant differences (p < 0.05) between groups. Solid colors indicate a significant difference (p < 0.05) between 1st years and 2nd years. Significance was calculated with the Kruskal–Wallis H test on ranks followed by pairwise comparisons with Dunn’s test.
Forests 15 01262 g006
Figure 7. Peroxidase (POX) enzyme average content in 7 tested half-sib silver birch (Betula pendula) families (86, 125, 112, 171, 60, 179, and 73) during 1st and 2nd vegetation seasons. Different letters next to columns of the same color indicate significant differences (p < 0.05) between groups. Solid colors indicate a significant difference (p < 0.05) between 1st years and 2nd years. Significance was calculated with the Kruskal–Wallis H test on ranks followed by pairwise comparisons with Dunn’s test.
Forests 15 01262 g007
Figure 8. Glutathione reductase (GR) enzyme average content in 7 tested half-sib silver birch (Betula pendula) families (86, 125, 112, 171, 60, 179, and 73) during 1st and 2nd vegetation seasons. Different letters next to columns of the same color indicate significant differences (p < 0.05) between groups. Solid colors indicate a significant difference (p < 0.05) between 1st years and 2nd years. Significance was calculated with the Kruskal–Wallis H test on ranks followed by pairwise comparisons with Dunn’s test.
Forests 15 01262 g008
Disclaimer/Publisher’s Note: The statements, opinions and data contained in all publications are solely those of the individual author(s) and contributor(s) and not of MDPI and/or the editor(s). MDPI and/or the editor(s) disclaim responsibility for any injury to people or property resulting from any ideas, methods, instructions or products referred to in the content.

