
Spatial–Temporal Changes in the Distribution of Populus euphratica Oliv. Forests in the Tarim Basin and Analysis of Influencing Factors from 1990 to 2020

Abstract
:1. Introduction
2. Materials
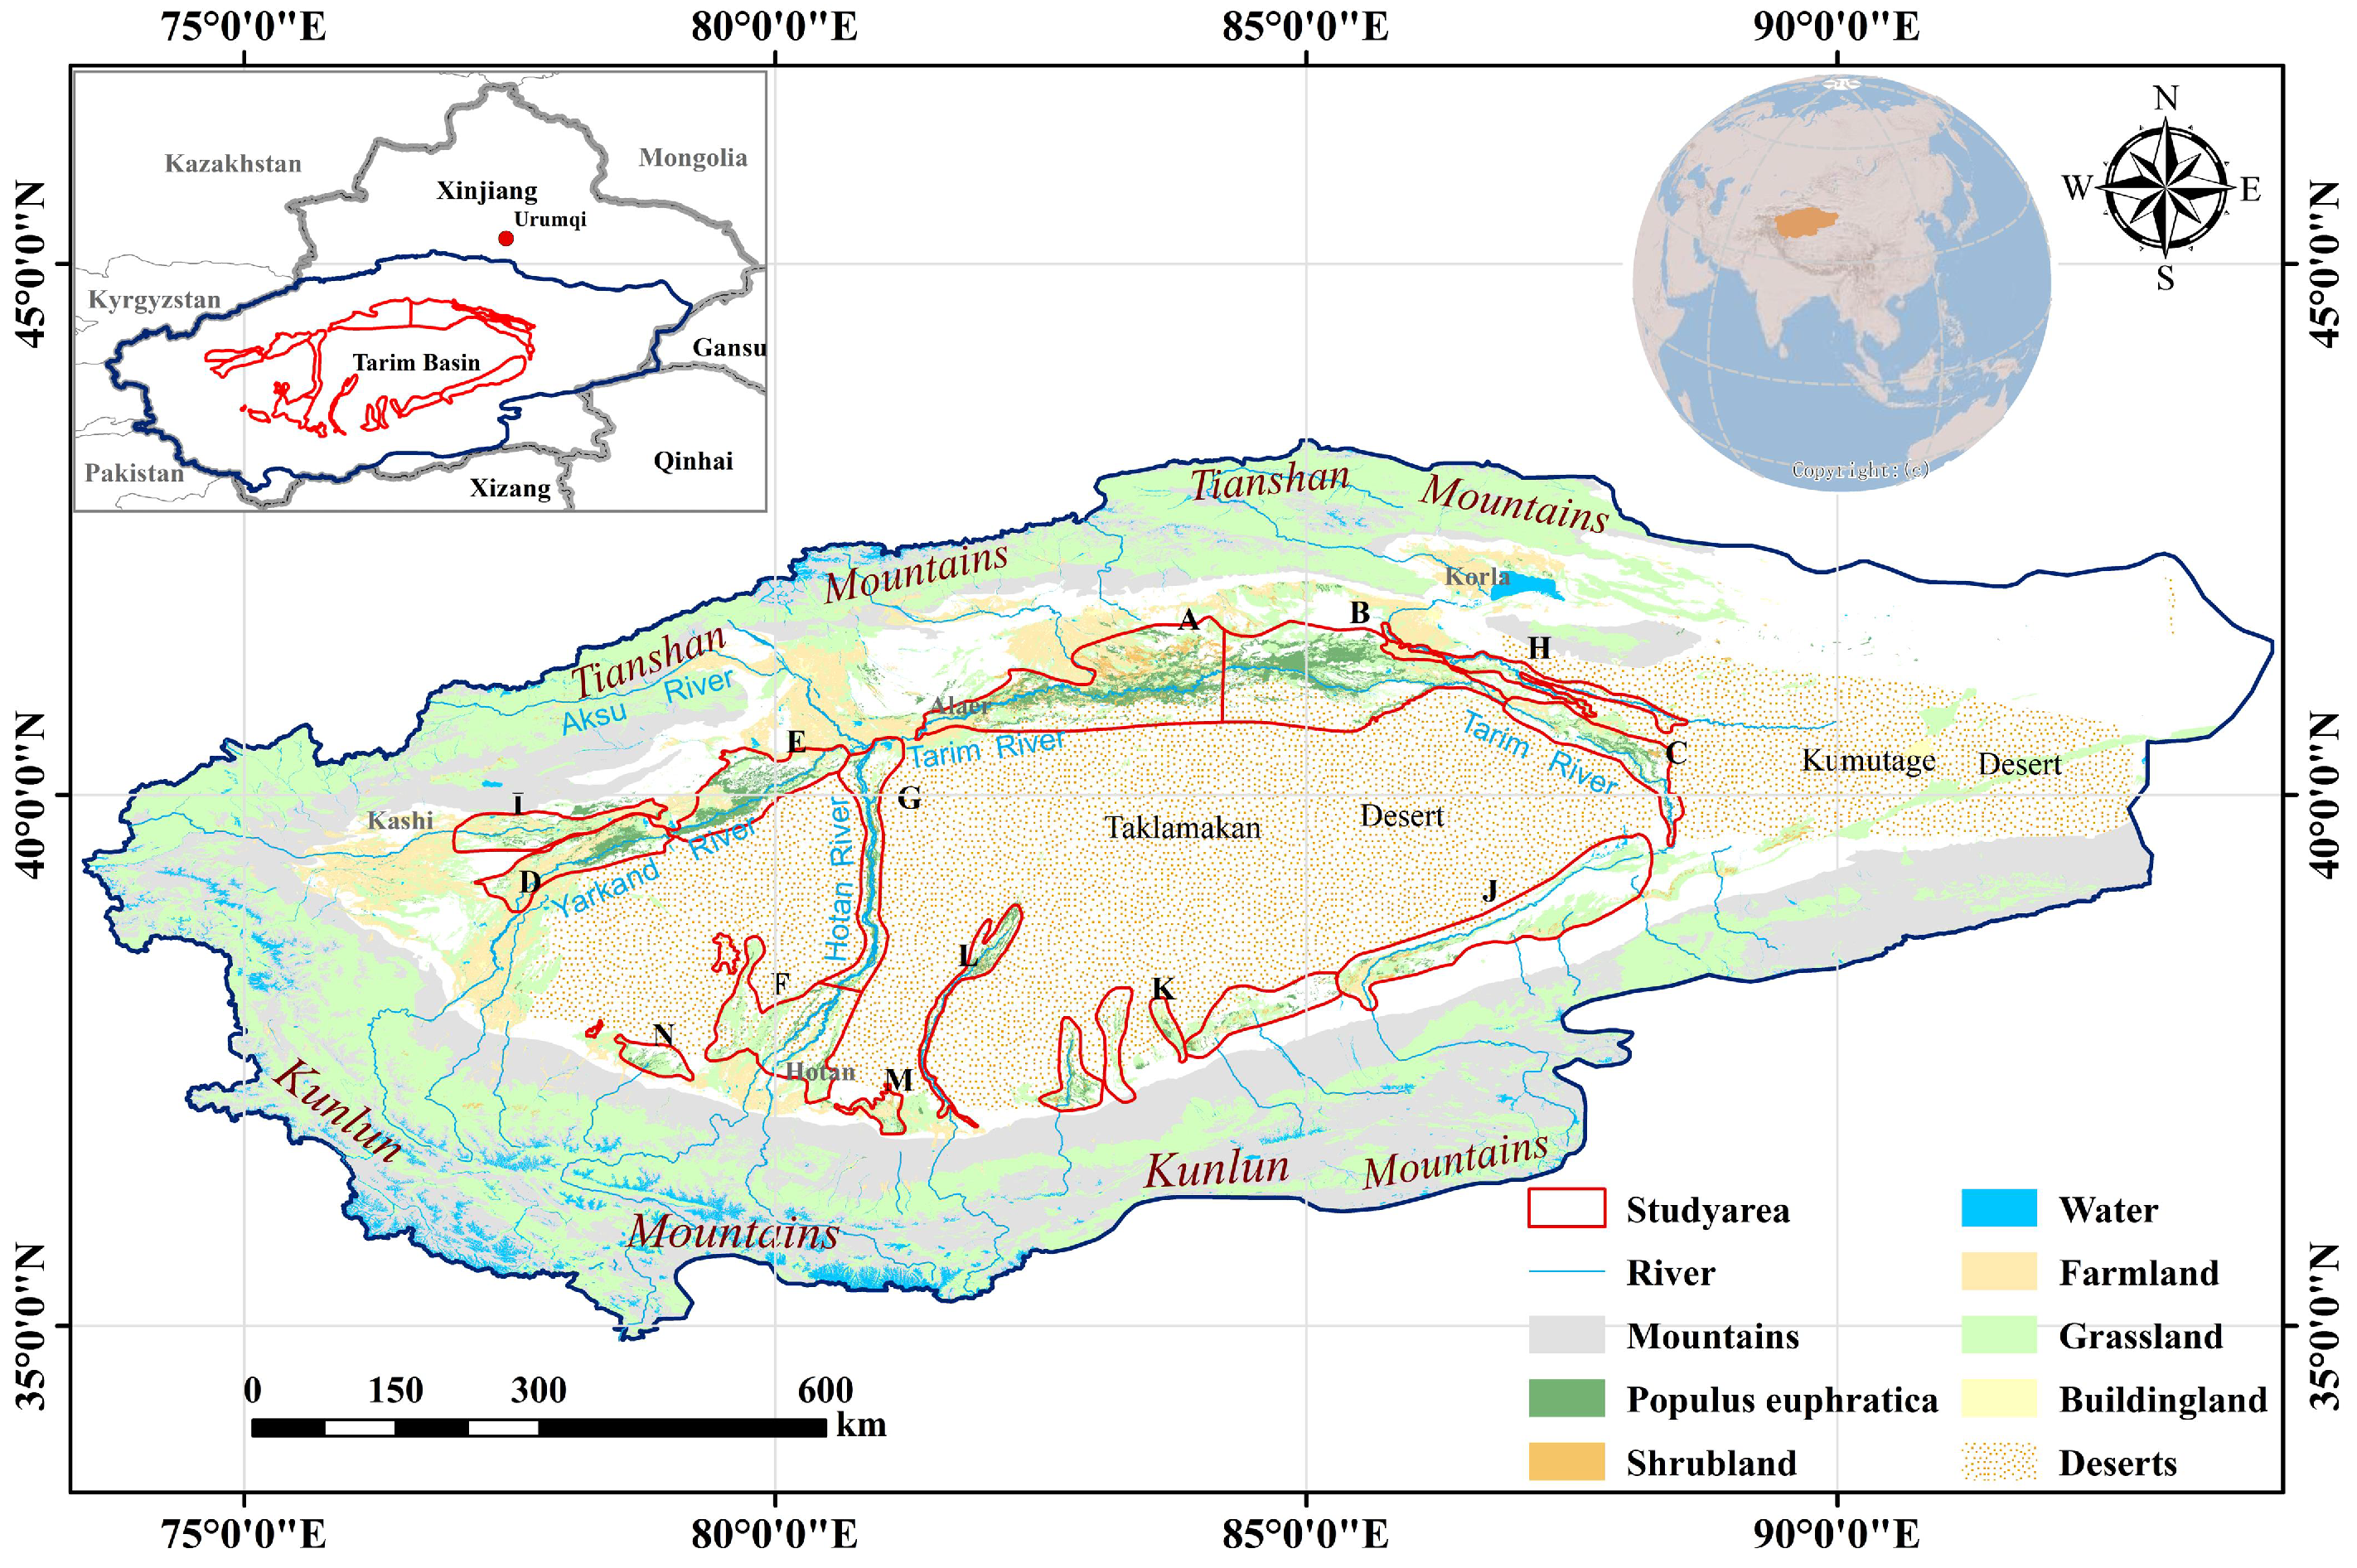
2.1. Study Area
2.2. Data Sources
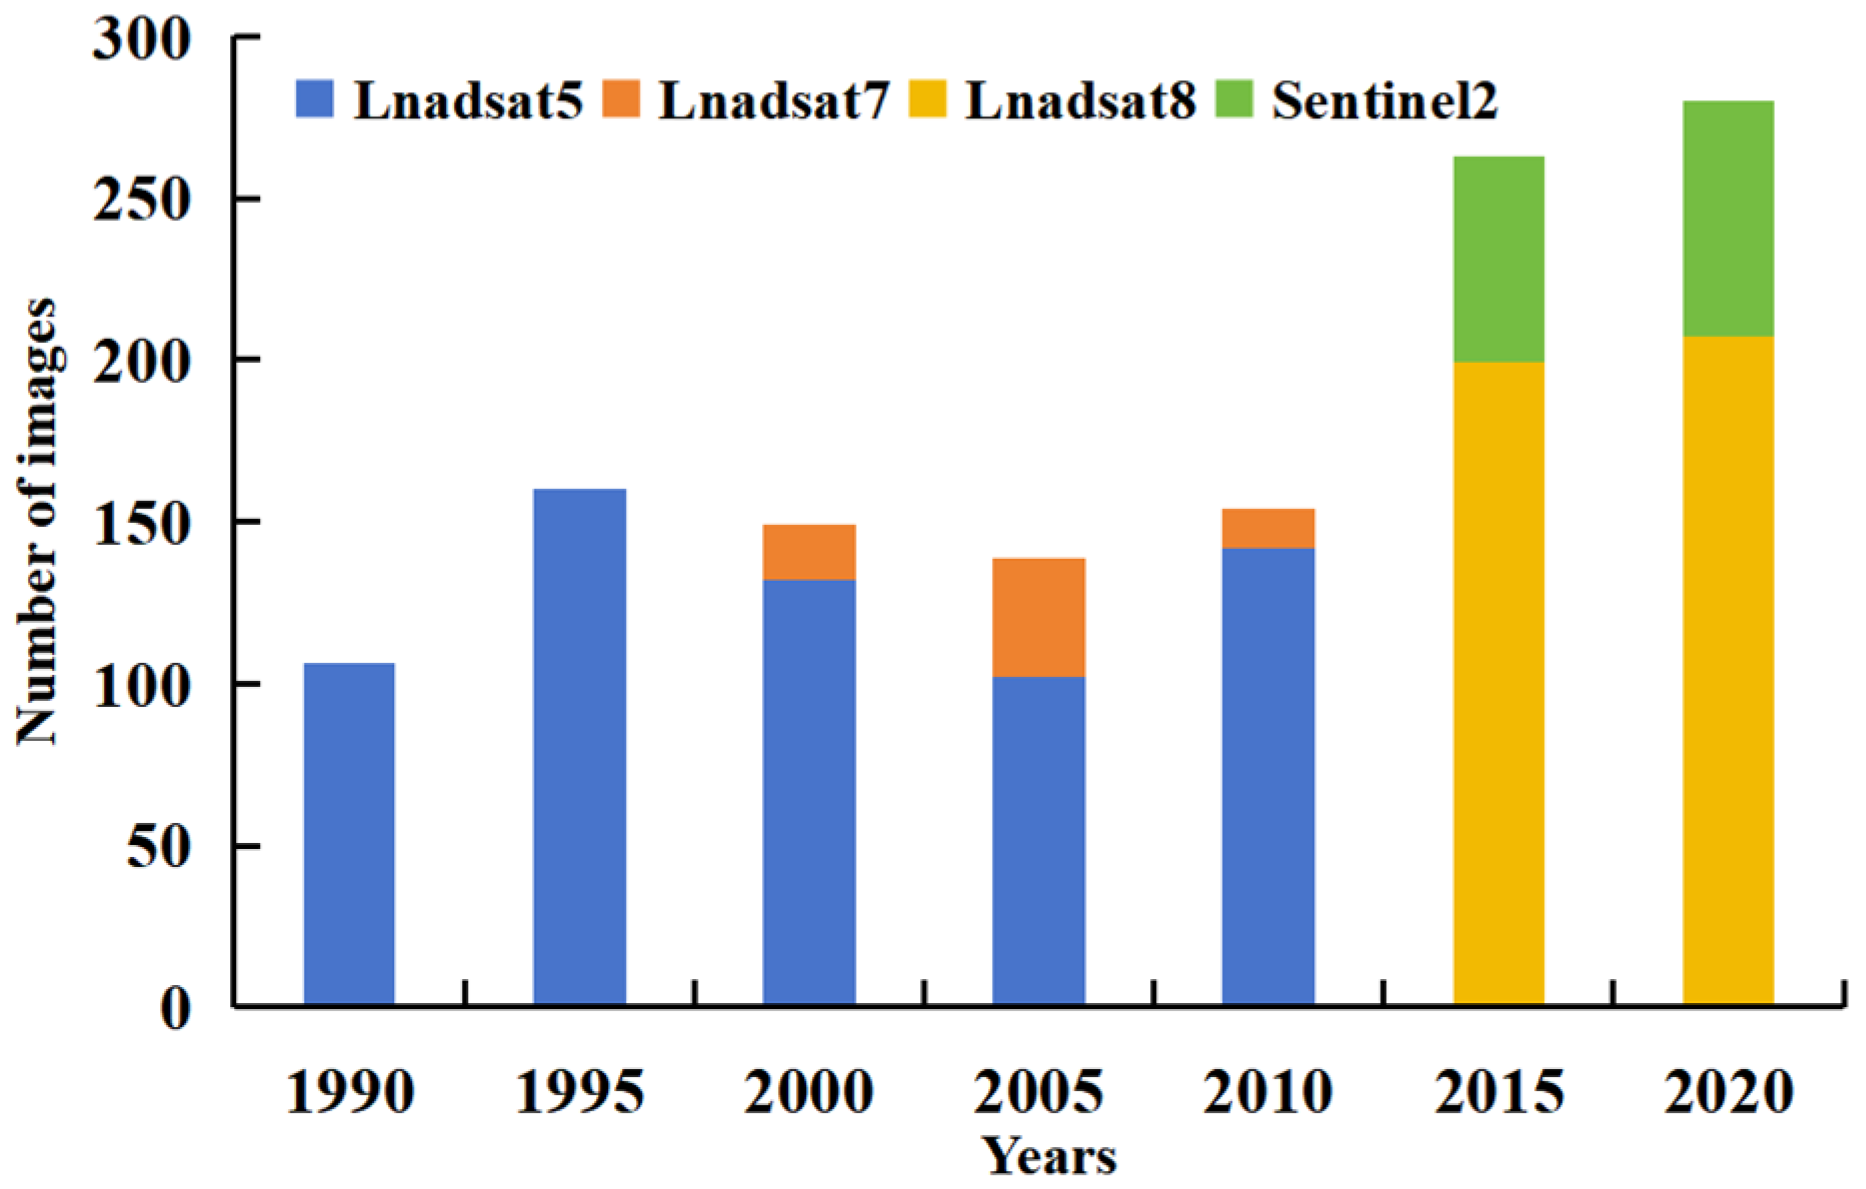
2.2.1. Remote Sensing Dataset
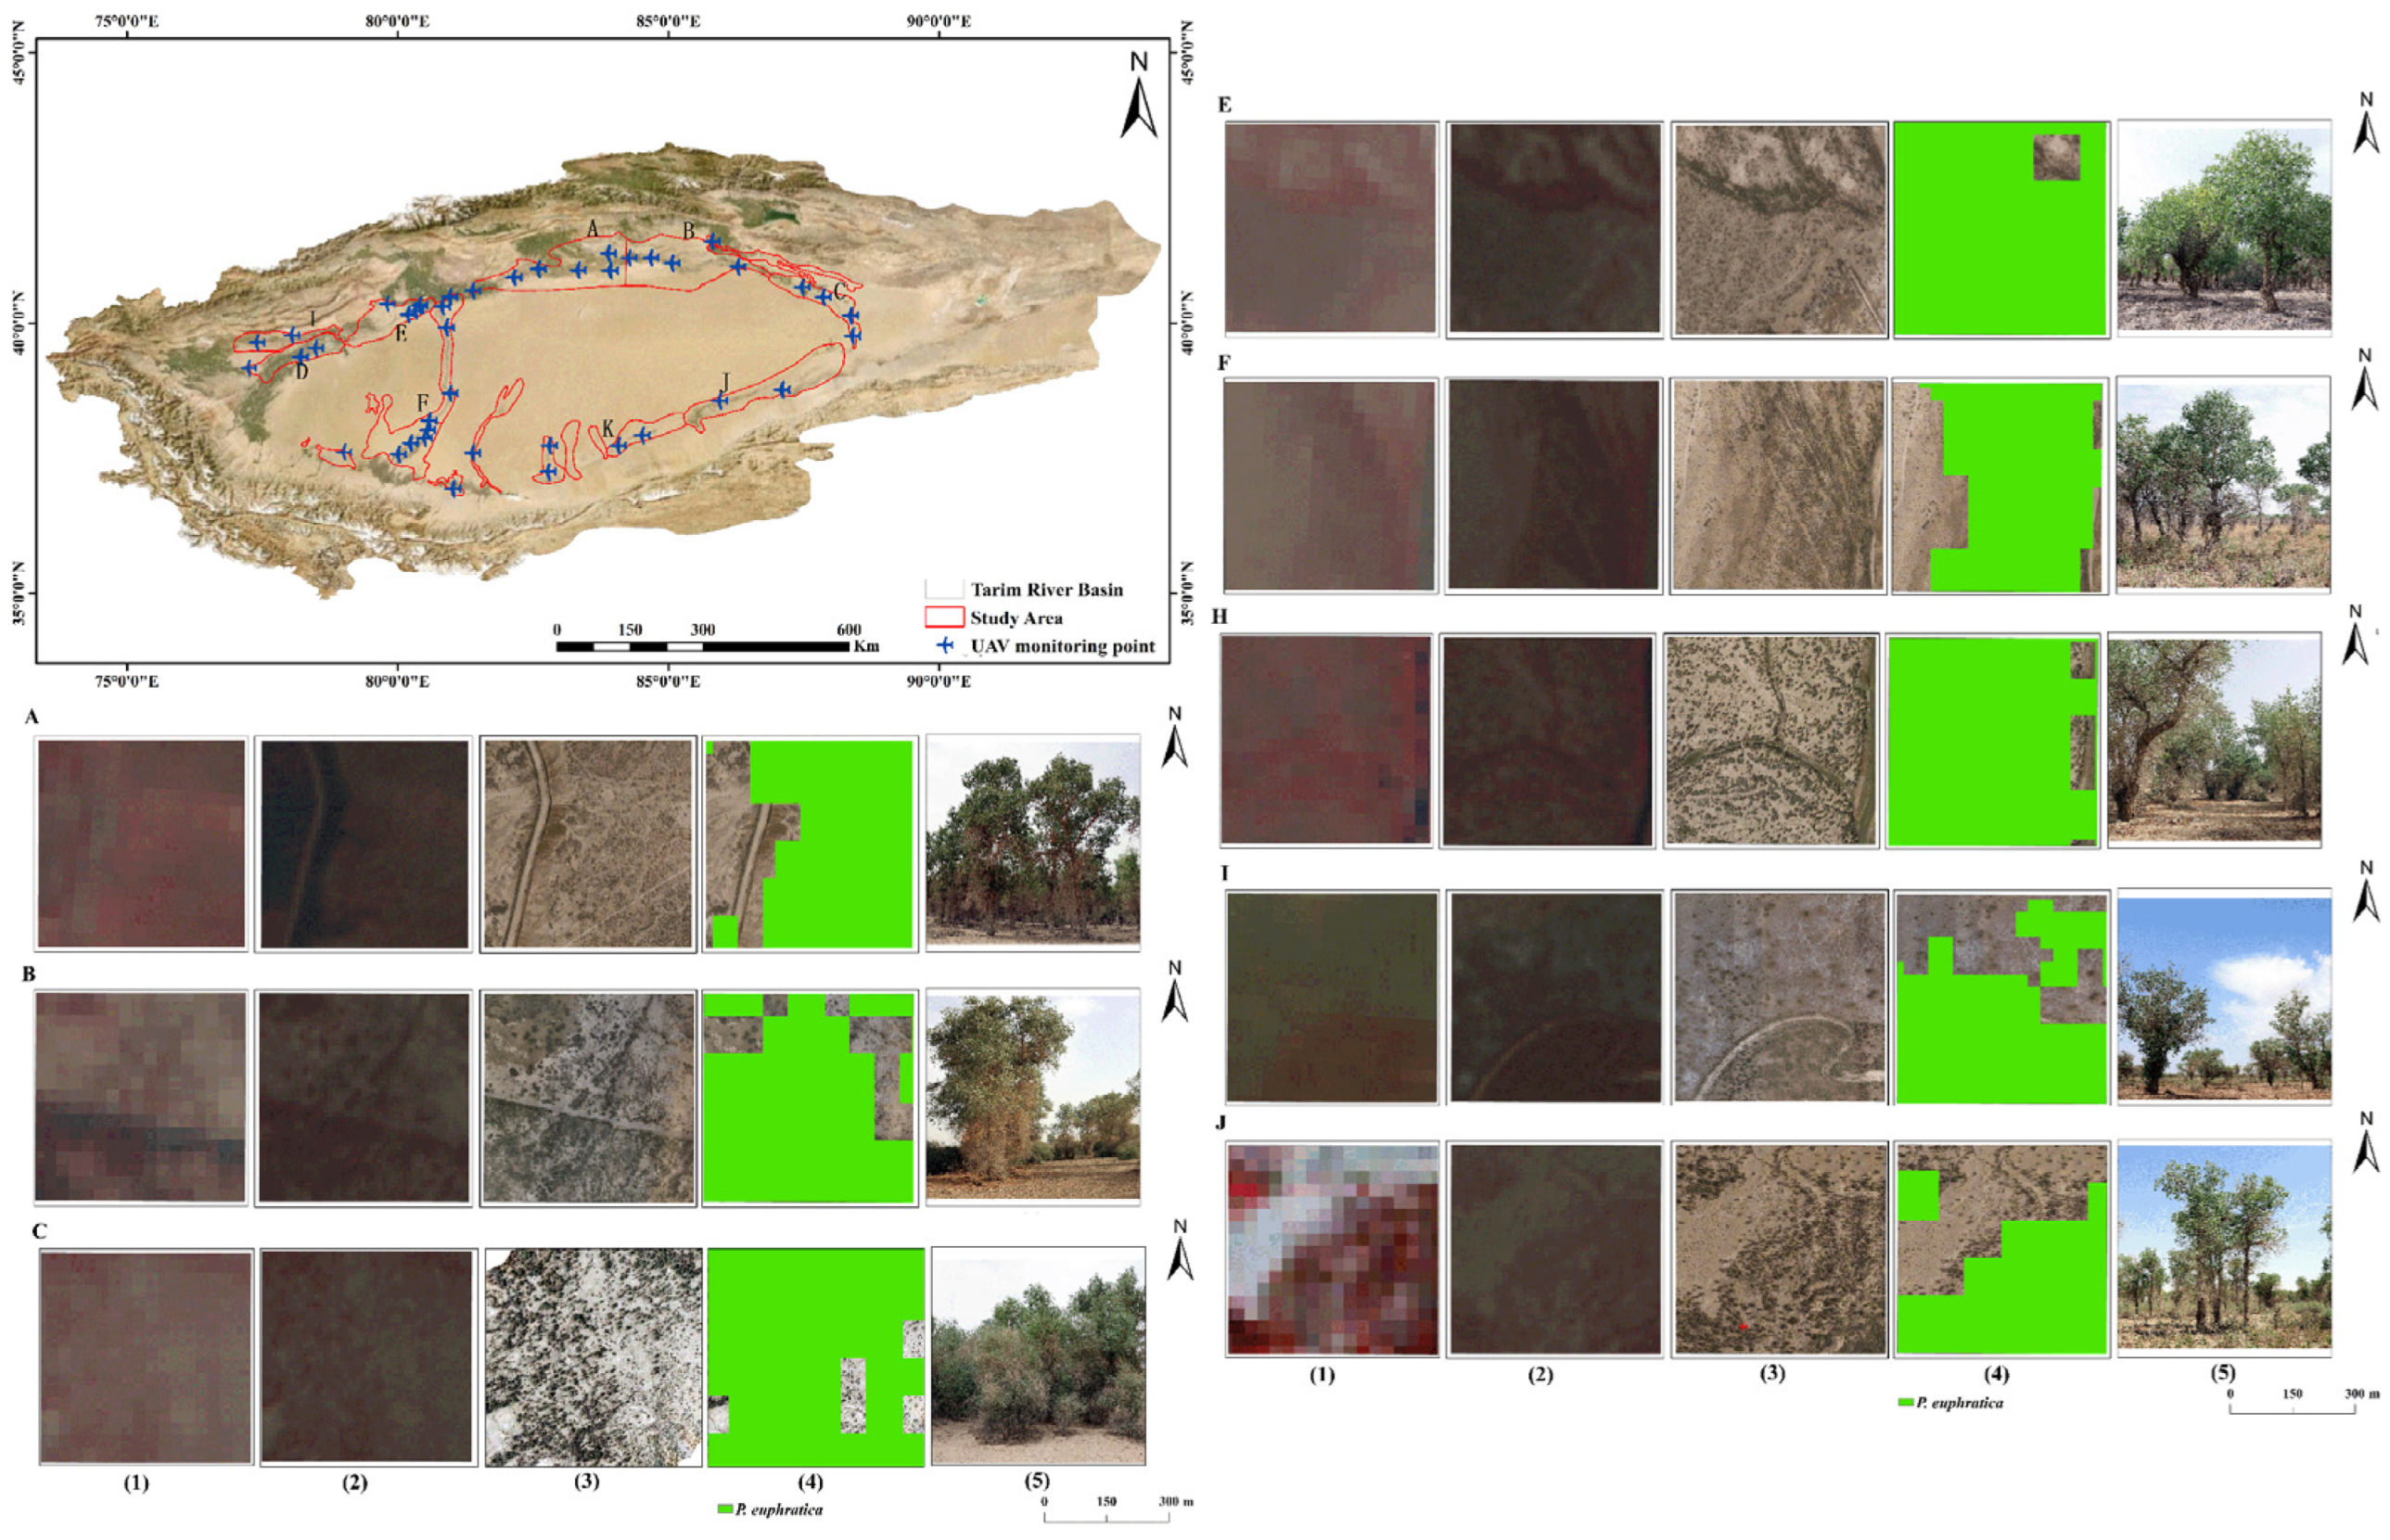
2.2.2. Data for Validation
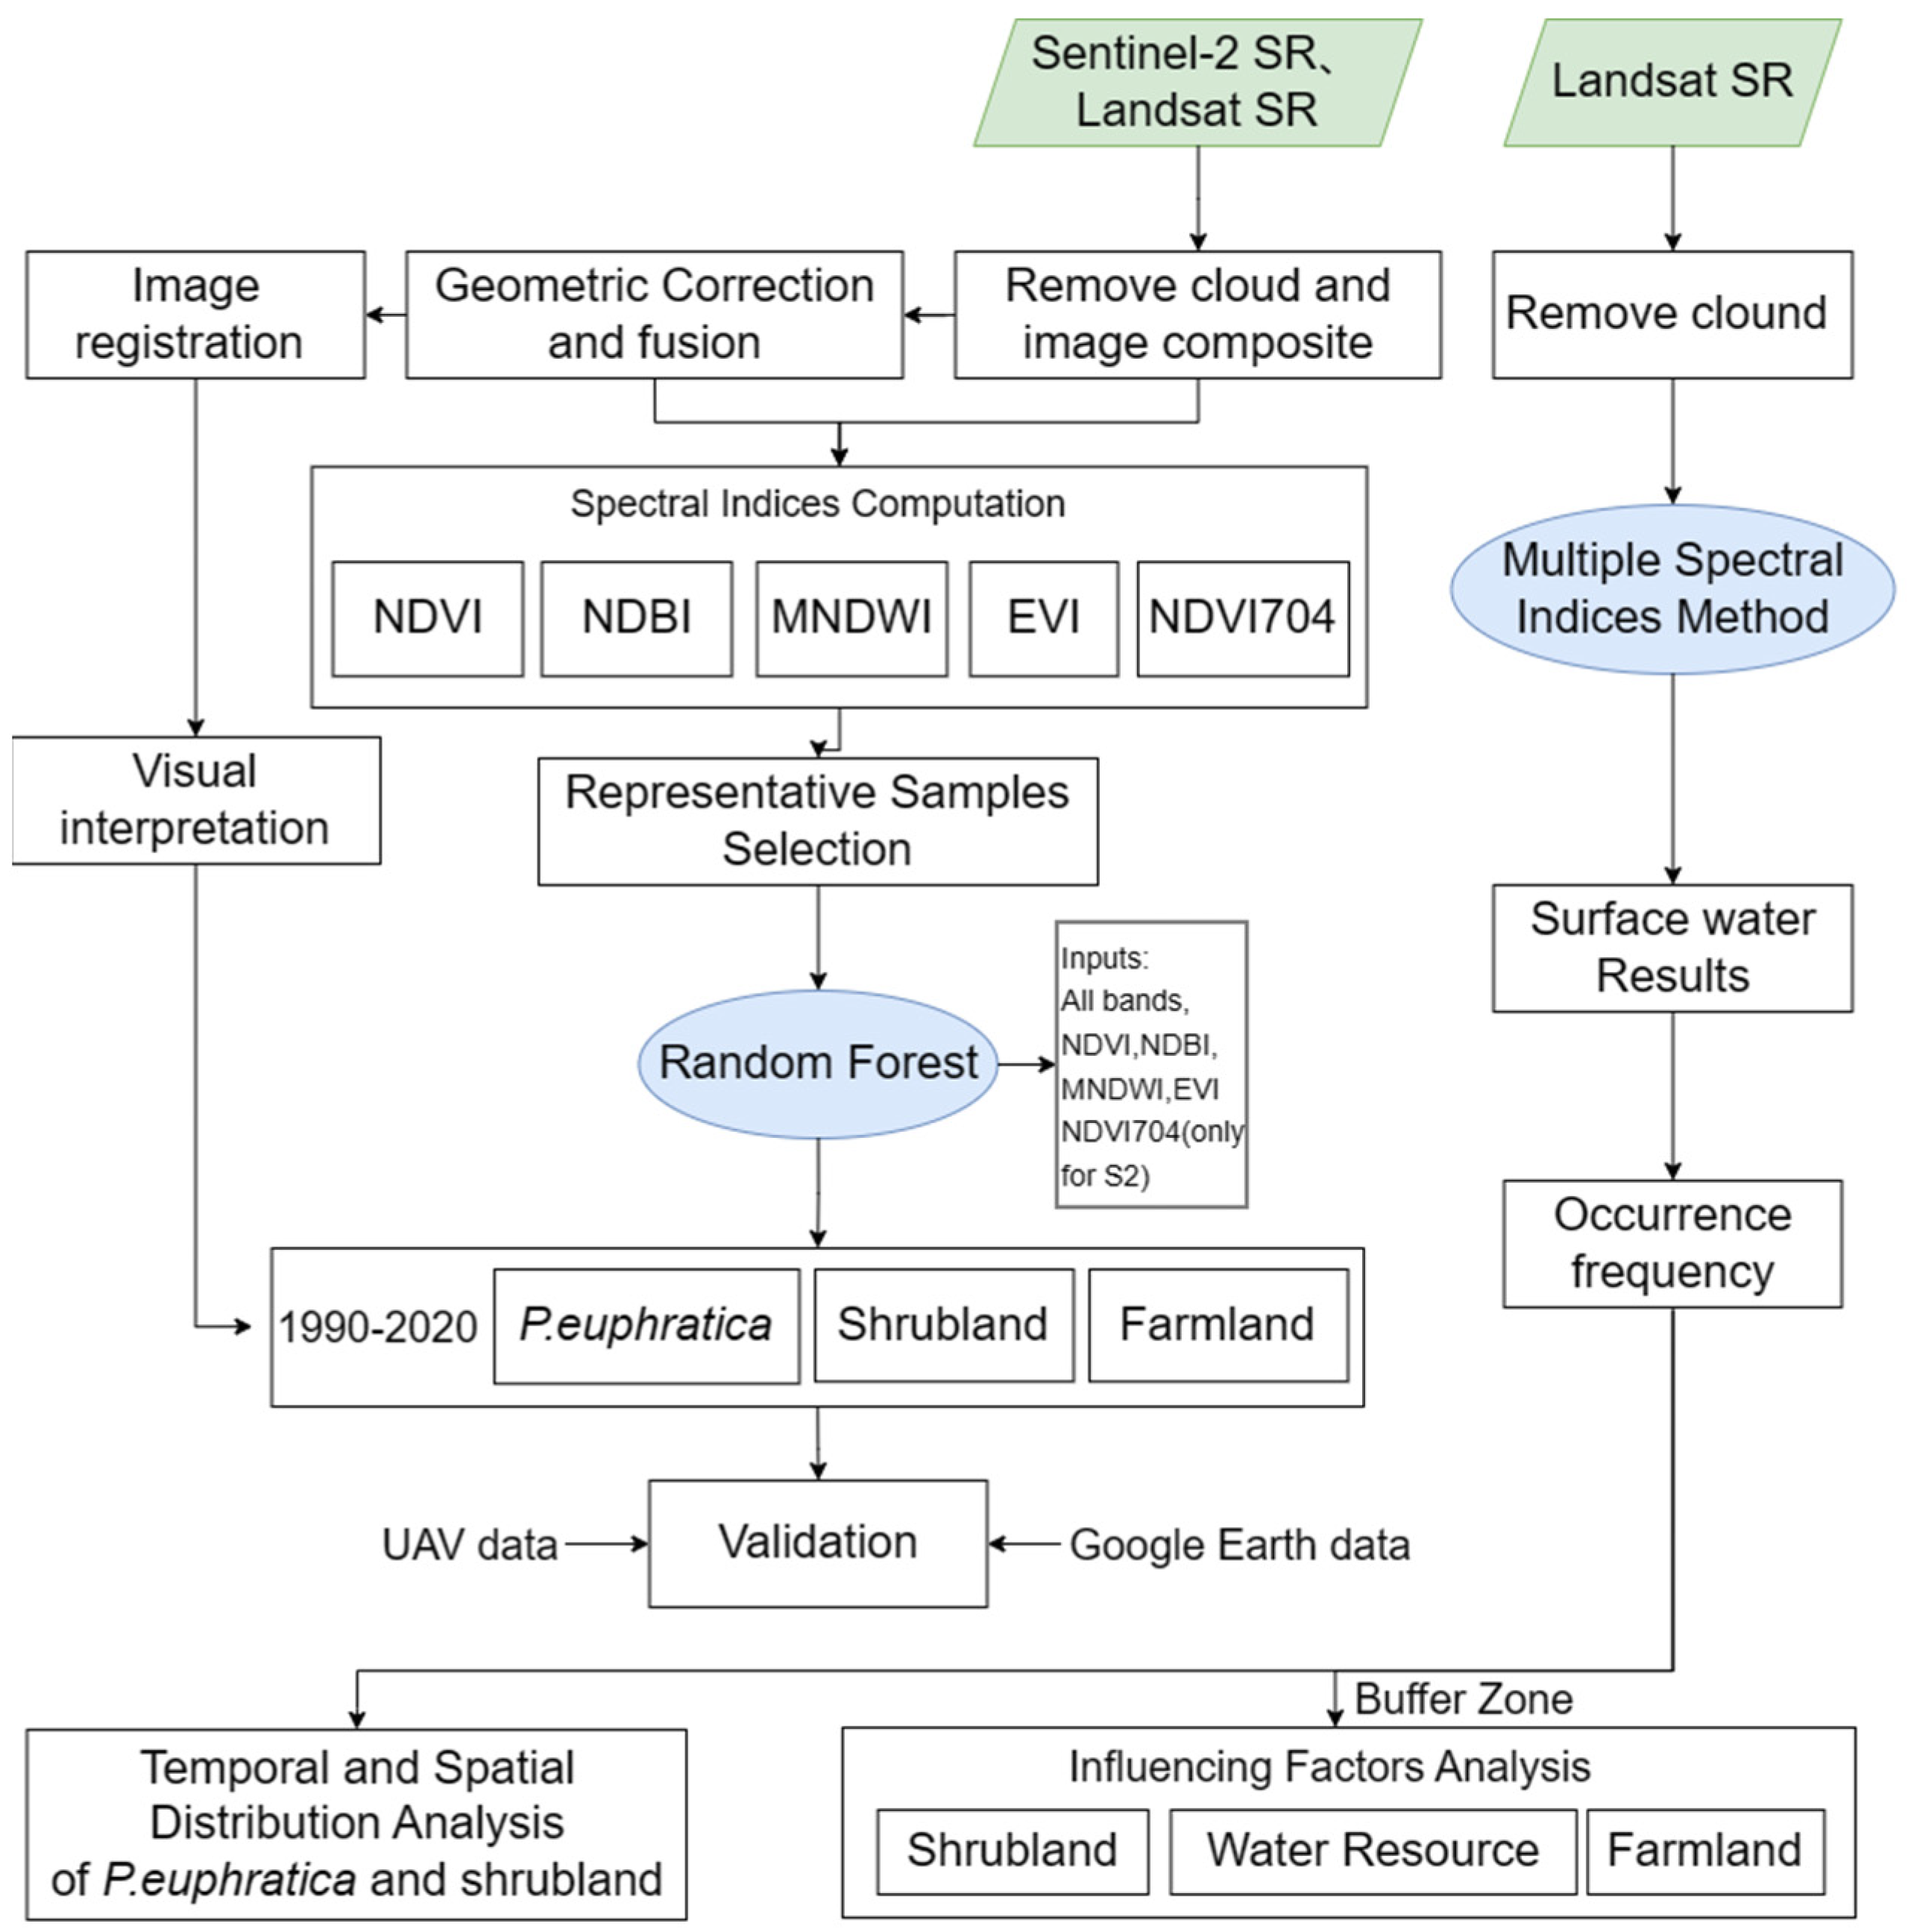
3. Methods
3.1. Classification Scheme
3.1.1. Random Forest Model
3.1.2. Input Features
3.1.3. Accuracy Verification
3.2. Spatiotemporal Variation of P. euphratica Forest, Shrublands, and Farmland
3.2.1. Strength Analysis
Category Layer
Conversion Layer
3.2.2. Transition Matrix
3.3. Occurrence Frequency of Surface Water
3.4. Buffer Analysis
4. Results and Analysis
4.1. Accuracy Verification of Extracting P. euphratica Forest, Shrublands, and Farmland
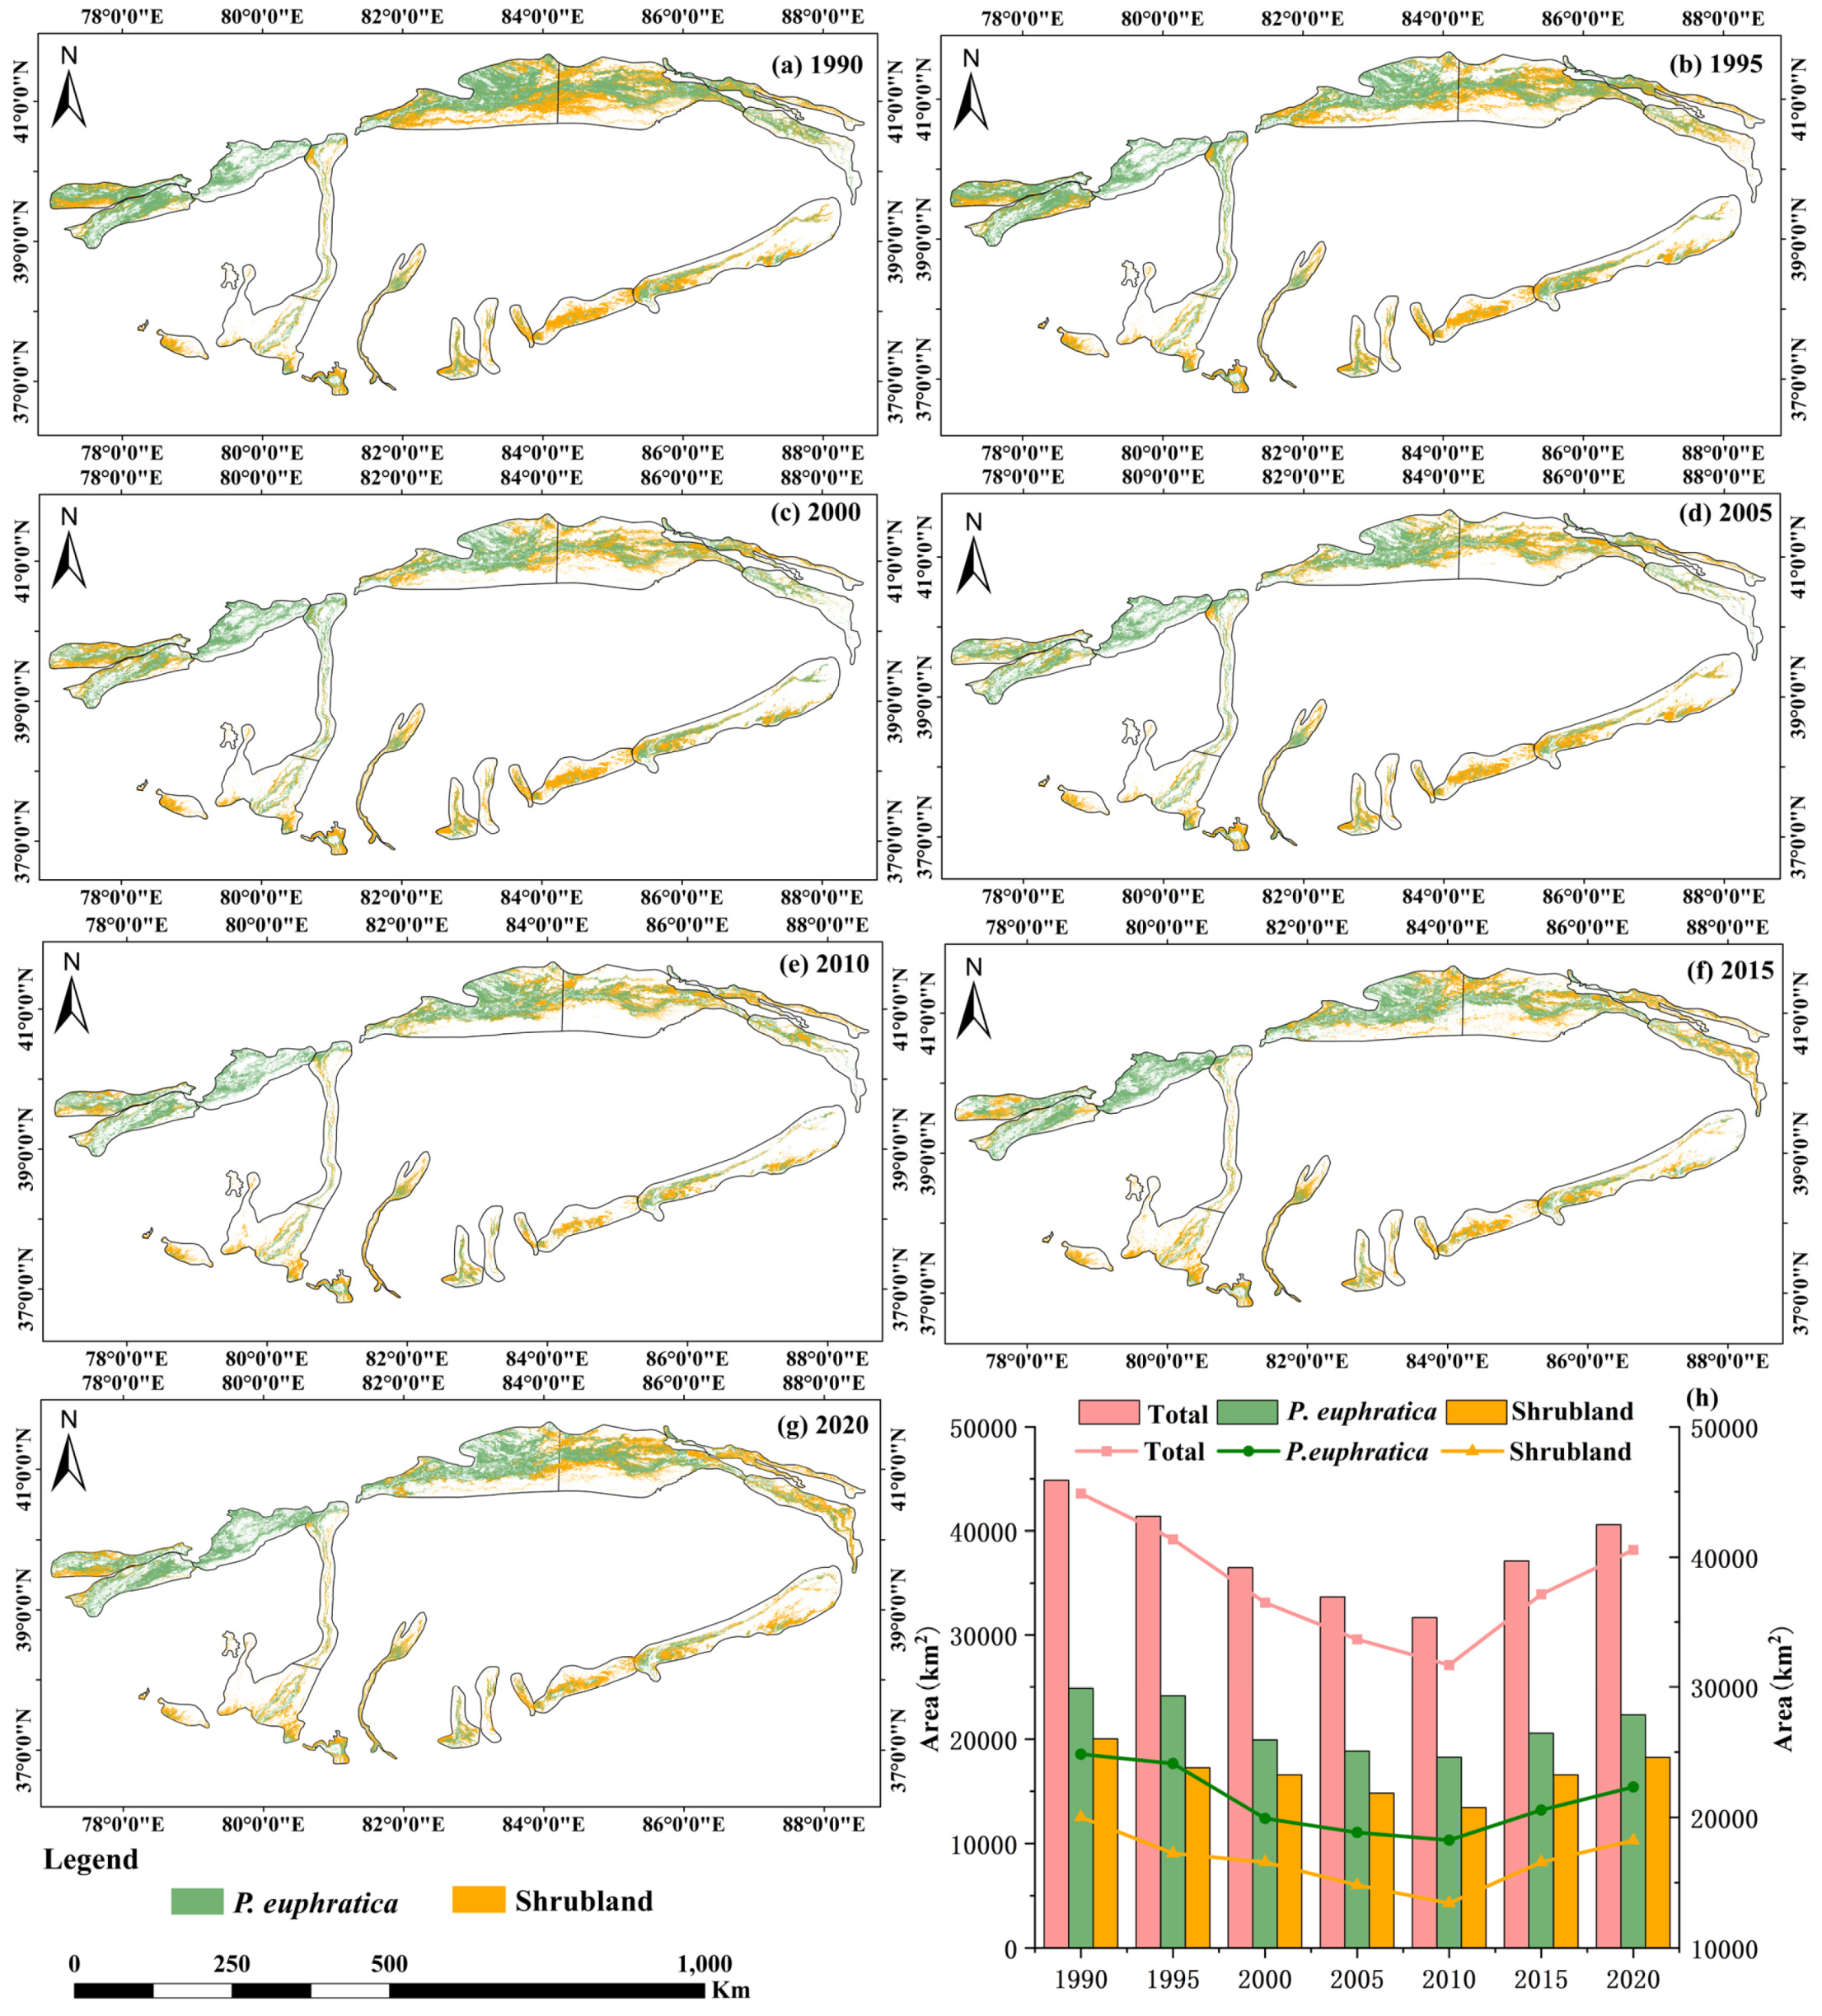
4.2. The Temporal and Spatial Changes of P. euphratica and Shrubland
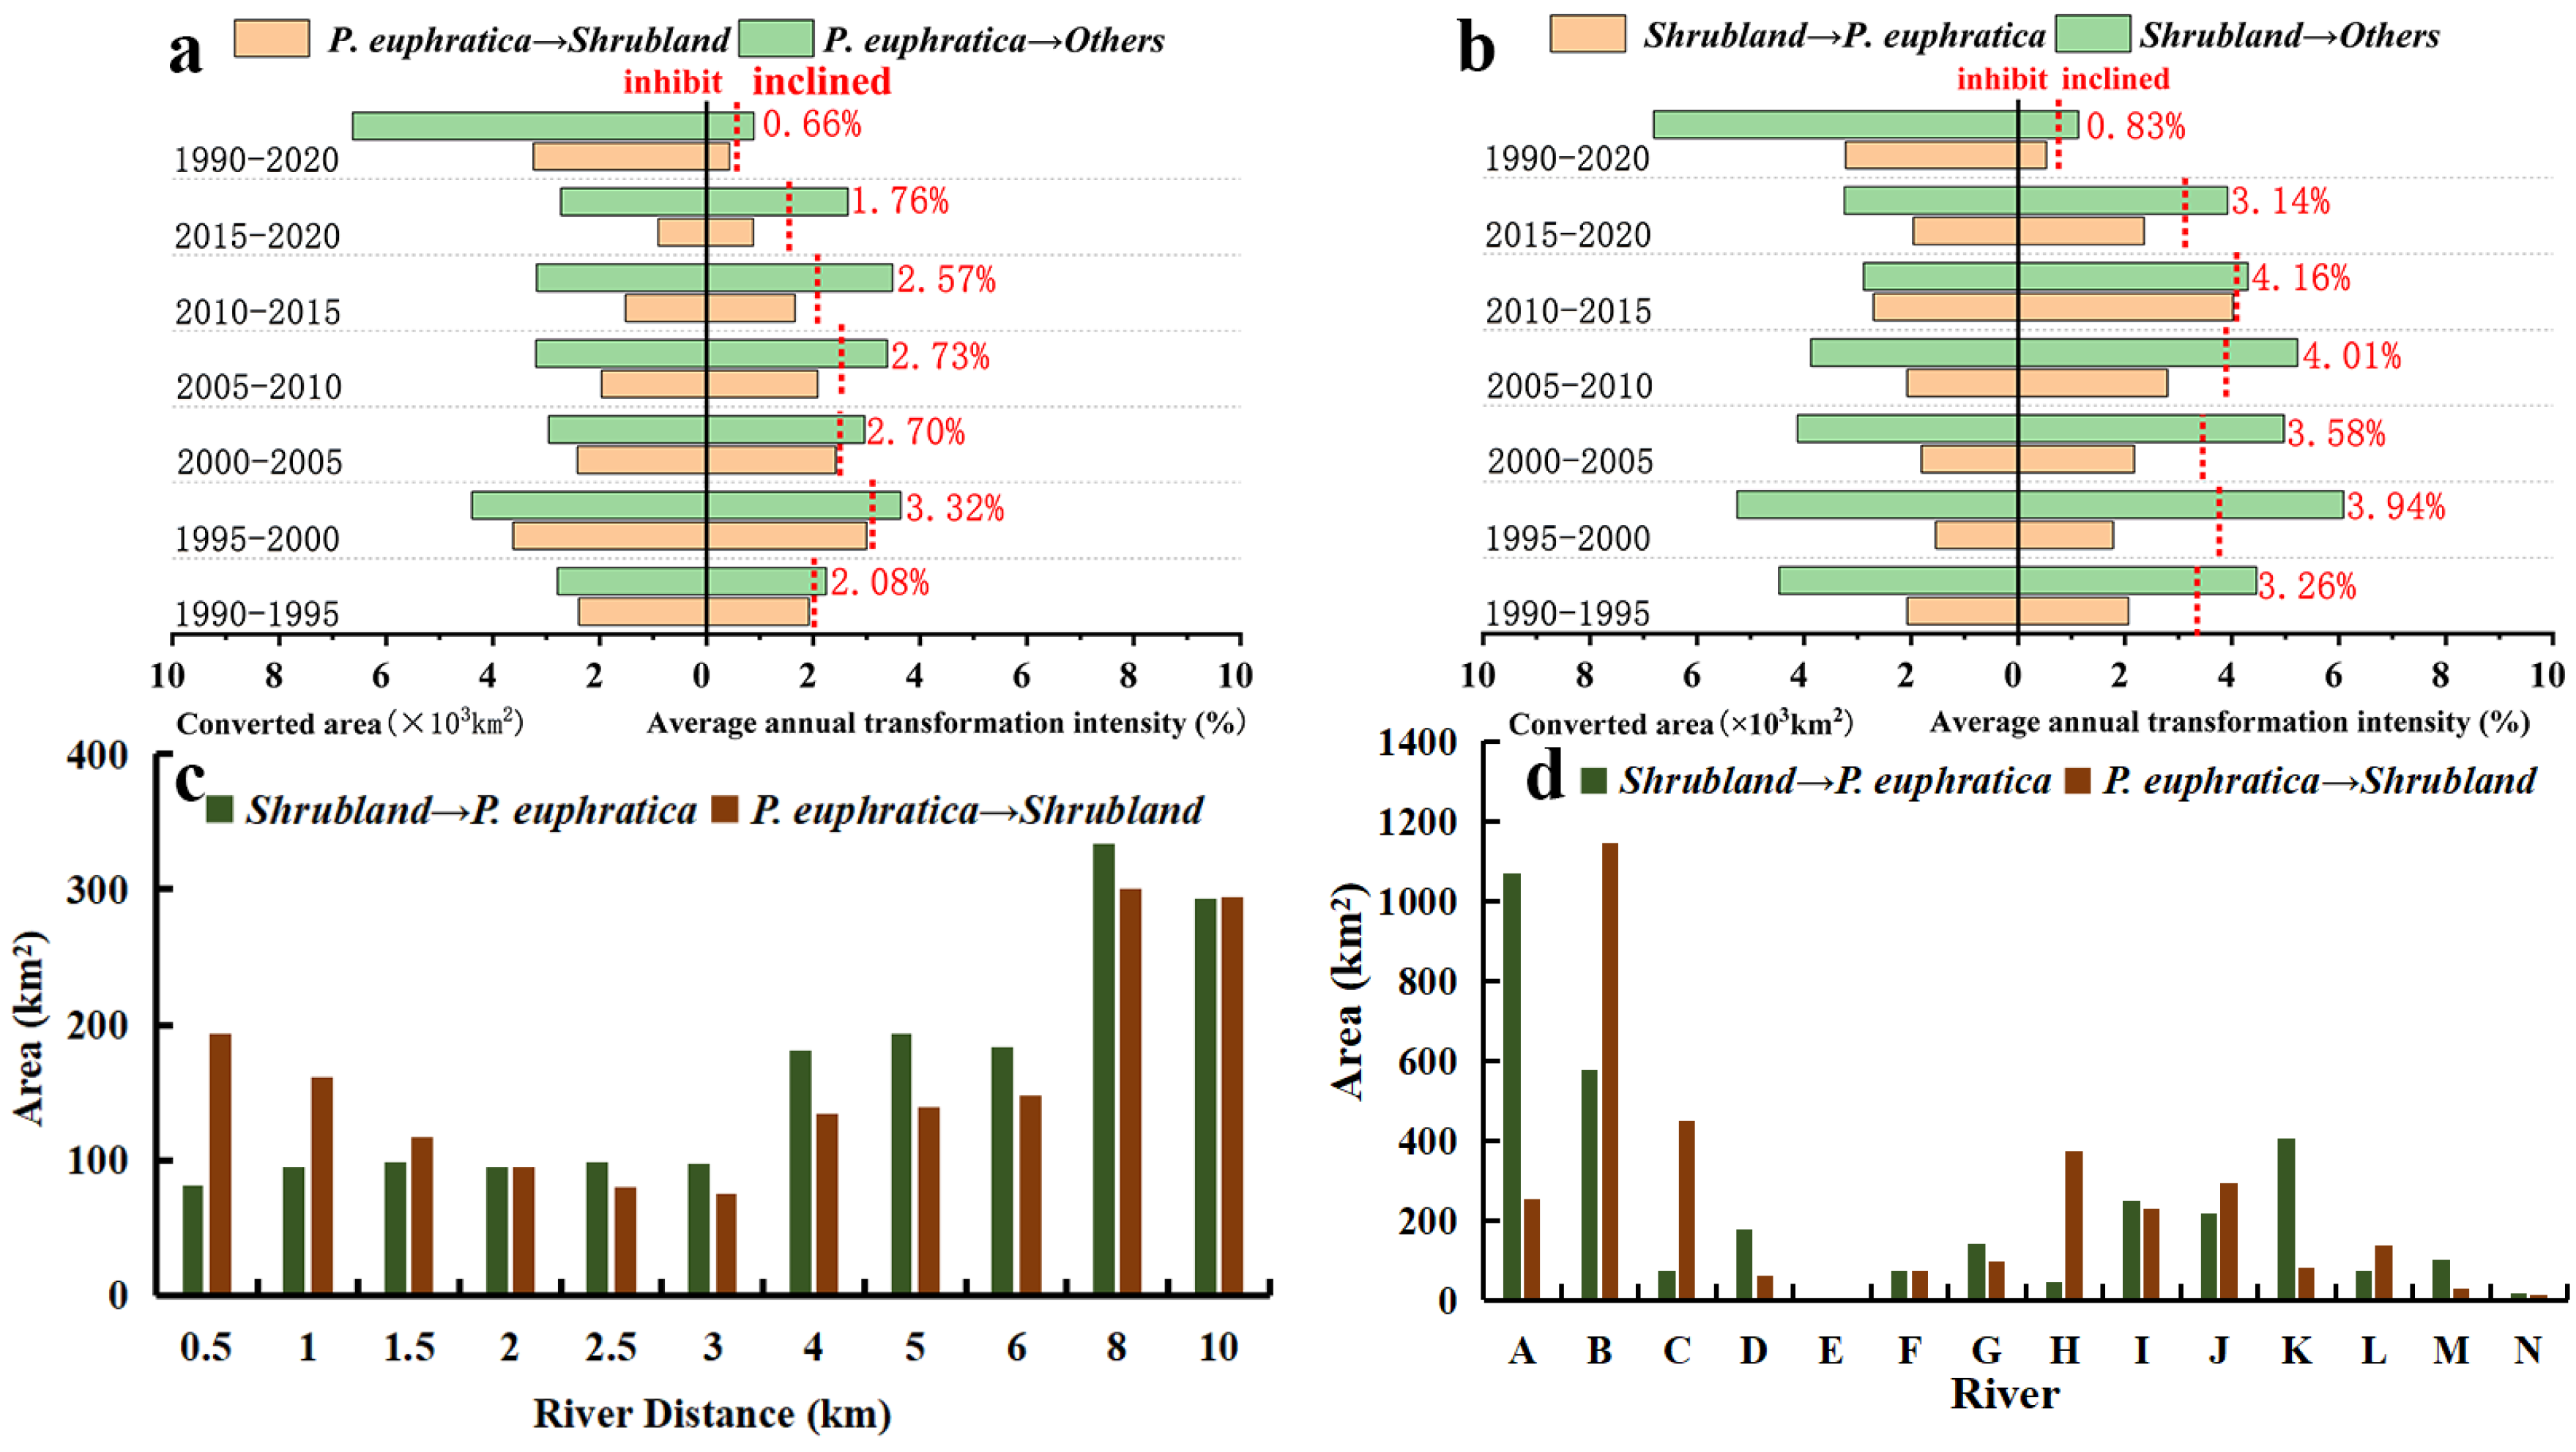
4.3. Mutual Transformation between P. euphratica Forest and Shrublands
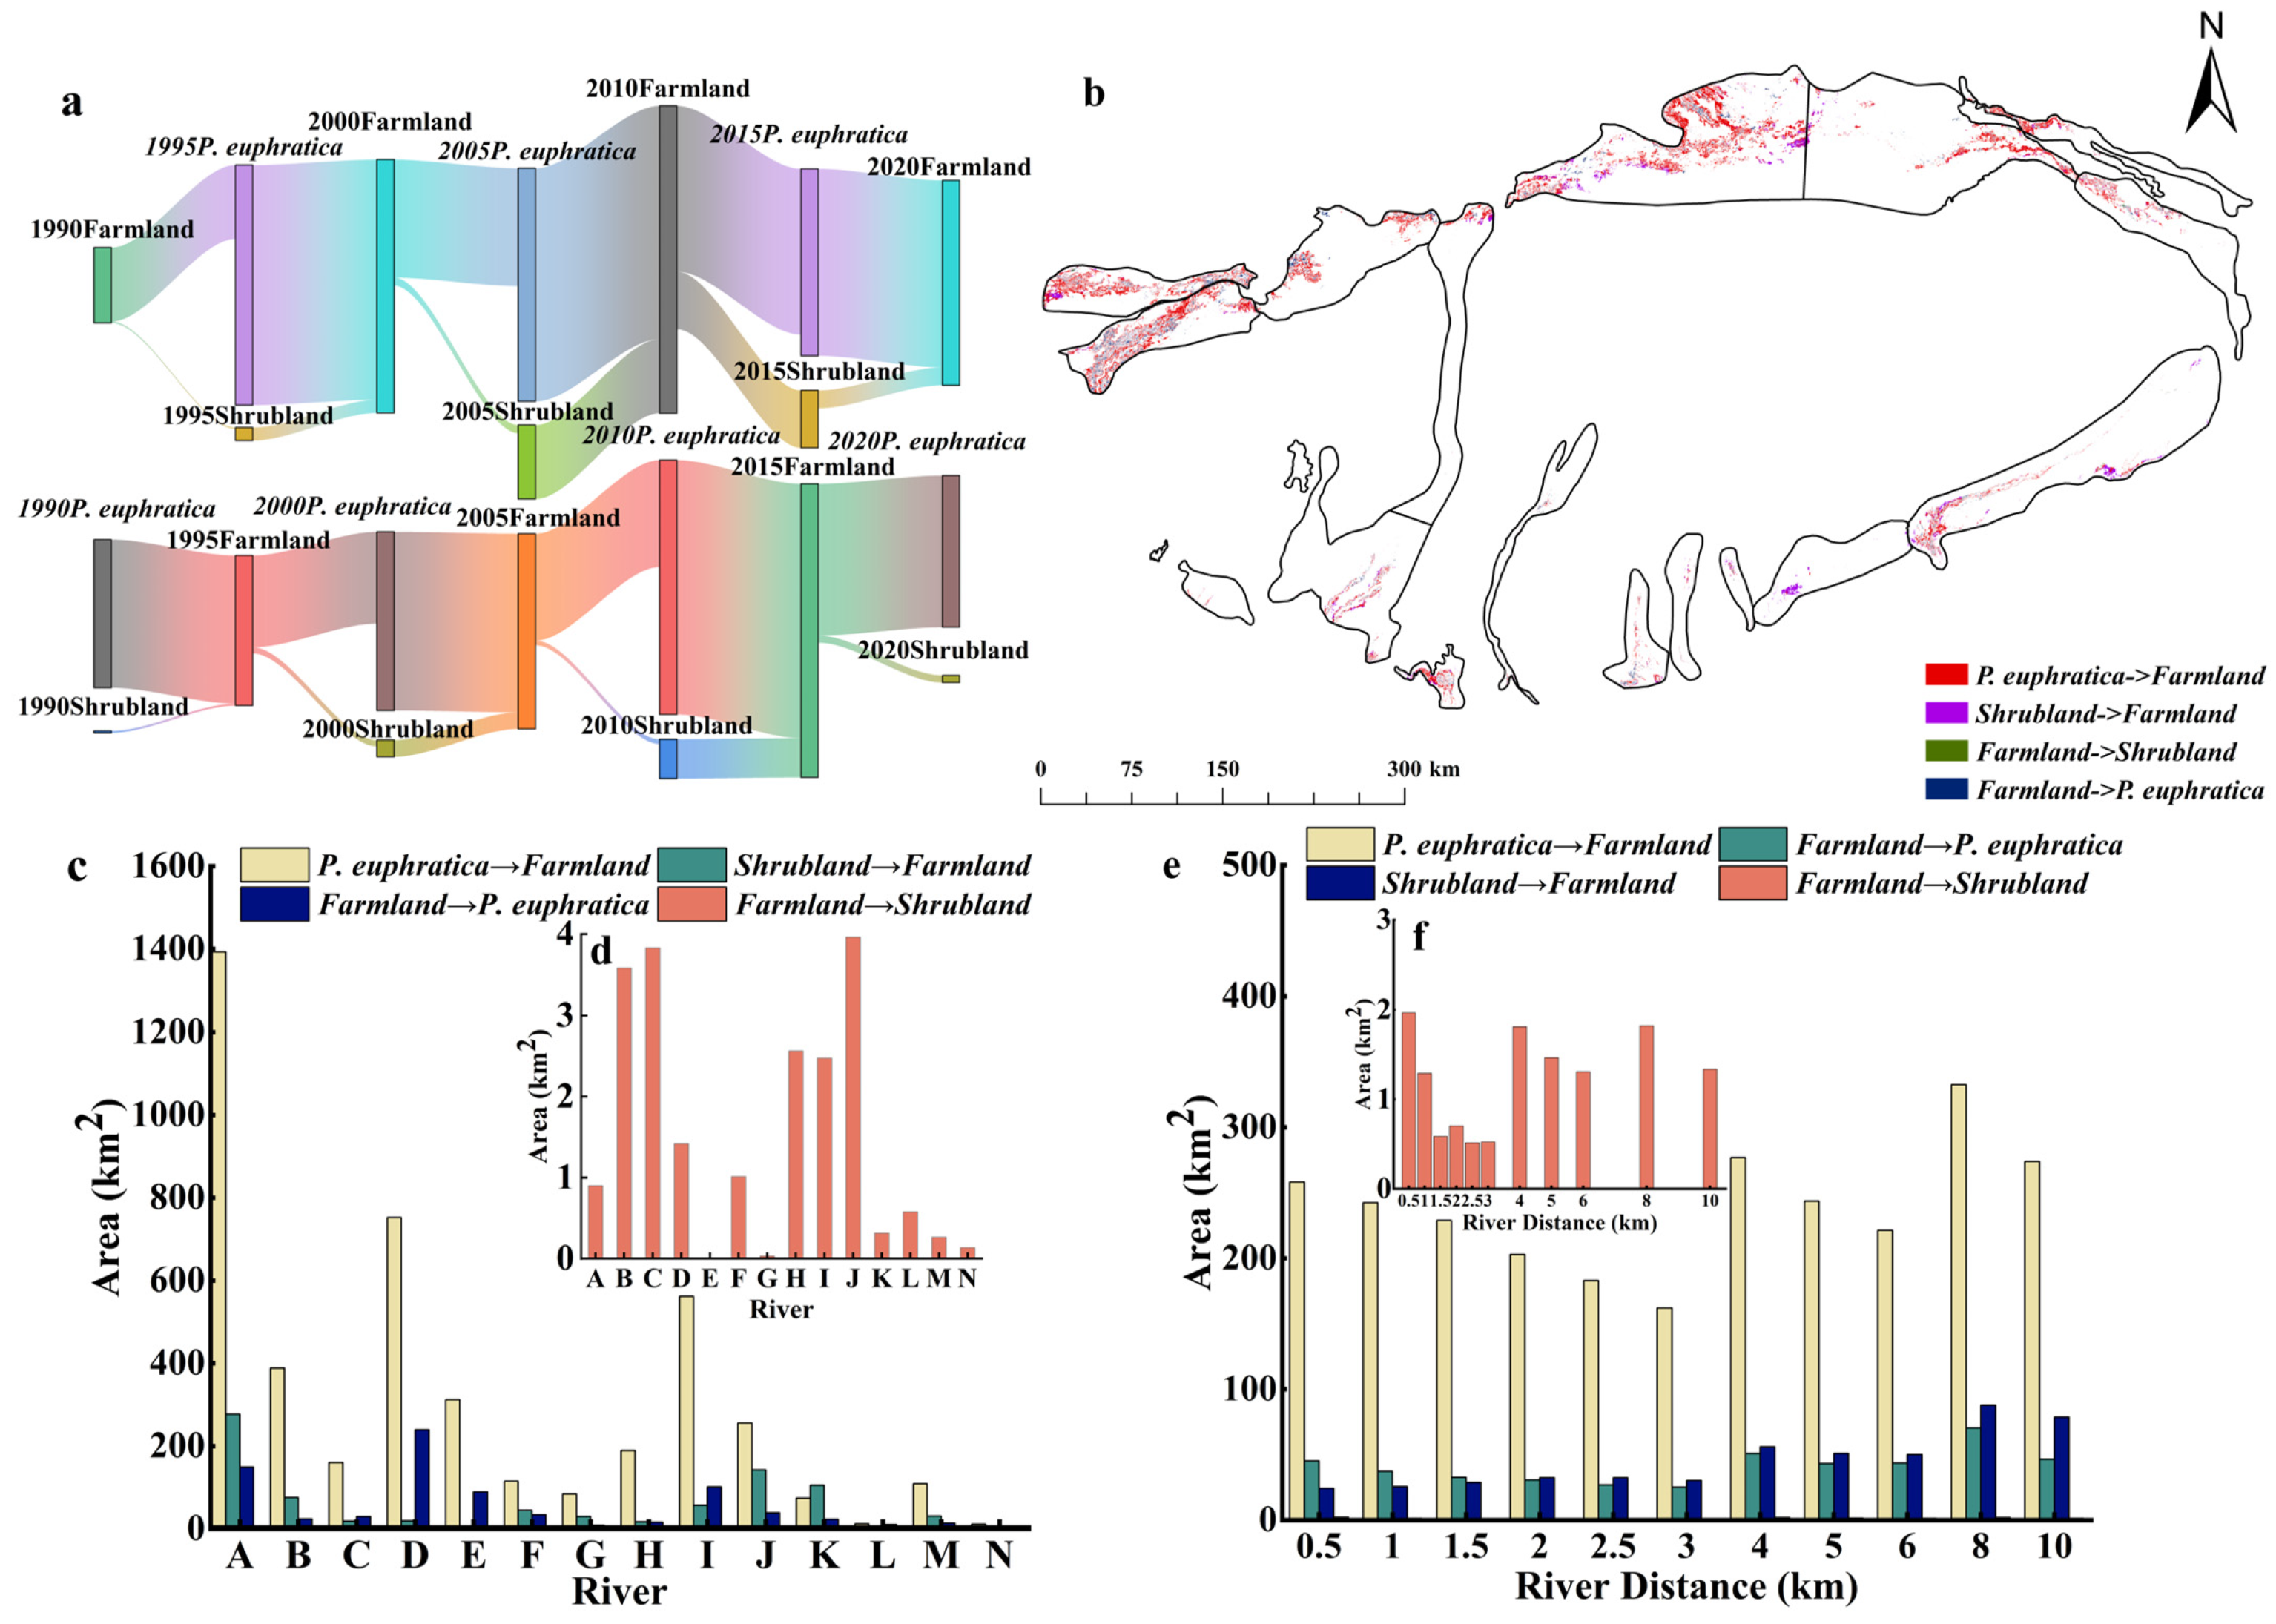
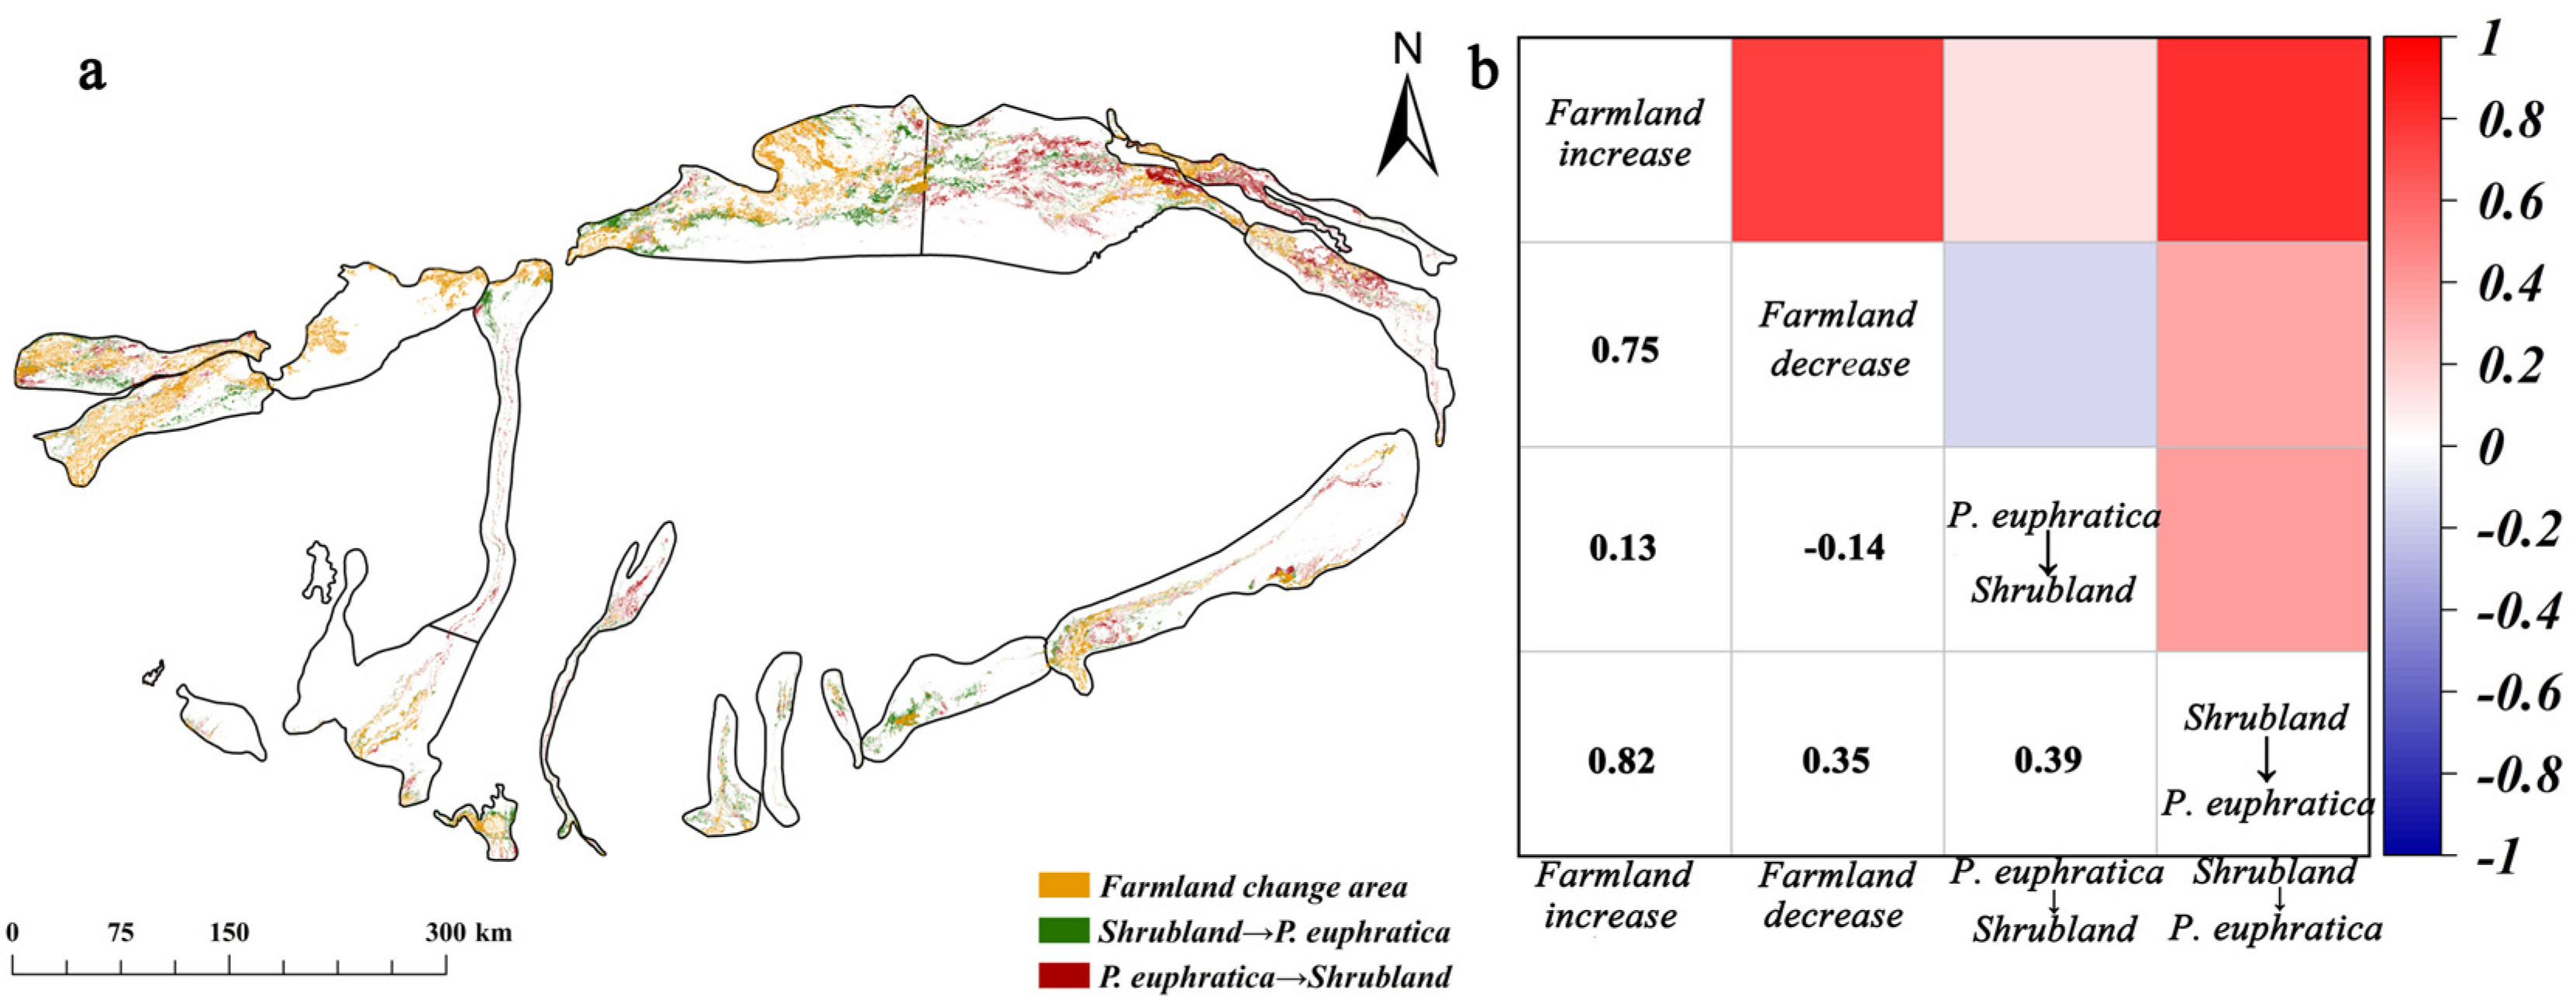
4.4. Farmland Effects on P. euphratica and Shrubland Distribution
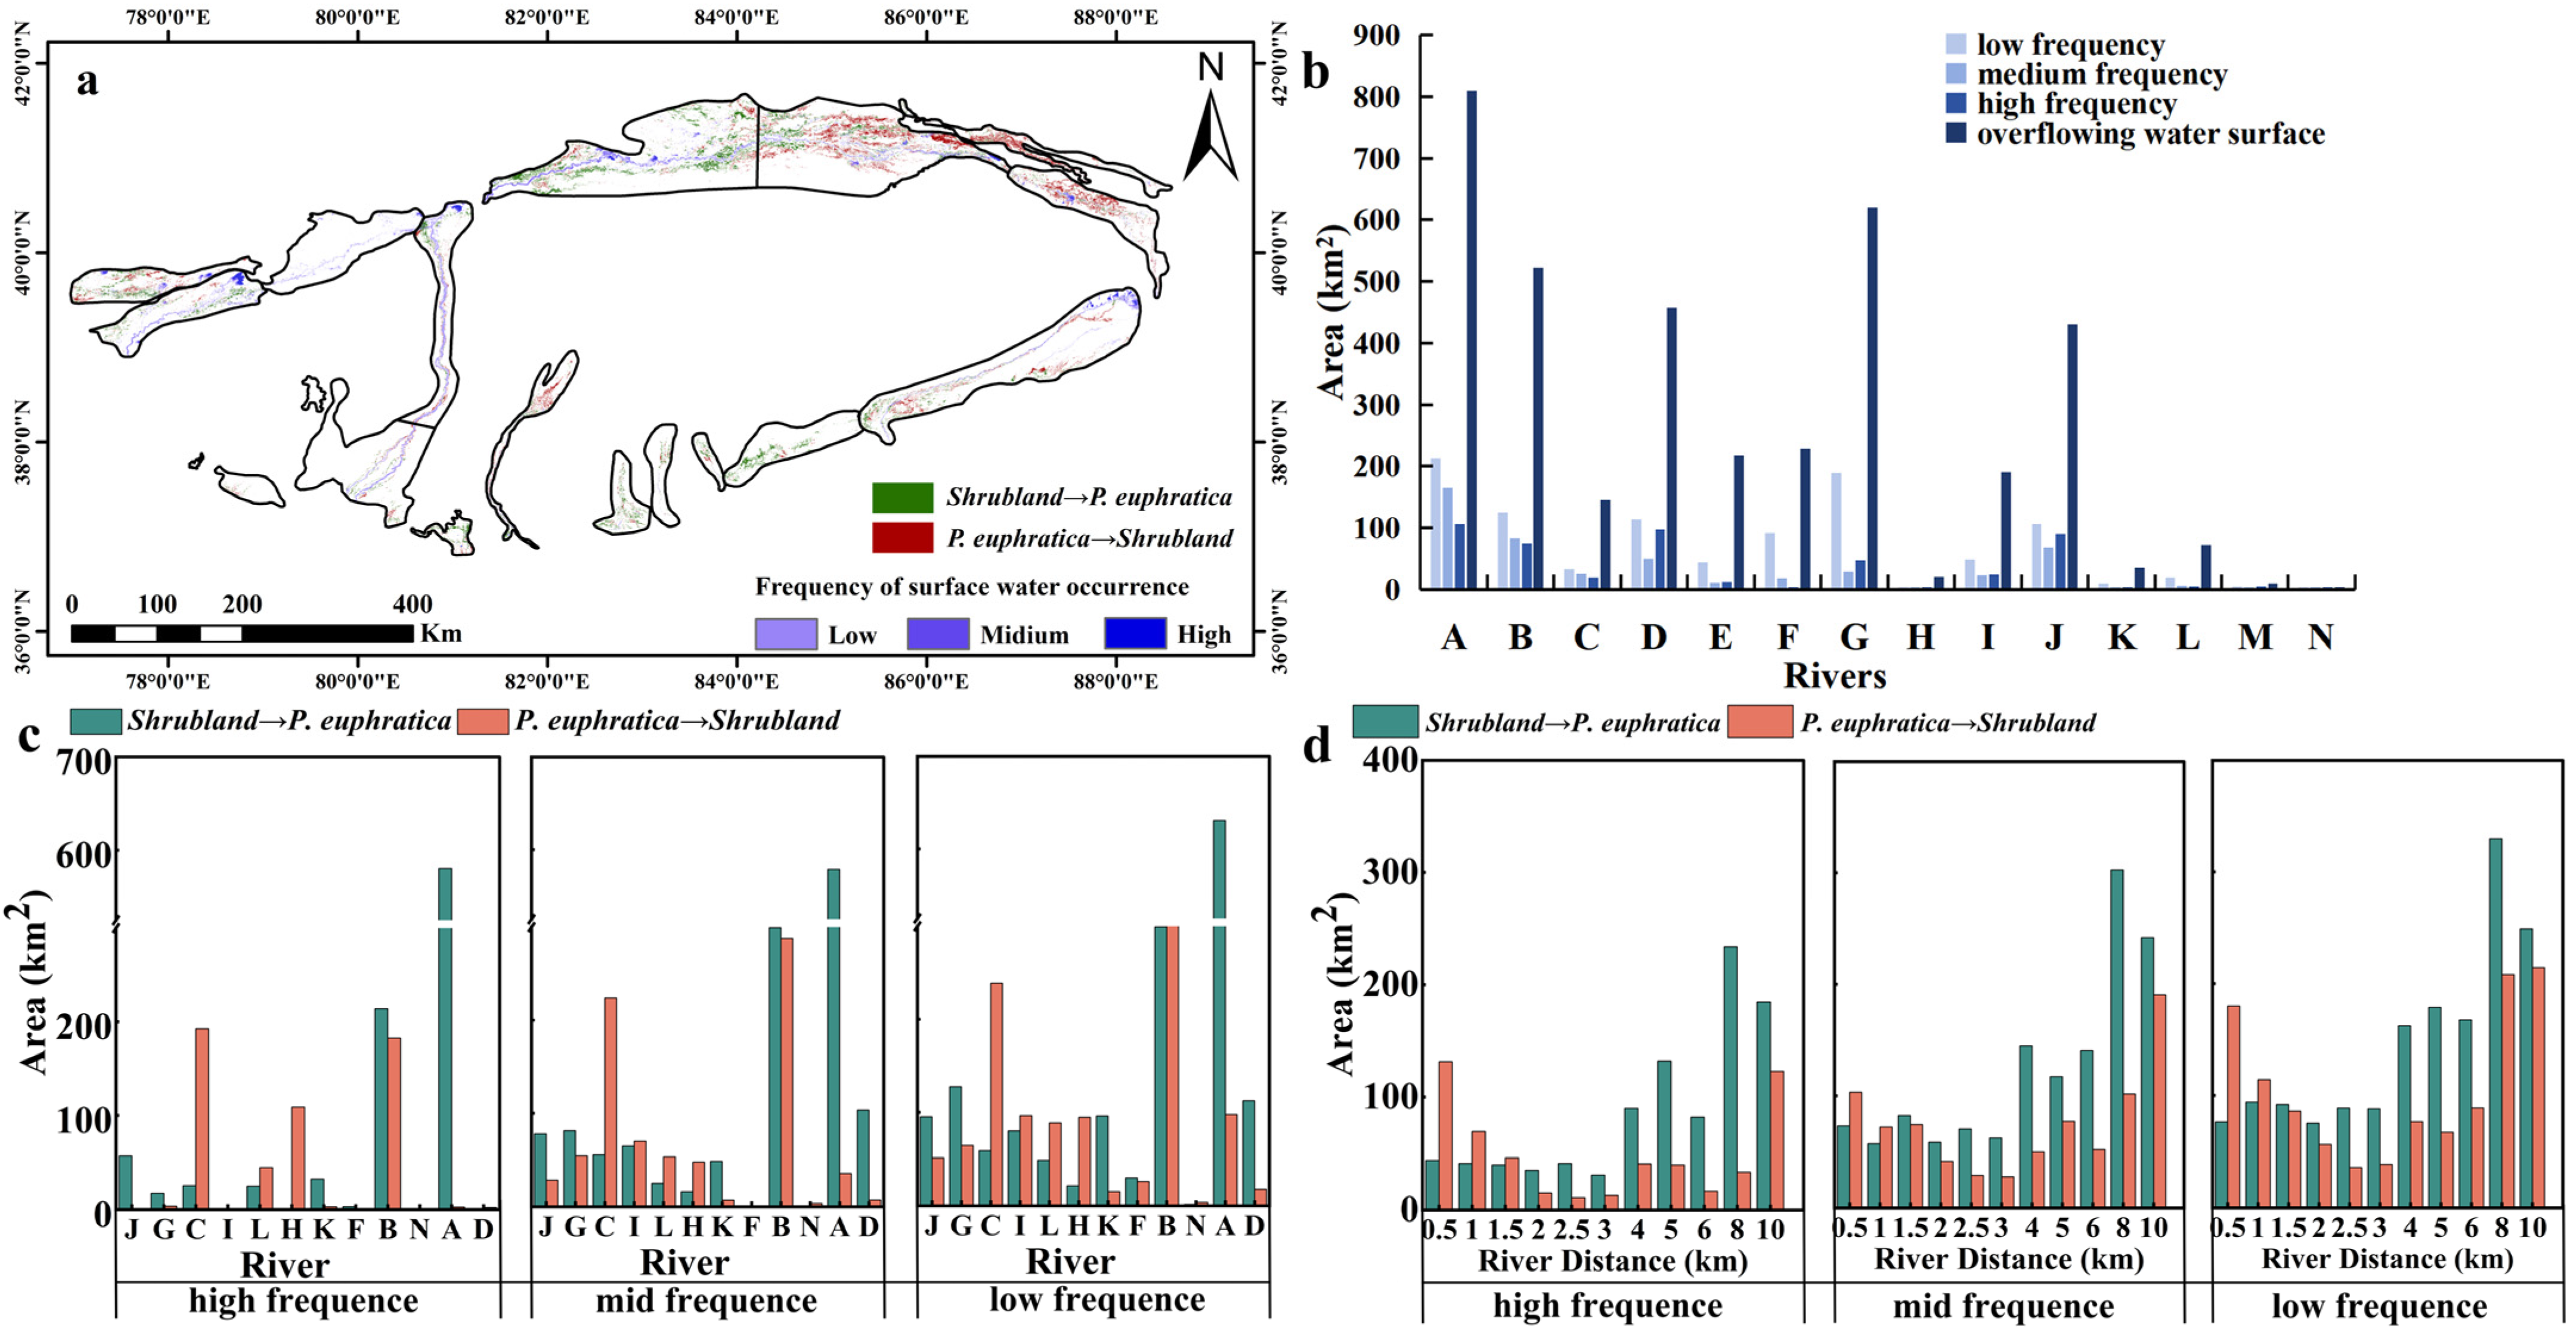
4.5. Water Effects on P. euphratica and Shrublands Distribution
5. Discussion
5.1. Shrublands Encroachment Effects on P. euphratica Distribution
5.2. Farmland Expansion Effects on P. euphratica Distribution
5.3. River Distance and Water Transfer Effects on P. euphratica Distribution
5.4. Suggestions for the Protection of P. euphratica Forests
6. Conclusions
Supplementary Materials
Author Contributions
Funding
Data Availability Statement
Acknowledgments
Conflicts of Interest
References
- Miao, N.; Jiao, P.; Tao, W.; Li, M.; Li, Z.; Hu, B.; Moermond, T.C. Structural dynamics of populus euphratica forests in different stages in the upper reaches of the tarim river in china. Sci. Rep. 2020, 10, 3196. [Google Scholar] [CrossRef] [PubMed]
- Zhang, P.; Deng, X.; Long, A.; Xu, H.; Ye, M.; Li, J. Change in spatial distribution patterns and regeneration of populus euphratica under different surface soil salinity conditions. Sci. Rep. 2019, 9, 9123. [Google Scholar] [CrossRef] [PubMed]
- Xue, L.; Fu, F.; Chen, X.; Liu, Y.; Han, Q.; Liao, S.; Wei, Q. Analysis on water use efficiency of Populus euphratica forest ecosystem in arid area. Theor. Appl. Climatol. 2021, 145, 717–730. [Google Scholar] [CrossRef]
- Zhou, H.; Chen, Y.; Zhu, C.; Li, Z.; Fang, G.; Li, Y.; Fu, A. Climate change may accelerate the decline of desert riparian forest in the lower tarim river, northwestern china: Evidence from tree-rings of Populus euphratica. Ecol. Indic. 2020, 111, 105997. [Google Scholar] [CrossRef]
- Li, Z. Populus Euphratica Forest in Xinjiang; China Forestry Publishing House: Beijing, China, 2020. [Google Scholar]
- Bai, Y.; Guo, C.; Degen, A.A.; Ahmad, A.A.; Wang, W.; Zhang, T.; Li, W.; Ma, L.; Huang, M.; Zeng, H.; et al. Climate warming benefits alpine vegetation growth in three-river headwater region, China. Sci. Total Environ. 2020, 742, 140574. [Google Scholar] [CrossRef] [PubMed]
- Keram, A.; Halik, Ü.; Keyimu, M.; Aishan, T.; Mamat, Z.; Rouzi, A. Gap dynamics of natural Populus euphratica floodplain forests affected by hydrological alteration along the tarim river: Implications for restoration of the riparian forests. For. Ecol. Manag. 2019, 438, 103–113. [Google Scholar] [CrossRef]
- Keram, A.; Halik, Ü.; Aishan, T.; Keyimu, M.; Jiapaer, K.; Li, G. Tree mortality and regeneration of euphrates poplar riparian forests along the tarim river, northwest China. For. Ecosyst. 2021, 8, 49. [Google Scholar] [CrossRef]
- Guo, Q.; Liu, J.; Yu, L.; Korpelainen, H.; Li, C. Different sexual impacts of dioecious Populus euphratica on microbial communities and nitrogen cycle processes in natural forests. For. Ecol. Manag. 2021, 496, 119403. [Google Scholar] [CrossRef]
- Chen, Y.; Chen, Y.; Zhou, H.; Hao, X.; Zhu, C.; Fu, A.; Yang, Y.; Li, W. Research advances in plant physiology and ecology of desert riparian forests under drought stress. Forests 2022, 13, 619. [Google Scholar] [CrossRef]
- Zhai, J.; Li, Z.; Si, J.; Zhang, S.; Han, X.; Chen, X. Structural and functional responses of the heteromorphic leaves of different tree heights on Populus euphratica oliv. To different soil moisture conditions. Plants 2022, 11, 2376. [Google Scholar] [CrossRef]
- Yu, L.; Tang, S.; Guo, C.; Korpelainen, H.; Li, C. Differences in ecophysiological responses of Populus euphratica females and males exposed to salinity and alkali stress. Plant Physiol. Biochem. 2023, 198, 107707. [Google Scholar] [CrossRef] [PubMed]
- Gai, Z.; Zhai, J.; Chen, X.; Jiao, P.; Zhang, S.; Sun, J.; Qin, R.; Liu, H.; Wu, Z.; Li, Z. Phylogeography reveals geographic and environmental factors driving genetic differentiation of populus sect. Turanga in northwest China. Front. Plant Sci. 2021, 12, 705083. [Google Scholar] [CrossRef] [PubMed]
- Li, Z.K.; Chen, Y.D.; Wang, J.L.; Jiang, L.M.; Fan, Y.X.; Lü, G.H. Foliar water uptake and its influencing factors differ between female and male Populus euphratica. Environ. Exp. Bot. 2023, 213, 105419. [Google Scholar] [CrossRef]
- Shi, H.; Shi, Q.; Zhou, X.; Imin, B.; Li, H.; Zhang, W.; Kahaer, Y. Effect of the competition mechanism of between co-dominant species on the ecological characteristics of Populus euphratica under a water gradient in a desert oasis. Glob. Ecol. Conserv. 2021, 27, e01611. [Google Scholar] [CrossRef]
- Han, L.; He, D. Leafing intensity decreases with increasing water table depth and plant height in Populus euphratica, a desert riparian species. Acta Oecologica 2020, 109, 103672. [Google Scholar] [CrossRef]
- Jiao, A.; Wang, Z.; Deng, X.; Ling, H.; Chen, F. Eco-hydrological response of water conveyance in the mainstream of the tarim river, China. Water 2022, 14, 2622. [Google Scholar] [CrossRef]
- Yao, S.; Wang, J.; Huang, W.; Jiao, P.; Peng, C.; Li, Y.; Song, S. Adaptation strategies of Populus euphratica to arid environments based on leaf trait network analysis in the mainstream of the tarim river. Forests 2024, 15, 437. [Google Scholar] [CrossRef]
- Ye, Y.; Liu, Y.; Ren, M.; Cai, Q.; Sun, C.; Li, Q.; Song, H.; Ye, M.; Zhang, T. Responses of tree growth and intrinsic water use efficiency to climate factors and human activities in upper reaches of tarim river in alaer, Xinjiang, China. Forests 2023, 14, 1873. [Google Scholar] [CrossRef]
- Aishan, T.; Mumin, R.; Halik, Ü.; Jiang, W.; Sun, Y.; Yusup, A.; Chen, T. Patterns in tree cavities (hollows) in euphrates poplar (Populus euphratica, salicaceae) along the tarim river in nw China. Forests 2024, 15, 421. [Google Scholar] [CrossRef]
- Peng, X.; Xiao, S.; Yang, B.; Yu, T. Water allocation and climate-impacted riparian forest dynamics in the ejina oasis, northwest China. Dendrochronologia 2022, 76, 126001. [Google Scholar] [CrossRef]
- Zhang, T.; Chen, Y. The effects of landscape change on habitat quality in arid desert areas based on future scenarios: Tarim river basin as a case study. Front. Plant Sci. 2022, 13, 1031859. [Google Scholar] [CrossRef] [PubMed]
- Zhang, T.; Chen, Y.; Ali, S. Abiotic stress and human activities reduce plant diversity in desert riparian forests. Ecol. Indic. 2023, 152, 110340. [Google Scholar] [CrossRef]
- Li, H.; Feng, J.; Bai, L.; Zhang, J. Populus euphratica phenology and its response to climate change in the upper tarim river basin, nw China. Forests 2021, 12, 1315. [Google Scholar] [CrossRef]
- Portela, A.P.; Gonçalves, J.F.; Durance, I.; Vieira, C.; Honrado, J. Riparian forest response to extreme drought is influenced by climatic context and canopy structure. Sci. Total Environ. 2023, 881, 163128. [Google Scholar] [CrossRef] [PubMed]
- Peng, Y.; He, G.; Wang, G. Spatial-temporal analysis of the changes in populus euphratica distribution in the tarim national nature reserve over the past 60 years. Int. J. Appl. Earth Obs. Geoinf. 2022, 113, 103000. [Google Scholar] [CrossRef]
- Shi, H.; Peng, X.; Zhou, Y.J.; Wang, A.Y.; Sun, X.K.; Li, N.; Bao, Q.S.; Buri, G.; Hao, G.Y. Resilience and response: Unveiling the impacts of extreme droughts on forests through integrated dendrochronological and remote sensing analyses. For. Ecosyst. 2024, 11, 100209. [Google Scholar] [CrossRef]
- Li, M.Y.; Deng, M.J.; Ling, H.B.; Han, F.F.; Yan, J.J.; Xu, J. Constructing a new irrigation model for desert riparian forests based on response of canopy evi loss and tree rings growth to groundwater fluctuation. Ecol. Indic. 2023, 148, 110060. [Google Scholar]
- Wang, H.; Gui, D.; Liu, Q.; Feng, X.; Qu, J.; Zhao, J.; Wang, G.; Wei, G. Vegetation coverage precisely extracting and driving factors analysis in drylands. Ecol. Inform. 2024, 79, 102409. [Google Scholar] [CrossRef]
- Su, Y.; Qi, Y.; Wang, J.; Xu, F.; Zhang, J. Land cover extraction in the ejina oasis by hyperspectral remote sensing. Remote Sens. Technol. Appl. 2018, 33, 202–211. [Google Scholar]
- Guo, X.; Zhu, L.; Tang, Y.; Li, Z. Increased humidity improved desert riparian ecosystems in the tarim river basin, northwest China, from 1990 to 2020. Sustainability 2023, 15, 14092. [Google Scholar] [CrossRef]
- Song, J.; Betz, F.; Aishan, T.; Halik, Ü.; Abliz, A. Impact of water supply on the restoration of the severely damaged riparian plants along the tarim river in Xinjiang, northwest China. Ecol. Indic. 2024, 158, 111570. [Google Scholar] [CrossRef]
- Wortmann, M.; Duethmann, D.; Menz, C.; Bolch, T.; Huang, S.; Tong, J.; Kundzewicz, Z.W.; Krysanova, V. Projected climate change and its impacts on glaciers and water resources in the headwaters of the tarim river, nw China/Kyrgyzstan. Clim. Chang. 2022, 171, 1–24. [Google Scholar] [CrossRef]
- Halik, Ü.; Aishan, T.; Betz, F.; Kurban, A.; Rouzi, A. Effectiveness and challenges of ecological engineering for desert riparian forest restoration along China’s largest inland river. Ecol. Eng. 2019, 127, 11–22. [Google Scholar] [CrossRef]
- Oliphant, A.J.; Thenkabail, P.S.; Teluguntla, P.; Xiong, J.; Gumma, M.K.; Congalton, R.G.; Yadav, K. Mapping cropland extent of southeast and northeast asia using multi-year time-series landsat 30-m data using a random forest classifier on the google earth engine cloud. Int. J. Appl. Earth Obs. Geoinf. 2019, 81, 110–124. [Google Scholar] [CrossRef]
- Zhang, J.; Feng, Z.; Jiang, L. Progress in research on land use land cover classification systems. Resour. Sci. 2011, 33, 1195–1203. [Google Scholar]
- Xu, X.; Liu, J.; Zhang, S.; Li, R.; Yan, C.; Wu, S. China Multi-Period Land Use REmote Sensing Monitoring Data Set (cnlucc). Resource Environmental Science Data Registry and Publication System. 2018. Available online: http://www.resdc.cn/DOI (accessed on 20 November 2023).
- Hasan, T.; Ismail, C.; Taskin, K. Classification of poplar trees with object-based ensemble learning algorithms using Sentinel-2A imagery. J. Geod. Sci. 2020, 10, 14–22. [Google Scholar]
- Breiman, L. Random forests. Mach. Learn. 2001, 45, 5–32. [Google Scholar] [CrossRef]
- Long, T.; Zhang, Z.; He, G.; Jiao, W.; Tang, C.; Wu, B.; Zhang, X.; Wang, G.; Yin, R. 30 m resolution global annual burned area mapping based on landsat images and google earth engine. Remote Sens. 2019, 11, 489. [Google Scholar] [CrossRef]
- McFeeters, S.K. The use of the normalized difference water index (ndwi) in the delineation of open water features. Int. J. Remote Sens. 2007, 17, 1425–1432. [Google Scholar] [CrossRef]
- Gong, P.; Wang, J.; Yu, L.; Zhao, Y.; Zhao, Y.; Liang, L.; Niu, Z.; Huang, X.; Fu, H.; Liu, S.; et al. Finer resolution observation and monitoring of global land cover: First mapping results with landsat tm and etm+ data. Int. J. Remote Sens. 2012, 34, 2607–2654. [Google Scholar] [CrossRef]
- Zhang, X.; Long, T.; He, G.-j.; Guo, Y.; Yin, R.; Zhang, Z.-m.; Xiao, H.; Li, M.; Cheng, B. Rapid generation of global forest cover map using landsat based on the forest ecological zones. J. Appl. Remote Sens. 2020, 14, 022211. [Google Scholar] [CrossRef]
- Tucker, C.J. Red and photographic infrared linear combinations for monitoring vegetation. Remote Sens. Environ. 1979, 8, 127–150. [Google Scholar] [CrossRef]
- Wang, G.; Peng, W.; Zhang, L.; Zhang, J.; Xiang, J. Vegetation evi changes and response to natural factors and human activities based on geographically and temporally weighted regression. Glob. Ecol. Conserv. 2023, 45, e02531. [Google Scholar] [CrossRef]
- Zheng, Y.; Tang, L.; Wang, H. An improved approach for monitoring urban built-up areas by combining npp-viirs nighttime light, ndvi, ndwi, and ndbi. J. Clean. Prod. 2021, 328, 129488. [Google Scholar] [CrossRef]
- Congalton, R.G. A review of assessing the accuracy of classifications of remotely sensed data. Remote Sens. Environ. 1991, 37, 35–46. [Google Scholar] [CrossRef]
- Aldwaik, S.Z.; Pontius, R.G. Intensity analysis to unify measurements of size and stationarity of land changes by interval, category, and transition. Landsc. Urban Plan. 2012, 106, 103–114. [Google Scholar] [CrossRef]
- Ke, Y.M.; Shen, Z.F.; Li, J.L.; Bai, J.; Deng, L.Y.; Xu, Z.Y. Temporal and spatial change of sown area of crop and its influencing factors in main stream of Tarim River from 1994 to 2018. Trans. Chin. Soc. Agric. Eng. Trans. CSAE 2019, 35, 180–188. [Google Scholar]
- Kondum, F.A.; Rowshon, M.K.; Luqman, C.A.; Hasfalina, C.M.; Zakari, M.D. Change analyses and prediction of land use and land cover changes in Bernam River Basin, Malaysia. Remote Sens. Appl. Soc. Environ. 2024, 36, 101281. [Google Scholar] [CrossRef]
- Peng, Y.; He, G.; Wang, G.; Cao, H. Surface water changes in dongting lake from 1975 to 2019 based on multisource remote-sensing images. Remote Sens. 2021, 13, 1827. [Google Scholar] [CrossRef]
- Pekel, J.F.; Cottam, A.; Gorelick, N.; Belward, A.S. High-resolution mapping of global surface water and its long-term changes. Nature 2016, 540, 418–422. [Google Scholar] [CrossRef]
- Chandrasekar, K.; Sesha Sai, M.V.R.; Roy, P.S.; Dwevedi, R.S. Land surface water index (lswi) response to rainfall and ndvi using the modis vegetation index product. Int. J. Remote Sens. 2010, 31, 3987–4005. [Google Scholar] [CrossRef]
- Peng, S.; Chen, X.; Qian, J.; Liu, S. Spatial pattern of populus euphratica forest change as affected by water conveyance in the lower tarim river. Forests 2014, 5, 134–152. [Google Scholar] [CrossRef]
- Li, J.; Xiao, H.; Shen, Z.; Bai, J. Vegetation changes during the 2013–2018 period and its response to ecological water transport in the lower reaches of the tarim river. Arid Zone Res. 2020, 37, 985–992. [Google Scholar]
- Zhao, X.; Xu, H.; Aili, A.S.; Zhang, Q.; Liu, K. Whether the ecological benefits will continue to increase as usual and improve under the background of continuous ecological water delivery?—Taking the lower tarim river in china as an example. Ecol. Indic. 2024, 159, 111733. [Google Scholar] [CrossRef]
- Li, W.; Huang, F.; Shi, F.; Wei, X.; Zamanian, K.; Zhao, X. Human and climatic drivers of land and water use from 1997 to 2019 in tarim river basin, China. Int. Soil Water Conserv. Res. 2021, 9, 532–543. [Google Scholar] [CrossRef]
- Säumel, I.; Ziche, D.; Yu, R.; Kowarik, I.; Overdieck, D. Grazing as a driver for Populus euphratica woodland degradation in the semi-arid aibi hu region, northwestern China. J. Arid Environ. 2011, 75, 265–269. [Google Scholar] [CrossRef]
- Maimaiti, B.; Chen, S.; Kasimu, A.; Simayi, Z.; Aierken, N. Urban spatial expansion and its impacts on ecosystem service value of typical oasis cities around tarim basin, northwest China. Int. J. Appl. Earth Obs. Geoinf. 2021, 104, 102554. [Google Scholar] [CrossRef]
- Schooley, R.L.; Bestelmeyer, B.T.; Wagnon, C.J.; Coffman, J.M. Shrub encroachment, landscape restoration, and intraguild predation. J. Arid Environ. 2021, 193, 104588. [Google Scholar] [CrossRef]
- Ma, S.; Wang, L.; Jiang, J.; Zhao, Y. Direct and indirect effects of agricultural expansion and landscape fragmentation processes on natural habitats. Agric. Ecosyst. Environ. 2023, 353, 108555. [Google Scholar] [CrossRef]
- Pompeu, J.; de Oliveira Portella, R. Genetic viability and habitat suitability of the critically endangered southern muriqui (brachyteles arachnoides) in the atlantic forest’s fragmented landscapes under land use and climate change scenarios. Clim. Chang. Ecol. 2023, 5, 100065. [Google Scholar] [CrossRef]
- Wang, W.; Chen, Y.; Wang, W.; Chen, Y.; Hou, Y. Groundwater level dynamic impacted by land-cover change in the desert regions of tarim basin, central Asia. Water 2023, 15, 3601. [Google Scholar] [CrossRef]
- Liu, Y.; Zang, Y.; Yang, Y. China’s rural revitalization and development: Theory, technology and management. J. Geogr. Sci. 2020, 30, 1923–1942. [Google Scholar] [CrossRef]
- Yusup, A.; Halik, Ü.; Abliz, A.; Aishan, T.; Keyimu, M.; Wei, J. Population structure and spatial distribution pattern of Populus euphratica riparian forest under environmental heterogeneity along the tarim river, northwest China. Front. Plant Sci. 2022, 13, 844819. [Google Scholar] [CrossRef] [PubMed]
- Ye, Z.; Wang, J.; Wang, W.; Zhang, T.; Li, J. Effects of root phenotypic changes on the deep rooting of Populus euphratica seedlings under drought stresses. PeerJ 2019, 7, e6513. [Google Scholar] [CrossRef] [PubMed]
- Chen, Y.; Li, W.; Zhou, H.; Chen, Y.; Hao, X.; Fu, A.; Ma, J. Experimental study on water transport observations of desert riparian forests in the lower reaches of the tarim river in China. Int. J. Biometeorol. 2017, 61, 1055–1062. [Google Scholar] [CrossRef] [PubMed]
- Wang, H.; Liu, Q.; Gui, D.; Feng, X.; Qu, J.; Zhao, J.; Wang, G.; Wei, G. Simulation of potential vegetation distribution in arid areas at regional scale. CATENA 2023, 232, 107428. [Google Scholar] [CrossRef]
- Wan, Y.; Shi, Q.; Dai, Y.; Li, T.; Peng, L.; Li, H. Water sources of Populus euphratica with different tree ages in the oasis of desert hinterland. J. Appl. Ecol. 2022, 33, 353–359. [Google Scholar]
- Ling, H.; Zhang, P.; Xu, H.; Zhao, X. How to regenerate and protect desert riparian Populus euphratica forest in arid areas. Sci. Rep. 2015, 5, 15418. [Google Scholar] [CrossRef] [PubMed]
- Shi, F.; Li, X.; Wang, Y.; Ma, X.; Zhu, J.; Zhao, C. Streamflow consumption vs. Climate change in the evolution of discharge in the tarim river basin, northwest China. Water 2022, 14, 392. [Google Scholar] [CrossRef]
- Ling, H.; Guo, B.; Xu, H.; Fu, J. Configuration of water resources for a typical river basin in an arid region of china based on the ecological water requirements (ewrs) of desert riparian vegetation. Glob. Planet. Chang. 2014, 122, 292–304. [Google Scholar] [CrossRef]
- Qian, J.; Zhao, Y.; Feng, X.; Gui, D. Simulation and prediction of monthly ccumulated runoff, based on several neural network models under poor data availability. Sci. Cold Arid 2018, 10, 468–481. [Google Scholar]
- Da, W.; Wang, S.; Shen, Y. Hydrological response to the climatic changes in the qarqan river basin at the northern slope of kunlun mountains during 1957–2019. J. Glaciol. Geocryol. 2022, 44, 46–55. [Google Scholar]
- Li, X.; Zhu, C.; Ma, Y.; Wang, X.; Wang, J.; Chen, Y. Ecological baseflow and natural vegetation water requirement of konqi river basin, Xinjiang. Arid Land Geogr. 2021, 44, 337–345. [Google Scholar]
- Hu, K.; He, J.; Zhao, J.; Tayier, S. Spatial and temporal characteristics of ecological base flow in typical rivers at the northern slope of kunlun mountains in the past four decades. J. Chang. River Sci. Res. Inst. 2024, 41, 44–51. [Google Scholar]
- Deng, M.; Yang, P.; Zhou, H.; Xu, H. Water conversion and strategy of ecological water conveyance in the lower reaches of the tarim river. Arid Zone Res. 2017, 34, 717–726. [Google Scholar]
- Li, W.; Wumaierjiang, W.; Ma, Y. Ecological water conveyance project based on river-lake-reservoir connected system in the kongque river. Desert Oasis Meteorol. 2019, 13, 130–135. [Google Scholar]
- Gao, S.F.; Ye, M. Effect of flood on growth of Populus euphratica in extreme arid region in the upper and middle reaches of tarim river for example. Ecol. Sci. 2020, 39, 50–57. [Google Scholar]
- Bao, A.; Huang, Y.; Ma, Y.; Guo, H.; Wang, Y. Assessing the effect of ewdp on vegetation restoration by remote sensing in the lower reaches of tarim river. Ecol. Indic. 2017, 74, 261–275. [Google Scholar] [CrossRef]
- Li, J.; Xu, H.L.; Wang, Y.h.; Zhao, X.F.; Gao, S.F. Evaluation on Response of Populus euphratica Population Growth and Plant Diversity to Flooding Irrigation in Lower Reaches of Yarkant River Basin. J. Ecol. Rural Environ. 2019, 35, 859–866. [Google Scholar]
- Zhang, Y.; Wu, Z.; Shi, R.; Shen, Z.; Fan, K.; Zhang, Q. Study on the impact of ecological water recharge on vegetation changes in the hotan river basin based on multi-source remote sensing. J. Beijing Norm. Univ. Nat. Sci. Ed. 2022, 58, 125–134. [Google Scholar]
- Zhao, N.; Li, J.; Liu, J. Countermeasures for ecological environmental protection and engineering regulation of wetlands in the lower keriya river. Water Plan. Des. 2021, 7, 35–39. [Google Scholar]
- Liu, C.; Yan, X.; Jiang, F. Desert vegetation responses to the temporal distribution patterns of precipitation across the northern Xinjiang, China. Catena 2021, 206, 105544. [Google Scholar] [CrossRef]
- Xu, S.X.; Wang, Y.H.; Liu, Y.; Li, J.X.; Qian, K.X.; Yang, X.Y.; Ma, X.F. Evaluating the cumulative and time-lag effects of vegetation response to drought in Central Asia under changing environments. J. Hydrol. 2023, 627, 130455. [Google Scholar] [CrossRef]
- Zhao, X.; Xu, H.; Zhang, P.; Bai, Y.; Zhang, Q. Impact of changing irrigation patterns on saltwater dynamics of soil in farmlands and their shelterbelts in the irrigated zone of kalamiji oasis. J. Irrig. Drain. 2015, 64, 393–399. [Google Scholar] [CrossRef]
- Zhao, X.; Xu, H. Study on vegetation change of taitemar lake during ecological water transfer. Environ. Monit. Assess. 2019, 191, 613. [Google Scholar] [CrossRef]


| Number | Code | P. euphratica Forest Distribution Rivers | Administrative Subdivision |
|---|---|---|---|
| 1 | A | Up-Tarim River | Shojak-Imbazar section of Shaya County |
| 2 | B | Mid-Tarim River | Yingbazha-Qala section bugur and Kuqa counties |
| 3 | C | Down-Tarim River | Yuli County from below Daxihaizi to above Lake Daitama |
| 4 | D | Up-Yarkand River | Shamal Forest and Bachu County |
| 5 | E | Down-Yarkand River | The three missions in Keping County and the three harvest fields in Awati County |
| 6 | F | Mid-Hotan River | The Krakash River in Lopu County and the Moyu River in Moyu County |
| 7 | G | Down-Hotan River | P. euphratica forests along the Bostan Ranch and Hotan River in Awati County |
| 8 | H | Kongque River | Acha Junction to Gili Changkou Gate Section |
| 9 | I | Kashgar River | Payzawat County |
| 10 | J | Cherchen River | Qiemo County |
| 11 | K | Rivers in the northern Kunlun Mountains | P. euphratica forests along the Niya River and scattered along small rivers |
| 12 | L | Keriya River | Primitive P. euphratica forests along the rivers of the Keriya River and Dariyabui |
| 13 | M | Cele River | Qira County |
| 14 | N | Sangzhu River | Pishan County |
| Class ID | Class Name | Description |
|---|---|---|
| 1 | Farmland | Areas with a combination of standard farmland, basic farmland, and fallow farmland for each year. The texture characteristics of farmland are block shaped distribution and bright red color. |
| 2 | P. euphratica forest | Areas with dense, sparse, healthy, and unhealthy P. euphratica. Vegetation coverage greater than 10%. The texture features of P. euphratica forest are dark red dots with rough edges. |
| 3 | Shrubland | Areas with dense, sparse shrubland. The texture characteristics of shrubbery are circular clumps of light red, with delicate edges, and generally larger individual coverage areas than P. euphratica. |
| Type | Feature | Resolution (m) | Source |
|---|---|---|---|
| Spectrum | Red, Green, Blue, NIR, SWIR1, SWIR2 | 30 | Landsat |
| Red, Green, Blue, RE1, RE2, NIRn1, NIRn2, NIR, SWIR1, SWIR2 | 10–60 | Sentinel-2 | |
| Spectral index | NDVI = (NIR − Red)/(NIR + Red) | 30 | Landsat |
| MNDWI = (Green − SWIR)/(Green + SWIR) | |||
| NDBI = (SWIR − NIR)/(SWIR + NIR) | |||
| EVI = 2.5 × ((NIR − Red)/(NIR + 6 × Red − 7.5 × Blue + 1)) | |||
| NDVI704 = (RE2 − RE1/RE2 + RE1) | 20 | Sentinel-2 |
| River | P. euphratica Forest Area | Changes in River Systems |
|---|---|---|
| Cele River | Decrease | Disconnection by 2010 [73] |
| Cherchen River | Decrease | Disconnection by 2000 [74] |
| Up-Tarim River | Decrease | The change is not obvious |
| Mid-Tarim River | Decrease | The change is not obvious |
| Down-Tarim River | Decrease | Disconnection by 2000 [67] |
| Kashgar River | Decrease | The change is not obvious |
| Keriya River | Increase | Decrease |
| Kongque River | Decrease | Decreased until 2000, increased thereafter [75] |
| the rivers on the northern slopes of the Kunlun Mountains | Increase | Increase [76] |
| Mid-Hotan River | Increase | The change is not obvious |
| Down-Hotan River | Increase | The change is not obvious |
| Up-Yarkand River | Decrease | The change is not obvious |
| Down-Yarkand River | Increase | The change is not obvious |
| Sangzhu River | Decrease | The change is not obvious |
| River | Year of Water Transfer | Total Water Transfer (billion m3/a) | Number of Water Transfer | Mode of Water Transfer | P. euphratica Forest Area |
|---|---|---|---|---|---|
| Kongque River | 2016 | 20.88 | 6 | River-Lake-Reservoir Water System Connections for Drainage [78] | decrease |
| Up-Tarim River | 2016 [79] | 90.15 | 24 | Ecological channels and streams | decrease |
| Mid-Tarim River | 2016 [79] | Ecological channels and streams | decrease | ||
| Down-Tarim River | 2000 [80] | Artificial water channels | decrease | ||
| Up-Yarkand River | 2016 [81] | 13.46 | 7 | Ecological and artificial water channels | decrease |
| Down-Yarkand River | 2016 [81] | Ecological and artificial water channels | increase | ||
| Kashgar River | 2022 | 8 | 1 | Natural rivers and streams | decrease |
| Sangzhu River | / | Natural rivers and streams | decrease | ||
| Mid-Hotan River | 2017 [82] | Artificial water channels | increase | ||
| Down-Hotan River | 2017 [82] | Natural rivers and streams | increase | ||
| Cele River | 2019 | Natural rivers and streams | decrease | ||
| Keriya River | 2016 [83] | Natural rivers and streams | increase | ||
| the rivers on the northern slopes of the Kunlun Mountains | 2019 | Natural rivers and streams | increase | ||
| Cherchen River | 2019 [84] | Natural rivers and streams | decrease |
| River | P. euphratica Forest Area | River System | Overflow Water Surface Area (km2) | Frequency of Water Transfer | Farmland Area |
|---|---|---|---|---|---|
| Cele River | Decrease | Disconnection by 2010 | 5.34 | 53.69% extremely low | Increase |
| Cherchen River | Decrease | Disconnection by 2000 | 166.8 | 20.91% high | Increase |
| Up-Tarim River | Decrease | Not obvious | 325.68 | 40.21% extremely low, 26.31% low, 13.09% medium. | Increase |
| Mid-Tarim River | Decrease | Not obvious | 238.86 | 45.76% extremely low, 39.93% medium, 14.31% high | Decrease |
| Down-Tarim River | Decrease | Disconnection by 2000 | 67.75 | 70% high1% low | Increase |
| Kashgar River | Decrease | Not obvious | 94.32 | 74.88% low | Increase |
| Keriya River | Increase | Decrease | 44.92 | 49.58% extremely low | No change |
| Kongque River | Decrease | Disconnection by 2000 | 21.61 | 92.67% low | Decrease |
| The rivers on the northern slopes of the Kunlun Mountains | Increase | Increase | 18.91 | 79.93% low | Increase |
| Mid-Hotan River | Increase | Not obvious | 114.98 | 90.39% low | Increase |
| Down-Hotan River | Increase | Not obvious | 353.53 | 87.57% low | Increase |
| Up-Yarkand River | Decrease | Not obvious | 198.68 | 42.95% extremely low, 31.94% medium | Decrease |
| Down-Yarkand River | Increase | Not obvious | 150.83 | 89.65% low | Decrease |
| Sangzhu River | Decrease | Not obvious | 0.73 | No water transfer | Increase |
Disclaimer/Publisher’s Note: The statements, opinions and data contained in all publications are solely those of the individual author(s) and contributor(s) and not of MDPI and/or the editor(s). MDPI and/or the editor(s) disclaim responsibility for any injury to people or property resulting from any ideas, methods, instructions or products referred to in the content. |
© 2024 by the authors. Licensee MDPI, Basel, Switzerland. This article is an open access article distributed under the terms and conditions of the Creative Commons Attribution (CC BY) license (https://creativecommons.org/licenses/by/4.0/).
Share and Cite
Guo, X.; Zhu, L.; Yang, Z.; Yang, C.; Li, Z. Spatial–Temporal Changes in the Distribution of Populus euphratica Oliv. Forests in the Tarim Basin and Analysis of Influencing Factors from 1990 to 2020. Forests 2024, 15, 1384. https://doi.org/10.3390/f15081384
Guo X, Zhu L, Yang Z, Yang C, Li Z. Spatial–Temporal Changes in the Distribution of Populus euphratica Oliv. Forests in the Tarim Basin and Analysis of Influencing Factors from 1990 to 2020. Forests. 2024; 15(8):1384. https://doi.org/10.3390/f15081384
Chicago/Turabian StyleGuo, Xuefei, Lijun Zhu, Zhikun Yang, Chaobin Yang, and Zhijun Li. 2024. "Spatial–Temporal Changes in the Distribution of Populus euphratica Oliv. Forests in the Tarim Basin and Analysis of Influencing Factors from 1990 to 2020" Forests 15, no. 8: 1384. https://doi.org/10.3390/f15081384