Article

Dynamic Changes in Endogenous Substances in Flowering Organs of Camellia drupifera during the Flowering Stage

1
Department of Forestry, College of Forestry and Landscape Architecture, South China Agricultural University, Guangzhou 510642, China
2
Guangdong Key Laboratory for Innovative Development and Utilization of Forest Plant Germplasm, Guangzhou 510642, China
*
Authors to whom correspondence should be addressed.
Forests 2024, 15(8), 1391; https://doi.org/10.3390/f15081391
Submission received: 7 July 2024 / Revised: 2 August 2024 / Accepted: 3 August 2024 / Published: 9 August 2024

Abstract

:
Camellia drupifera is an important woody oil plant in South China, renowned for its seed oil that is rich in unsaturated fatty acids and possesses significant antioxidant, anti-cancer, and immune-enhancing properties. The low fruit-setting rate of C. drupifera is influenced by multiple factors, including flowering stage climate, flowering habits, pollination biology, soil conditions, and self-incompatibility. Among these, large-scale pure forest plantations are the primary cause of the low fruit-setting rate. Although previous studies have explored the impact of self-incompatibility on fruit-setting in C. drupifera, research on the dynamic changes of endogenous substances during the flowering stage in pure forest environments remains limited. Research findings indicate that tannase activity is relatively high in the pistils of C. drupifera, creating a favorable environment for pollen tube growth. Plant hormones such as indole-3-acetic acid (IAA), cytokinin (CTK), gibberellin (GA), and ethylene (ETH) regulate the development and aging of floral organs through complex interactions. Specifically, high levels of IAA in the pistil promote pollen tube growth, while changes in ETH and ABA are closely related to the aging of floral organs. Under oxidative stress conditions, high levels of H2O2 in the pistil may contribute to self-incompatibility. The activity of superoxide dismutase (SOD) in the floral organs during the flowering stage is significantly higher compared to peroxidase (POD) and catalase (CAT), highlighting the critical role of SOD in regulating oxidative stress during this stage. This study provides new insights into the changes in endogenous substances in the floral organs of C. drupifera during the flowering stage. It offers theoretical references for understanding its sexual reproduction process and for the application of plant growth regulators to improve fruit setting.

1. Introduction

Camellia drupifera, also known as South China oil-tea or large-fruited oil-tea, is an evergreen shrub or small to medium-sized tree belonging to the family Theaceae and genus Camellia. As one of the important woody oil-bearing tree species in South China, its seed oil is rich in unsaturated fatty acids and exhibits significant antioxidant, anticancer, and immune-enhancing properties [1]. Consequently, it has broad application prospects in medicine, health foods, and daily chemical products, demonstrating notable effects in the prevention and treatment of cardiovascular diseases.
Camellia drupifera is widely cultivated in South China. However, the low fruit-set rate of this species results in reduced fruit yield and economic benefits. Studies have reported that the low fruit set rate in Camellia species is influenced by several factors, including flowering stage climate (temperature, light, moisture), flowering habits (phenology and flower organ receptivity), pollination biology (pollinator insects), soil conditions (soil organic matter, humus, mineral particles, and elements), and self-incompatibility (SI) [2,3,4,5,6,7,8,9,10,11,12]. The flowering stage of C. drupifera mainly occurs from early November to late January of the following year [1]. During this stage, continuous rain and frost can affect insect activity and flowering pollination, while warm, sunny weather enhances the activity of pollinators (mainly bees) and improves pollination conditions, leading to higher fruit set rates [8,12]. In the peak flowering stage, rain or prolonged low temperatures can cause flower buds to drop or rot before opening. Additionally, SI is a significant factor affecting fruit yield; it is a reproductive mechanism that prevents self-pollination and is controlled by genetic mechanisms. Increasing evidence suggests that SI is closely related to endogenous hormone levels, antioxidant enzyme systems, carbon-nitrogen assimilation products, and the recognition between pollen and stigma [2,9,13,14,15,16,17,18,19]. Although SI has become a focal area of research in regulating fruit set in Camellia species, existing studies have mainly focused on anatomical observations and molecular mechanisms of sexual reproduction and fruit-set [2,9,14,15,16,17,18]. There is still a lack of comprehensive research on the dynamic responses and roles of plant hormones and other critical metabolites under self-pollination conditions during the flowering stage. Furthermore, studies on the changes in endogenous substances in Camellia species, particularly C. oleifera, have been relatively detailed, focusing on different stages of flower bud differentiation and various cultivation treatments and environmental conditions [20,21]. However, comprehensive reports on the physiological and biochemical changes in C. drupifera before and after flowering and natural pollination remain scarce.
Pollination is crucial for plant sexual reproduction [22,23]. This process involves pollen recognition, germination, and fertilization, and is coordinated by various substances [24,25]. In many plants, tannase plays a significant physiological role [18,26]. In C. oleifera, esterified catechins inhibit self-pollination pollen tube growth, while high tannase activity promotes pollen tube extension and fruit formation [14,15,18,26]. The interaction between pollen and the stigma involves changes in the level of endogenous hormones [25,27]. Plant hormones such as indole-3-acetic acid (IAA), cytokinins (CTK), gibberellins (GA), abscisic acid (ABA), ethylene (ETH), and brassinosteroids (BR) regulate the growth and development of floral organs through a complex network, with IAA and ABA being closely related to pollination and fertilization [28,29]. Research indicates that moderate levels of IAA promote pollen germination and fertilization, whereas high levels of ABA are associated with hybrid incompatibility [27,28,29,30]. During sexual reproduction, pollen adheres to the stigma surface, hydrates, and rapidly germinates to form a pollen tube, which traverses the style to deliver male gametes to the ovule for fertilization. The growth of the pollen tube depends on energy generated through aerobic respiration and anaerobic fermentation [23,31,32]. Cellular respiration produces reactive oxygen species (ROS), which, as metabolic byproducts and signaling molecules, participate in pollen germination, pollen tube growth, and fertilization. However, excessive ROS can lead to cellular apoptosis [33,34]. Plants detoxify ROS through antioxidant enzyme systems such as catalase (CAT), superoxide dismutase (SOD), peroxidase (POD), and ascorbate peroxidase (APX) [35]. Studies show that in self-incompatible (SI) species, both self- and cross-pollination significantly increase ROS levels. Reducing ROS levels and increasing nitric oxide can help overcome SI [13,14]. During the early stages of cross-pollination, the accumulation of ROS in the stigma is critical, though high ROS concentrations cannot reverse SI effects [36]. Early after pollination, high levels of ROS promote interactions between pollen and stigma, such as attachment and hydration; however, approximately twelve hours later, ROS levels in the stigma decrease, creating a favorable environment for further pollen tube growth [37]. Additionally, soluble sugars (SS) and soluble proteins (SP) are essential nutrients and metabolic products in plant cells, providing energy and structural support for plant growth, development, and response to environmental changes [38,39].
Therefore, this study uses C. drupifera pure forests as experimental material to observe the dynamic changes in endogenous substances (hormones, enzymes, sugars, proteins, etc.) in floral organs (stamens and pistils) before and after natural pollination during the flowering stage. The aim is to gain preliminary insights into the accumulation and variation patterns of endogenous substances in the floral organs of C. drupifera during flowering. This research provides a reference for understanding the roles of endogenous substances during the flowering stage and for using plant growth regulators to overcome self-incompatibility, with the goal of enhancing fruit yield and achieving efficient cultivation of C. drupifera.

2. Materials and Methods

2.1. Experimental Site and Plant Materials

The experiment site is located at the C. drupifera base in Luofu Mountain, Boluo County, Guangdong Province, China (113°57′37″ E, 23°13′11″ N). This area falls within the subtropical monsoon climate zone, characterized by a warm climate with ample sunlight. The annual average temperature is 21.8 °C, with a minimum monthly average temperature of 12.5 °C in the coldest month and a maximum monthly average temperature of 28.0 °C in the hottest month. The frost-free stage lasts up to 345 days, and the annual average precipitation ranges from 1800 to 1900 mm, with distinct dry and wet seasons [40].
The experimental forest consists of pure stands of C. drupifera, established in 2009, covering an area of 200 hectares. The stand is managed according to high-yield forest standards to maintain tree health and normal fruit development. The average diameter at breast height (DBH) of the trees is (13.7 ± 1.9) cm, with an average height of (3.9 ± 0.7) meters and an average crown width of (4.1 ± 0.5) meters in the east-west direction and (3.4 ± 0.4) meters in the north-south direction. Prior to November 2022, forestry management measures included the removal of weak branches, shading branches, and undergrowth.

2.2. Selection of Sample Trees and Sample Collection

Selection of Sample Trees: Based on forest surveys and yield data from 2020, 2021, and 2022, trees with favorable light conditions, consistent growth phenology, similar fruiting conditions, and no signs of disease or pest infestation were selected. In November 2022, twelve sample trees were randomly chosen. The average diameter at breast height (DBH) of the sample trees was (14.2 ± 1.3) cm, with an average height of (3.4 ± 0.2) meters, and an average crown width of (4.1 ± 0.3) meters in the east-west direction and (3.5 ± 0.3) meters in the north-south direction. The sample trees were subject to routine management throughout the experiment.
Sample Collection: From November to December 2023, between 9:00 and 10:00 a.m. on clear days, flower organ morphology of C. drupifera was observed at six different stages, including two days before flowering (K(−2)), on the day of flowering (K(0)), one day after flowering (K(1)), two days after flowering (K(2)), four days after flowering (K(4)), and six days after flowering (K(6)) (Figure 1). Flower organs that were uniform in size, undamaged, and well-developed were randomly collected from the east, west, south, and north directions of the selected sample trees. The stamens and pistils were quickly separated, and the samples were rapidly frozen in liquid nitrogen, then preserved with dry ice and transported to the laboratory. Samples were stored at −80 °C for subsequent measurement of hormone levels, soluble sugars, soluble proteins, and enzyme activities. The reagents for biochemical assays were purchased from Suzhou Comin Biotechnology Co., Ltd. (Suzhou, China) and Guangzhou AORUIDA Biology (Guangzhou, China). Each sample was analyzed in triplicate. Major instruments used included a cryogenic grinder, a tabletop centrifuge (Eppendorf, Hamburg, Germany), and a Microplate Reader (Multiskan FC, Thermo Fisher Scientific, Waltham, MA, USA).

2.3. Measurement of Tannase Activity in Floral Organs

Samples of C. drupifera flower organs stored at −80 °C were thawed, ground in liquid nitrogen, and 0.1 g of the powdered sample was weighed. Tannase (TNS) activity was measured using a spectrophotometric assay kit (TAN-1-Y) purchased from Suzhou Comin Biotechnology Co., Ltd. Specific activity was calculated based on the fresh weight of the samples. One enzyme unit (U) was defined as the amount of enzyme required to hydrolyze 0.01 µmol of substrate (the antioxidant propyl gallate, PG) per minute per gram of sample at 40 °C, and unit conversion was performed [41].

2.4. Hormone Content Determination in Floral Organs

Samples (0.1 g) were ground in liquid nitrogen. The contents of the following hormones were determined using enzyme-linked immunosorbent assay (ELISA) kits purchased from Guangzhou AORUIDA Biology, according to the manufacturer’s instructions: IAA (ARD30650), CTK (ARD60267), ABA (ARD90047), GA (ARD60553), BR (ARD20332), and ETH (ARD70566).

2.5. ROS, H2O2 Content, and Antioxidant Enzyme Activity Determination in Floral Organs

Samples were ground and the content of both ROS (ARD60522) and H2O2 (ARD51007) were measured using ELISA kits purchased from Guangzhou AORUIDA Biology, according to the manufacturer’s instructions. Antioxidant enzyme activities were assessed using specific kits. SOD activity was determined with the NBT method (SOD-1-Y), CAT activity with the ammonium molybdate colorimetric method (CAT-1-W), and POD activity with the UV spectrophotometric method (POD-1-Y). These kits were obtained from Suzhou Comin Biotechnology Co., Ltd.

2.6. Soluble Sugar (SS) and Soluble Protein (SP) Content Determination in Floral Organs

The SS content was measured using the phenol-sulfuric acid method kit (KT-1-Y), and the SP content was determined using the Coomassie brilliant blue method kit (KMSP-1-W). Both kits were purchased from Suzhou Comin Biotechnology Co., Ltd.

2.7. Data Analysis

Experimental results were presented as mean ± Standard Deviation (SDM). Data normality was assessed using the Shapiro-Wilk test with SPSS software (version 25.0). For normally distributed data, one-way analysis of variance (ANOVA) was employed for statistical analysis, followed by post-hoc multiple comparisons using the Least Significant Difference (LSD) method to determine significant differences between groups [1]. Graphs and charts were generated using Origin 2023 software to visualize experimental findings and analytical conclusions.

3. Results

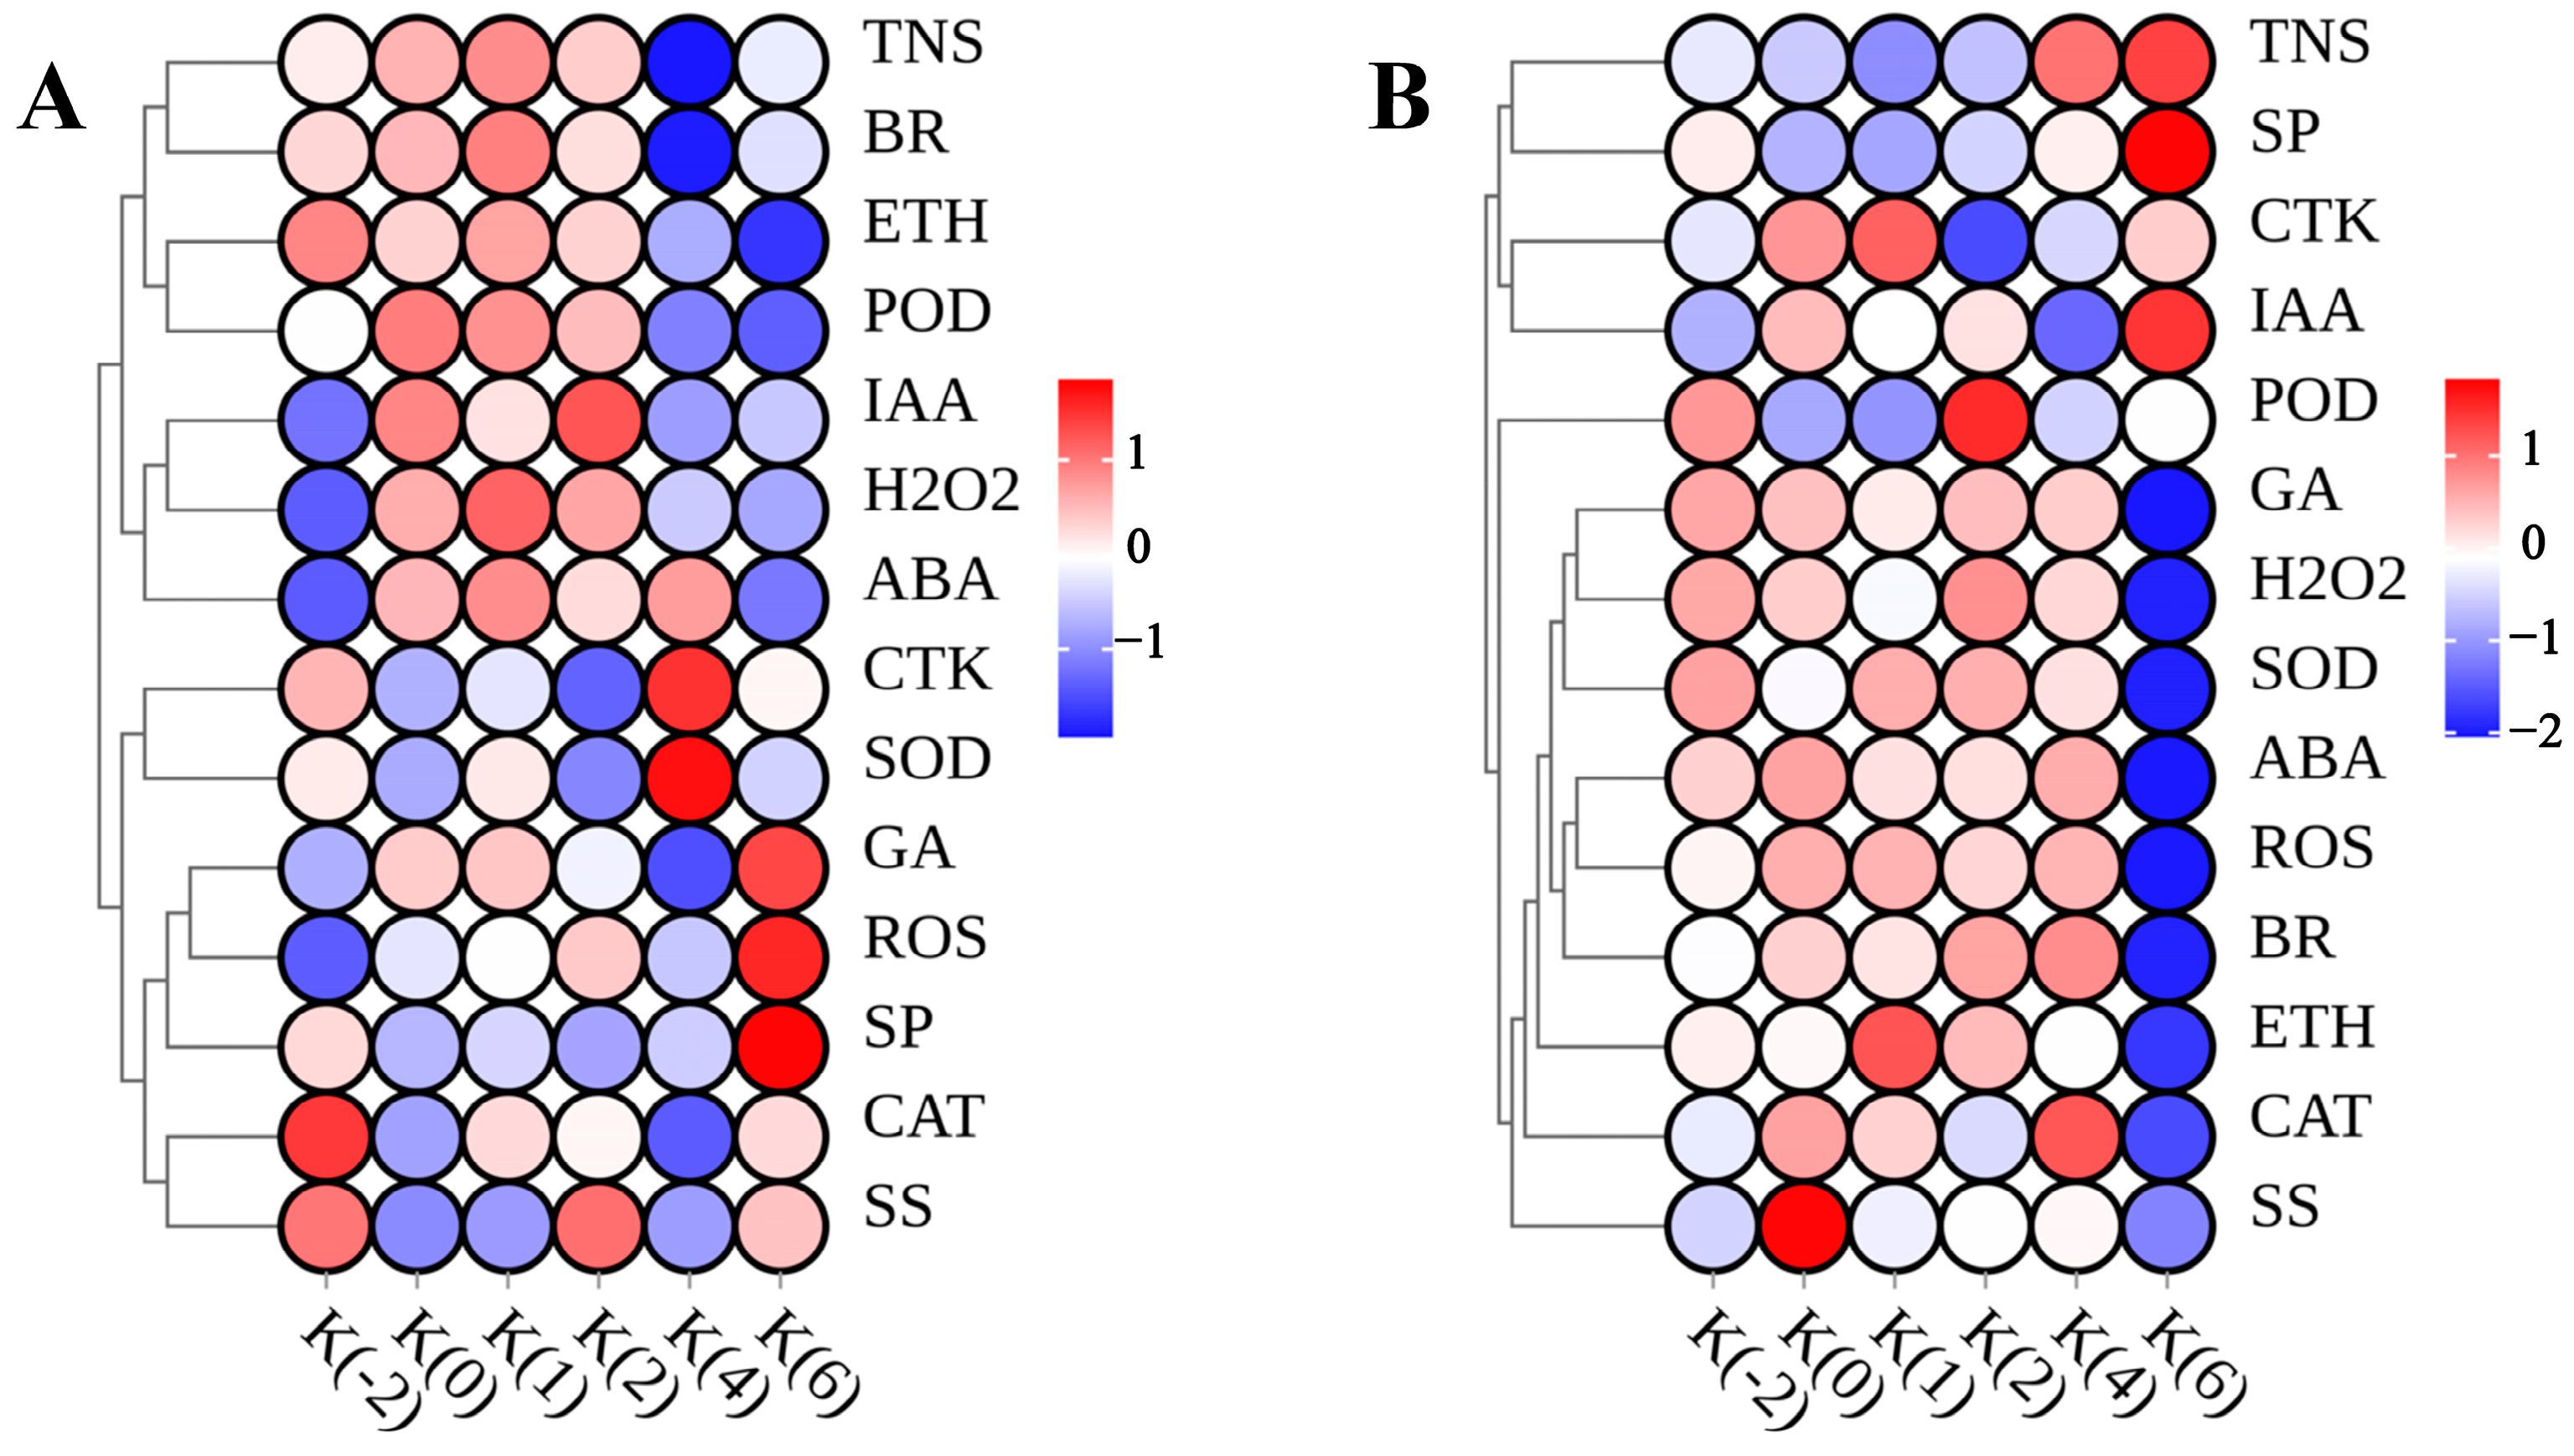
3.1. Dynamic Changes of Endogenous Substances Content during the Flowering Stage of C. drupifera

To gain a deeper understanding of the dynamic changes in the endogenous substance content of stamens and pistils in C. drupifera during its flowering stage, we referred to the visualization methods for plant endogenous hormone level changes as described by Upadhyay [42]. A heatmap reflecting the trends in endogenous substance content of C. drupifera was constructed (Figure 2).
During the flowering and pollination process of C. drupifera, pistil TNS activity was high at K(−2) and K(2), showing a trend similar to that of BR and ETH. The levels of IAA and ABA remained relatively high from K(0) to K(2), while the levels of CTK and GA peaked at K(4). H2O2 levels peaked at K(1), and ROS significantly increased at K(6). Antioxidant enzyme activity indicated that pistil POD played a major role at K(−2) and K(2), while SOD and CAT were more active at K(4) and K(−2), respectively. Pistil SP reached its highest abundance at K(6), with SS displaying multiple peaks. The cluster analysis dendrogram in Figure 2 clearly shows significant differences in the endogenous substance content changes between stamens and pistils during the flowering stage of C. drupifera. Most endogenous substances in the stamens exhibited higher abundance at K(−2) and K(4), followed by a decrease at K(6). The changes in the levels of GA, ABA, BR, and ETH in the stamens were particularly notable. In the pistils, the levels of H2O2 and ROS, as well as the activities of POD, SOD, and CAT, decreased at K(6). The trend of SP content changes in the pistils was similar to that in the stamens, but the changes in TNS activity showed nearly opposite trends.

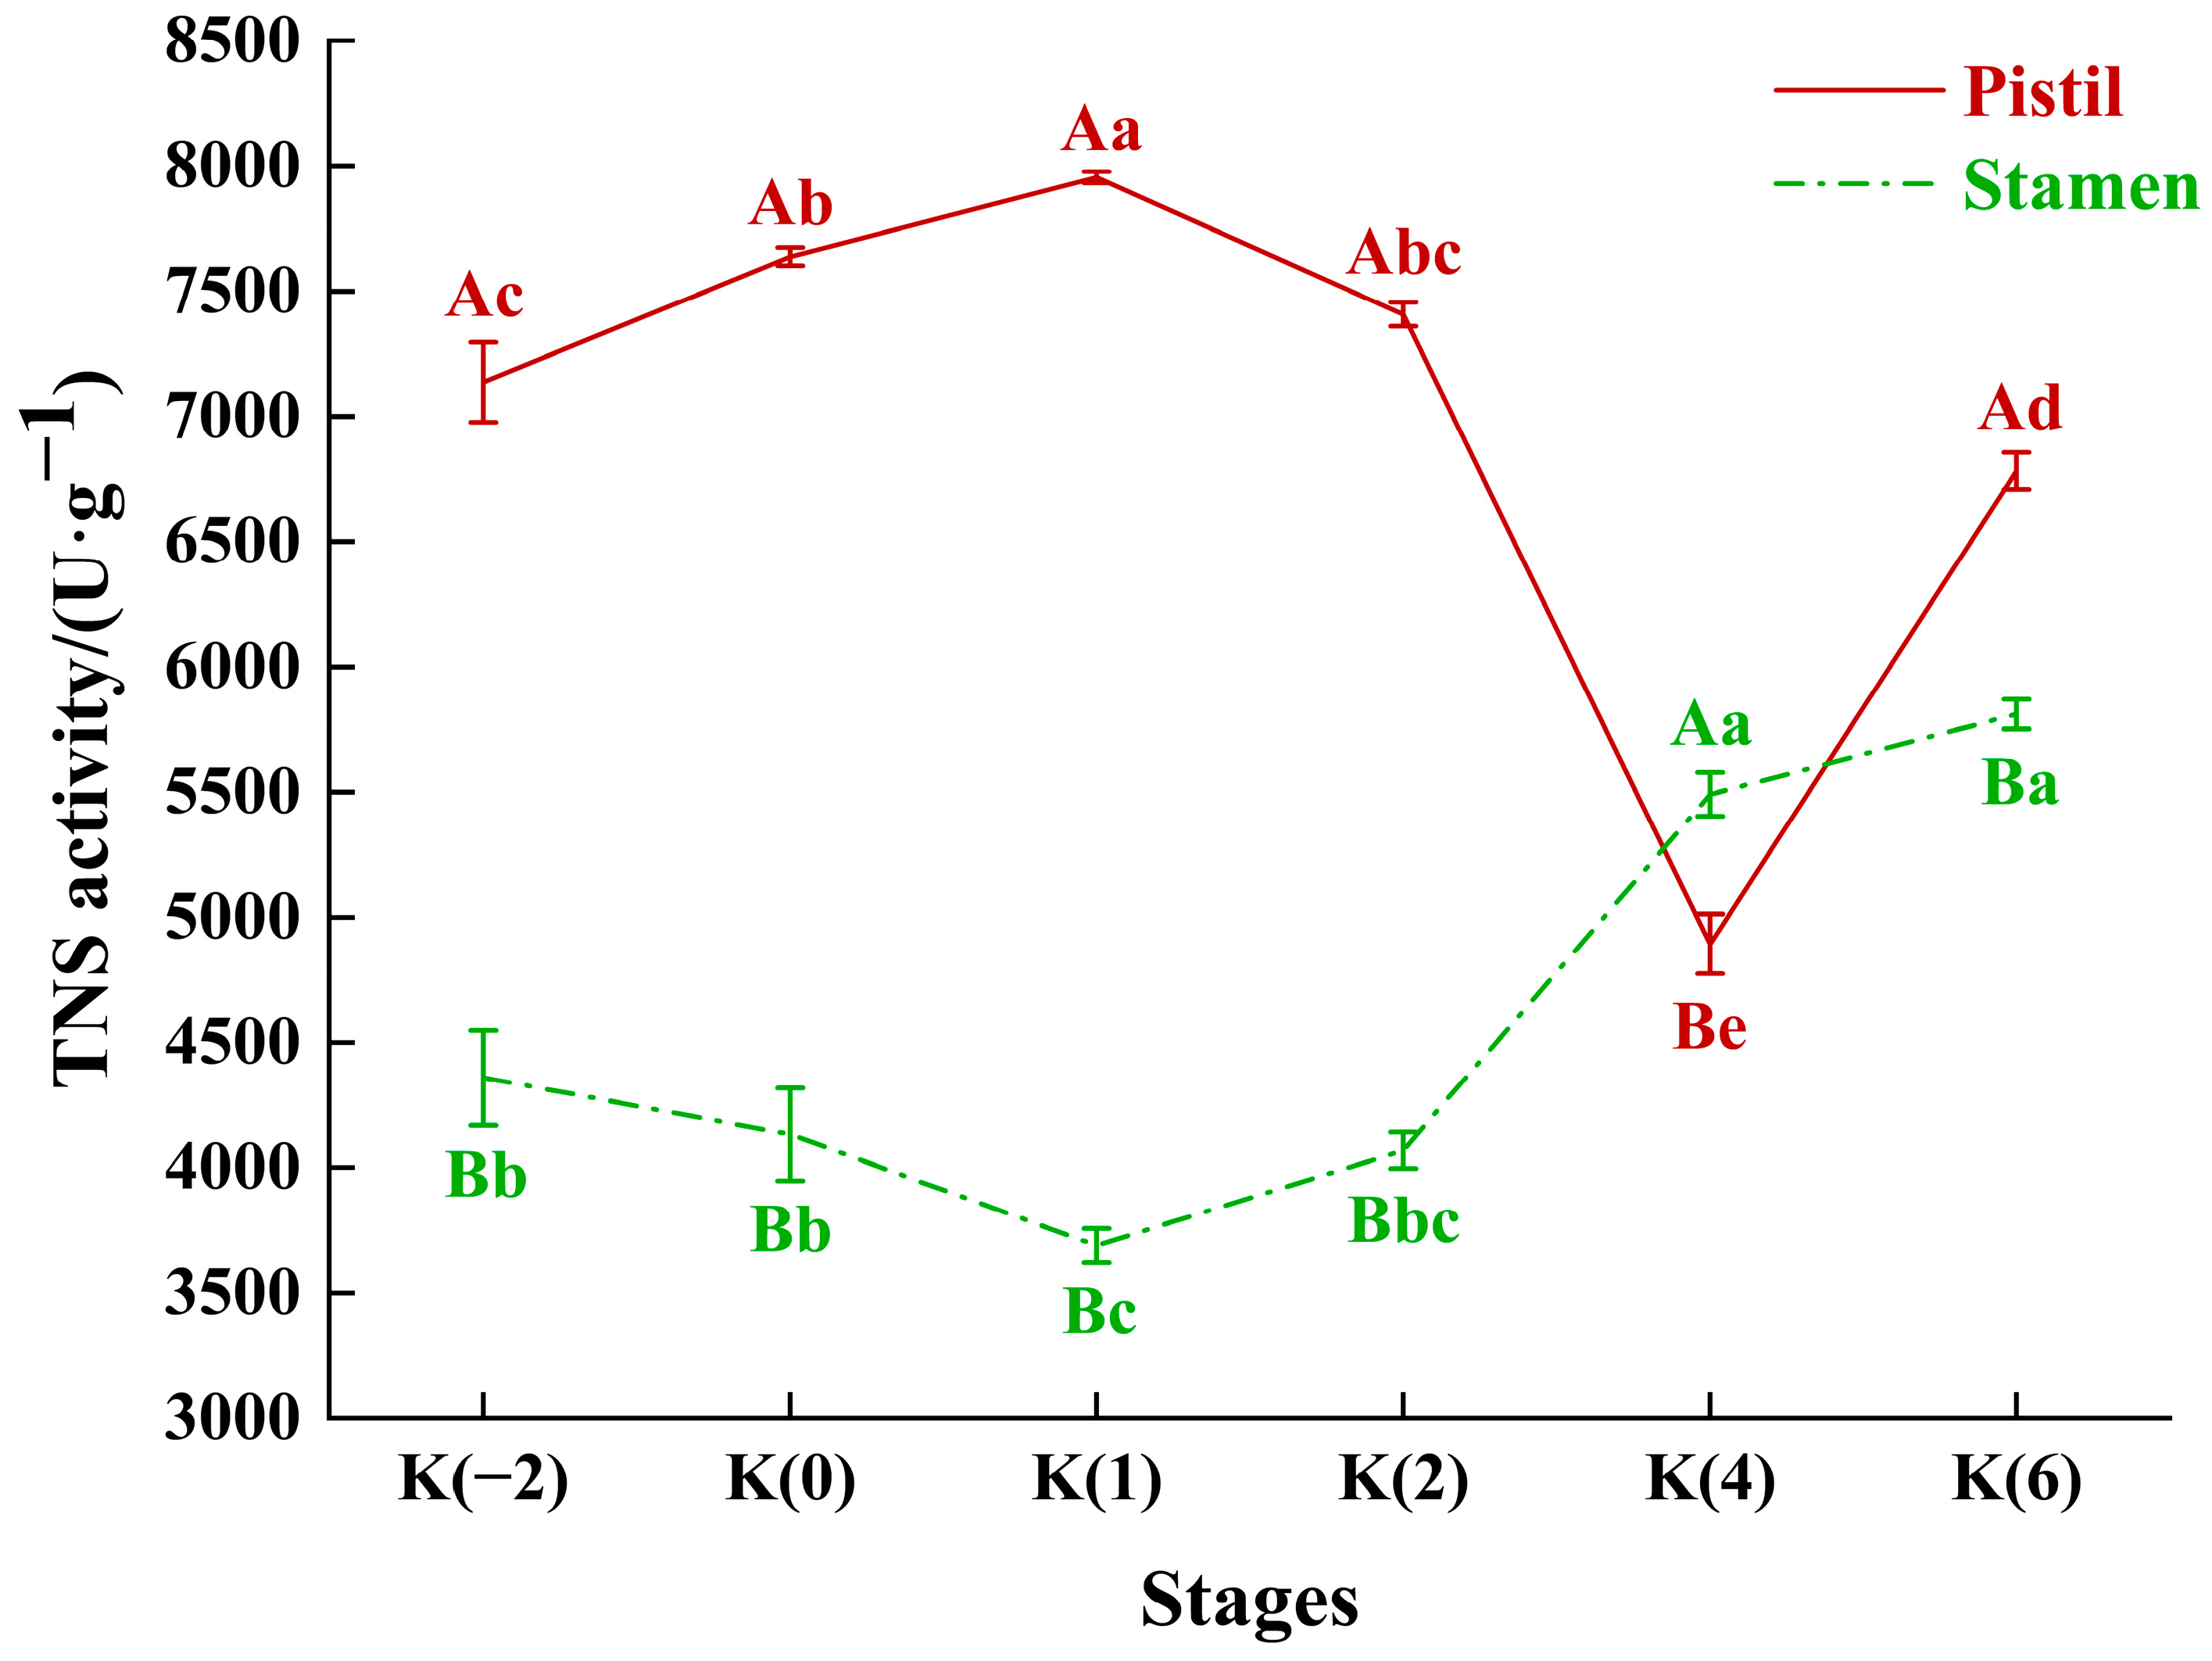
3.2. Dynamic Changes in Tannase Activity of Floral Organs during the Flowering Stage of C. drupifera

TNS activity in the pistils and stamens of C. drupifera shows significant differences during the flowering stage under natural pollination conditions (Figure 3). TNS activity in the pistils remains high throughout the entire flowering stage, gradually increasing from K(−2) to K(0), peaking at K(1), and then sharply decreasing to the lowest point at K(4). The pistil TNS activity shows a slight recovery at K(6) but does not return to the previous levels. In contrast, TNS activity in the stamens decreases from K(−1) to K(1), then gradually increases. However, from K(−2) to K(2), stamen TNS activity remains significantly lower than that of the pistils, with a notable increase in activity from K(4) to K(6).

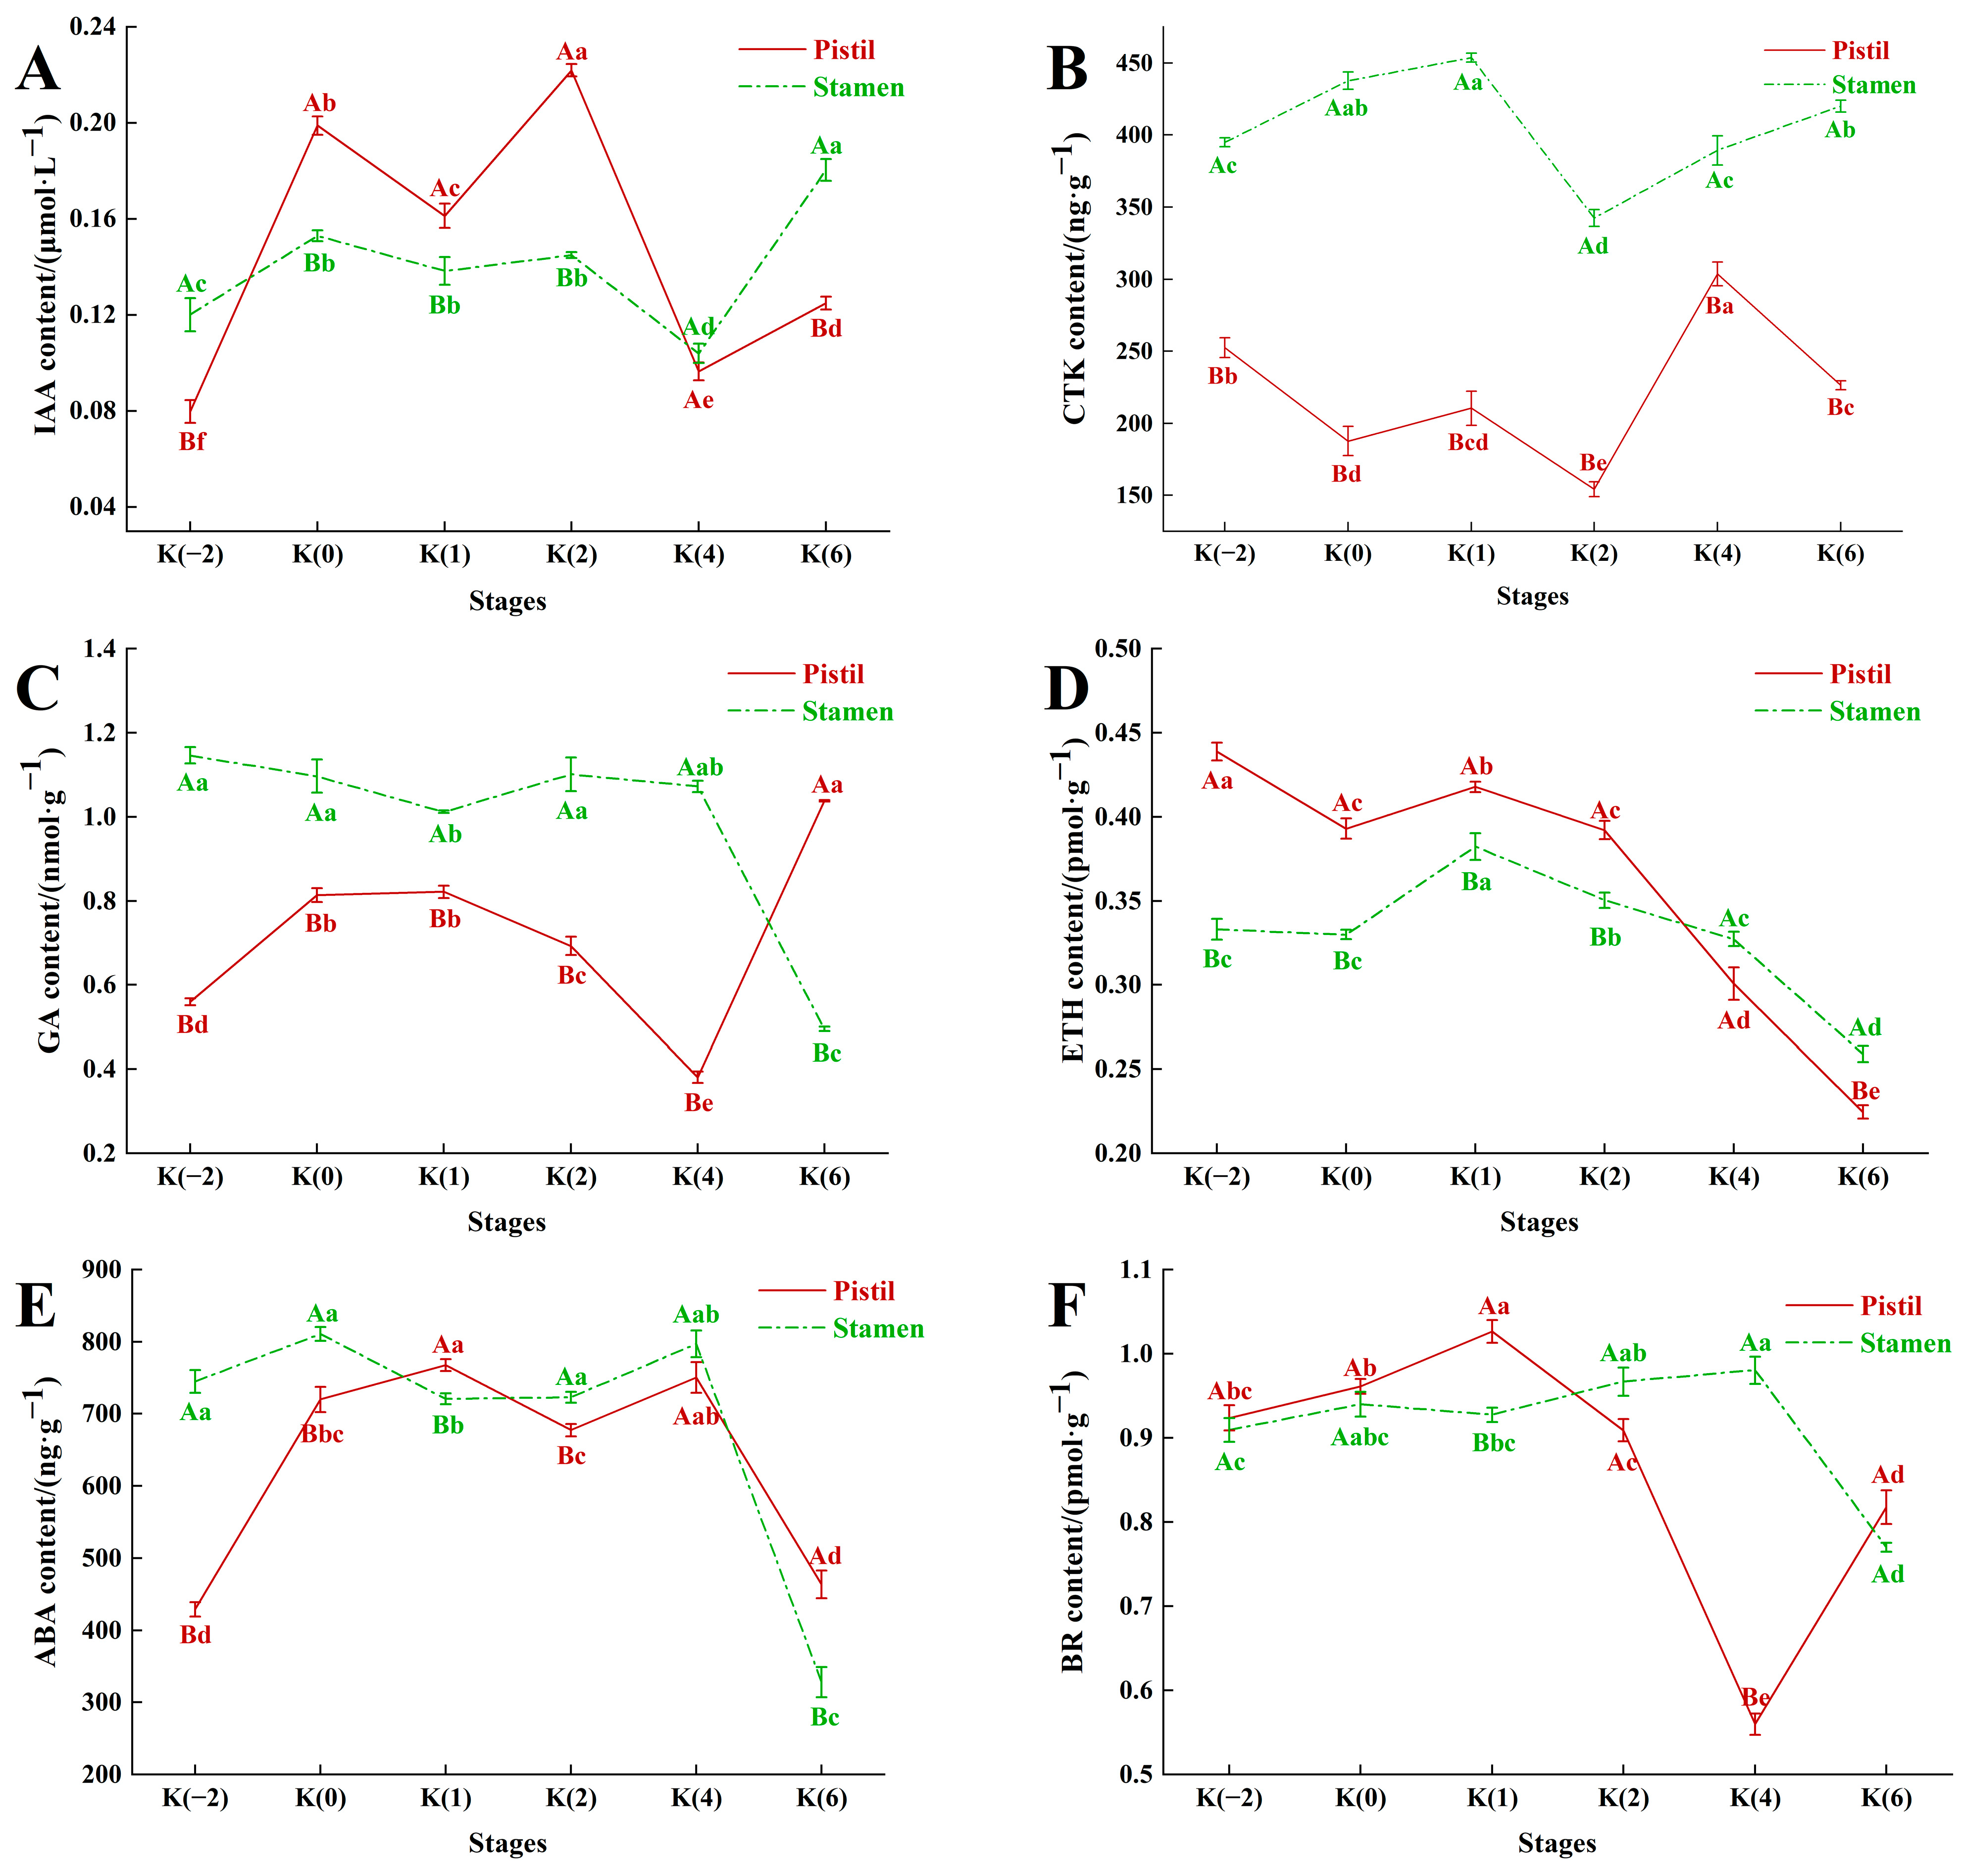
3.3. Dynamic Changes in Hormone Content of Floral Organs during Flowering Stage of C. drupifera

Overall, the dynamic changes in hormone levels in the floral organs of C. drupifera during flowering exhibit a complex pattern. In the pistils, the levels of ABA, IAA, and GA are higher during the pre-flowering stages (K(0) to K(2)), while CTK and BR show more pronounced fluctuations towards the end of the flowering stage. ETH levels, on the other hand, exhibit a general declining trend after flowering. In contrast, the hormonal changes in the stamens are relatively stable, with fluctuations mainly occurring towards the end of the flowering stage (K(4) to K(6)) (Figure 4).

3.3.1. Dynamic Changes in IAA Content

IAA content in pistils significantly increased after flowering, particularly between stages K(0) and K(2), where it was markedly higher than in other stages. In contrast, the IAA content in stamens and its range of variation were smaller compared to pistils, showing a fluctuating upward trend and reaching a maximum at the end of the flowering stage, K(6). Overall, the IAA content in pistils was significantly higher than in stamens during the early to mid-flowering stages (K(0) to K(2)) (Figure 4A).

3.3.2. Dynamic Changes in CTK Content

The CTK content in the pistil significantly decreases from K(0) to K(2) after flowering but rises markedly at K(4) and then decreases again at K(6). The CTK levels in the stamen are consistently higher than in the pistil, showing an initial increase, followed by a decrease, and then another rise. The pistil’s CTK content fluctuates noticeably from K(2) to K(6), while the stamen’s CTK levels show two distinct levels around K(1) (Figure 4B).

3.3.3. Dynamic Changes in GA Content

GA content in the pistil rises significantly from K(−2) to K(1) after flowering, then declines from K(2) to K(4), and finally increases again to reach a peak at K(6). The stamen’s GA content is significantly higher than the pistil’s from K(−2) to K(4) and remains relatively stable but drops significantly at K(6) (Figure 4C).

3.3.4. Dynamic Changes in TEH Content

Both pistil and stamen ETH levels follow a similar trend, decreasing from K(−2) to K(1), then increasing, and subsequently declining after K(1), reaching the lowest point at K(6). ETH content in the pistil is significantly higher than in the stamen from K(−2) to K(2), while the stamen’s ETH content is significantly higher at K(4) and K(6) (Figure 4D).

3.3.5. Dynamic Changes in ABA Content

ABA levels in both pistil and stamen exhibit an “M”−shaped trend: rising during the flowering process (K(−2) to K(0)), fluctuating and declining from K(0) to K(2), rising again from K(2) to K(4), and then dropping sharply at K(6). The pistil’s ABA content peaks at K(1) and then declines. The stamen’s ABA content changes more steadily but decreases significantly at K(6) (Figure 4E).

3.3.6. Dynamic Changes in BR Content

BR content shows no significant difference between the pistil and stamen from K(−2) to K(0). The pistil’s BR content increases significantly at K(1), then drops markedly to the lowest point at K(4), and rises again at K(6). The stamen’s BR content remains stable from K(−2) to K(4) but drops sharply to the lowest level at K(6). The main differences in BR content between the pistil and stamen are observed at K(4) and K(6) (Figure 4F).

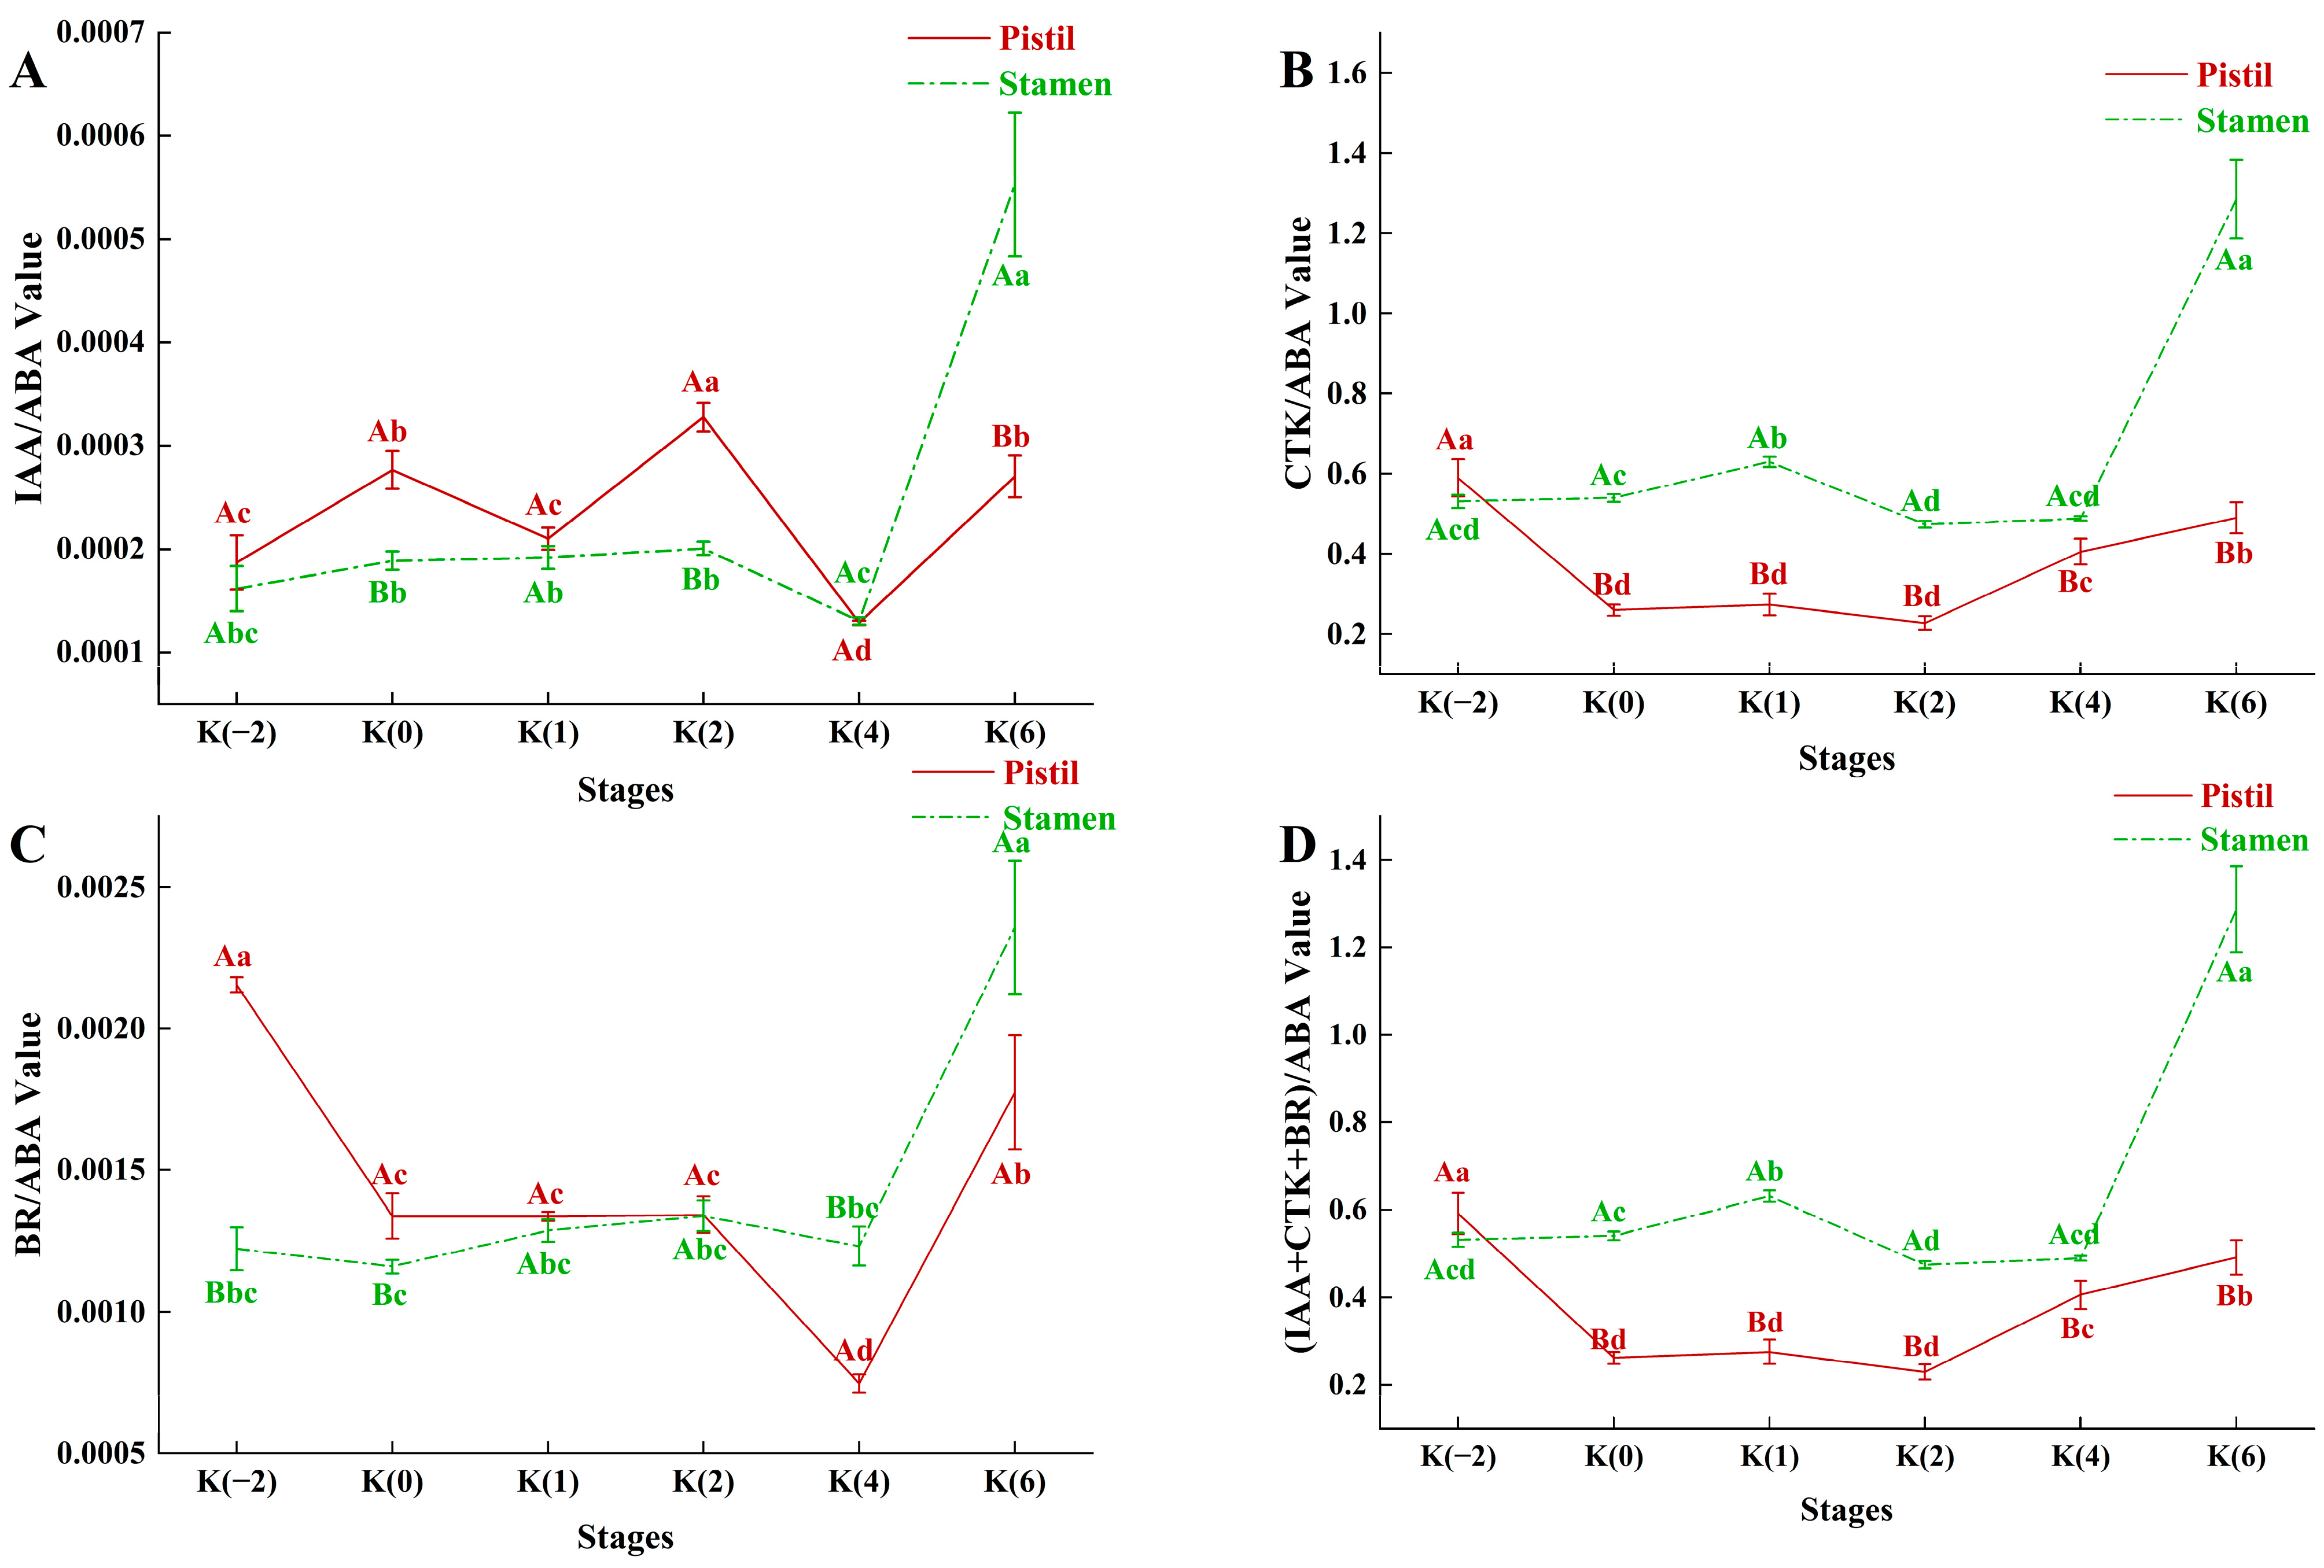
3.3.7. Balance of Endogenous Hormones during Flowering Stage of C. drupifera

The dynamic changes in hormone ratios (IAA/ABA, CTK/ABA, BR/ABA, GA/ABA) during the flowering stage of C. drupifera reveal the complex hormonal regulatory needs of the pistil and stamen at different stages. The pistil exhibits multi-peaked variations in hormone ratios throughout the flowering stage, whereas the stamen shows relatively stable hormone ratios with significant changes toward the end of flowering (Figure 5).
The IAA/ABA ratio in the pistil shows a “three-peak” trend: it significantly increases at K(0) and K(2), displaying a distinct “rise-fall-rise-fall-rise” pattern. In contrast, the stamen’s IAA/ABA ratio remains relatively stable and lower than that of the pistil during the early to mid-flowering stages (K(−2) to K(2)). However, by the end of the flowering stage (K(6)), the stamen’s IAA/ABA ratio significantly increases and surpasses that of the pistil (Figure 5A). Throughout the flowering stage, the CTK/ABA ratio in the pistil remains relatively stable, showing an overall decreasing trend and is significantly lower than before flowering (K(−2)). The stamen’s CTK/ABA ratio remains stable during the early to mid-flowering stages (K(−2) to K(2)), generally higher than that of the pistil, but increases significantly by the end of the flowering stage (K(6)) (Figure 5B). The BR/ABA ratio in the pistil exhibits a “U”-shaped trend during flowering. It significantly decreases after flowering (K(−2) to K(2)), remains stable for a stage, then decreases again to its lowest level at K(4), and slightly recovers at K(6), although still below the pre-flowering level at K(−2). The stamen’s BR/ABA ratio shows a similar trend to the CTK/ABA ratio, with a significant increase at the end of flowering (K(6)) (Figure 5C). From K(−2) to K(2), the GA/ABA ratio in the pistil remains relatively stable with a slight decrease. However, it significantly drops at K(4) and then increases again at K(6), surpassing the pre−flowering level at K(−2). The GA/ABA ratio in the stamen shows relatively stable changes throughout the flowering stage (Figure 5D).

3.4. Dynamic Changes in ROS, H2O2 Content, and Antioxidant Enzyme Activity in Floral Organs during the Flowering Stage of C. drupifera

3.4.1. Dynamic Changes in ROS and H2O2 Content

Throughout most stages of the flowering stage, the ROS levels in the stamen are consistently significantly higher than those in the pistil from K(−2) to K(4), although ROS levels in the stamen significantly decrease at K(6). In contrast, the ROS levels in the pistil remain relatively stable from K(−2) to K(4), with a notable increase at the end of the flowering stage (K(6)) (Figure 6A).
The H2O2 content in the pistil exhibits a “V”-shaped trend, significantly increasing after flowering and peaking at K(1), followed by a gradual decline. The stamen’s H2O2 content shows minimal variation from K(−2) to K(4). It initially decreases after flowering (K(−2) to K(1)), then increases during mid-flowering (K(2)), and significantly decreases from K(2) to K(6). Overall, the H2O2 content in the pistil is significantly higher than that in the stamen during the early to mid-flowering stages (K(0) to K(2)) (Figure 6B).

3.4.2. Dynamic Changes in Antioxidant Enzyme Activity

The antioxidant enzyme system, including POD, SOD, and CAT, plays a crucial role in the oxidative stress response of plants. Among these enzymes, the activity of SOD in flower organs is significantly higher compared to POD and CAT (Figure 6C–E).
In the pistil, POD activity rises rapidly after flowering, reaching its maximum at K(0), and remains high from K(0) to K(2) before gradually decreasing. The stamen’s POD activity is generally higher and exhibits less fluctuation compared to the pistil, showing an almost opposite trend from K(0) to K(2) (Figure 6C). The pistil’s SOD activity is consistently significantly lower than that of the stamen, with notable fluctuations throughout the flowering stage. After flowering, SOD activity in the pistil significantly decreases at K(0), increases at K(1), drops to a minimum at K(2), significantly rises to a peak at K(4), and then decreases again at the end of the flowering stage (K(6)). In contrast, stamen SOD activity remains high from K(−2) to K(4) and significantly decreases at K(6) (Figure 6D). The pistil’s CAT activity is significantly lower from K(0) to K(6) compared to pre-flowering levels (K(−2)), with a notable decrease after flowering. During K(0) to K(2), CAT activity shows an increasing trend but rises significantly again at K(6) towards the end of the flowering stage. In the stamen, CAT activity fluctuates little from K(−2) to K(2), decreases from K(0) to K(2), significantly increases at K(4), and then decreases significantly by the end of the flowering stage (K(6)) (Figure 6E).

3.5. Dynamic Changes in Soluble Proteins (SP) and Soluble Sugars (SS) in Floral Organs during the Flowering Stage of C. drupifera

3.5.1. Dynamic Changes in SP Content

Throughout the flowering stage, the soluble protein (SP) content in pistils consistently remained higher than in stamens. From K(−2) to K(4), pistil SP content exhibited a “W” shaped pattern, but it remained below pre-flowering levels at K(−2). By the end of the flowering stage at K(6), pistil SP content significantly increased and exceeded pre-flowering levels. In contrast, the SP content in stamens displayed a “U” shaped trend, with overall levels consistently lower than those in pistils. The SP content in stamens decreased initially and then increased from K(−2) to K(6). Specifically, stamen SP content did not reach pre-flowering levels (K(−2)) until the end of the flowering stage (K(6)), where it surpassed pre-flowering levels (K(−2)) (Figure 7A).

3.5.2. Dynamic Changes in SS Content

The trends in soluble sugar (SS) content in pistils and stamens exhibit nearly opposite patterns. In pistils, SS content fluctuates more noticeably throughout the flowering stage, while in stamens, SS content is significantly higher at K(0) compared to other stages. Pistil SS content decreases markedly after flowering initiation, with a slight increase from K(0) to K(1), a significant rise at K(2), a substantial drop at K(4), and a notable increase again by the end of the flowering stage at K(6). Conversely, stamen SS content increases significantly from K(−2) to K(0), reaching a peak at K(0). Subsequently, SS content gradually declines and remains relatively stable throughout the flowering stage, reaching its lowest level at K(6) (Figure 7B).

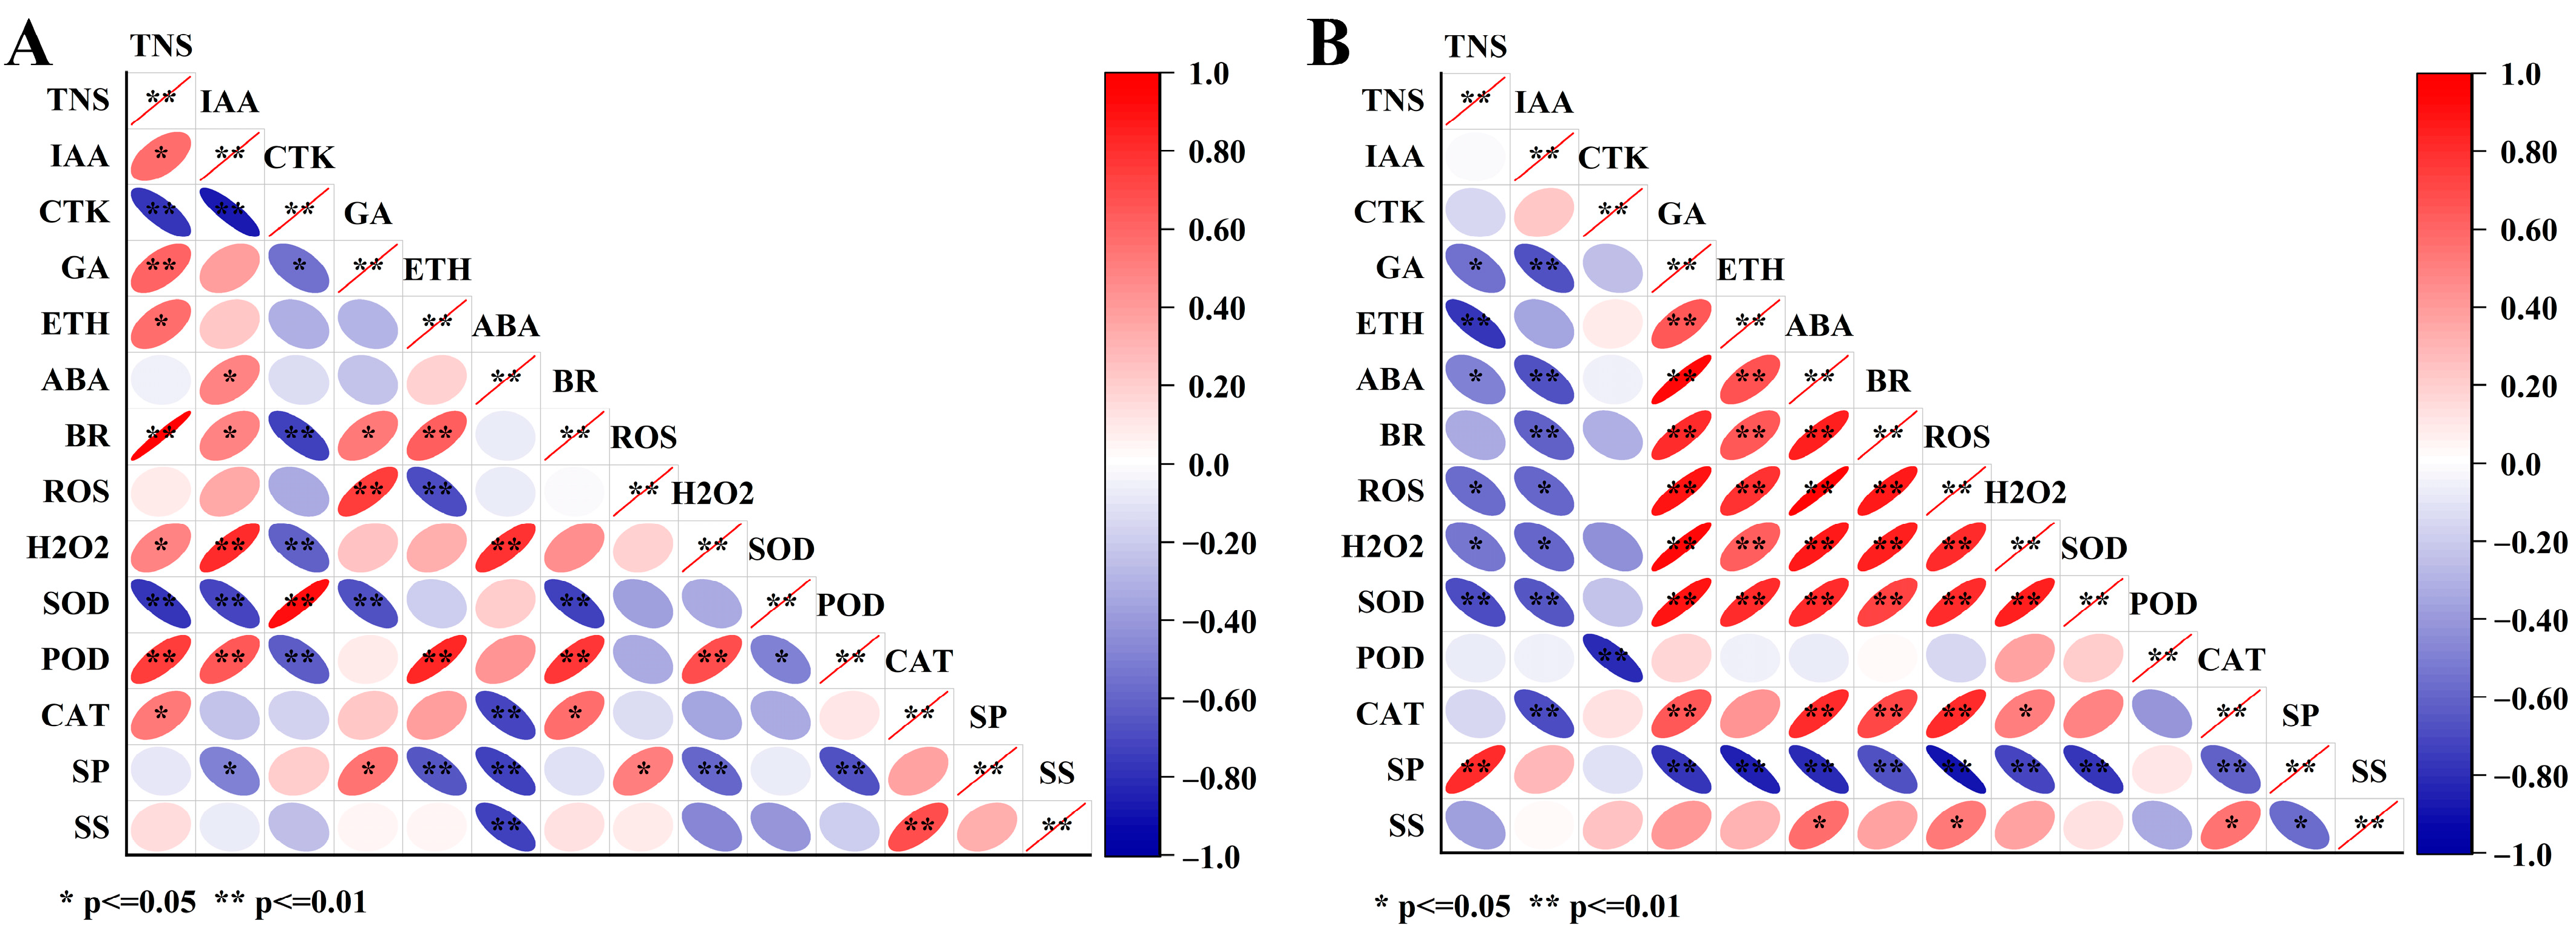
3.6. Correlation Analysis of Endogenous Substances during the Flowering Stage of C. drupifera

The endogenous substances in floral organs of C. drupifera during the flowering stage exhibit complex and significant correlations. Correlation analysis of these substances provides insights into how they synergistically regulate floral organ growth and development (Figure 8).
In pistils, TNS activity shows a highly significant positive (p < 0.01) correlation with GA, BR, and POD activity. Conversely, TNS activity has a highly significant negative correlation with CTK and SOD activity, highlighting the complex interactions between different hormones and antioxidant enzymes in regulating pistil physiological activities. IAA in pistils is highly significantly positively correlated with H2O2 and POD activity, and highly significantly negatively correlated with CTK and SOD activity. Furthermore, CTK is highly significantly positively correlated with SOD activity but negatively correlated with BR, H2O2, and POD activity. GA shows a highly significant positive correlation with ROS content and a highly significant negative correlation with SOD. ETH content is highly significantly positively correlated with BR and POD activity but highly significantly negatively correlated with ROS and SP content. ABA is highly significantly positively correlated with H2O2 and highly significantly negatively correlated with CAT activity, SP, and SS content. Additionally, BR is highly significantly positively correlated with POD activity but highly significantly negatively correlated with SOD activity. There is a highly significant negative correlation between SOD and POD activity. POD activity shows a highly significant negative correlation with SP content, while CAT activity is highly significantly positively correlated with SS content (Figure 8A).
In stamens, TNS activity shows a highly significant negative correlation with ETH and SOD activity. Additionally, TNS activity is highly significantly positively correlated with SP content. IAA is highly significantly negatively correlated with GA, ABA, BR, and both SOD and CAT activity. CTK is highly significantly negatively correlated with POD activity. Furthermore, the highly significant positive correlations between GA, ETH, ABA, and BR suggest potential synergistic effects during the stamen’s flowering stage, while these substances also exhibit highly significant positive correlations with SOD and CAT activity but highly significant negative correlations with SP content. ROS and H2O2 in stamens are highly significantly positively correlated, and they also show a highly significant positive correlation with SOD activity, indicating that increases in ROS and H2O2 are often accompanied by enhanced SOD activity to cope with oxidative stress. Moreover, ROS and H2O2 are highly significantly positively correlated with CAT activity and highly significantly negatively correlated with SP content, reflecting the complex interactions between antioxidant enzymes, soluble proteins, and oxidative stress responses in stamens (Figure 8B).

4. Discussion

Compared to climatic conditions during flowering (temperature, light, and moisture), flowering habits (phenology and floral organ receptivity), pollination biology (pollinator insects), and soil conditions (organic matter, humus, mineral particles, and mineral elements), C. drupifera afforestation often involves large areas of pure stands. These pure stands not only originate from single varieties but also from progeny of the same superior trees. Consequently, self-incompatibility (SI) within pure stands is a major reason for low fruit set rates. Research on pollination and fruit-set in C. drupifera pure stands has primarily focused on anatomical and genomic aspects. However, the dynamic changes and balance of endogenous substances (such as hormones, enzymes, soluble sugars (SS), and soluble proteins (SP)) are also crucial for fruit-set. The interactions between endogenous substances, which include both promoting and inhibiting relationships, collectively regulate and control the physiological activities of floral organs, thereby affecting pollination success and fruit formation.
This study explores the accumulation and variation patterns of endogenous substances in floral organs at different flowering stages in C. drupifera pure stands. It provides insights into the role of these substances during the flowering stage and offers a reference for using plant growth regulators to overcome SI. The aim is to enhance fruit yield and achieve efficient cultivation practices for C. drupifera.

4.1. Dynamic Changes in Endogenous Substances in Floral Organs of C. drupifera during Flowering Stage

During the flowering stage of C. drupifera, the TNS activity in pistils is significantly higher than in stamens throughout most stages (except K(4)), indicating a greater demand for TNS in pistils for their development. Research on Camellia species has shown that TNS can inhibit the synthesis of esterified catechins, thereby alleviating the suppression of self-pollen tube growth [15,18]. Therefore, spraying tannin enzymes could potentially alleviate SI in Camellia species.
The pollination process of floral organs, from the onset of flowering to the cessation of pollen reception, is precisely regulated by endogenous substances (e.g., plant hormones) and external environmental factors (e.g., temperature, nutrients, light, and pathogen attack). Plant hormones such as ETH, JA, SA, and ABA are known to accelerate floral organ senescence, whereas CTK, GA, and IAA inhibit senescence [43]. Adequate IAA levels promote pollen germination and fertilization, while high ABA levels are associated with self-incompatibility [27,29,30]. The IAA content in pistils of C. drupifera rapidly increases after flowering and is significantly higher than in stamens from K(0) to K(2), suggesting that high levels of IAA are necessary for reproductive activities in pure stands of C. drupifera post-pollination. CTKs can delay floral organ senescence by inhibiting ethylene and free radical formation, but in some ethylene-insensitive flowers, such as Lilium brownii var. viridulum and Iris tectorum, CTK promotes senescence [44]. The CTK content in pistils of C. drupifera fluctuates significantly from K(2) to K(6), while stamens show relative stability. Low GA levels are beneficial for flower bud formation in C. oleifera [45]. The abrupt increase in GA content in pistils at the end of the flowering stage (K(6)) likely aids in ovule development and fruit formation. Suitable levels of ETH are known to promote pollen tube growth in Vitis vinifera, while high ETH levels may accelerate floral organ senescence [43,44]. The ETH content in both pistils and stamens decreases gradually during the flowering stage, indicating that low ETH levels are favorable for successful pollination and fruit setting. Low concentrations of ABA promote, and high concentrations inhibit, pollen tube growth in C. oleifera [46]. The ABA content in pistils and stamens shows an “M” pattern, with high levels from K(0) to K(4) and a significant decrease at the end of flowering (K(6)). BR has been shown to inhibit self-incompatibility and promote pollen tube growth in pears [17]. The difference in BR content between pistils and stamens in C. drupifera is mainly observed in the late flowering stage (K(4)), with a significant decrease in pistil BR content at K(4) (Figure 4). The IAA/ABA ratio in both pistils and stamens exhibits a “three-peak” trend, indicating complex interactions between hormones. The increased hormone ratios at the end of flowering (K(6)) suggest a relative increase in ABA content in floral organs, accelerating their senescence (Figure 5).
Appropriate levels of ROS are crucial for pollination as they facilitate interactions between pollen and the stigma, such as adhesion and hydration. However, excessively high ROS levels cannot reverse self-incompatibility effects and can inhibit pollen tube growth when present for extended stages [36,37]. Antioxidant enzymes like CAT, SOD, POD, and APX play a role in ROS degradation, providing a suitable environment for pollen tube growth [35,37]. SS and SP are essential for plant growth and development and in response to environmental changes [38,39]. Under drought stress, SS and SP content and POD, SOD, and CAT activities in flower organs of Camellia species increase [4,47]. During most stages of flowering, the ROS levels in stamens are significantly higher than in pistils. The H2O2 content in pistils significantly increases post-flowering, with notable levels before K(4) compared to stamens. This suggests that high ROS levels in stamens may support pollen release and subsequent activities, whereas lower ROS levels in pistils might avoid adverse effects on pollen tube growth. High H2O2 levels in pistils may be involved in the inhibition of pollen tube growth associated with self-incompatibility. The SOD activity in floral organs of C. drupifera is significantly higher than that of POD and CAT during flowering, indicating the key role of SOD in regulating oxidative stress during the flowering stage.
The SP content in pistils remains consistently higher than in stamens throughout the flowering stage, indicating a higher need for soluble proteins to support life activities in pistils during flowering. The SS content shows significant differences between pistils and stamens, with pistils exhibiting greater fluctuations and stamens showing a gradual decrease after K(0). SS plays a crucial role in osmoregulation and energy supply during stamen and pollen grain development [19,31,48]. Pollen grains typically accumulate starch and soluble sugars, and after full maturation of stamens, SS may be transported to developing pollen grains, leading to a decrease in SS content, indicating that pollen grain formation in C. drupifera is nearly complete by K(0).

4.2. Correlation of Endogenous Substance Contents in Floral Organs of C. drupifera during Flowering

In C. drupifera, the TNS activity in pistils is highly significantly positively correlated with GA, BR levels, and POD activity, indicating that changes in TNS activity are often accompanied by changes in GA, BR, and POD levels. Additionally, pistil CTK content shows a highly significant positive correlation with SOD activity but a highly significant negative correlation with BR and H2O2 content and POD activity. This suggests that CTK may play multiple roles in the antioxidant mechanisms and hormonal balance of C. drupifera. Similar findings have been observed during flower development in Rosa ‘Yametsu-Hime’ [49]. ETH content is highly significantly positively correlated with BR levels and POD activity, but highly significantly negatively correlated with ROS and SP content. This indicates that ETH may play a critical role in regulating floral organ senescence and antioxidant mechanisms, similar to the relationship between ETH content and POD activity in C. sinensis [50]. ABA is highly significantly positively correlated with H2O2 content but highly significantly negatively correlated with CAT activity, SP, and SS content. Furthermore, BR content is highly significantly positively correlated with POD activity and highly significantly negatively correlated with SOD activity, suggesting differential synergistic effects between BR and various antioxidant enzymes. The highly significant negative correlation between SOD and POD activity indicates that these enzymes may play different regulatory roles in pistils when responding to oxidative stress. The highly significant negative correlation between POD activity and SP content and the highly significant positive correlation between CAT activity and SS content further reveal the associations between antioxidant enzymes and plant metabolic activities.
In stamens, TNS activity is highly significantly negatively correlated with ETH content and SOD activity, suggesting that increased TNS activity is associated with decreased ETH content and SOD activity. The highly significant negative correlation between IAA content and GA, ABA, BR levels, as well as SOD and CAT enzyme activities in stamens, indicates that increased IAA levels may inhibit the accumulation and activity of these hormones and antioxidant enzymes. This contrasts with the relationship between IAA and ABA under drought stress in C. oleifera [51], suggesting that different environmental conditions may alter the hormonal regulatory mechanisms. The highly significant negative correlation between CTK content and POD activity suggests that increased CTK levels are associated with decreased POD activity. Additionally, the highly significant positive correlations between GA, ETH, ABA, and BR imply potential synergistic effects during the flowering stage of stamens, while their highly significant positive correlations with SOD and CAT activities suggest a response to oxidative stress, similar to the synergistic effects of GA, BR, and ETH in Nelumbo nucifera under nutritional and reproductive development [52]. The highly significant positive correlation between ROS and H2O2 in stamens, along with their highly significant positive correlation with SOD activity, indicates that increases in ROS and H2O2 typically lead to enhanced SOD activity to cope with oxidative stress, analogous to the dynamic adaptation of SOD activity to ROS and H2O2 levels in tobacco styles [53]. Additionally, ROS and H2O2 are highly significantly positively correlated with CAT activity and highly significantly negatively correlated with SP content.

5. Conclusions

In C. drupifera, the high TNS activity in pistils during the flowering stage indicates its crucial role in facilitating pollen tube elongation post-pollination. Hormones (such as IAA, CTK, GA, and ETH) regulate the growth, development, and senescence of floral organs through complex interactions. Notably, high IAA levels in pistils support pollen tube growth, while fluctuations in ETH and ABA levels are closely associated with floral organ senescence. Elevated levels of H2O2 in pistils may impact self-compatibility by affecting pollen tube growth under oxidative stress conditions. The significantly higher SOD activity compared to POD and CAT in C. drupifera floral organs during flowering highlights the key role of SOD in regulating oxidative stress during this stage. Additionally, the collaborative role of antioxidant enzymes (SOD, POD, CAT) and soluble sugars and proteins underscores the intricate regulation of oxidative stress and nutritional needs during flowering in C. drupifera. There are significant differences in the correlations between endogenous substances in pistils and stamens during the flowering stage, particularly concerning the relationships among hormones and between TNS and other endogenous substances. These differences may arise from the distinct functions and metabolic demands of pistils and stamens during flowering. For instance, stamens are typically associated with pollen production and release, which may require higher levels of GA to promote these processes, whereas pistils, which are involved in fertilization and pollen tube growth, might need different hormones (such as CTK and ABA) to regulate ovule development post-fertilization. These complex correlations reflect the dynamic needs and regulatory mechanisms of endogenous substances across different organs and developmental stages in C. drupifera.

Author Contributions

Conceptualization and methodology; validation and formal analysis; investigation and original draft preparation; visualization; writing—review and editing.: Z.L.; writing—review and editing: J.T.; writing—review and editing: C.M. and M.W.; Supervision and resources; project administration and funding acquisition; writing—review and editing: R.X.; Supervision and resources; writing—review and editing: X.D. All authors have read and agreed to the published version of the manuscript.

Funding

This research was funded by Key-Area Research and Development Program of Guangdong Province (NO.2020B020215003).

Data Availability Statement

Data are contained within the article.

Conflicts of Interest

The authors declare no conflicts of interest. The funders had no role in the design of the study; in the collection, analyses, or interpretation of data; in the writing of the manuscript; or in the decision to publish the results.

References

  1. Zhen, L.; Xi, R. Sugar Metabolism and Transcriptomic Analysis of Key Enzymes and Transporters during Camellia drupifera Fruit Development. Front. Plant Sci. 2024, 15, 1424284. [Google Scholar]
  2. Ma, G.; Xia, T.; Sun, X.; Chen, J.; Yao, X.; Wang, C.; Chen, Y.; Feng, Y.; Feng, X.; Xie, S.; et al. Identification and analysis of CdS-RNase in Camellia drupifera: A key determinant of late-acting self-incompatibility. Ind. Crop. Prod. 2023, 203, 116990. [Google Scholar] [CrossRef]
  3. Li, Y.; Liao, B.; Wang, Y.; Luo, H.; Wang, S.; Li, C.; Song, W.; Zhang, K.; Yang, B.; Lu, S.; et al. Transcriptome and metabolome analyses provide insights into the relevance of pericarp thickness variations in Camellia drupifera and Camellia oleifera. Front. Plant Sci. 2022, 13, 1016475. [Google Scholar] [CrossRef] [PubMed]
  4. Guo, P.R.; Wu, L.L.; Wang, Y.; Liu, D.; Li, J. Effects of Drought Stress on the Morphological Structure and Flower Organ Physiological Characteristics of Camellia oleifera Flower Buds. Plants 2023, 12, 2585. [Google Scholar] [CrossRef] [PubMed]
  5. Wu, L.; Wang, Y.; Guo, P.; Li, Z.; Li, J.; Tan, X. Metabonomic and transcriptomic analyses of Camellia oleifera flower buds treated with low-temperature stress during the flowering stage. Ind. Crop. Prod. 2022, 189, 115874. [Google Scholar] [CrossRef]
  6. Hu, G.; Gao, C.; Fan, X.; Gong, W.; Yuan, D. Pollination compatibility and xenia in Camellia oleifera. Hortscience 2020, 55, 898–905. [Google Scholar] [CrossRef]
  7. Yuan, B.; Yuan, J.; Huang, C.; Lian, J.; Li, Y.; Fan, X.; Yuan, D. Pseudopollen in Camellia oleifera and its implications for pollination ecology and taxonomy. Front. Plant Sci. 2022, 13, 1032187. [Google Scholar] [CrossRef] [PubMed]
  8. Yuan, B.; Hu, G.; Zhang, X.; Yuan, J.; Fan, X.; Yuan, D. What are the best pollinator candidates for Camelia oleifera: Do not forget hoverflies and flies. Insects 2022, 13, 539. [Google Scholar] [CrossRef] [PubMed]
  9. He, Y.; Song, Q.; Chen, S.; Wu, Y.; Zheng, G.; Feng, J.; Yang, Z.; Lin, W.; Li, Y.; Chen, H. Transcriptome analysis of self-and cross-pollinated pistils revealing candidate unigenes of self-incompatibility in Camellia oleifera. J. Hortic. Sci. Biotechnol. 2020, 95, 19–31. [Google Scholar] [CrossRef]
  10. Chen, Y.; Zheng, J.; Yang, Z.; Xu, C.; Liao, P.; Pu, S.; El-Kassaby, Y.A.; Feng, J. Role of soil nutrient elements transport on Camellia oleifera yield under different soil types. BMC Plant Biol. 2023, 23, 378. [Google Scholar] [CrossRef]
  11. Liu, C.; Chen, L.; Tang, W.; Peng, S.; Li, M.; Deng, N.; Chen, Y. Predicting potential distribution and evaluating suitable soil condition of oil tea Camellia in China. Forests 2018, 9, 487. [Google Scholar] [CrossRef]
  12. Wei, W.; Wu, H.; Li, X.; Wei, X.; Lu, W.; Zheng, X. Diversity, daily activity patterns, and pollination effectiveness of the insects visiting Camellia osmantha, C. vietnamensis, and C. oleifera in South China. Insects 2019, 10, 98. [Google Scholar] [CrossRef] [PubMed]
  13. Muñoz-Sanz, J.V.; Zuriaga, E.; Cruz-García, F.; McClure, B.; Romero, C. Self-(in) compatibility systems: Target traits for crop-production, plant breeding, and biotechnology. Front. Plant Sci. 2020, 11, 195. [Google Scholar] [CrossRef] [PubMed]
  14. Chang, Y.; Gong, W.; Xu, J.; Gong, H.; Song, Q.; Xiao, S.; Yuan, D. Integration of semi-in vivo assays and multi-omics data reveals the effect of galloylated catechins on self-pollen tube inhibition in Camellia oleifera. Hortic. Res. 2023, 10, uhac248. [Google Scholar] [CrossRef] [PubMed]
  15. Chang, Y.; Hu, S.; Xu, J.; Gong, H.; Guo, X.; Song, Q.; Gong, W.; Yuan, D. Identification of reference genes provides insights into the determinants of self-incompatibility in Camellia oleifera. Sci. Hortic. 2023, 321, 112301. [Google Scholar] [CrossRef]
  16. Du, M.; Yu, X.; Wu, F. Dynamic changes of endogenous hormones in self-pollinated and cross-pollinated pistils of two Camellia species in Hainan. J. Trop. Biol. 2023, 14, 173–177. [Google Scholar]
  17. Wang, Y.; Liu, P.; Cai, Y.; Li, Y.; Tang, C.; Zhu, N.; Wang, P.; Zhang, S.; Wu, J. PbrBZR1 interacts with PbrARI2. 3 to mediate brassinosteroid-regulated pollen tube growth during self-incompatibility signaling in pear. Plant Physiol. 2023, 192, 2356–2373. [Google Scholar] [CrossRef]
  18. Chang, Y.; Xu, J.; Guo, X.; Yang, G.; Deng, S.; Chen, Q.; Gong, H.; Song, Q.; Gong, W.; Yuan, D. Tannase increases fruit set by interfering with self-incompatibility of Camellia oleifera. Ind. Crop. Prod. 2024, 210, 118189. [Google Scholar] [CrossRef]
  19. Santiago, J.P.; Sharkey, T.D. Pollen development at high temperature and role of carbon and nitrogen metabolites. Plant Cell Environ. 2019, 42, 2759–2775. [Google Scholar] [CrossRef]
  20. Wen, Y.; Su, S.C.; Ma, L.Y.; Wang, X.N. Effects of gibberellic acid on photosynthesis and endogenous hormones of Camellia oleifera Abel. In 1st and 6th leaves. J. Forest Res. 2018, 23, 309–317. [Google Scholar] [CrossRef]
  21. Pan, X.; Liu, X.; Wang, X.; Ge, L.Y.; Du, Q.H.; Zeng, Y.L. Effects of LED light quality on the physiology and morphological structure of Camellia oleifera leaves. Taiwan J. For. Sci. 2023, 38, 13–26. [Google Scholar]
  22. Lord, E.M.; Russell, S.D. The mechanisms of pollination and fertilization in plants. Annu. Rev. Cell Dev. Biol. 2002, 18, 81–105. [Google Scholar] [CrossRef] [PubMed]
  23. Lord, E.M. Adhesion and guidance in compatible pollination. J. Exp. Bot. 2003, 54, 47–54. [Google Scholar] [CrossRef] [PubMed]
  24. Qu, L.; Li, L.; Lan, Z.; Dresselhaus, T. Peptide signalling during the pollen tube journey and double fertilization. J. Exp. Bot. 2015, 66, 5139–5150. [Google Scholar] [CrossRef]
  25. Calabrese, E.J.; Agathokleous, E. Pollen biology and hormesis: Pollen germination and pollen tube elongation. Sci. Total Environ. 2021, 762, 143072. [Google Scholar] [CrossRef] [PubMed]
  26. Zhang, L.; Li, J.; Wang, Y.; Liu, S.; Wang, Z.-P.; Yu, X.-J. Integrated approaches to reveal genes crucial for tannin degradation in Aureobasidium melanogenum T9. Biomolecules 2019, 9, 439. [Google Scholar] [CrossRef] [PubMed]
  27. Jia, W.; Li, X.; Wang, R.; Duan, Q.; He, J.; Gao, J.; Wang, J. Disruption of the Contents of Endogenous Hormones Cause Pollen Development Obstruction and Abortion in Male-Sterile Hybrid Lily Populations. Plants 2023, 12, 3804. [Google Scholar] [CrossRef] [PubMed]
  28. Bosco, R.; Caser, M.; Ghione, G.G.; Mansuino, A.; Giovannini, A.; Scariot, V. Dynamics of abscisic acid and indole-3-acetic acid during the early-middle stage of seed development in Rosa hybrida. Plant Growth Regul. 2015, 75, 265–270. [Google Scholar] [CrossRef]
  29. Yang, M.; Yarra, R.; Zhang, R.; Zhou, L.; Jin, L.; Martin, J.J.J.; Cao, H. Transcriptome analysis of oil palm pistil during pollination and fertilization to unravel the role of phytohormone biosynthesis and signaling genes. Funct. Integr. Genom. 2022, 22, 261–278. [Google Scholar] [CrossRef]
  30. Guo, L.; Luo, X.; Li, M.; Joldersma, D.; Plunkert, M.; Liu, Z. Mechanism of fertilization-induced auxin synthesis in the endosperm for seed and fruit development. Nat. Commun. 2022, 13, 3985. [Google Scholar] [CrossRef]
  31. Rounds, C.M.; Winship, L.J.; Hepler, P.K. Pollen tube energetics: Respiration, fermentation and the race to the ovule. AoB Plants 2011, 2011, plr019. [Google Scholar] [CrossRef]
  32. Zhao, W.; Hou, Q.; Qi, Y.; Wu, S.; Wan, X. Structural and molecular basis of pollen germination. Plant Physiol. Biochem. 2023, 203, 108042. [Google Scholar] [CrossRef] [PubMed]
  33. Sankaranarayanan, S.; Ju, Y.; Kessler, S.A. Reactive oxygen species as mediators of gametophyte development and double fertilization in flowering plants. Front. Plant Sci. 2020, 11, 1199. [Google Scholar] [CrossRef] [PubMed]
  34. Lodde, V.; Morandini, P.; Costa, A.; Murgia, I.; Ezquer, I. cROStalk for life: Uncovering ROS signaling in plants and animal systems, from gametogenesis to early embryonic development. Genes 2021, 12, 525. [Google Scholar] [CrossRef]
  35. Gill, S.S.; Tuteja, N. Reactive oxygen species and antioxidant machinery in abiotic stress tolerance in crop plants. Plant Physiol. Biochem. 2010, 48, 909–930. [Google Scholar] [CrossRef] [PubMed]
  36. Pacini, E.; Dolferus, R. Pollen developmental arrest: Maintaining pollen fertility in a world with a changing climate. Front. Plant Sci. 2019, 10, 679. [Google Scholar] [CrossRef]
  37. Zhang, M.J.; Zhang, X.S.; Gao, X. ROS in the male–female interactions during pollination: Function and regulation. Front. Plant Sci. 2020, 11, 177. [Google Scholar] [CrossRef] [PubMed]
  38. Rosa, M.; Prado, C.; Podazza, G.; Interdonato, R.; González, J.A.; Hilal, M.; Prado, F.E. Soluble sugars: Metabolism, sensing and abiotic stress: A complex network in the life of plants. Plant. Signal. Behav. 2009, 4, 388–393. [Google Scholar] [CrossRef] [PubMed]
  39. Pandey, N. Role of plant nutrients in plant growth and physiology. In Plant Nutrients and Abiotic Stress Tolerance; Springer: Singapore, 2018; pp. 51–93. [Google Scholar]
  40. Ma, L.; Zhao, C.; Chen, S.; Lin, X.; Mao, Y.; Zhang, C.; Li, L.; Zhu, H.; Hu, Y.; Zhang, Z.; et al. High-yield Cultivation Technology of Regenerated Rice in Boluo County. J. Mod. Crop. Sci. 2023, 2, 53–58. [Google Scholar]
  41. Liu, M.L.; Xie, H.F.; Ma, Y.; Li, H.; Li, C.; Chen, L.; Jiang, B.; Nian, B.; Guo, T.; Zhang, Z.; et al. High Performance Liquid Chromatography and Metabolomics Analysis of Tannase Metabolism of Gallic Acid and Gallates in Tea Leaves. J. Agric. Food Chem. 2020, 68, 4946–4954. [Google Scholar] [CrossRef]
  42. Upadhyay, R.K.; Motyka, V.; Pokorná, E.; Filepová, R.; Dobrev, P.I.; Handa, A.K.; Mattoo, A.K. A comprehensive endogenous phytohormone metabolite landscape identifies new metabolites associated with tomato fruit. Plant Growth Regul. 2024. [Google Scholar] [CrossRef]
  43. Iqbal, N.; Khan, N.A.; Ferrante, A.; Trivellini, A.; Francini, A.; Khan, M.I.R. Ethylene Role in Plant Growth, Development and Senescence: Interaction with Other Phytohormones. Front. Plant Sci. 2017, 8, 475. [Google Scholar] [CrossRef] [PubMed]
  44. Ma, N.; Ma, C.; Liu, Y.; Shahid, M.O.; Wang, C.; Gao, J. Petal senescence: A hormone view. J. Exp. Bot. 2018, 69, 719–732. [Google Scholar] [CrossRef] [PubMed]
  45. Du, W.; Ding, J.; Li, J.; Li, H.; Ruan, C. Co-regulatory effects of hormone and mRNA-miRNA module on flower bud formation of Camellia oleifera. Front. Plant Sci. 2023, 14, 1109603. [Google Scholar] [CrossRef] [PubMed]
  46. Liu, L.; Zeng, H.; Xu, H.; Yao, X. Effects of phytohormones on pollen germination and pollen tube growth of 4 Camellia plants. Chin. J. Oil Crop. Sci. 2021, 43, 700. [Google Scholar]
  47. Shen, S.; Yan, W.; Xie, S.; Yu, J.; Yao, G.; Xia, P.; Wu, Y.; Yang, H. Physiological and Transcriptional Analysis Reveals the Response Mechanism of Camellia vietnamensis Huang to Drought Stress. Int. J. Mol. Sci. 2022, 23, 11801. [Google Scholar] [CrossRef] [PubMed]
  48. Parrotta, L.; Faleri, C.; Del Duca, S.; Cai, G. Depletion of sucrose induces changes in the tip growth mechanism of tobacco pollen tubes. Ann. Bot. 2018, 122, 23–43. [Google Scholar] [CrossRef] [PubMed]
  49. Yuan, M.; Weng, S.; Ma, Y.; Wu, R.; Kang, X.; Du, L. Study on physiological and biochemical characteristics during in vitro flowering of Rosa ‘Yametsu-Hime’. Plant Cell Tissue Org. 2024, 157, 13. [Google Scholar] [CrossRef]
  50. Zhang, X.; Li, B.; Zhang, X.; Wang, C.; Zhang, Z.; Sun, P. Exogenous application of ethephon regulates flower abscission, shoot growth, and secondary metabolites in Camellia sinensis. Sci. Hortic. 2022, 304, 111333. [Google Scholar] [CrossRef]
  51. Zhang, T.; Liu, C.; Chen, Y.; Xu, Y.; Tang, W.; Chen, L.; Li, Z. Physiological and Biochemical Effects of Exogenous Calcium on Camellia oleifera Abel under Drought Stress. Forests 2023, 14, 2082. [Google Scholar] [CrossRef]
  52. Sheng, J.; Li, X.; Zhang, D. Gibberellins, brassinolide, and ethylene signaling were involved in flower differentiation and development in Nelumbo nucifera. Hortic. Plant J. 2022, 8, 243–250. [Google Scholar] [CrossRef]
  53. Breygina, M.; Schekaleva, O.; Klimenko, E.; Luneva, O. The Balance between Different ROS on Tobacco Stigma during Flowering and Its Role in Pollen Germination. Plants 2022, 11, 993. [Google Scholar] [CrossRef] [PubMed]
Figure 1. Morphological Changes in Floral Organs of C. drupifera during the Flowering Stage. Note: Panels (AF) illustrate the morphological changes at different stages: two days before flowering (K(−2)), on the day of flowering (K(0)), one day after flowering (K(1)), two days after flowering (K(2)), four days after flowering (K(4)), and six days after flowering (K(6)). (a) Petals (P); (b) Stamens (S); (c) Pistils (P); (d) Sepals (S); (e) Buds (B). The grid size varies among the images: the minimum square length is 1 cm, and this measurement remains consistent across all images.
Forests 15 01391 g001
Figure 2. Heatmap of Endogenous Substance Abundance during Flowering Stage of C. drupifera. Note: (A); Pistils; (B): Stamens. The heatmap color gradient from red to blue represents the relative changes in endogenous substance content in floral organs during the flowering stage, with red indicating above-average levels and blue indicating below-average levels. The dendrogram on the left side of the heatmap shows the similarity in substance content changes, with closer branches representing more similar trends. The raw data were standardized using Z-score normalization. TNS: tannase, H2O2: Hydrogen peroxide, ROS: Reactive oxygen species, SP: Soluble proteins, SS: Soluble sugars, ABA: Abscisic acid, IAA: Indole-3-acetic acid, GA: Gibberellins, CTK: Cytokinin, ETH: Ethylene, BR: Brassinosteroids, POD: Peroxidase, SOD: Superoxide dismutase, CAT: Catalase.
Forests 15 01391 g002
Figure 3. Dynamic Changes in Tannin Synthase Activity of Floral Organs during the Flowering Stage of C. drupifera. Note: different capital letters following data in the same row indicate significant differences (p < 0.05) between different floral organs at the same sampling stage; different lowercase letters following data in the same column indicate significant differences (p < 0.05) between different sampling stages of the same floral organ. Error bars represent the standard deviation (SD) of the mean. The red fill represents pistils, and the green dashed line represents stamens. The same notation and color coding apply to all relevant figures and tables in the text.
Forests 15 01391 g003
Figure 4. Dynamic Changes in Hormone Content of Floral Organs during Flowering Stage of C. drupifera. Note: Panels (AF) represent the content of IAA, CTK, GA, ETH, ABA, and BR, respectively.
Forests 15 01391 g004
Figure 5. Dynamic Changes in Hormone Ratios of Floral Organs during Flowering Stage of C. drupifera. Note: Panels (AD) represent the ratios of IAA/ABA, CTK/ABA, BR/ABA, and GA/ABA, respectively.
Forests 15 01391 g005
Figure 6. Dynamic Changes in ROS, H2O2 Content, and Antioxidant Enzyme Activity of Floral Organs during Flowering Stage of C. drupifera. Note: Panels (AE) represent the ROS content, H2O2 content, POD, SOD, and CAT activity, respectively.
Forests 15 01391 g006
Figure 7. Dynamic Changes in Soluble Protein (SP) and Soluble Sugar (SS) Contents of Floral Organs during Flowering Stage of C. drupifera. Note: Panels (A,B) represent the Soluble Protein content and Soluble Sugar content, respectively.
Forests 15 01391 g007
Figure 8. Correlation of Endogenous Substances in Floral Organs during Flowering Stage of C. drupifera. Note: (A): Correlation in pistils; (B): Correlation in stamens. Colors in the correlation analysis represent positive (red) and negative (blue) correlations, with darker colors indicating stronger correlations. “*” indicates significant correlation at the 0.05 level (p < 0.05); “**” indicates highly significant correlation at the 0.01 level (p < 0.01).
Forests 15 01391 g008
Disclaimer/Publisher’s Note: The statements, opinions and data contained in all publications are solely those of the individual author(s) and contributor(s) and not of MDPI and/or the editor(s). MDPI and/or the editor(s) disclaim responsibility for any injury to people or property resulting from any ideas, methods, instructions or products referred to in the content.

