Article

Quantifying Blowdown Disturbance in Overstory Retention Patches in Managed Nothofagus pumilio Forests with Variable Retention Harvesting

by
Guillermo Martínez Pastur
1,*,
Julián Rodríguez-Souilla
1,
Lucía Bottan
1,
Santiago Favoretti
2 and
Juan M. Cellini
3
1
Centro Austral de Investigaciones Científicas (CADIC), Consejo Nacional de Investigaciones Científicas y Técnicas (CONICET), Houssay 200, Ushuaia 9410, Tierra del Fuego, Argentina
2
Instituto de Ciencias Polares, Ambiente y Recursos Naturales (ICPA), Universidad Nacional de Tierra del Fuego (UNTDF), Fuegia Basket 251, Ushuaia 9410, Tierra del Fuego, Argentina
3
Laboratorio de Investigaciones en Maderas (LIMAD), Universidad Nacional de la Plata (UNLP), Diagonal 113 469, La Plata 1900, Buenos Aires, Argentina
*
Author to whom correspondence should be addressed.
Forests 2024, 15(8), 1432; https://doi.org/10.3390/f15081432
Submission received: 5 July 2024 / Revised: 7 August 2024 / Accepted: 14 August 2024 / Published: 14 August 2024
(This article belongs to the Special Issue Impacts of Climate Extremes on Forests)

Abstract

:
The natural resilience of the forests to face impacts of blowdown damages was affected by harvesting operations. Variable retention harvesting (VRH) increases forest structure heterogeneity in managed stands and decreases blowdown damages. The objective of this study was to characterize blowdown in Nothofagus pumilio forests managed with VRH in Southern Patagonia (Argentina). We analyzed long-term plots and one area affected by a windstorm after harvesting (exposure to winds and influence of retention patches) using univariate analyses. We found a differential impact in retention patches compared to dispersed retention after a windstorm considering aspect and distance to edge (e.g., blowdown trees: F = 6.64, p < 0.001). The aspect in retention patches presented few structural differences before the windstorm (e.g., tree diameter: F = 3.92, p = 0.014) but was not greatly influenced by the received damage after the windstorm. In long-term plots, we found that aspect and location in patches (distance to edge) determined the tree stability. We also found differences in wind damage considering retention level and design (e.g., aggregates and dispersed retention vs. aggregates and clear-cuts). We conclude that VRH increased the heterogeneity in harvested areas, where retention patches presented greater resilience in confronting extreme climate events and decreased recurrent wind exposure impacts in the long term. We found the marginal influence of aspect in the retention patches despite dominant winds and damages received by remnant trees during harvesting.

1. Introduction

Blowdown damage (windthrow and windsnap) in natural forests is often analyzed as an exceptional, catastrophic phenomenon rather than a recurrent driver of ecosystem patterns and processes that falls within the spectrum of chronic and acute effects of wind on forests [1]. Wind damage by windthrow (uprooting and overthrowing of trees) and windsnap (breakage of the tree trunk) is a natural process in the dynamics of many forest ecosystems, e.g., Nothofagus pumilio (Poepp. et Endl) Krasser (lenga) forests in Southern Patagonia [2,3] and can lead to the creation of canopy gaps, development of multi-cohort stands, and the whole-stand replacement [4]. These impacts influence soil fertility and light and moisture availability and creates new niches for regeneration and understory species [4,5,6]. In the same way, harvesting also modifies the structure of natural forests, affecting ecosystem function, microclimate, and nutrient cycles, and it is directly related to the cut intensity [7]. The impacts of harvesting have been extensively documented in the natural forests of Southern Patagonia [8,9]. However, knowledge regarding the alterations in the resilience of these forests [10] to withstand natural impacts such as windstorms or climate change is limited [11,12].
Blowdown damage in harvested forests is caused by a combination of different factors, including windstorm characteristics, exposure to dominant winds (e.g., forest edges), tree metrics (e.g., the ratio between diameter and height or root system development), soil (e.g., moisture), and forest structure of the stands [13,14]. To mitigate wind damages after harvesting, strategies such as variable retention harvesting (VRH) and continuous cover management have been suggested, where both decrease the probability of blowdown damage in the remnant overstory [7,15]. VRH involves leaving diverse amounts, types, and patterns of tree retention after cuts, contributing to an increase in heterogeneity at stand-level [16]. These new proposals are intended to mimic the natural disturbances by retaining large live trees, snags, and logs, which provide important ecological functions in newly regenerating stands [17], where patches and dispersed retention present different susceptibility to blowdown damage [18]. Retention patches help to preserve the beneficial interactions that trees exhibit in natural forests. However, dispersed trees scattered throughout the harvested areas may be more vulnerable when facing the impacts of strong winds on their own. Moreover, wind damage causes economic losses in managed stands and can decrease timber production and profitability [15,19,20], leading to the depreciation of harvested wood [21]. Management of N. pumilio forests is based on the natural regeneration in the harvested stands [7]; therefore, remnant overstory is critical for seed production to guarantee forest continuity [5,22,23], as well as conservation of biodiversity [24] and genetic resources [25].
Wind disturbance in natural forests is a complex process that operates at various temporal and spatial scales [26]. Wind can cause significant impacts, breaking or uprooting trees and leading to irreparable damage to whole managed stands [27]. These damages are influenced by the strength of the winds and the stability characteristics of the trees [13,14,28]. Blowdown damage patterns within natural forests varied across the landscape. The propagation of the damage during windstorms depends on the heterogeneity of remnant overstory that can be affected by wind exposure and root anchorage [1,13]. Another influential factor is the duration of the storms, which can reduce the resilience of the trees to face windstorms [4,13,18]; however, few papers deal with this effect due to the complexity of comparing this factor to experimental studies. It was suggested that multi-storied natural forests with a large range of tree sizes have less severe wind shear at the canopy top than forests with uniform canopies, leading to reduced gustiness and crown damage [29]. In this context, VRH can bring greater stability and promote greater heterogeneity in the remnant overstory [7,20]. However, there are variations in wind loading due to the relative position of trees within the retention patches, particularly near the edges, e.g., the highest wind loading is on trees at exposed edges [13,30].
Wind moves in both horizontal and vertical directions, being affected by the conditions of surfaces that it encounters [31,32]. The wind direction can be modified by forest edges and structure characteristics, and wind diminishes when it arrives at open areas. This involves the acceleration of the wind, which depends on the current forest structure (e.g., greater acceleration in harvested areas compared to closed natural forests) [32]. This effect can be direct (e.g., wind loading on trees) or indirect (e.g., a separation bubble in the back position of trees where flow reverses direction and generates a highly turbulent wake), increasing the kinetic energy [33]. Some of this energy is transferred to the trees as the wind leaves the area, resulting in windthrow or windsnap damages [32]. Understanding the effects of wind on natural forests is important for developing measures to minimize damage after harvesting and to design more resilient management practices. It was pointed out that further research is needed about the mechanisms by which wind influences tree growth and development, as well as the ecological impacts on forest communities [1,34]. In this context, the objective was to characterize windthrow and windsnap in managed areas with variable retention harvesting (VRH) of N. pumilio forests in Tierra del Fuego (Argentina) and determine the effectiveness of retention patches confronting these wind impacts. Specifically, we want to (i) determine the stability of VRH in the long-term and relate the individual tree damages generated by the wind according to the location inside retention patches; (ii) determine the impacts after a windstorm event in retention patches and areas with dispersed retention, considering the aspect and distance to the retention patch edges; and (iii) determine if the harvesting damage increase the susceptibility to blowdown during a windstorm event. We hypothesized that (i) retention patches of primary forests presented greater stability than harvested areas with dispersed retention, where the influence of retention patches allowed us to increase the tree stability in confronting wind damage; (ii) the wind modified the remnant forest structure in the managed stands, especially those areas exposed to the dominant wind direction compared to those located back guard; and (iii) harvesting damages increase the chance of blowdown in dispersed retention areas and edges of retention patches.

2. Materials and Methods

The analyses were conducted using two different samplings in managed stands with VRH and control areas (primary forests) of N. pumilio forests. The climate is cold and oceanic, with strong winds, mainly from the southwest. The mean annual temperature is 5.5 °C (1.6 °C in the coldest and 9.6 °C in the warmest months), and frost may occur at any time of the year. Precipitation is evenly spread over the year, with an annual average of 500 mm yr−1 on the south coast of the island and about 1000 mm yr−1 at the tree line and declining toward the north. The landscape occupied by forests is of glacial origin, with loess and alluvial materials in the foothills, where acid-brown soils are the most common. The forests correspond to the sub-Antarctic forest type where Nothofagus species are the dominant trees N. pumilio, N. antarctica (Forster f.) Oersted, N. betuloides (Mirb.) Oersted, sparsely mixed with Drymis winteri Forster & Forster f., Maytenus magellanica (Lam.) Hooker f., and Embothrium coccineum Forster & Forster f. (Figure 1A). Nothofagus pumilio forests are currently the only forest type of economic interest. It is harvested mainly in pure but also in mixed stands. The dominant heights range from 30 m in the best conditions to 15 m in the poorest timber sites, with an average of 20–24 m [2,5,7,8,9,11,23].

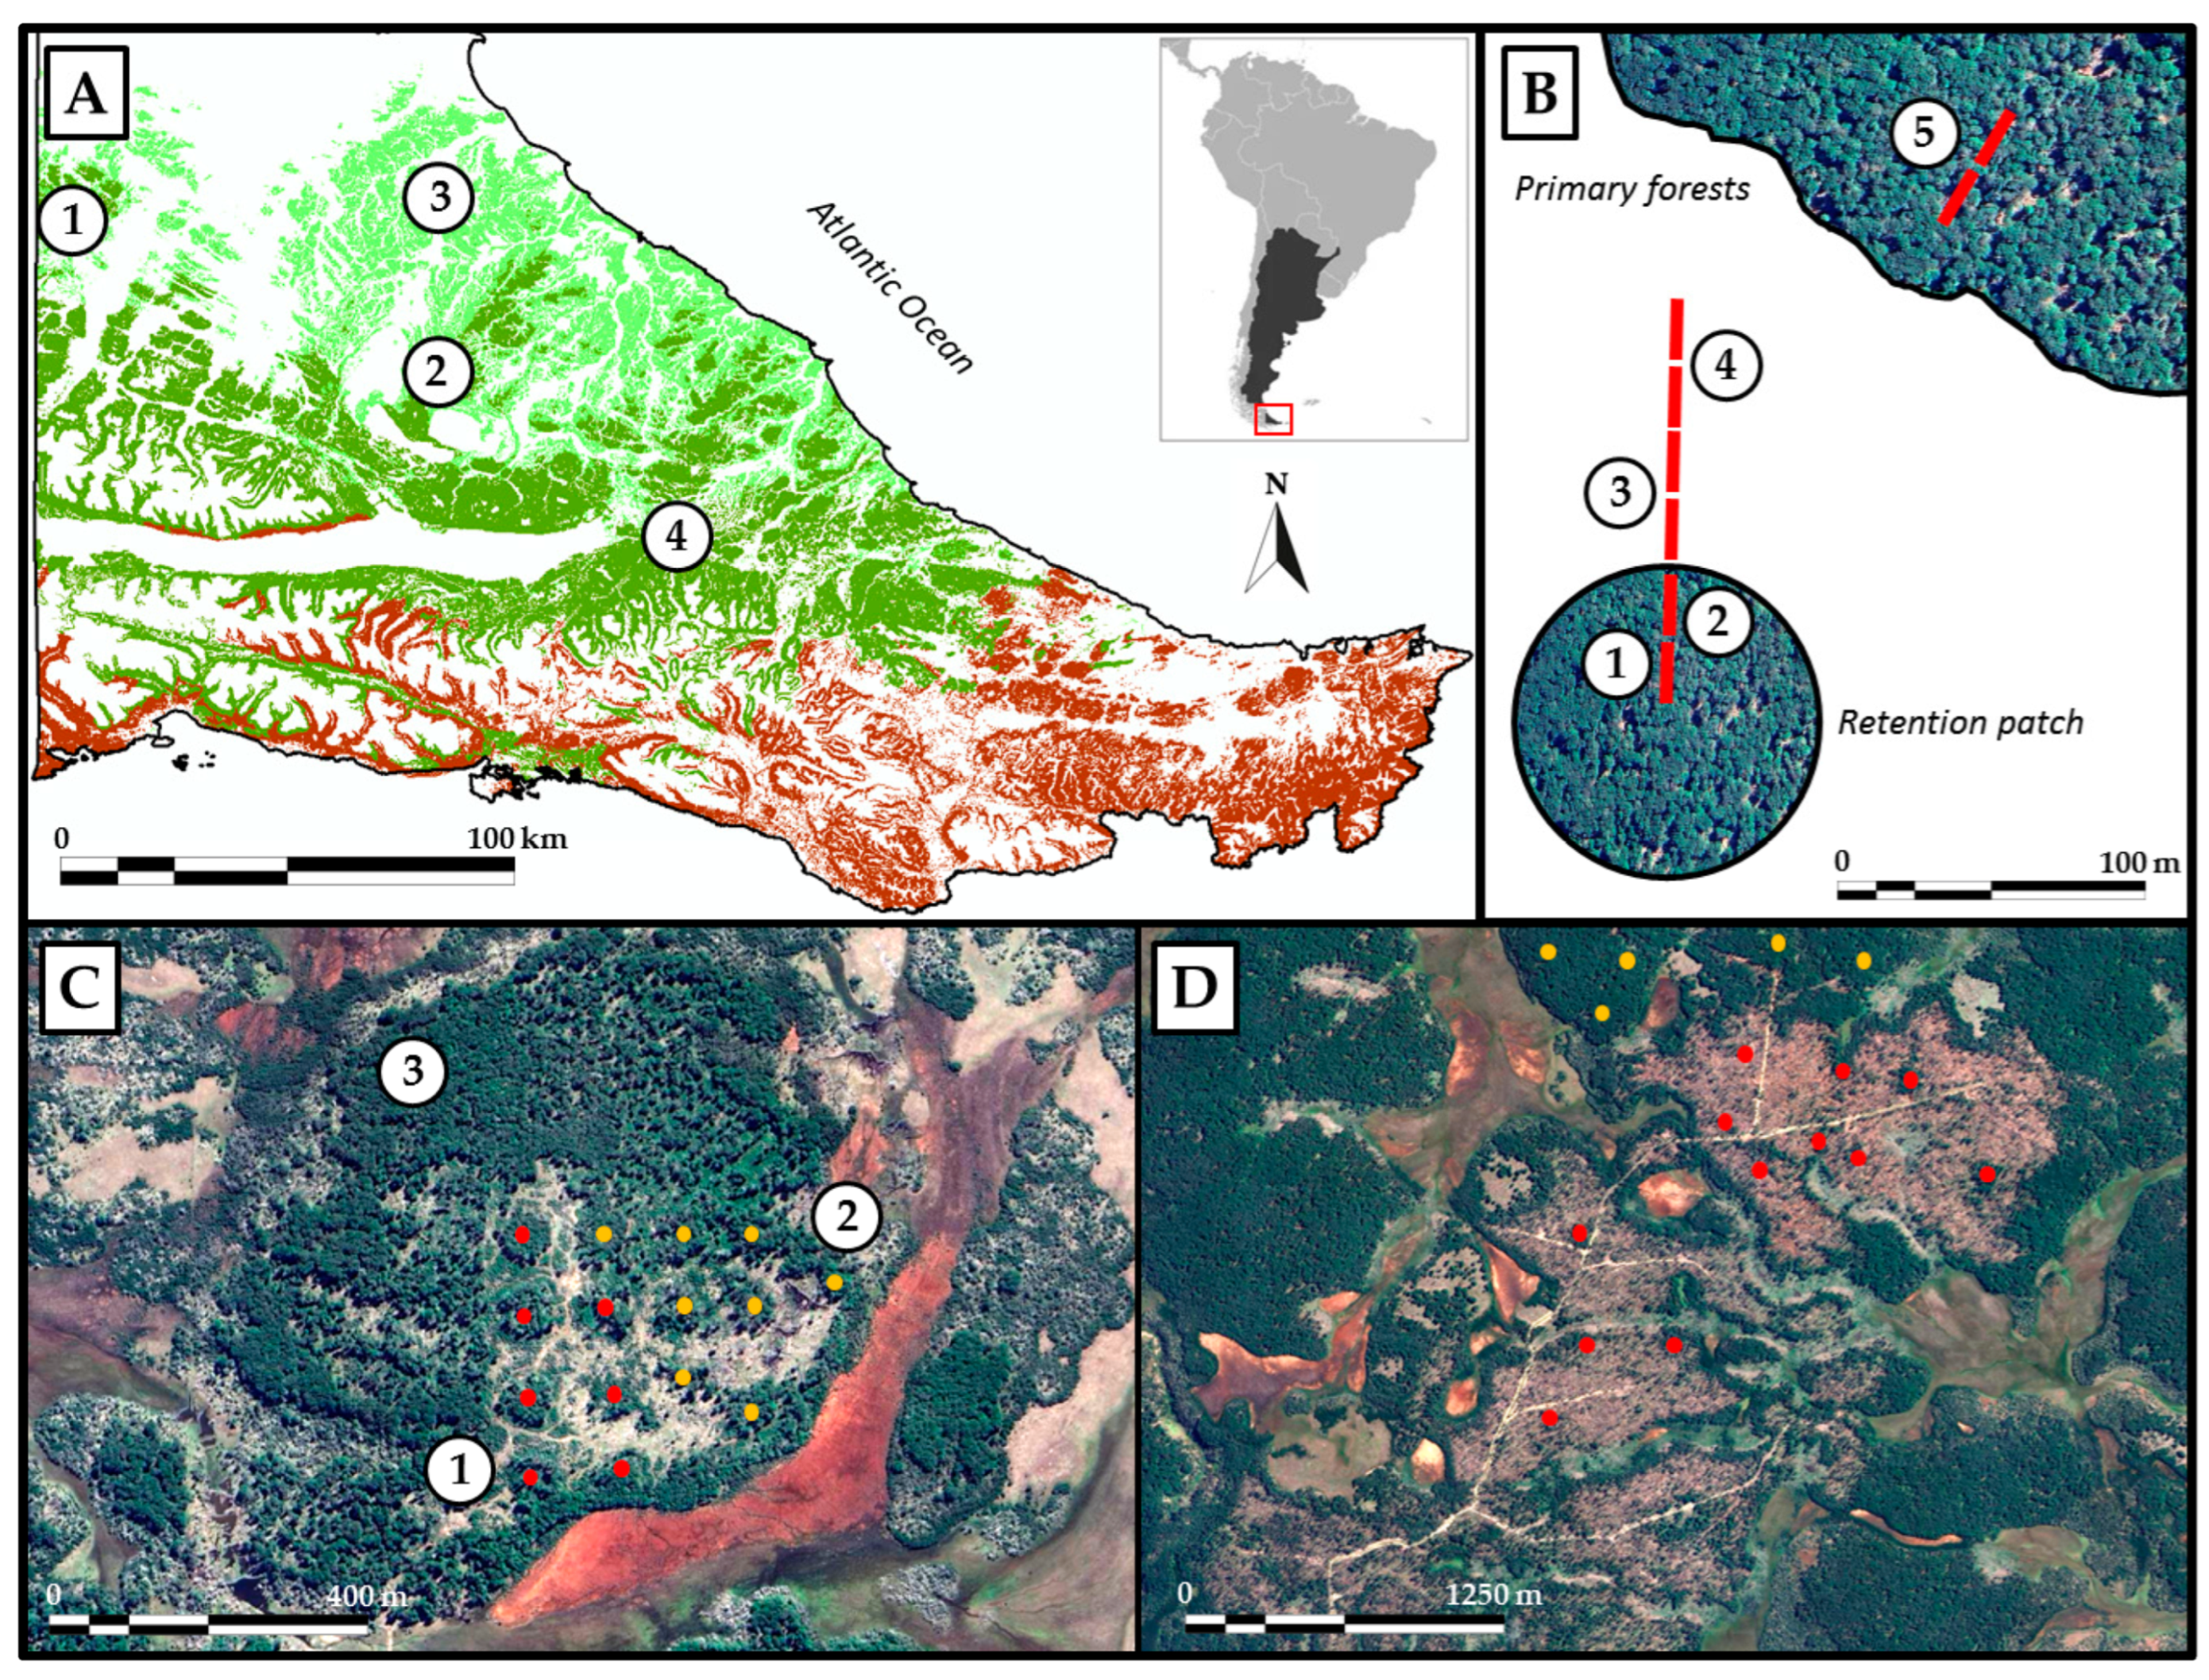
2.1. Sampling Design at San Justo Ranch

The first study area (50 ha) was located at San Justo Ranch (−54.12° SL, −68.59° WL) and belongs to a long-term monitoring plot of the PEBANPA network (Parcelas de Ecología y Biodiversidad de Ambientes Naturales en Patagonia Austral, INTA-UNPA-CONICET, Argentina) [35] (Figure 1). This plot was harvested by VRH in 2001, retaining 28% of the original forest area by leaving aggregates as retention patches (AR, one circular retention patch of 30 m radius per hectare) [35,36]. We tested two different treatments: (i) AR with clear-cuts (AR-CC) and (ii) 10–15 m2 ha−1 basal area (BA, m2 ha−1) of dispersed retention (AR-DR) evenly distributed between retention patches. We monitored windthrow inside 15 retention patches (7 for AR-CC and 8 for AR-DR) after VRH between 2002 and 2023 (1 to 22 years after harvesting, YAH) (Figure 1C), measuring blowdown tree metrics, such as (i) number of trees per retention patch, (ii) BA, (iii) development stage [37], (iv) canopy stratum (suppressed, intermediate, codominant, dominant), (v) tree-fall direction, and (vi) location inside AR: Core = 1/3 inner area between 0 and 17.3 m radius; Middle = 1/3 middle area between 17.3 and 24.5 m radius; Edge = 1/3 area near the edge between 24.5 and 30.0 m radii.

2.2. Sampling Design at Rivadavia Ranch

The second study area was located at Rivadavia Ranch (−54.33° SL, −67.61° WL), where Lenga Patagonia S.A. harvested the forests for the timber industry (Figure 1). The forests were harvested, leaving 30–35 m2 ha−1 BA of dispersed retention (DR) and retention patches (0.25 to 1.0 ha each) for conservation purposes. The retention patches present a maximum distance of 150 m among them or to forest edges in any direction. These retention patches include protection forests representing 40%–50% of the total natural forests (e.g., riversides and edges with open areas) and AR (5%–10% of timber forests). The harvesting was conducted during 2021–2023 in 648 ha, which was partially affected by a windstorm on 25 October 2023 (430 ha) (Figure 1D). We measured the impact of the windstorm during the first week of December of 2023 with 17 transects, considering (i) harvested areas with retention patches and dispersed retention located at different aspects (n = 4 aspects × 3 replicas = 12 transects) and (ii) primary forests (PF) as control areas (n = 5 transects). In harvested areas, transects were located in order to capture the influence of retention patches >100 m apart from each other: (i) the first 50 m were located inside retention patches (0–25 m in core areas, 25–50 m from core to edge areas); (ii) the second 50 m were located in the dispersed retention under the influence of the edges of retention patches; and (iii) the third 50 m were located in the dispersed retention without the influence of retention patches (Figure 1B). The location of each transect in harvested stands was not random; they were established on forest edges that faced different aspects (N, E, S, W). Additionally, we characterized primary forests with 50 m transects in core areas (100 m away from edges). At each transect (6 consecutive plots of 25 m × 10 m in harvested areas and 2 consecutive plots in PF), we measured all alive trees and stumps, including (variables, acronyms, and references are listed in Table A1) (i) dominant height of the two tallest trees of each transect (DH, m) using an Impulse Laser Rangefinder (Laser Technology, Centennial, CO, USA), (ii) diameter at breast height (DBH, cm) or diameter of the stump at 30 cm height with bark (DST, cm) with a forest caliper, (iii) tree condition (standing alive, standing dead, or blown down), and (iv) harvesting damage on trees (damage of skidders or extraction road construction), considering cumulative damage effects (WD = without damage; ONE = damage of skidders or extraction roads; TWO = damage of skidders and extraction roads). We modeled the original forest structure prior to harvesting and windstorm, as well as the current forest structure, discriminating (i) remnant trees, (ii) dead standing trees, (iii) windthrow (uprooting trees), and windsnap trees (trees that lost the crowns during the windstorm), and (iv) felled trees during harvesting [38]. DST was employed to model DBH, and then we obtained total over-bark volume (TV, m3 ha−1) [39,40] and tree density (TD, n ha−1). For windthrow trees, we also measured the direction of the fall to characterize the influence of dominant winds. Hemispherical photos were taken every 25 m at each transect to estimate canopy cover (CC, %), relative leaf area index (LAI), transmitted direct (DIR, %), transmitted diffuse (DIF, %), and transmitted total solar radiation (TR, %) [5]. To evaluate the forest ground cover, we used the point-intercept method [41], including bare soil (%, BS), overstory trees (%, TREE), dicot plants (%, DICO), tree regeneration (%, REG), monocot plants (MONO, %), non-vascular plants (INF, %), and coarse-woody debris > 1 cm (DEB, %). The volume of coarse-woody debris (m3 ha−1, VDEB) was estimated by multiplying the diameter of the intercepted debris and its cover (relative area) [37].

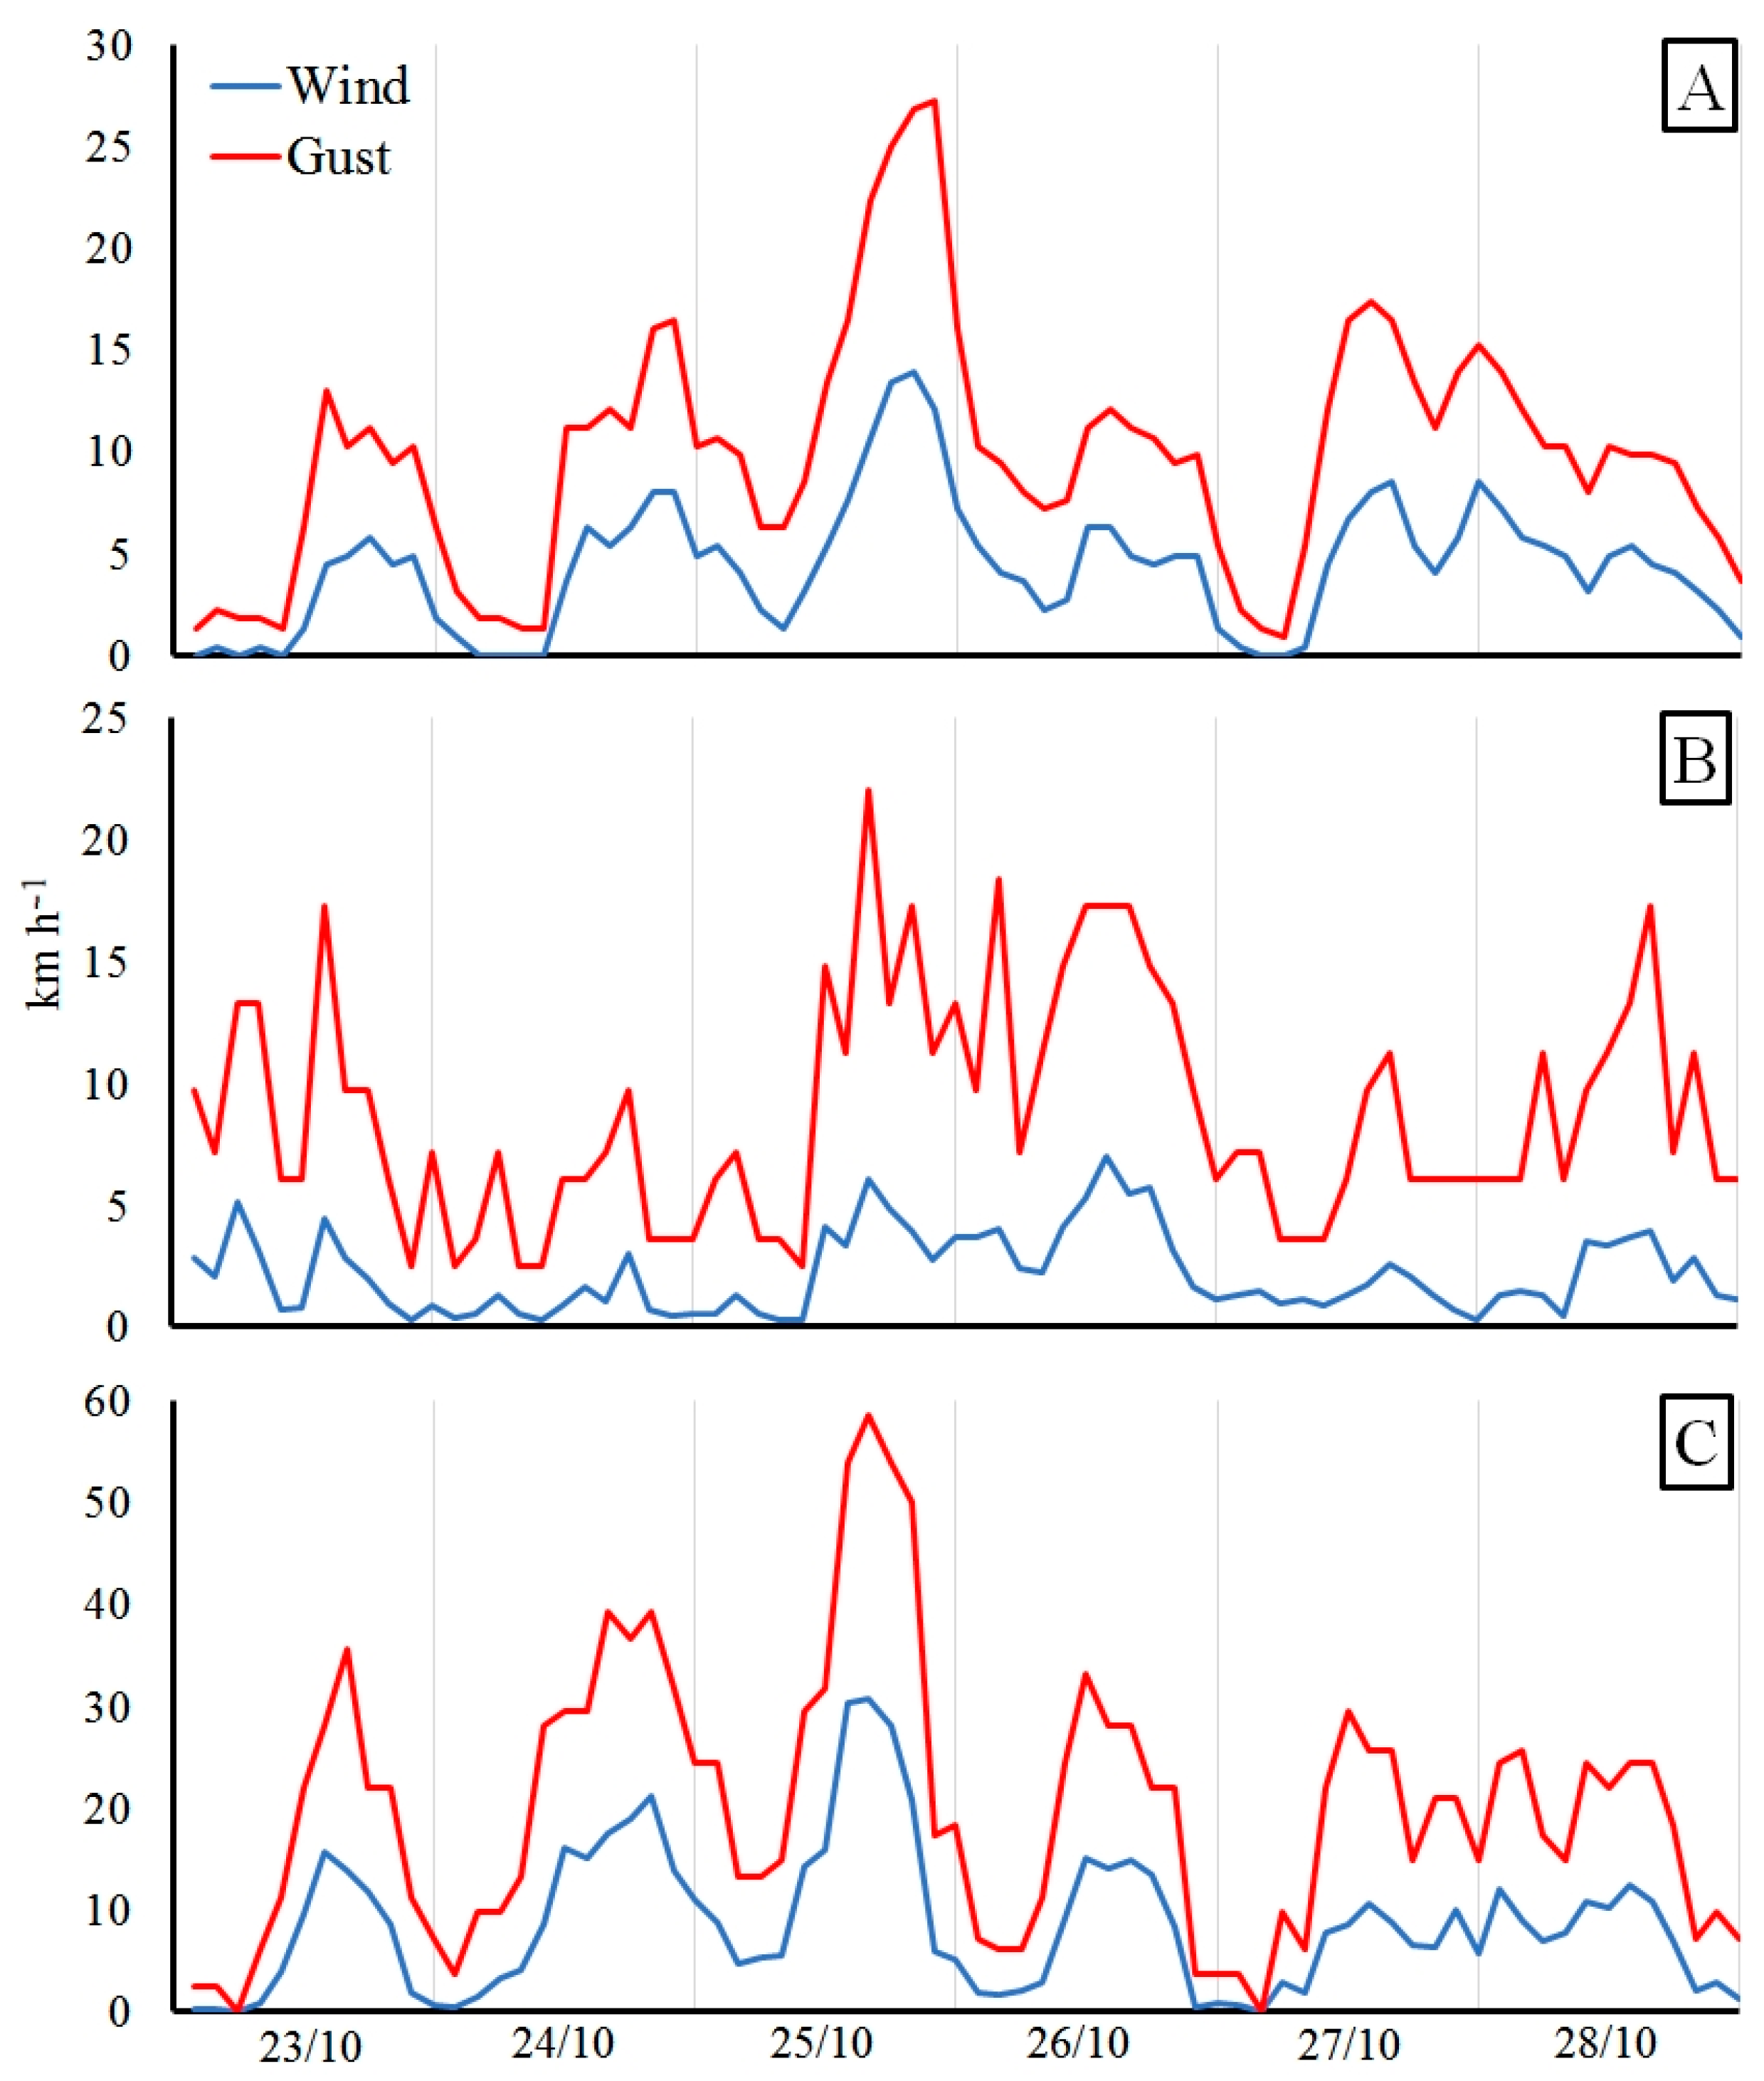
2.3. Characterization of the Windstorm Event

We employed the following data from four weather stations to characterize the windstorm event: (i) at the harvested forests in Rivadavia Ranch (−54.33° SL, −67.61° WL); (ii) at the industrial complex of Lenga Patagonia S.A. (−54.45° SL, −67.17° WL); (iii) at El Roble Ranch (−54.07° SL, −67.68° WL); and (iv) at San Justo Ranch (−54.12° SL, −68.59° WL) (Figure 1A). The two first weather stations were DAZA DZ-WT1081 (Shenzhen, China), and the two last were Davis Instruments 7440 Monitor II (Hayward, CA, USA). We used the first three weather stations to characterize the wind mean speed (km h−1) and wind gusts (km h−1) (defined as the increase in the speed of the wind) during the previous and following days of the studied windstorm event (October 2023), and the average wind direction (N = north; NE = northeast; E = east; SE = southeast; S = south; SW = southwest; W = west; NW = northwest) across the year and during the studied windstorm (year 2023). Furthermore, the last weather station was used to characterize the average wind direction across the year at the long-term plot in San Justo Ranch (2004–2007).

2.4. Statistical Analyses

We used analyses of variance (ANOVA) alongside graphical representations to address our specific objectives. To determine the stability of VRH in the long-term and relate the individual tree damages by the wind according to the location inside the retention patches (objective 1) in San Justo Ranch, we made simple ANOVAs comparing BA of blowdown trees (m2 at each patch) at two different variable retention designs (AR-CC, AR-DR), considering years and designs as main factors. The year 2017 appears as null in the analyses because no blowdown trees were found. We did not conduct a multiple ANOVA since we found significant effects in the interaction between both factors. We also determined the number of blowdown trees considering tree-fall orientation (N, NE, E, SE, S, SW, W, NW), the average wind direction across the year, and the location of windthrown trees inside retention patches (Core, Middle, Edge), which were graphically presented.
To determine the impacts after the windstorm event in retention patches and dispersed retention (objective 2) and to determine if harvesting damage increased the susceptibility to blowdown during the windstorm (objective 3) in Rivadavia Ranch, we conducted (i) two-way ANOVAs of forest structure and stand conditions considering aspect and distance across the transects as main factors (DH, CC, LAI, DIR, DIF, TR); (ii) two-way ANOVAs of forest ground cover and coarse-woody debris volume considering aspect and distance across the transects as main factors (BS, TREE, DICO, REG, MONO, INF, DEB, VDEB); (iii) two-way ANOVAs of changes in tree diameter and density considering aspect and distance across the transects as main factors comparing pre-disturbance to post-disturbance forest structure (DBH-O = tree diameter of the original forests; DBH-H = tree diameter of the harvested trees; TD-O = tree density of the original forests; TD-R = density of remnant trees; TD-D = density of standing dead trees; TD-W = density of windthrow trees; TD-H = density of harvested trees; and (iv) two-way ANOVAs of changes in basal area and total over-bark volume of the stands considering aspect and distance across the transects as main factors (BA-O = basal area of the original forests; BA-R = basal area of remnant trees; BA-D = basal area of standing dead trees; BA-W = basal area of windthrow trees; BA-H = basal area of harvested trees; TV-O = total over-bark volume of the original forests; TV-R = total over-bark volume of remnant trees; TV-D = total over-bark volume of standing dead trees; TV-W = total over-bark volume of windthrow trees; TV-H = total over-bark volume of harvested trees). Differences between factor means were compared using the Tukey test (p < 0.05). Control treatment (PF) was presented as the mean and standard deviation (SD) to define a baseline comparison. Moreover, we characterized the following through graphs: (i) mean wind speed and wind gusts at different locations (El Roble Ranch, Rivadavia Ranch, Lenga Patagonia S.A.) during the previous and following days of the studied windstorm event; (ii) tree-fall quadrant (N, E, S, W) considering the number of blowdown trees and their basal area contribution, and a number of trees damaged during harvesting classified by areas and damage types; and (iii) mean wind direction across the year and during the studied windstorm event. All the analyses were conducted using Statgraphics Centurion XVI software version 16.1.11 (StatPoint Technologies, Warrenton, MO, USA).

3. Results

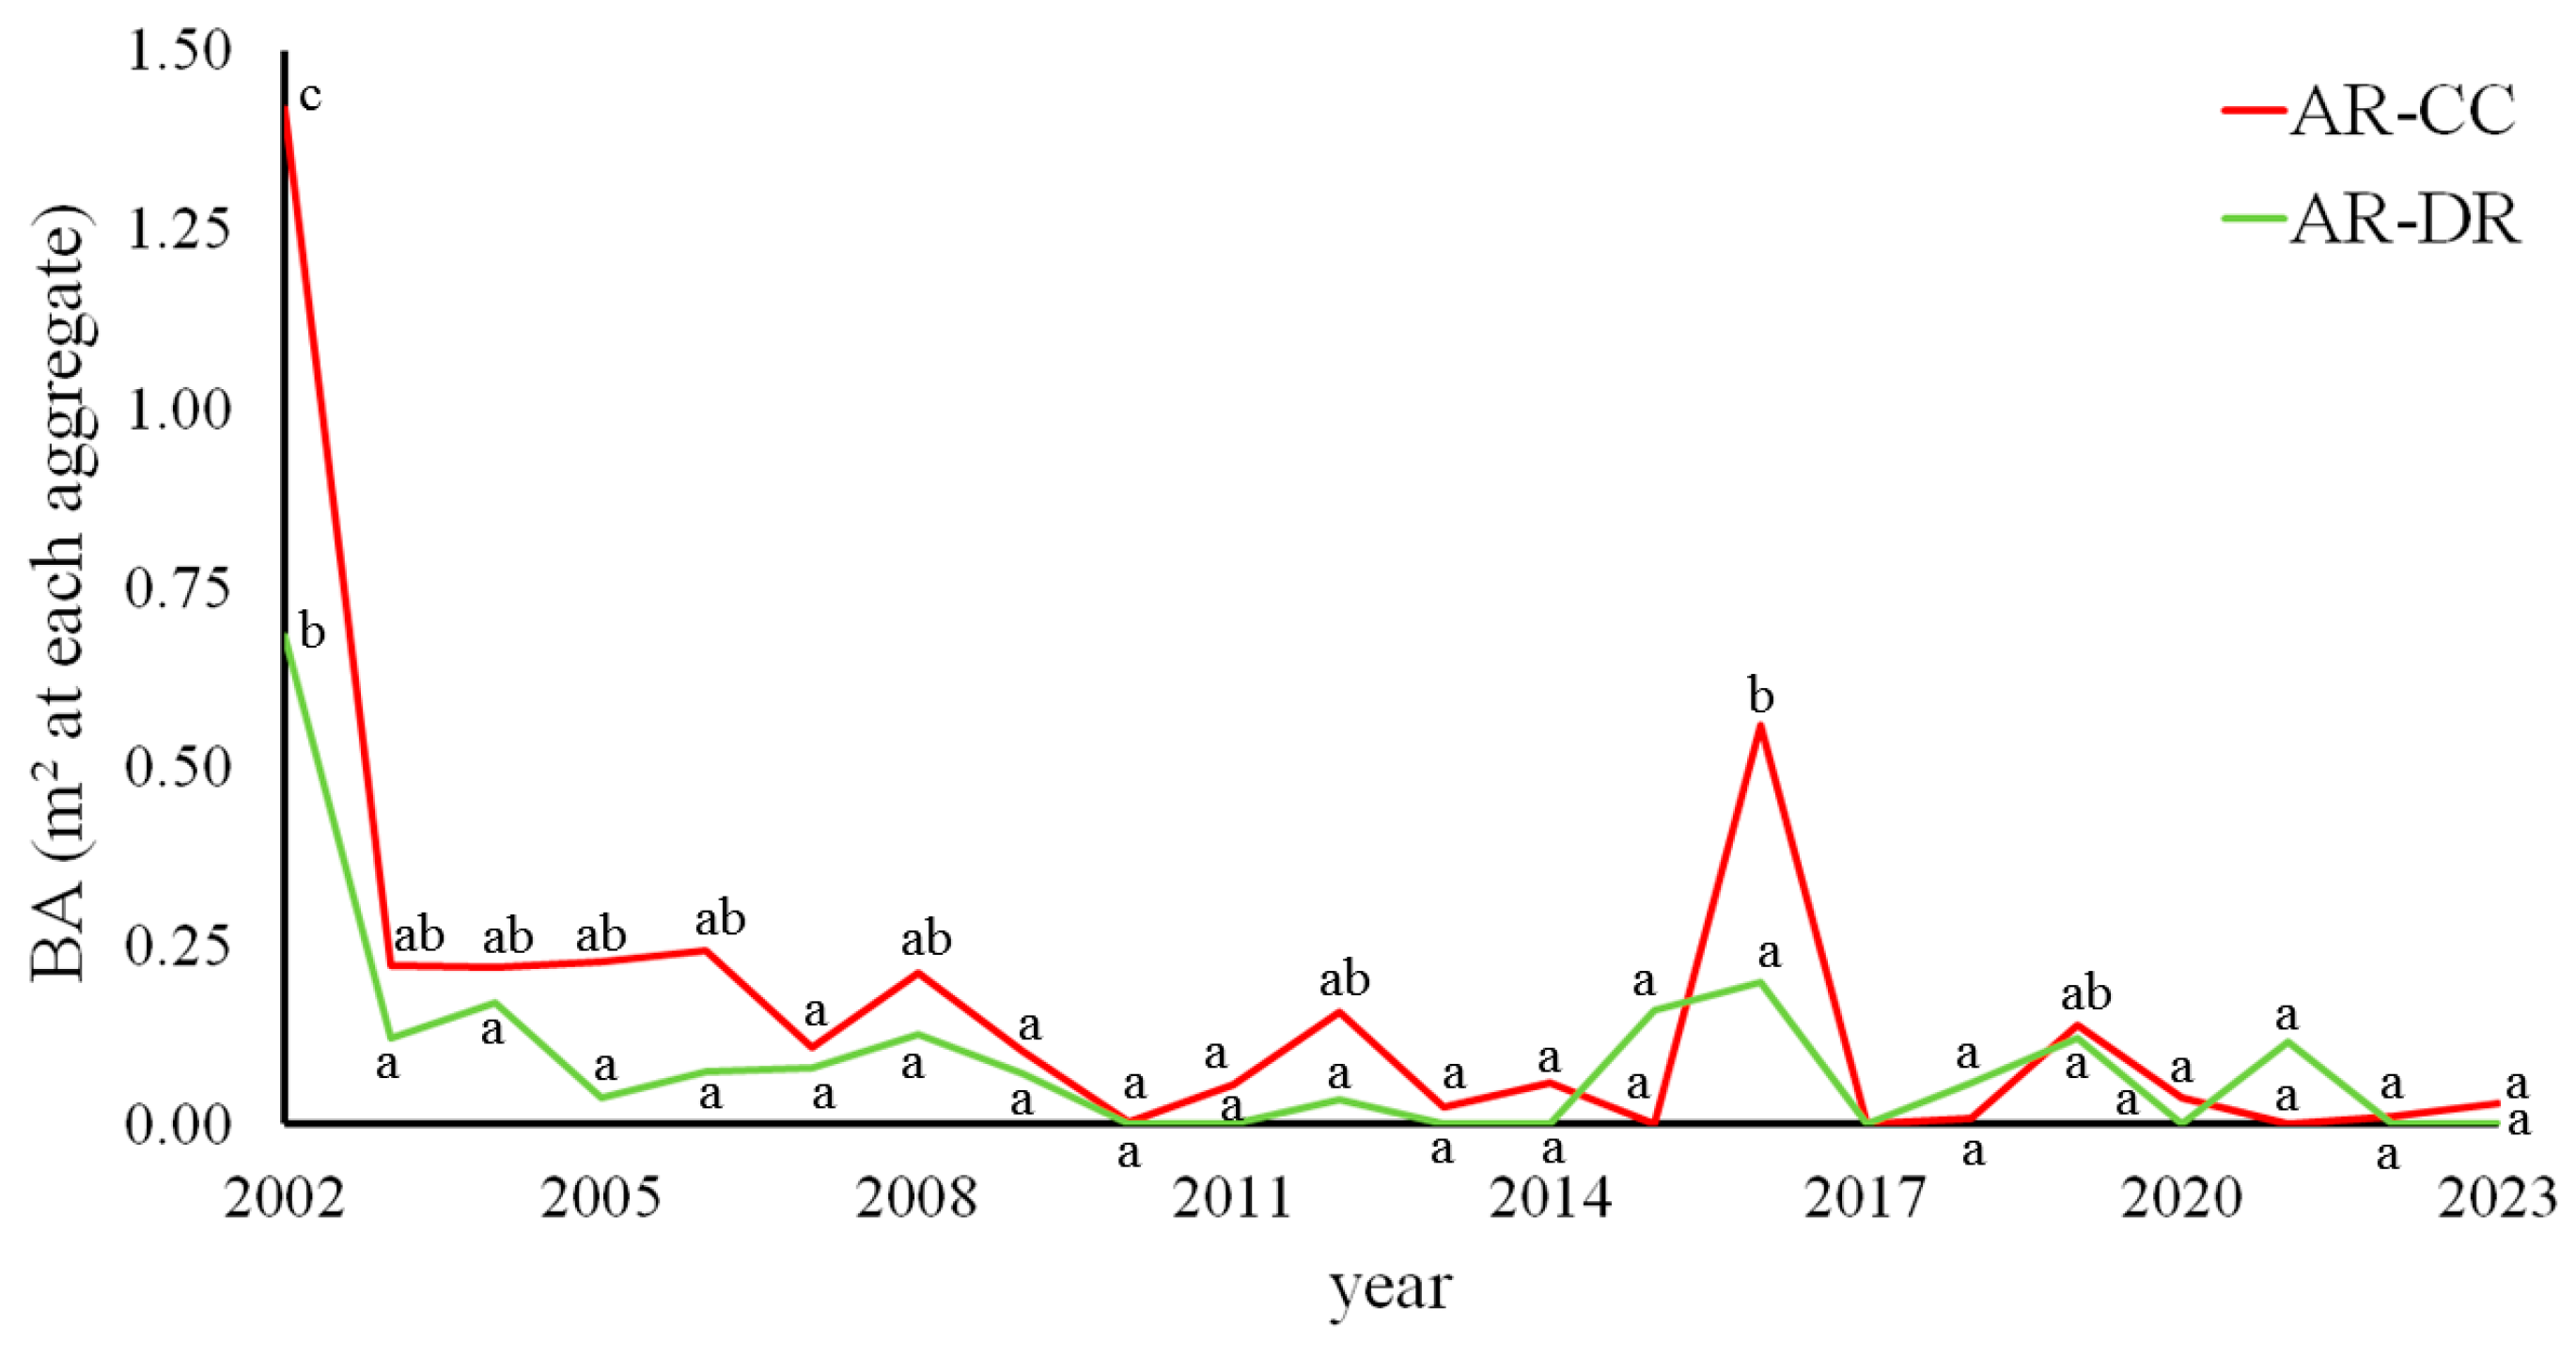
3.1. Long-Term Stability of Retention Patches in Variable Retention Harvesting at San Justo Ranch

As was expected, dominant winds and blowdown were closely related but occurred in different quadrants of retention patches. A long-term survey showed that 58.1% of blowdown trees (2002–2023) were located in NE to E quadrants (Figure 2A), in the opposite direction to dominant winds (SW to W) (Figure 2B). Furthermore, nearly half of the affected trees were located in Edges (45.7%) compared to Middle (27.5%) or Core areas of retention patches (26.8%). The tree size (37.7% with <40 cm, 39.7% with 40–60 cm, and 22.5% with >60 cm DBH), development stage (25.6% <140 years old, 56.7% 140–220 years old, and 17.7% >220 years old) and canopy layer (6.9% suppressed, 23.4% intermediate, 43.4% codominant, and 26.2% dominant) are not greatly influenced by blowdown. These average values of blowdown trees are similar to those measured in primary forests (PF).
Blowdown monitoring (2002–2023) showed that damages in retention patches occurred most of the years (>20 years after harvesting) but presented significant differences among the years and between VRH treatments (Figure 3 and Table A2). When retention patches were alone (AR-CC, retention patches, and clear-cuts), the blowdown BA was ×1.87 greater compared to combined VRH types (AR-DR, retention patches, and dispersed retention). Greater damages were measured in the first years after harvesting (37.1% AR-CC and 33.5% AR-DR) and during one windstorm event in 2015–2016, where 14.6% (AR-CC) and 9.7% (AR-DR) of blowdown BA occurred (significant differences were detected in AR-CC but not in AR-DR).

3.2. Remnant Overstory and Stand Conditions after the Windstorm Event at Rivadavia Ranch

Harvesting and wind damage had an influence on the overstory remnant canopy (Table 1) and over-transmitted solar radiation (quantity and quality) according to retention patches and distance across the transects (inside and outside the retention patches). In the control plots (PF), variables related to crown cover and leaf area index (CC, LAI) were higher, and variables related to light levels (DIR, DIF, TR) were lower than in harvested areas (inside or outside the retention patches). Site quality of the studied areas did not present significant differences, showing a homogeneous forest landscape (22.7 to 23.7 m DH); however, they are slightly higher than control forests (21.4 m DH). Crown cover and leaf area index were maximum in core areas of retention patches, while transmitted solar radiation reached the minimum levels. These trends decreased (CC, LAI) or increased (DIR, DIF, TR) across the studied gradient from inside (0–50 m) to outside (50–150 m) retention patches. Despite the heavy storm damage, the overstory maintained 47% crown cover and 66% transmitted solar radiation. Crown cover and LAI decreased in N and W compared to E and S aspects, and contrary, they increased the transmitted solar radiation (Table 1). Additionally, direct transmitted solar radiation was significantly higher at N aspects. In the same way, the aspect was not influenced by understory and forest ground cover, as well as coarse-woody debris (Table 2), where retention patches were influenced by these variables. Inside retention patches, bare soil was greater, and coarse-woody debris cover was minimal. These values changed the trend from inside to outside retention patches. Coarse-woody debris volume did not present significant differences inside and outside retention patches and was not related to remnant overstory cover or harvesting areas. The variables measured in the control plots (PF) were similar to those measured in core areas of retention patches and presented significant differences from the harvested areas, allowing us to determine the impact level of the studied windstorm event.

3.3. Remnant Overstory after Harvesting Compared to Original and Impacted Forest Structure at Rivadavia Ranch

The control stands (PF) contained larger mature trees (388 ind ha−1 and 45.6 cm DBH), reaching 67.9 m2 ha−1 BA and 743.9 m3 ha−1 TV, where 89.9% of the original trees were alive (7.4% dead and 2.7% blowdown) (Table A3 and Table A4). These damages represent 5.3% BA and TV of control stand values. In the harvested areas, the original forest structure of S aspect transects showed significantly smaller trees (45.7 cm) compared to N (56.8 cm), but no differences were found after harvesting and the windstorm event (Table A3). The comparisons between inside and outside retention patches showed significant differences in the original DBH and tree density, decreasing in number and increasing in size from core to distant areas located in the dispersed retention. After harvesting, the DBH of remnant trees slightly decreased, showing that target trees during the cutting were not associated with tree size (Table A3). However, retention patches lost more trees (0–50 m) compared to control forests (PF), where 76.1%–80.7% survived, 10.9%–15.7% were dead, and 3.5%–12.9% were blown down. In harvested areas (50–150 m), 39.3%–45.1% of the original trees were cut, and 28.0%–37.8% were affected by the wind, which was slightly greater far away from the retention patches influence (28.0%–35.7% close to retention patches compared to 37.7%–37.8% in faraway areas in the dispersed retention). The final number of remnant trees in harvested areas reaching 19.8%–22.7% of the original trees were found close to retention patches, and 15.1%–19.0% in faraway areas of dispersed retention (Table A3). The impact of harvesting over BA and TV varied between 29.6% and 43.3%, while wind affected between 22.6% and 42.6% of them (Table A4). The windstorm greatly affected the edges of retention patches (16.2% of BA and TV at 25–50 m) compared to core areas (4.1% of BA and TV at 0–25 m). In consequence, BA and TV of remnant overstory decreased from core areas of retention patches to faraway harvested areas in the dispersed retention (86.0% to 16.3%–26.5%) (Table A4).

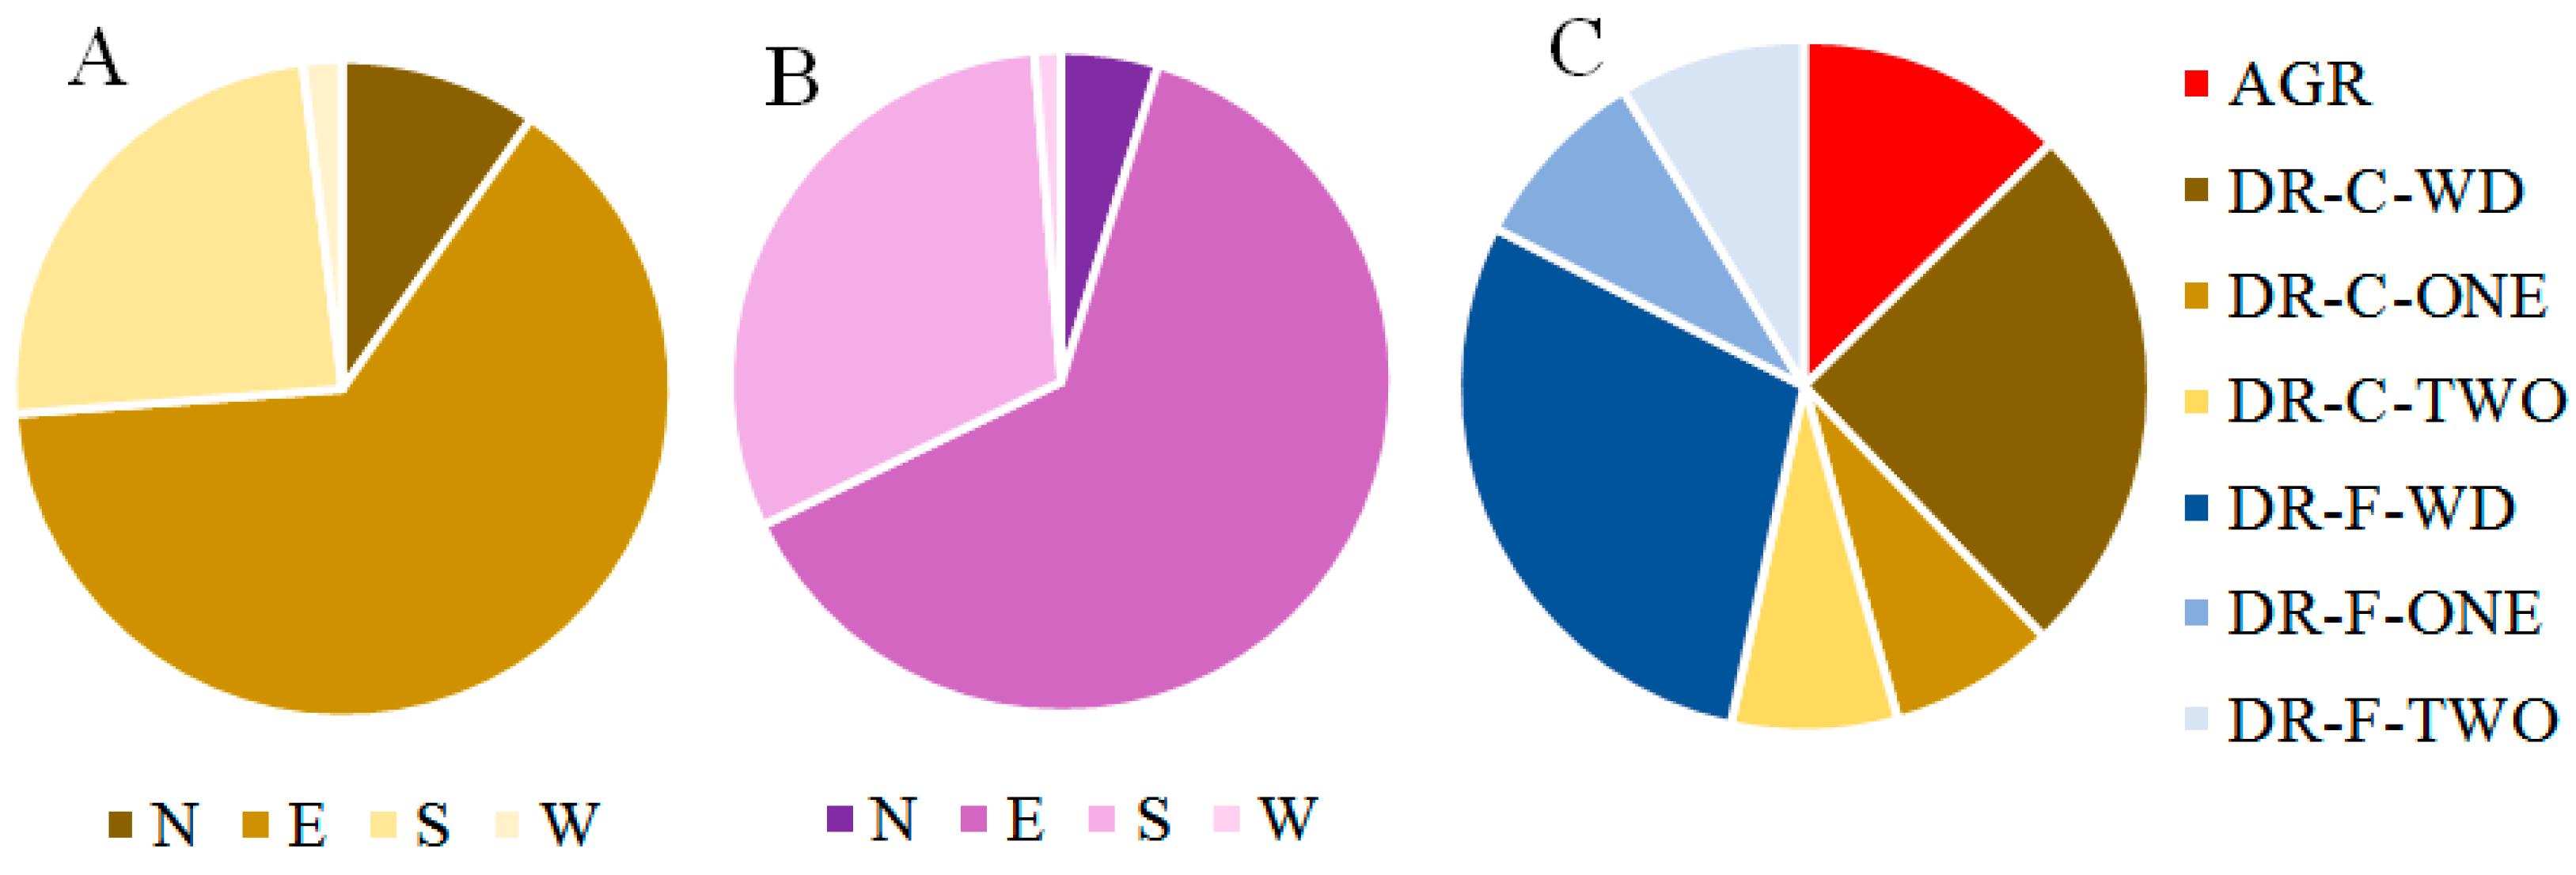
3.4. The Impact of the Windstorm and Harvesting over the Remnant Overstory at Rivadavia Ranch

The windstorm occurred during the morning and afternoon of 26 October 2023, and the event was detected across the entire Tierra del Fuego Island (32 km N at El Roble Ranch and 31 km SW at Lenga Patagonia S.A.) (Figure 4). On average, the windstorm presented wind speeds ×1.9 higher than those during the previous and following days and ×1.7 higher when considering the wind gusts. In the study area, most of the trees fell facing the E quadrant (64.1% of affected trees and 63.1% of damaged BA), followed by the S quadrant (24.3% of affected trees and 30.8% of damaged BA) (Figure 5A,B). The dominant winds during the studied event are coming from SW (44.1%), followed by S direction (27.9%), compared to the average values of yearly winds (greater directions were from SW 29.9%, W 16.7%, and NE 15.4% for 2023) (Figure 6). Most of the tree falls occurred in the dispersed retention (87.4%) compared to retention patches (12.6%), as was described before across the studied gradients (Figure 5C). Little differences were observed between blowdown trees under the influence of retention patches (46.7% of affected trees) and trees located far away in the dispersed retention (53.3%). Damaged trees during harvesting, both due to machine operations and extraction path constructions, represented 37.5%–38.1% of blowdown in the dispersed retention, and cumulative damages (e.g., machine operation damages and influence of extraction paths) were not an influential factor to explain the amount of the impact after the windstorm event.

4. Discussion

Trees growing in primary forests receive negative and positive synergies across the natural gradients that are influenced by the stability and survival confronting windstorms [3,42,43]. Negative synergies can be related to interspecific competition of trees for resources that can influence overgrowth and tree architecture [44,45,46], while positive synergies can be related to better stability at stand level (e.g., unevenly aged stands are less susceptible to blowdown) [47,48]. Dominant trees are the key to many positive synergies, e.g., offering greater resilience confronting windstorms and shelter for the trees growing at suppressed crown classes [49,50]. Nothofagus pumilio forests are one of the southernmost forest types of the world (−35° to −56° SL), occurring across Andean mountains in Patagonia (Argentina and Chile) [38]. Forest recovery after impacts was through natural regeneration [36], and generated even and uneven stands depending on the natural factors involved in the natural dynamics, including blowdown damage (windthrow and windsnap) that could generate from gaps to the total renovation of the trees in the affected stands [11]. Harvesting in N. pumilio forests reduces the number of trees in managed stands and opens the canopy to stimulate natural regeneration [22,38]. Usually, the remnant trees were selected according to their ecological values (e.g., mature trees with large healthy canopies) [5,7], but trying to leave a lower number of timber trees to increase the harvesting incomes according to management objectives [19]. Moreover, trees growing in primary forests (BA > 60 m2 ha−1) presented a worse diameter/height ratio than trees growing in intensively managed stands (BA < 20 m2 ha−1) [51]. Trees that grow with periodic thinning generate greater resilience to wind damage due to an increased diameter of the crown over time [52]. In the same way, trees that grow in areas with greater wind exposure (e.g., edge forests) receive more impacts over time but recover after successive damages and, consequently, increase their resilience in confronting future catastrophic events [26,28,29,32]. Our study included one specific windstorm event, and we did not have the chance to compare the impact of other influential factors (e.g., duration of the storms) on the forest structure [4,13,18]. For this, it is necessary to consider the outputs in the context of the studied event (see Figure 4), which can change in magnitude according to other windstorm events. The resilience of the forests to face blowdown can also change according to the previous history of impacts, both of natural and anthropic origin [10].
The forest structure of the measured stands before harvesting and blowdown damages presented few differences in our samplings at Rivadavia Ranch, e.g., S aspects presented smaller DBH as well as areas close to natural edges (e.g., forests and open lands) but without differences in occupancy levels (e.g., TD, BA or TV). Probably, blowdown was more frequent (shorter return intervals) in those areas with lower DBH, being influenced by the survival rates of trees. Rebertus et al. [11] define discrete blowdown patches (0.1 to >100 ha) in N. pumilio forests of Tierra del Fuego, covering two-thirds of the study area, where tree age ranged from 19 to nearly 200 years. They measured a return interval for blowdown events of 145 years (range of 103–218 years), and based on treefall size distributions, they determined that most of the stands were blown down over the past 100 years (DBH between 20 and 32 cm). In our study, harvesting decreases the forest structure values according to the silvicultural prescriptions (e.g., reducing to 29.6% of original BA), which were more conservative values than those informed in the literature (40%–50% BA) [7,19,23,38]. These cuts homogenize the managed areas; however, the inclusion of retention patches allowed us to maintain some of the original heterogeneity of the stands [20,53]. Most of the stand characteristics were maintained without modifications; however, harvesting increased coarse-woody debris cover outside the retention patches. Many studies analyzed the accumulation of coarse-woody debris in VRH stands and described the importance of connectivity for biodiversity conservation [54,55], which greatly increased after blowdown events [56].
Windstorms affected the remnant trees, especially in the dispersed retention areas, as was described before [52]. For many of the studied parameters, we observed a gradient from core retention patches in faraway harvested areas. The differences in the forest structure and abiotic conditions between retention patches and harvested areas were previously described and were greatly influenced by natural cycles, regeneration, and biodiversity conservation [7,8,9]. The aspect of the retention patches presenting a marginal influence on the combined effects of harvesting + blowdown, e.g., damages were greater in N–W aspects (lower CC influence over radiation types and levels) but did not present significant differences in most of the studied variables. In the long-term plot at San Justo Ranch, blowdown occurred more frequently in the contrary areas of the dominant winds; e.g., trees were more affected in the E–NE quadrant, while dominant winds came from SW–W. This can be explained by a suction effect generated when wind passes over the forest edge, and due to this phenomenon, generates greater turbulence [32,33]. However, not only were the edge trees (45.7%) blown down, but the trees inside retention patches were also impacted, including different ages and canopy layers. Many studies describe the mechanisms of wind affecting the edge trees [13,28,57], but it is not clear why the trees are also affected in the core areas.
Most of the studies analyzed the recovery of forests after one specific blowdown event [58,59], while others described the influence of successive wind-related impacts on tree architecture [28,32]. Many researchers used dendrochronological data to determine the blowdown events, with evident limitations in the potential descriptions and inferences about the changes in forest structure dynamics [3]. Furthermore, very few papers have analyzed the role of blowdown events in long-term forest dynamics, affecting biomass allocation and other related ecosystem functions [60,61]. In fact, very late-successional or old-growth natural forests, over decadal scales, remain debated, largely because of the absence of long-term data sets [62,63].
There are differences in the dynamics between managed stands and primary forests. The primary forests presented different trajectories depending on the forest species, forest types, and landscapes [3,11], while managed forests depend on the remnant overstory (e.g., the number and design of the retention patches) [20,64]. The long-term stability of the retention patches is one of the keys to the success of this silvicultural prescription [65]. The long-term monitoring at San Justo Ranch showed that a combination of retention types (aggregated and dispersed) increased the stability of the whole stand compared to retention patches alone (AR-CC) [28,66]. However, a high inter-annual variability exists, especially in those treatments with lower legacies (e.g., blowdown magnitude was greater in AR-CC during most of the years compared to AR-DR). Finally, one of our hypotheses defined that trees with damages due to harvesting are more susceptible to blowdown during windstorms. However, our results did not show clear relationships between damage types or combinations of harvesting damages (e.g., skidders or closeness to extraction roads). Harvesting operations damage the root systems of retention trees and often, the logs hit the bases of the trees. Many papers describe the influence of harvesting on tree stability [28,67], which can influence long-term survival (e.g., facilitating the entrance of pests and diseases) [68]; however, we have not found that the harvesting impacts modified the damage to the windstorm, but with this research, we cannot evaluate the effect on the medium- and long-term dynamics.

5. Conclusions

Windthrow management should take place within a framework of general risk management, where the potential impacts of wind damage must be considered. The variability in blowdown patterns can be better understood if stand stability is evaluated in terms of acclimatized response growth, e.g., harvesting left the remnant trees in a great vulnerability confronting wind damage. Variable retention harvesting increases the heterogeneity in harvested areas, where retention patches present greater resilience for extreme events and the long-term effects of recurrent wind exposure. Our study showed a marginal influence of the aspect in the damage of the trees growing in the retention patches and dispersed retention despite the dominant winds and previous damage received during harvesting operations. However, the tree stability in the long-term was related to the location inside the retention patches, and also, blowdown was greater during the first years after harvesting and continuing in the long-term to be influenced by legacies left in the managed stands (e.g., retention patches). Multidisciplinary studies at tree, stand, and landscape scales must be deeply analyzed, which can improve our collective understanding of the dynamics of Southern Patagonian forests. In this context, the impact of a blowdown must be monitored after harvesting to include new insights into the decision-making of management and conservation plans, e.g., economic losses and conservation values.

Author Contributions

Conceptualization, G.M.P. and J.M.C.; methodology, G.M.P. and J.R.-S.; software, J.R.-S.; validation, L.B. and S.F.; formal analysis, G.M.P., J.M.C. and J.R.-S.; investigation, G.M.P. and J.M.C.; resources, S.F.; data curation, S.F.; writing—original draft preparation, G.M.P.; writing—review and editing, J.M.C., J.R.-S., L.B. and S.F.; visualization, G.M.P.; supervision, G.M.P.; project administration, G.M.P. and S.F.; funding acquisition, G.M.P. All authors have read and agreed to the published version of the manuscript.

Funding

This research was funded by the grant PDTS-0398 (2020–2023) “Manejo sostenible de los bosques de Nothofagus y ambientes naturales de Tierra del Fuego: Compatibilizando la producción y la conservación de la biodiversidad” supported by MINCyT (Argentina).

Data Availability Statement

Data are available in the CADIC CONICET repository and can be requested by the authors for further analyses.

Acknowledgments

To the researchers, technicians, students, and landowners (ranch and sawmill companies) that supported this research, without which it would have been impossible to obtain the valuable information used in this work.

Conflicts of Interest

The authors declare no conflicts of interest.

Appendix A

Table A1. Acronyms and references of the measured variables during the samplings.
AcronymVariableUnitReference
AR-CCretention patches and clear-cuts--[7]
AR-DRretention patches and dispersed retention--[7]
BAbasal aream2 ha−1[40]
BSbare soil%[41]
CCcanopy cover%[5]
DBHdiameter at breast heightcm[40]
DEBcoarse-woody debris%[41]
DHdominant heightm[39]
DICOdicot plants%[41]
DIFtransmitted diffuse solar radiation %[5]
DIRtransmitted direct solar radiation %[5]
DSTdiameter of the stump at 30 cm height with bark cm[38]
INFnon-vascular plants%[41]
LAIrelative leaf area index --[5]
MONOmonocot plants%[41]
REGtree regeneration%[41]
TDtree densityn ha−1[40]
TRtransmitted total solar radiation %[5]
TREEoverstory trees%[41]
TVtotal over-bark volume m3 ha−1[39,40]
VDEBvolume of coarse-woody debris%[37]
VRHvariable retention harvesting--[7]
Table A2. One-way ANOVAs of yearly (2002–2023) blowdown basal area (BA) inside the retention patches (m2 at each patch) occurred at two different variable retention designs (AR-CC = aggregates and clear-cuts; AR-DR = aggregates and dispersed retention) at San Justo Ranch. F = Fisher test; p = probability. Means are shown in Figure 3.
YearFpTreatmentFp
20020.950.344AR-CC3.75<0.001
20030.670.422AR-DR2.370.001
20040.130.719
20051.310.267
20060.560.465
20070.050.820
20080.270.609
20090.090.767
20100.650.429
20111.770.199
20120.820.378
20131.440.246
20141.840.192
20153.520.077
20160.710.409
2017----
20181.730.205
20190.020.896
20201.290.272
20212.380.140
20220.650.429
20231.130.301
Table A3. Two-way ANOVAs of changes in tree diameter and density considering (A) aspect (N, E, S, W) and (B) distance (0–25 m core areas inside retention patches, 25–50 m edge areas inside retention patches, 50–150 m dispersed retention in harvested areas) as main factors at Rivadavia Ranch. DBH-O = tree diameter of the original forests (cm); DBH-H = tree diameter of the harvested trees (cm); TD-O = tree density of the original forests (n ha−1); TD-R = density of remnant trees (% TD-O); TD-D = density of standing dead trees (% TD-O); TD-W = density of windthrow trees (% TD-O); and TD-H = density of harvested trees (% TD-O). Control (PF = primary forests) was presented as mean and standard deviation (SD).
TreatmentLevelDBH-ODBH-HTD-OTD-RTD-DTD-WTD-H
PFmean45.6--388.089.97.42.7--
SD(9.5)--(167.7)(11.7)(9.8)(4.5)--
A: AspectN56.8 b45.724735.06.330.128.6
E50.2 ab52.836938.010.122.729.2
S45.7 a47.835340.58.527.024.0
W52.0 ab51.624242.22.624.031.1
F3.921.723.410.371.470.510.38
(p)(0.014)(0.188)(0.024)(0.777)(0.233)(0.675)(0.770)
B: Distance0–2542.9 a--490 b80.7 b15.73.5 a0.0 a
25–5051.4 ab--350 ab76.1 b10.912.9 ab0.0 a
50–7554.7 b52.2240 a19.8 a4.435.7 bc40.1 b
75–10053.9 ab48.6230 a22.7 a4.228.0 bc45.1 b
100–12554.2 ab49.8243 a15.1 a2.337.8 c44.8 b
125–15049.9 ab47.4263 a19.0 a3.937.7 c39.3 b
F2.520.735.1223.852.596.6413.20
(p)(0.042)(0.541)(0.001)(<0.001)(0.037)(<0.001)(<0.001)
A × BF1.961.492.111.141.281.381.33
(p)(0.040)(0.204)(0.026)(0.348)(0.251)(0.195)(0.223)
F = Fisher test; (p) = probability. Different letters indicate significant differences using the Tukey test at p < 0.05.
Table A4. Two-way ANOVAs of changes in basal area and total over-bark volume of the stands considering (A) aspect (N, E, S, W) and (B) distance (0–25 m core areas inside retention patches, 25–50 m edge areas inside retention patches, 50–150 m dispersed retention in harvested areas) as main factors at Rivadavia Ranch. BA-O = basal area of the original forests (m2 ha−1); BA-R = basal area of remnant trees (% BA-O); BA-D = basal area of standing dead trees (% BA-O), BA-W = basal area of windthrow trees (% BA-O); BA-H = basal area of harvested trees (% BA-O), TV-O = total over-bark volume of the original forests (m3 ha−1); TV-R = total over-bark volume of remnant trees (% TV-O); TV-D = total over-bark volume of standing dead trees (% TV-O); TV-W = total over-bark volume of windthrow trees (% TV-O), and TV-H = total over-bark volume of harvested trees (% TV-O). Control (PF = primary forests) was presented as mean and standard deviation (SD).
TreatmentLevelBA-OBA-RBA-DBA-WBA-HTV-OTV-RTV-DTV-WTV-H
PFmean67.994.62.42.9--743.994.72.42.9--
SD(22.7)(8.4)(4.8)(6.4)--243.9(8.4)(4.7)(6.5)--
A: AspectN61.637.67.634.320.5759.737.67.534.420.4
E65.147.16.321.924.7786.747.36.221.924.6
S57.044.06.626.822.6671.544.06.626.822.5
W57.146.32.521.429.7694.446.42.521.429.7
F0.630.510.851.170.620.740.520.841.170.63
(p)(0.600)(0.674)(0.473)(0.331)(0.602)(0.531)(0.674)(0.477)(0.331)(0.597)
B: Distance0–2570.086.0 b9.94.1 a0.0 a843.685.9 b9.94.1 a0.0 a
25–5064.175.9 b7.916.2 ab0.0 a770.175.9 b7.816.2 ab0.0 a
50–7560.326.2 a7.832.2 ab33.9 b726.226.3 a7.832.1 ab33.7 b
75–10056.331.7 a2.222.7 ab43.3 b688.831.9 a2.222.6 ab43.3 b
100–12550.316.3 a1.942.5 b39.2 b606.116.4 a2.042.6 b39.1 b
125–15060.326.5 a4.539.1 b29.9 b733.726.6 a4.539.3 b29.6 b
F1.2515.851.274.6610.101.0715.661.244.6310.01
(p)(0.299)(<0.001)(0.294)(0.002)(<0.001)(0.388)(<0.001)(0.305)(0.001)(<0.001)
A × BF1.641.121.661.371.151.501.121.661.371.15
(p)(0.098)(0.368)(0.094)(0.199)(0.338)(0.142)(0.369)(0.094)(0.200)(0.342)
F = Fisher test; (p) = probability. Different letters indicate significant differences using the Tukey test at p < 0.05.

References

  1. Mitchell, S.J. Wind as a natural disturbance agent in forests: A synthesis. Forestry 2013, 86, 147–157. [Google Scholar] [CrossRef]
  2. Rebertus, A.J.; Veblen, T. Structure and tree-fall gap dynamics of old-growth Nothofagus forests in Tierra del Fuego, Argentina. J. Veg. Sci. 1993, 4, 641–654. [Google Scholar] [CrossRef]
  3. Amoroso, M.M.; Blazina, A.P. Disturbance history and dynamics of an old-growth Nothofagus forest in Southern Patagonia. Forests 2020, 11, e101. [Google Scholar] [CrossRef]
  4. Mitchell, S.J.; Ruel, J.C. Modeling windthrow at stand and landscape scales. In Simulation Modeling of Forest Landscape Disturbances; Perera, A., Sturtevant, B., Buse, L., Eds.; Springer: Cham, Switzerland, 2015; pp. 17–43. [Google Scholar] [CrossRef]
  5. Caldentey, J.; Mayer, H.; Ibarra, M.; Promis, A. The effects of a regeneration felling on photosynthetic photon flux density and regeneration growth in a Nothofagus pumilio forest. Eur. J. Forest Res. 2009, 128, 75–84. [Google Scholar] [CrossRef]
  6. Zubizarreta-Gerendiain, A.; Pukkala, T.; Peltola, H. Effects of wind damage on the optimal management of boreal forests under current and changing climatic conditions. Can. J. For. Res. 2017, 472, 246–256. [Google Scholar] [CrossRef]
  7. Martínez Pastur, G.; Rosas, Y.M.; Toro Manríquez, M.; Huertas Herrera, A.; Miller, J.; Cellini, J.M.; Barrera, M.D.; Peri, P.L.; Lencinas, M.V. Knowledge arising from long-term research of variable retention harvesting in Tierra del Fuego: Where do we go from here? Ecol. Process. 2019, 8, e24. [Google Scholar] [CrossRef]
  8. Soler, R.; Schindler, S.; Lencinas, M.V.; Peri, P.L.; Martínez Pastur, G. Retention forestry in southern Patagonia: Multiple environmental impacts and their temporal trends. Int. For. Rev. 2015, 17, 231–243. [Google Scholar] [CrossRef]
  9. Vergara, P.M.; Schlatter, R.P. Aggregate retention in two Tierra del Fuego Nothofagus forests: Short-term effects on bird abundance. For. Ecol. Manag. 2006, 225, 213–224. [Google Scholar] [CrossRef]
  10. Peri, P.L.; Rosas, Y.M.; López, D.; Lencinas, M.V.; Cavallero, L.; Martínez Pastur, G. Conceptual framework to define management strategies for silvopastoral systems in native forests. Ecol. Aust. 2022, 32, 749–766. [Google Scholar] [CrossRef]
  11. Rebertus, A.J.; Kitzberger, T.; Veblen, T.; Roovers, L.M. Blowdown history and landscape patterns in the Andes of Tierra del Fuego, Argentina. Ecology 1997, 78, 678–692. [Google Scholar] [CrossRef]
  12. Salas-Eljatib, C. An approach to quantify climate-productivity relationships: An example from a widespread Nothofagus forest. Ecol. Appl. 2021, 31, e2285. [Google Scholar] [CrossRef] [PubMed]
  13. Quine, C.P.; Gardiner, B.A.; Moore, J. Wind disturbance in forests: The process of wind created gaps, tree overturning, and stem breakage. In Plant Disturbance Ecology: The Process and the Response; Johnson, E.A., Miyanishi, K., Eds.; Academic Press: New York, NY, USA, 2020; pp. 117–184. [Google Scholar] [CrossRef]
  14. Coates, K.D.; Lilles, E.B.; Dhar, A.; Hall, E.C. Wind damage over 21 years across different levels of tree removal in natural-origin mixed forests of northwestern British Columbia. Can. J. For. Res. 2020, 50, 946–952. [Google Scholar] [CrossRef]
  15. Pukkala, T.; Laiho, O.; Lähde, E. Continuous cover management reduces wind damage. For. Ecol. Manag. 2016, 372, 120–127. [Google Scholar] [CrossRef]
  16. Magagnotti, N.; Picchi, G.; Spinelli, R. A versatile machine system for salvaging small-scale forest windthrow. Biosyst. Eng. 2013, 115, 381–388. [Google Scholar] [CrossRef]
  17. Franklin, J.F.; Berg, D.R.; Thornburgh, D.A.; Tappeiner, J.C. Alternative silvicultural approaches to timber harvesting: Variable retention harvest systems. In Creating a Forestry for the 21st Century; Kohm, K.A., Franklin, J.F., Eds.; Island Press: Washington, DC, USA, 1997; pp. 111–140. [Google Scholar]
  18. Halpern, C.B.; McKenzie, D. Disturbance and post-harvest ground conditions in a structural retention experiment. For. Ecol. Manag. 2001, 154, 215–225. [Google Scholar] [CrossRef]
  19. Costa, S.; Ibanez, L. Can wood storage be profitable? French experience after the windstorms in 1999. J. For. Econ. 2005, 11, 161–176. [Google Scholar] [CrossRef]
  20. Beese, W.J.; Rollerson, T.P.; Peters, C.M. Quantifying wind damage associated with variable retention harvesting in coastal British Columbia. For. Ecol. Manag. 2019, 443, 117–131. [Google Scholar] [CrossRef]
  21. Man, R.; Rice, M. Trembling aspen stand response 15 years after windthrow, salvage harvesting, and forest renewal. Forests 2022, 13, e843. [Google Scholar] [CrossRef]
  22. Rosenfeld, J.M.; Navarro Cerrillo, R.; Guzman Alvarez, J.R. Regeneration of Nothofagus pumilio (Poepp et. Endl.) Krasser forests after five years of seed tree cutting. J. Environ. Manag. 2006, 78, 44–51. [Google Scholar] [CrossRef]
  23. Rodríguez Souilla, J.; Cellini, J.M.; Roig, F.A.; Lencinas, M.V.; Chaves, J.E.; Aravena Acuña, M.C.; Peri, P.L.; Martínez Pastur, G. Variable retention harvesting and climate variations influence over natural regeneration dynamics in Nothofagus pumilio forests of Southern Patagonia. For. Ecol. Manag. 2023, 544, e121221. [Google Scholar] [CrossRef]
  24. Mattera, M.G.; Pastorino, M.J.; Lantschner, M.V.; Marchelli, P.; Soliani, C. Genetic diversity and population structure in Nothofagus pumilio, a foundation species of Patagonian forests: Defining priority conservation areas and management. Sci. Rep. 2020, 10, e19231. [Google Scholar] [CrossRef]
  25. Marchelli, P.; Gallo, L.A. Annual and geographic variation in seed traits of Argentinean populations of southern beech Nothofagus nervosa (Phil.) Dim. et Mil. For. Ecol. Manag. 1999, 121, 239–250. [Google Scholar] [CrossRef]
  26. Ataíde, G.M.; Castro, R.V.; Correia, A.C.; dos Reis, G.G.; Reis, M.G.; Rosado, A.M. Interação árvores e ventos: Aspectos ecofisiológicos e silviculturais. Cienc. Florest. 2015, 25, 523–536. [Google Scholar] [CrossRef]
  27. Konôpka, B.; Zach, P.; Kulfan, J. Wind: An important ecological factor and destructive agent in forests. Forestry 2016, 62, 123–130. [Google Scholar] [CrossRef]
  28. Gardiner, B. Wind damage to forests and trees: A review with an emphasis on planted and managed forests. J. For. Res. 2021, 26, 248–266. [Google Scholar] [CrossRef]
  29. Finnigan, J.J.; Brunet, Y. Turbulent airflow in forest on flat and hilly terrain. In Wind and Trees; Coutts, M.P., Grace, J., Eds.; Cambridge University Press: Cambridge, UK, 1995; pp. 3–40. [Google Scholar]
  30. Gardiner, B.A.; Stacey, G.R.; Belcher, R.E.; Wood, C.J. Field and wind-tunnel assessment of the implications of respacing and thinning on tree stability. Forestry 1997, 70, 233–252. [Google Scholar] [CrossRef]
  31. Hannah, P.; Palutikof, J.P.; Quine, C.P. Predicting wind speeds for forest areas in complex terrain. In Wind and Trees; Coutts, M.P., Grace, J., Eds.; Cambridge University Press: Cambridge, UK, 1995; pp. 113–132. [Google Scholar]
  32. Zhu, J.; Liu, Z.; Li, X.; Matsuzaki, T.; Gonda, Y. Review: Effects of wind on trees. J. For. Res. 2004, 15, 153–160. [Google Scholar] [CrossRef]
  33. Gardiner, B.; Berry, P.; Moulia, B. Review: Wind impacts on plant growth, mechanics and damage. Plant Sci. 2016, 245, 94–118. [Google Scholar] [CrossRef] [PubMed]
  34. Romagnoli, F.; Cadei, A.; Costa, M.; Marangon, D.; Pellegrini, G.; Nardi, D.; Masiero, M.; Secco, L.; Grigolato, S.; Lingua, E.; et al. Windstorm impacts on European forest-related systems: An interdisciplinary perspective. For. Ecol. Manag. 2023, 541, e121048. [Google Scholar] [CrossRef]
  35. Peri, P.L.; Lencinas, M.V.; Bousson, J.; Lasagno, R.; Soler, R.; Bahamonde, H.A.; Martínez Pastur, G. Biodiversity and ecological long-term plots in southern Patagonia to support sustainable land management: The case of PEBANPA network. J. Nat. Conserv. 2016, 34, 51–64. [Google Scholar] [CrossRef]
  36. Martínez Pastur, G.; Lencinas, M.V.; Cellini, J.M.; Peri, P.L.; Soler, R. Timber management with variable retention in Nothofagus pumilio forests of Southern Patagonia. For. Ecol. Manag. 2009, 258, 436–443. [Google Scholar] [CrossRef]
  37. Martínez Pastur, G.; Rosas, Y.M.; Chaves, J.E.; Cellini, J.M.; Barrera, M.D.; Favoretti, S.; Lencinas, M.V.; Peri, P.L. Changes in forest structure values along the natural cycle and different management strategies in Nothofagus antarctica forests. For. Ecol. Manag. 2021, 486, e118973. [Google Scholar] [CrossRef]
  38. Fajardo, A.; Moreno-Meynard, P.; Soto, D. Forest stand dynamics of a short-stature tree species: Ecological knowledge for sustainable forest management. J. Appl. Ecol. 2024, 61, 1500–1507. [Google Scholar] [CrossRef]
  39. Martínez Pastur, G.; Peri, P.L.; Vukasovic, R.; Vaccaro, S.; Piriz Carrillo, V. Site index equation for Nothofagus pumilio Patagonian forest. Phyton 1997, 6, 55–60. [Google Scholar]
  40. Martínez Pastur, G.; Lencinas, M.V.; Cellini, J.M.; Diaz, B.; Peri, P.L.; Vukasovic, R. Herramientas disponibles para la construcción de un modelo de producción para la lenga (Nothofagus pumilio) bajo manejo en un gradiente de calidad de sitio. Bosque 2002, 23, 69–80. [Google Scholar] [CrossRef]
  41. Levy, E.G.; Madden, E.A. The point method of pasture analyses. N. Z. J. Agric. 1933, 46, 267–379. [Google Scholar]
  42. Bauhus, J.; Forrester, D.I.; Gardiner, B.; Jactel, H.; Vallejo, R.; Pretzsch, H. Ecological stability of mixed-species forests. In Mixed-Species Forests; Pretzsch, H., Forrester, D., Bauhus, J., Eds.; Springer: Berlin, Germany, 2017. [Google Scholar] [CrossRef]
  43. Vergani, C.; Giadrossich, F.; Buckley, P.; Conedera, M.; Pividori, M.; Salbitano, F.; Rauch, H.; Lovreglio, R.; Schwarz, M. Root reinforcement dynamics of European coppice woodlands and their effect on shallow landslides: A review. Earth-Sci. Rev. 2017, 167, 88–102. [Google Scholar] [CrossRef]
  44. Ferrio, J.P.; Shestakova, T.A.; del Castillo, J.; Voltas, J. Oak competition dominates interspecific interactions in growth and water-use efficiency in a mixed pine-oak Mediterranean forest. Forests 2021, 12, e1093. [Google Scholar] [CrossRef]
  45. Pretzsch, H. Facilitation and competition reduction in tree species mixtures in Central Europe: Consequences for growth modeling and forest management. Ecol. Model. 2022, 464, e109812. [Google Scholar] [CrossRef]
  46. Serrano-León, H.; Nitschke, R.; Scherer-Lorenzen, M.; Forrester, D. Intra-specific leaf trait variability of F. sylvatica, Q. petraea and P. abies in response to inter-specific competition and implications for forest functioning. Tree Physiol. 2022, 42, 253–272. [Google Scholar] [CrossRef]
  47. Kern, C.; Waskiewicz, J.; Frelich, L.; Muñoz Delgado, B.; Kenefic, L.; Clark, K.; Kabrick, J. Understanding compositional stability in mixedwood forests of eastern North America. Can. J. For. Res. 2021, 51, 897–909. [Google Scholar] [CrossRef]
  48. Maher Hasselquist, E.; Kuglerová, L.; Sjögren, J.; Hjältén, J.; Ring, E.; Sponseller, R.; Andersson, E.; Lundström, J.; Mancheva, I.; Nordin, A.; et al. Moving towards multi-layered, mixed-species forests in riparian buffers will enhance their long-term function in boreal landscapes. For. Ecol. Manag. 2021, 493, e119254. [Google Scholar] [CrossRef]
  49. Churchill, D.; Larson, A.; Dahlgreen, M.; Franklin, J.F.; Hessburg, P.; Lutz, J. Restoring forest resilience: From reference spatial patterns to silvicultural prescriptions and monitoring. For. Ecol. Manag. 2013, 291, 442–457. [Google Scholar] [CrossRef]
  50. Halpin, C.R.; Lorimer, C.G. Trajectories and resilience of stand structure in response to variable disturbance severities in northern hardwoods. For. Ecol. Manag. 2016, 365, 69–82. [Google Scholar] [CrossRef]
  51. Pollmann, W.; Veblen, T.T. Nothofagus regeneration dynamics in south-central chile: A test of a general model. Ecol. Mon. 2004, 74, 615–634. [Google Scholar] [CrossRef]
  52. Rodríguez Souilla, J.; Lencinas, M.V.; Cellini, J.M.; Chaves, J.E.; Roig, F.A.; Peri, P.L.; Martínez Pastur, G. Seed fall and leaf litter relationships in Nothofagus pumilio forests: Changes according to retention levels and years after harvesting. Trees 2023, 37, 583–597. [Google Scholar] [CrossRef]
  53. Curzon, M.T.; Kern, C.; Baker, S.; Palik, B.; D’Amato, A. Retention forestry influences understory diversity and functional identity. Ecol. Appl. 2020, 30, e2097. [Google Scholar] [CrossRef] [PubMed]
  54. Morrissey, R.C.; Jenkins, M.; Saunders, M. Accumulation and connectivity of coarse woody debris in partial harvest and unmanaged relict forests. PLoS ONE 2014, 9, e113323. [Google Scholar] [CrossRef] [PubMed]
  55. Hämäläinen, A.; Hujo, M.; Heikkala, O.; Junninen, K.; Kouki, J. Retention tree characteristics have major influence on the post-harvest tree mortality and availability of coarse woody debris in clear-cut areas. For. Ecol. Manag. 2016, 369, 66–73. [Google Scholar] [CrossRef]
  56. Woodall, C.W.; Nagel, L.M. Downed woody fuel loading dynamics of a large-scale blowdown in northern Minnesota, USA. For. Ecol. Manag. 2007, 247, 194–199. [Google Scholar] [CrossRef]
  57. Yang, B.; Shaw, R.H.; Paw, U.K. Wind loading on trees across a forest edge: A large eddy simulation. Agric. For. Meteor. 2006, 141, 133–146. [Google Scholar] [CrossRef]
  58. Wohl, E. Logjam fluctuations during the decade after a major blowdown along a mountain stream in the US Southern Rockies. Earth Sur. Proc. Landf. 2022, 47, 699–705. [Google Scholar] [CrossRef]
  59. Bosley-Smith, C.; Fraver, S.; D’Amato, A.W.; Rogers, N.; Tabak, N.; Wason, J. The natural ‘exclosure effect’ and tree regeneration following post-windstorm salvage logging. J. Appl. Ecol. 2024, 61, 260–270. [Google Scholar] [CrossRef]
  60. Woods, K.; Kern, C. Intermediate disturbances drive long-term fluctuation in old-growth forest biomass: An 84-yr temperate forest record. Ecosphere 2022, 13, e03871. [Google Scholar] [CrossRef]
  61. Brando, P.; Silvério, D.; Maracahipes, L.; Benzi, R.; Paolucci, L.; Maracahipes-Santos, L.; Rattis, L.; Macedo, M.; Balch, J. Legacies of multiple disturbances on fruit and seed patterns in Amazonia: Implications for forest functional traits. Ecosphere 2024, 15, e4780. [Google Scholar] [CrossRef]
  62. Dahir, S.E.; Lorimer, C. Variation in canopy gap formation among developmental stages of northern hardwood stands. Can. J. For. Res. 1996, 26, 1875–1892. [Google Scholar] [CrossRef]
  63. Ziegler, S. Disturbance regimes of hemlock-dominated old-growth forests in northern New York, USA. Can. J. For. Res. 2002, 32, 2106–2115. [Google Scholar] [CrossRef]
  64. Franklin, J.F.; Donato, D. Variable retention harvesting in the Douglas-fir region. Ecol. Process. 2020, 9, e8. [Google Scholar] [CrossRef]
  65. Gustafsson, L.; Bauhus, J.; Asbeck, T.; Augustynczik, A.; Basile, M.; Frey, J.; Gutzat, F.; Hanewinkel, M.; Helbach, J.; Jonker, M.; et al. Retention as an integrated biodiversity conservation approach for continuous-cover forestry in Europe. Ambio 2020, 49, 85–97. [Google Scholar] [CrossRef]
  66. Gustafsson, L.; Hannerz, M.; Koivula, M.; Shorohova, E.; Vanha-Majamaa, I.; Weslien, J. Research on retention forestry in Northern Europe. Ecol. Process. 2020, 9, e3. [Google Scholar] [CrossRef]
  67. Marshall, V.G. Impacts of forest harvesting on biological processes in northern forest soils. For. Ecol. Manag. 2000, 133, 43–60. [Google Scholar] [CrossRef]
  68. Raj Kizha, A.; Nahor, E.; Coogen, N.; Louis, L.; George, A. Residual stand damage under different harvesting methods and mitigation strategies. Sustainability 2021, 13, e7641. [Google Scholar] [CrossRef]
Figure 1. (A) Location of the study area: 1. San Justo Ranch; 2. Rivadavia Ranch; 3. El Roble Ranch; 4. industrial complex of Lenga Patagonia S.A. Forests covered by forest type are shown, including Nothofagus pumilio (green), N. antarctica (pale green), and mixed evergreen (brown). (B) Sampling design at Rivadavia Ranch indicating the transect types (red lines): 1. core area of retention patch; 2. core to edge of retention patch; 3. dispersed retention under the influence of the edge of retention patch; 4. dispersed retention without the influence of retention patch; 5. primary forests. White area represents the harvested area. (C) Sampling plots at San Justo Ranch, including 1. retention patches with clear-cuts (red), 2. retention patches and dispersed retention (orange), and 3. primary forests. (D) Sampling plots at Rivadavia Ranch, including 1. retention patches in the harvested area affected by the windstorm (red) and 2. primary forests (orange).
Forests 15 01432 g001
Figure 2. (A) Number of blowdown trees considering tree-fall orientation (N = north; NE = northeast; E = east; SE = southeast; S = south; SW = southwest; W = west; NW = northwest). (B) Average wind direction across the year. (C) Location of the windthrown trees inside the retention patches (Core = 1/3 inner area; Middle = 1/3 middle area; Edge = 1/3 area near the edge) at San Justo Ranch.
Forests 15 01432 g002
Figure 3. Yearly blowdown basal area (BA) inside the retention patches (m2 at each patch) occurred at two different variable retention designs (AR-CC = aggregates and clear-cuts; AR-DR = aggregates and dispersed retention) at San Justo Ranch. Letters show significant differences using Tukey test among years for each variable retention design. Fisher test and probabilities are presented in Table A2.
Forests 15 01432 g003
Figure 4. Mean wind speed (blue) and wind gusts (red) at different locations ((A) El Roble Ranch, (B) Rivadavia Ranch, (C) Lenga Patagonia S.A.) during the previous and following days of the studied windstorm event in 2023 (x-axis showed the days and month).
Forests 15 01432 g004
Figure 5. Tree-fall quadrant (N = north; E = east; S = south; W = west) considering (A) number of blowdown trees, (B) their basal area contribution, and (C) number of trees damaged during harvesting classified by areas (AGR = retention patches; DR-C = dispersed retention under the influence of retention patches; DR-F = dispersed retention without influence of retention patches) and damage types (WD = without damage; ONE = damage of skidders or extraction roads; TWO = damage of skidders and extraction roads) at Rivadavia Ranch.
Forests 15 01432 g005
Figure 6. Average wind direction (dominant direction per hour) across the year (green) and during the studied windstorm (red) (N = north; NE = northeast; E = east; SE = southeast; S = south; SW = southwest; W = west; NW = northwest) at Rivadavia Ranch.
Forests 15 01432 g006
Table 1. Two-way ANOVAs of forest structure and stand conditions considering (A) aspect (N, E, S, W) and (B) distance (0–25 m core areas inside retention patches, 25–50 m edge areas inside retention patches, 50–150 m dispersed retention in harvested areas) as main factors at Rivadavia Ranch. DH = dominant height (m); CC = overstory crown cover (%); LAI = relative leaf area index; DIR = transmitted direct solar radiation (%); DIF = transmitted diffuse solar radiation (%); and TR = transmitted total solar radiation (%). Control (PF = primary forests) is presented as mean and standard deviation (SD).
TreatmentLevelDHCCLAIDIRDIFTR
PFMean21.490.42.6514.312.212.5
SD(1.0)(4.8)(0.53)(6.4)(5.9)(5.8)
A: AspectN23.755.6 a0.79 a64.6 c56.2 c57.4 c
E23.163.1 b1.08 b49.6 b46.7 ab47.1 ab
S23.164.6 b1.13 b35.7 a442 a42.9 a
W22.757.1 a0.82 a49.9 b52.7 bc52.3 bc
F1.2111.549.3311.129.1610.38
(p)(0.318)(<0.001)(<0.001)(<0.001)(<0.001)(<0.001)
B: Distance0–2523.181.6 d1.98 d22.1 a22.1 a22.1 a
25–5023.171.6 c1.34 c33.2 ab36.0 b35.6 b
50–7523.161.7 b0.89 b46.8 bc48.7 c48.4 c
75–10023.151.7 a0.60 ab62.9 cd60.3 d60.7 d
100–12523.146.9 a0.46 a69.2 d66.2 d66.6 d
125–15023.147.1 a0.46 a65.7 d66.3 d66.2 d
F0.0179.8675.0619.6965.7257.27
(p)(0.999)(<0.001)(<0.001)(<0.001)(<0.001)(<0.001)
A × BF0.010.670.720.770.600.65
(p)(0.999)(0.803)(0.748)(0.702)(0.863)(0.820)
F = Fisher test; (p) = probability. Different letters indicate significant differences using the Tukey test at p < 0.05.
Table 2. Two-way ANOVAs of forest ground cover and coarse-woody debris volume considering (A) aspect (N, E, S, W) and (B) distance (0–25 m core areas inside retention patches, 25–50 m edge areas inside retention patches, 50–150 m dispersed retention in harvested areas) as main factors at Rivadavia Ranch. BS = bare soil (%); TREE = overstory trees (%); DICO = dicot plants cover (%); REG = tree regeneration cover (%); MONO = monocot plants cover (%); INF = non-vascular plants cover (%); DEB = coarse-woody debris cover (%); and VDEB = volume of coarse-woody debris (m3 ha−1). Control (PF = primary forests) is presented as mean and standard deviation (SD).
TreatmentLevelBSTREEDICOREGMONOINFDEBVDEB
PFMean56.82.07.65.21.63.616.4365.1
SD(12.9)(2.1)(7.4)(10.0)(2.1)(3.0)(9.5)(242.4)
A: AspectN42.81.811.55.12.92.927.3585.9
E45.31.314.22.42.80.829.6561.1
S49.71.310.03.53.81.127.3567.4
W38.72.218.23.84.21.729.6644.0
F2.110.491.900.431.031.720.180.21
(p)(0.111)(0.692)(0.142)(0.733)(0.388)(0.175)(0.908)(0.885)
B: Distance0–2559.0 b3.07.33.33.32.715.6 a357.1
25–5042.3 a1.312.03.33.31.026.3 ab604.2
50–7540.3 a1.715.35.34.01.730.0 ab631.5
75–10044.0 ab2.015.03.02.30.631.7 b689.6
100–12539.0 a0.313.03.33.31.334.0 b591.4
125–15040.3 a1.718.34.02.02.733.0 b663.9
F3.641.361.360.170.231.013.411.43
(p)(0.007)(0.256)(0.256)(0.971)(0.946)(0.422)(0.010)(0.229)
A × BF1.981.290.580.880.830.601.521.26
(p)(0.037)(0.246)(0.873)(0.594)(0.642)(0.857)(0.134)(0.263)
F = Fisher test; (p) = probability. Different letters indicate significant differences using the Tukey test at p < 0.05.
Disclaimer/Publisher’s Note: The statements, opinions and data contained in all publications are solely those of the individual author(s) and contributor(s) and not of MDPI and/or the editor(s). MDPI and/or the editor(s) disclaim responsibility for any injury to people or property resulting from any ideas, methods, instructions or products referred to in the content.

