Abstract
Plant leaves harbor a rich diversity of bacteria and fungi that, through their interactions with host plants, assume an influential role in plant physiological and metabolic processes. The unique phyllosphere environment of different plant species may shape and select distinct phyllosphere microbial communities. While most academic research has focused on the phyllosphere microorganisms within the same plant variety, there is relatively limited research on the phyllosphere microbial communities between different varieties. Populus L. is a typical tree species in temperate monsoon climates, widely distributed in northern China, and it constitutes a crucial component of China’s forestry resources. For the purpose of this study, we investigated the community structure and diversity of phyllosphere fungi and bacteria in different poplar varieties under identical growth conditions to elucidate the main factors contributing to differences in phyllosphere microbial communities among these varieties. Our findings revealed variations in nitrogen, phosphorus, starch, and soluble sugar contents among the three poplar species studied. Additionally, there were considerable disparities in both abundance and α diversity index of phyllosphere fungal and bacterial communities among these species. At the phylum level, Ascomycota and Basidiomycota have been identified as the dominant fungal communities; while Proteobacteria and Actinomycetes were dominant bacterial communities. The correlation analysis pointed out that chemical traits in the leaves, in particular the total phosphorus and the quantity of soluble sugar, had a significant correlation with the structure and diversity of the microbial community residing in the phyllosphere. Overall, our results demonstrate that even under identical site conditions, each poplar species harbors its own unique phyllosphere microbial community composition as well as distinct leaf characteristics—highlighting host plant diversity as a crucial factor driving differences in phyllosphere microbial composition.
1. Introduction
Plants provide multiple ecological niches for endophytic and epiphytic microbial communities [1,2], which colonize the surface [3] and endophytic tissues of the above-ground and subsurface parts of plants [4], forming complex interactions and playing a crucial role in assisting plants in nutrient uptake, growth promotion, disease, and stress resistance [5,6,7]. The leaf surface serves as an important ecological niche for microbial growth; however, it is also a harsh and unstable habitat. Due to interference from biological and abiotic factors, it is not conducive to the survival of microorganisms. Those microorganisms that successfully colonize the leaf surface after enduring these challenging conditions are referred to as phyllosphere microorganisms [8,9]. This includes a variety of bacteria, archaea, fungi, algae, viruses, and less common protozoa and nematodes [10]. The microbial communities found on the surfaces of leaves (epiphytes) and within their internal tissues (endophytes) exhibit a wide range of diversity, establishing intricate and multifaceted interactions with host plants [11,12,13].
Microorganisms that live in intercellular spaces or cells within leaf tissues and form symbiotic relationships with plants in a long-term process of coevolution are called endophytes [14]. The phyllosphere, denoting the aboveground components of land plants, constitutes Earth’s most extensive biological interface. The ecologically crucial microbial communities inhabiting the phyllosphere are influenced by a combination of environmental factors and plant-specific characteristics. Plants interact with phyllosphere microorganisms [15,16], which are vital regulators of host plant growth and health, thereby influencing ecosystems [17]. By synthesizing specific antibiotic compounds, releasing growth regulators [18] (including indole-3-acetic acid and auxin), and performing nitrogen fixation in the atmosphere, these microorganisms possess the capacity to modulate the sensitivity of host plants toward abiotic stresses (such as drought, temperature fluctuations, and ultraviolet radiation) as well as biological stresses (such as pathogens, parasites, and pests) [19,20]. Due to the limited resources available in the phyllosphere microenvironment and its direct susceptibility to meteorological events, phyllosphere microorganisms are often highly responsive to environmental changes [21,22]. Their survival relies on their proficiency in cultivating resistance mechanisms as a reaction to the prevailing adverse environmental conditions within the phytosphere [23]. For example, when faced with UV radiation, phyllosphere microorganisms produce pigments, EPS (extracellular polymeric substances) [24,25], biosurfactants [26], etc., which promote surface adhesion and provide protection against drying. Additionally, they engage in chemical warfare to compete for space and nutrition [27].
Simultaneously, the phyllosphere microbial community possesses the capability to impact plant biogeography and ecosystem function through its influence on plant growth performance under diverse environmental conditions [28,29]. However, some authors demonstrate that the phyllosphere microorganisms of the same pine species are highly similar regardless of geographic location [30,31]. We can infer that plant-specific factors are the primary drivers shaping the makeup of phyllosphere microbial communities, rather than environmental factors [32,33,34].
In addition, some studies have shown that bacteria can interact highly closely with plants, including intracellular colonization and even endosymbiosis [35,36]. A significant portion of research on phyllosphere microorganisms has primarily focused on phyllobacteria, which are the most abundant source of phyllosphere microorganisms [37]. The second most abundant group is fungi, which have been acknowledged as a pivotal constituent in the decomposition and conversion of decaying vascular plant material within deteriorating ecosystems [38]. The phyllosphere microbial community composition is indicative of the proliferation and migration of microbial settlers [39]. Over the past few years, the phyllosphere microbiome has garnered growing interest within the realm of microbiological ecology. But up to now, insufficient exploration has been conducted on the simultaneous presence of both phyllosphere fungi and bacteria in a single research study, as well as their individual contributions to the decomposition of plant litter. In this study, we selected different varieties of Populus under the same growth conditions, namely YA Populus × euranericana cl., YB ‘64’, Populus × euramericana cv., YC ‘Guariento’, Populus cathayana × canadansis “Xin lin 1” as the research objects. The elucidation of disparities in fungal and bacterial communities inhabiting the phyllosphere of diverse Populus varieties, cultivated under identical growth conditions, fosters a deeper comprehension of the composition of phyllosphere microorganisms.
2. Experimental Procedures and Materials
2.1. The Site for Conducting Experiments
The experimental fieldwork was carried out in Xinmin., Liaoning province, situated in the middle of Liaoning province and Liaohe Plain. Its geographical coordinates range from 122°27′ E to 123°20′ E and 41°42′ N and 42°17′ N. Xinmin is the Liaohe impact plain. The terrain slopes slowly from northwest to southeast, with an elevation of more than 50 m along the northern boundary and gradually decreasing to the south. The region exhibits a warm temperate subhumid continental monsoon climate, characterized by warm temperatures and the presence of four distinct seasons. The Liaohe area of Xinmin has always been a fragile area in terms of its ecological environment, which has been severely damaged by wind and sand. Over the years, efforts have been made to build windproof and sand-fixing forests.
A comparative forest of three varieties was established in 2010, with an afforestation density of 3 m × 6 m and 10 rows × 4 rows in each community. A total of 27 poplar trees of the same variety were planted, with 3 replicates in each community, totaling 9 communities. In this study, the experimental subjects were named YA Populus × euranericana cl.; YB ‘64’, Populus × euramericana cv.; YC ‘Guariento’, Populus cathayana × canadansis “Xin lin 1”, respectively.
2.2. Gathering and Processing of Samples
In June 2023, three trees were selected from each plot with a spacing of 10 m between the two trees. Branches from four directions (east, west, south, and north) at a height of 6–8 m above the ground were pruned using high branch scissors. High branch scissors were utilized to cut the branches while wearing sterile gloves to ensure the collection of complete leaves without any signs of disease or insect damage. The leaves of the three Populus trees were mixed and placed in sterilized sealed bags as a repeat. A total of 9 bags were collected from the three varieties and stored in ice boxes at 4 °C. The samples were divided into two distinct categories. One category underwent the process of dehydration, with the intention of facilitating the subsequent examination of their physical and chemical characteristics. In parallel, the second category of samples was harnessed for the extraction of microbial DNA from the phyllosphere, a preparatory step for the upcoming analytical procedures.
The leaf sample weighing 30 g was introduced into a sterile conical bottle with a capacity of 1000 mL, followed by the addition of sterile PBS buffer (pH 7.4, 1× phosphate buffer) in a volume of 500 mL. To eliminate microbial cells present on the leaves, an ultrasonic cleansing bath was utilized for a duration of 6 min at a frequency of 40 kHz. The oscillation was set at 200 r/min and maintained for 20 min at a temperature of 30 °C, followed by an additional ultrasonic treatment lasting 3 min with a frequency of 40 kHz. The microbial cells were isolated from the leaves by passing the cell suspension through a sterile nylon membrane (0.22 mm × 50 mm) using filtration. Subsequently, the membrane samples were stored at −80 °C.
2.3. DNA Extraction and RNA Gene Amplification
The DNA extraction process was carried out utilizing the Fast®DNA SPIN kit (MP Biomedicals, Irvine, CA, USA) in accordance with the guidelines provided by the manufacturer. The quantity and quality of DNA were assessed using the NanoDrop NC2000 spectrophotometer (Thermo Fisher Scientific, Waltham, MA, USA). Amplification of the V1 segment of the RNA gene was accomplished through PCR utilizing the forward primer ITS5 and the reverse primer ITS2, adhering to the protocol outlined by Wiesmann Crispin and their colleagues. The primers for multiple sequencing were designed with sample-specific 7-bp barcodes, and the PCR amplifiers were purified using Vazyme VAHTSTM DNA Clean Beads (Vazyme, Nanjing, China). Amplification of the 16S rRNA gene, specifically the V3–V4 region, was achieved through PCR employing the forward primer 338F in conjunction with the reverse primer 806R, following established protocols. The determination of quantity was conducted with the assistance of the Quant-iT PicoGreen dsDNA Assay Kit, sourced from Invitrogen in Carlsbad, CA, USA. The peer 250 bp sequencing was performed at Shanghai Personal Biotechnology Co., Ltd. (Shanghai, China) using the illumina NovaSeq platform and NovaSeq 6000 SP kit. The amplification parameters employed were as follows: 98 °C initially denatured for 2 min, then denatured for 15 s at 98 °C, annealed for 30 s at 55 °C, extended for 30 s at 72 °C, and finally extended for 5 min at 72 °C, then held at 10 °C. PCR amplicons were purified using agcourt AMPure Beads (Beckman Coulter, Brea, CA, USA). The PicoGreen dsDNA Assay Kit (Invitrogen, Carlsbad, CA, USA) was used to further quantify PCR amplicons. The PCR amplification process was executed utilizing the Illumina NovaSeq sequencing platform, operated by Shanghai Personal Biotechnology Co., Ltd, situated in Shanghai, China, ensuring precise and efficient DNA amplification.
2.4. Determination of Physical and Chemical Properties of Leaves
The plant leaves underwent a rigorous rinsing process using sterile, distilled water, ensuring thorough cleaning, followed by a phosphate-free filter paper drying method for surface moisture removal. The sample was baked (105 °C for 30 min) and then dried (65 °C for more than 48 h at constant weight). The dried plant leaf samples were crushed and screened through a 100-mesh screen. Leaf Soluble Sugar was determined by the anthranone method [40], and leaf Total Nitrogen was determined by Kjeldahl nitrogen distillation, the concentration of Total Phosphorus in leaf samples was determined using the acid-solution-molybdenum-antimony reactance colorimetric method [41].
2.5. Statistical Analysis
Using R scripts, the VennDiagram package generated a Venn diagram that counted the number of members of each collection according to whether it was present across samples (groups), that was, the number of ASVs (Amplicon Sequence Variants) unique to each group and shared between groups (note not abundance values). The magnitude of the alpha diversity index was correlated with the depth of flattening in the utilized ASV table. The sparse curve was generated using QIIME2 (2019.4) to enable comparison of the number of ASVs across different samples at a consistent sequencing depth, thereby providing a quantitative measure of sample diversity. To conduct a comprehensive assessment of the alpha diversity within microbial communities, two indices were employed: Chao1 and Observed Species. These indices served as key metrics to characterize the richness, or the total number of distinct species present in a given sample, without altering the original intent of the analysis. Diversity was represented by Shannon and Simpson indices, and evolution-based diversity was represented by Faith’s PD indices. Pielou’s evenness index was used to characterize the evenness and Good’s coverage index was used to characterize the coverage. QIIME2 (2019.4), R language, ggplot2 package was used to draw the data in the above table into box graphs to visually show the alpha diversity differences between different groups, and the verification of differences’ significance can be conducted using the Kruskal–Wallis rank sum test and Dunn’s test as post hoc analyses. The uclust function of the stat package in R language was used to perform cluster analysis on the Bray–Curtis distance matrix by default using the UPGMA algorithm (that was, the clustering method was average), and the ggtree package of R script was used for visualization. Using QIIME2 (2019.4), a self-written Perl script was utilized to perform statistical analysis on the feature list, excluding singleton entries. The resulting composition distribution of each sample was visualized across six classification levels including phylum, class, order, family, genus, and species. The analysis outcomes were presented in a bar chart. Using R language, pheatmap package, etc., the clustering results of each sample and each classification unit were calculated and presented in the form of an interactive graph. The correlation heatmap was created based on the correlation coefficient of the Spearman algorithm using genecsloud, a free online data analysis platform.
3. Results
3.1. Variation in the Chemical Properties of the Leaves of Three Species of Populus spp.
The three analyzed samples of Populus spp. had significant differences in concentration of Total Nitrogen (f = 1.366, p = 0.300), Total Phosphorus (f = 16.193, p < 0.001), Soluble Sugar (f = 4.052, p < 0.05), and Starch (f = 6.86, p < 0.05). The sample of YA had the highest concentration of Total Nitrogen and Starch (0.68 g kg−1, 586.56 mg g−1). While the sample of YB had the highest Total Phosphorus concentration and Soluble Sugar concentration (5.96 g kg−1, 213.74 mg g−1).
3.2. Diversity of Phyllosphere Fungal and Bacterial Communities in Three Different Populus spp.
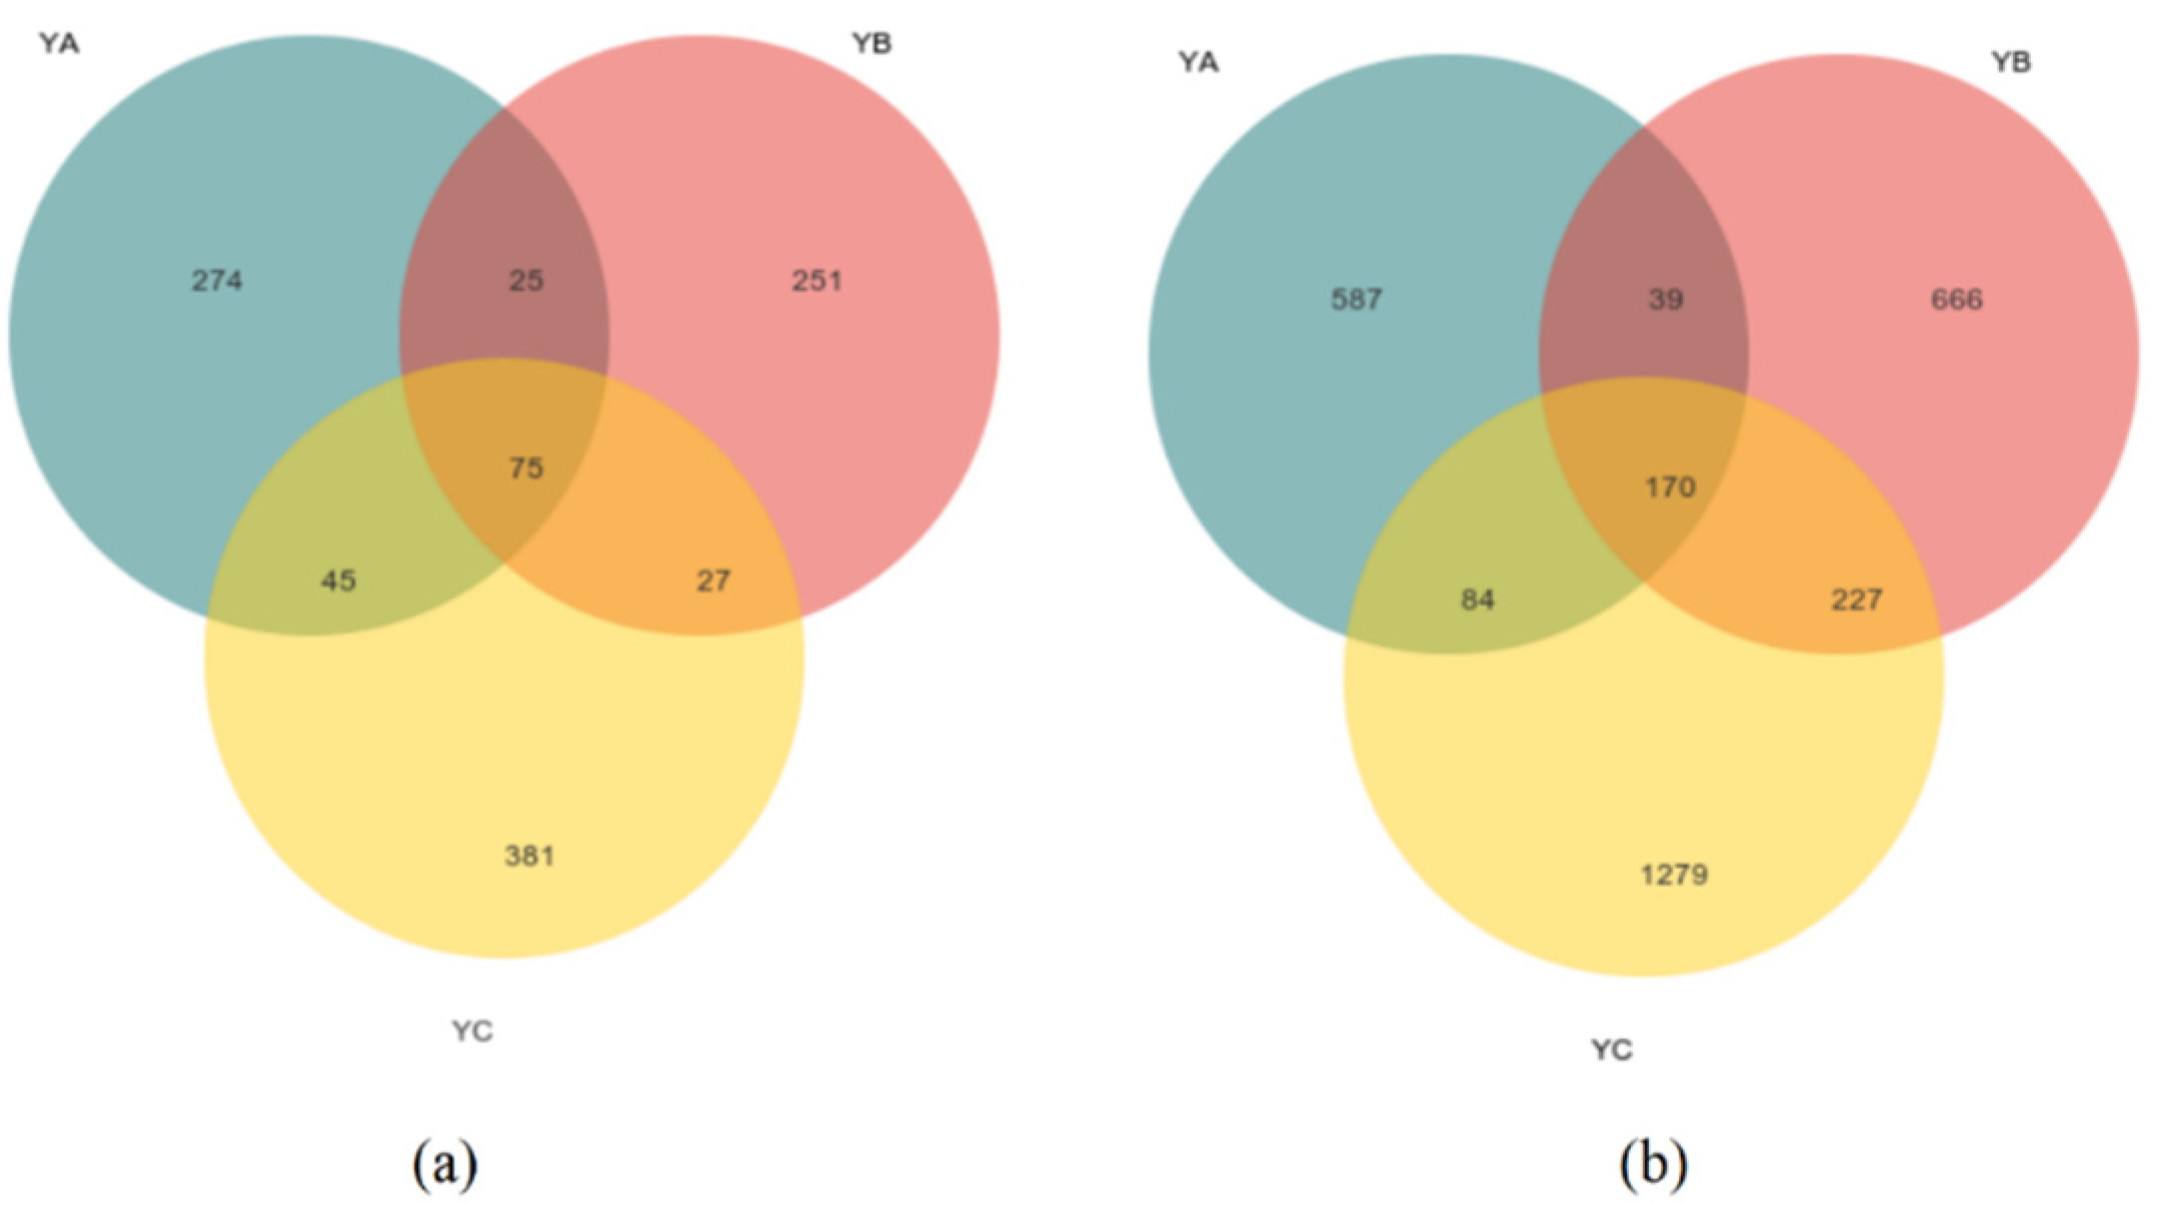
At the fungal level, we obtained a grand total of 754,958 sequences that met the criteria for high quality. The mean fungal sequence count per sample amounted to 83,884, including a clustering of 1078 ASVs. We found that the ASVs for YA, YB, and YC were 419, 378, and 528. The total count of ASVs shared among all species amounted to 75. The quantity of unique ASVs of YA was 274, and the quantity of unique ASVs of YB was 251 while YC was 381 (Figure 1a).

Figure 1.
Venn diagram illustrating unique and shared ASVs of phyllosphere microbial community for three different samples. (a) Unique and shared ASVs of phyllosphere fungal communities in three different samples; (b) Unique and shared ASVs of phyllosphere bacteria communities in three different samples.
While, at the bacteria level, a grand total of 812,694 bacterial sequences of fine quality were acquired. Each sample contained an average of 90,299 bacterial sequences, including 3052 ASV clusters. We found that the ASVs for YA, YB, and YC were 880, 1102, and 1706. The number of unique ASVs of YA was 587, that of YB was 666, and that of YC was 1279. The shared number of ASVs in all species was 170 (Figure 1b).
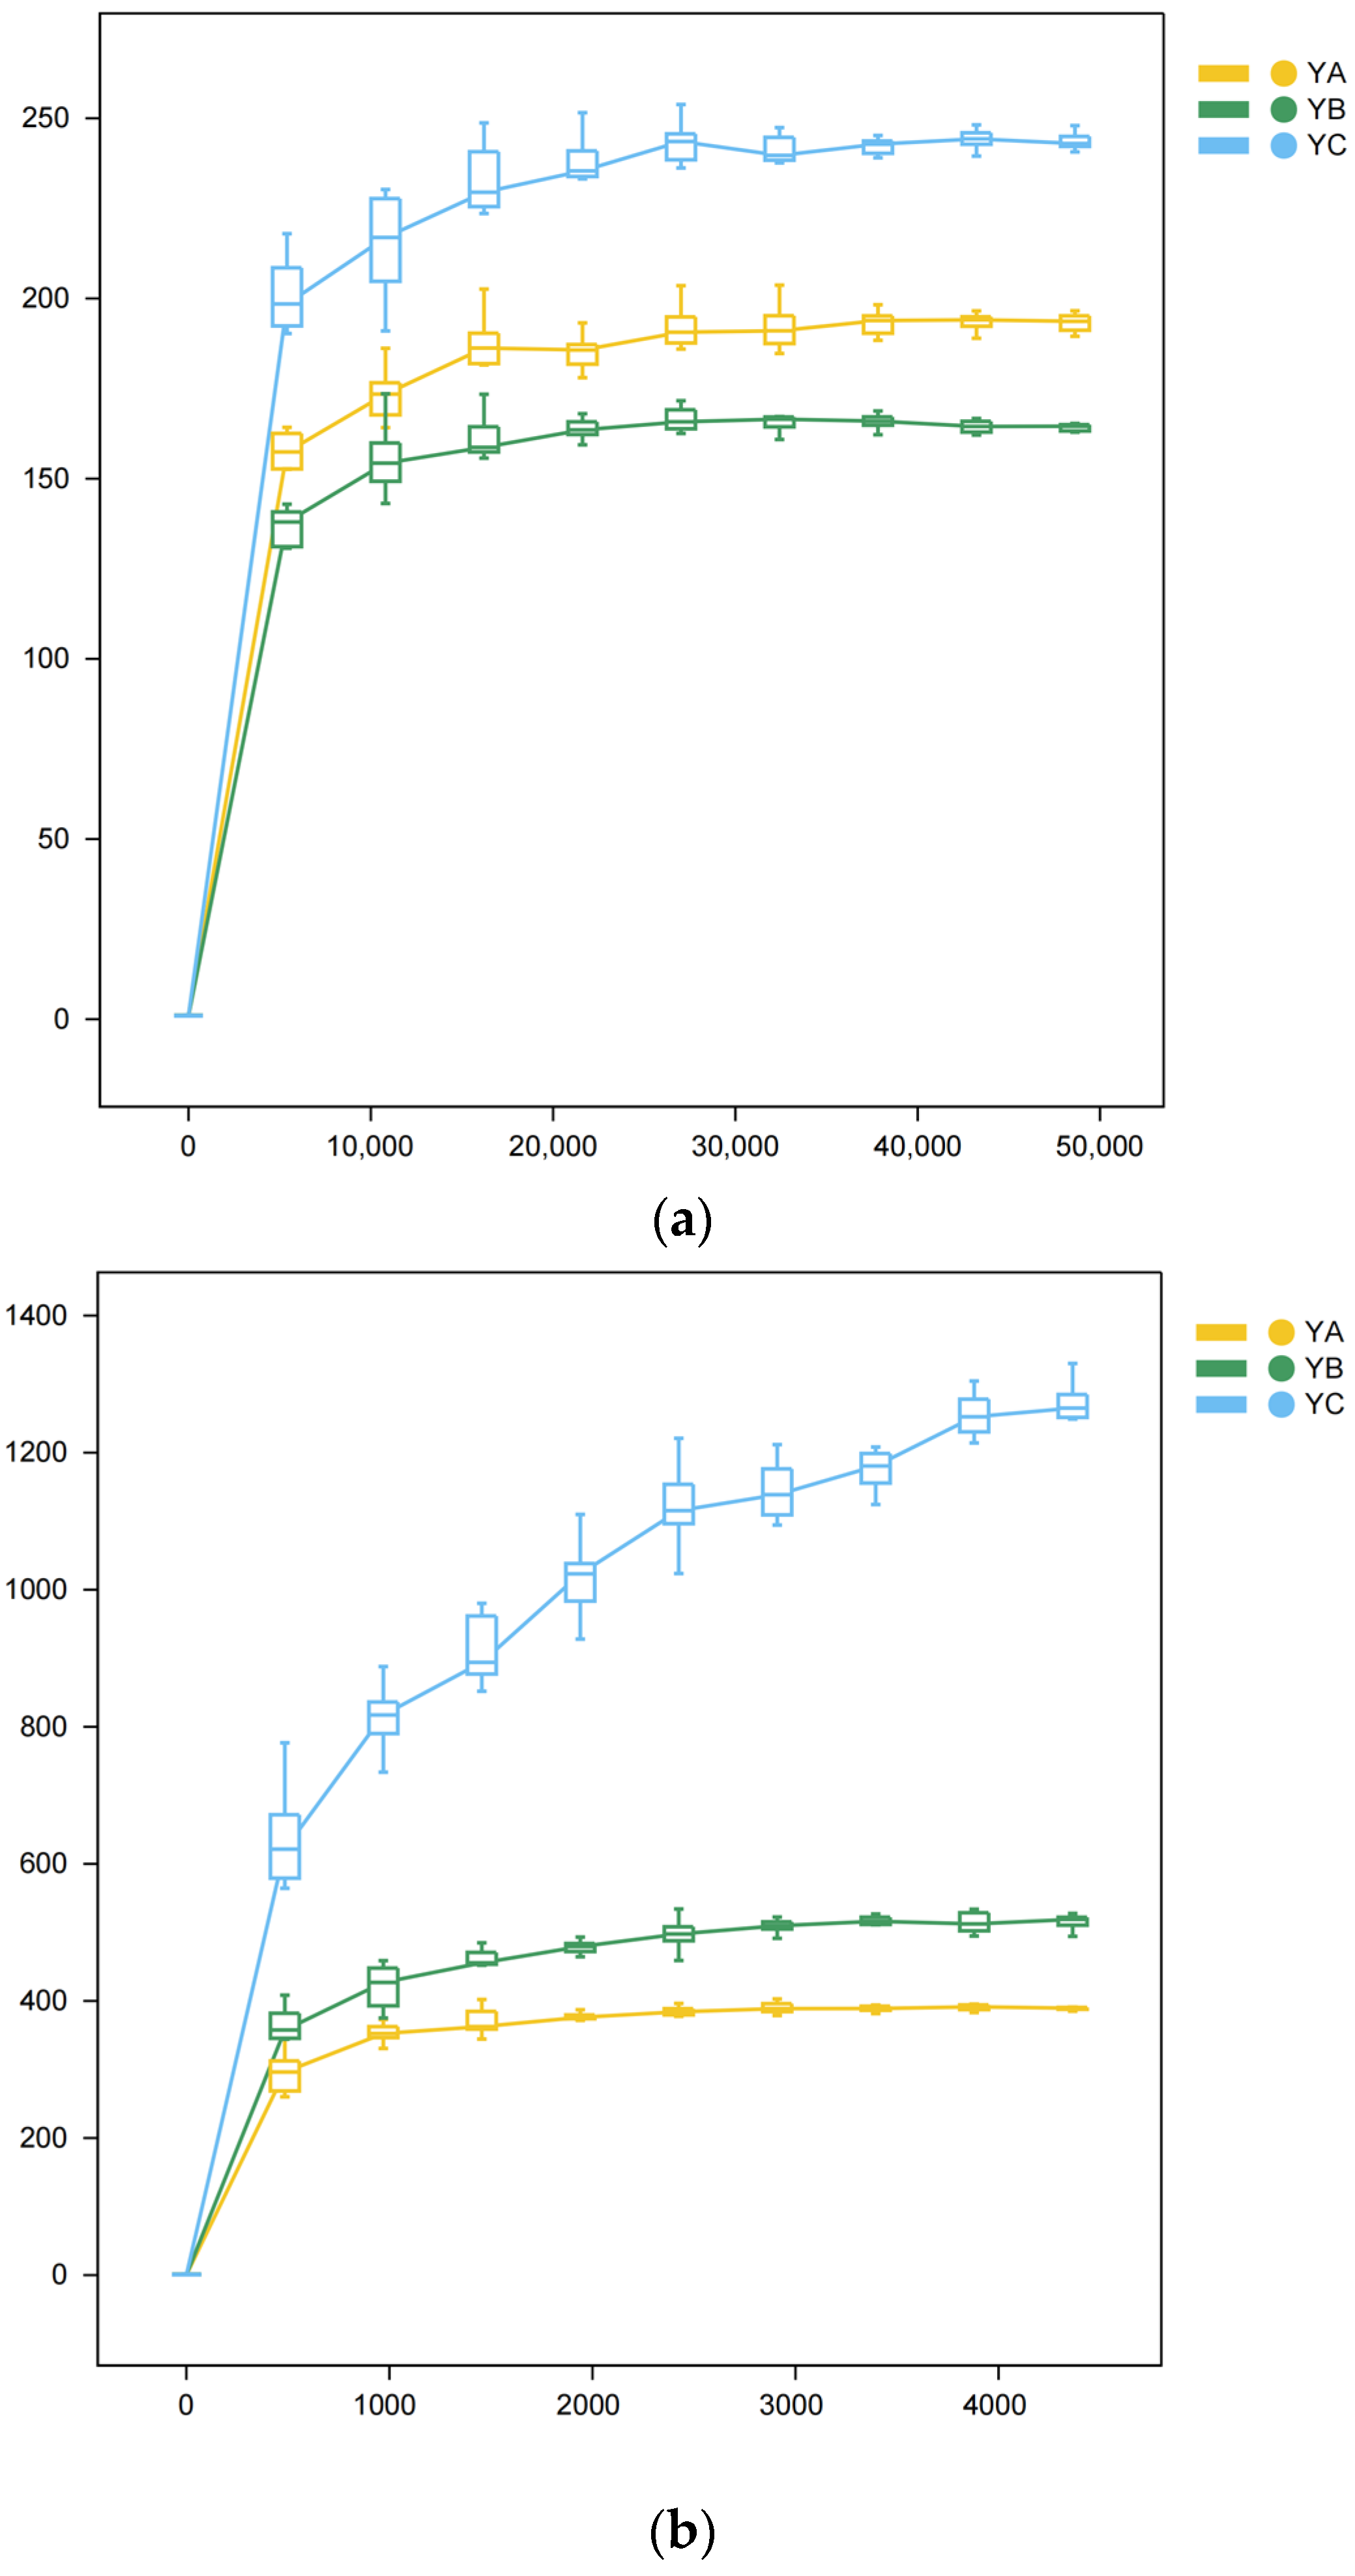
Over time, there was a consistent rise in sequencing depth, we observed a gradual flattening of the curve (Figure 2).
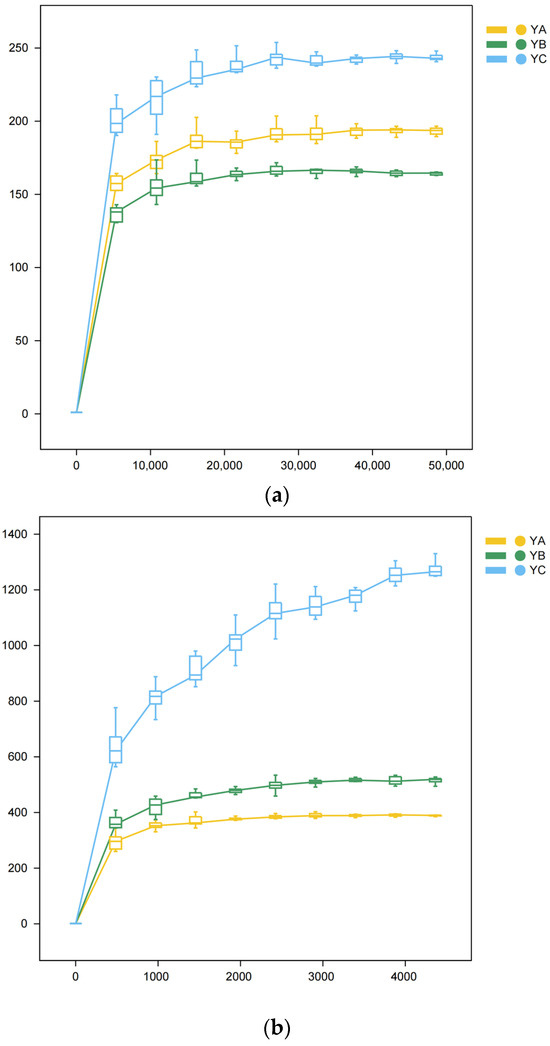
Figure 2.
Rarefaction Curve. The observed diversity of samples is influenced by the sequencing depth, which is reflected in the flattening of the curve. The lack of steepness in the curve suggests that the sequencing outcomes successfully reflect the existing diversity within the current samples, encompassing numerous novel ASVs. Conversely, a non-flattened curve suggests that alpha diversity has not reached saturation. (a) Rarefaction Curve of fungi. (b) Rarefaction Curve of bacteria.
3.3. Alpha Diversity Index of Fungal and Bacterial Communities in Three Populus spp.
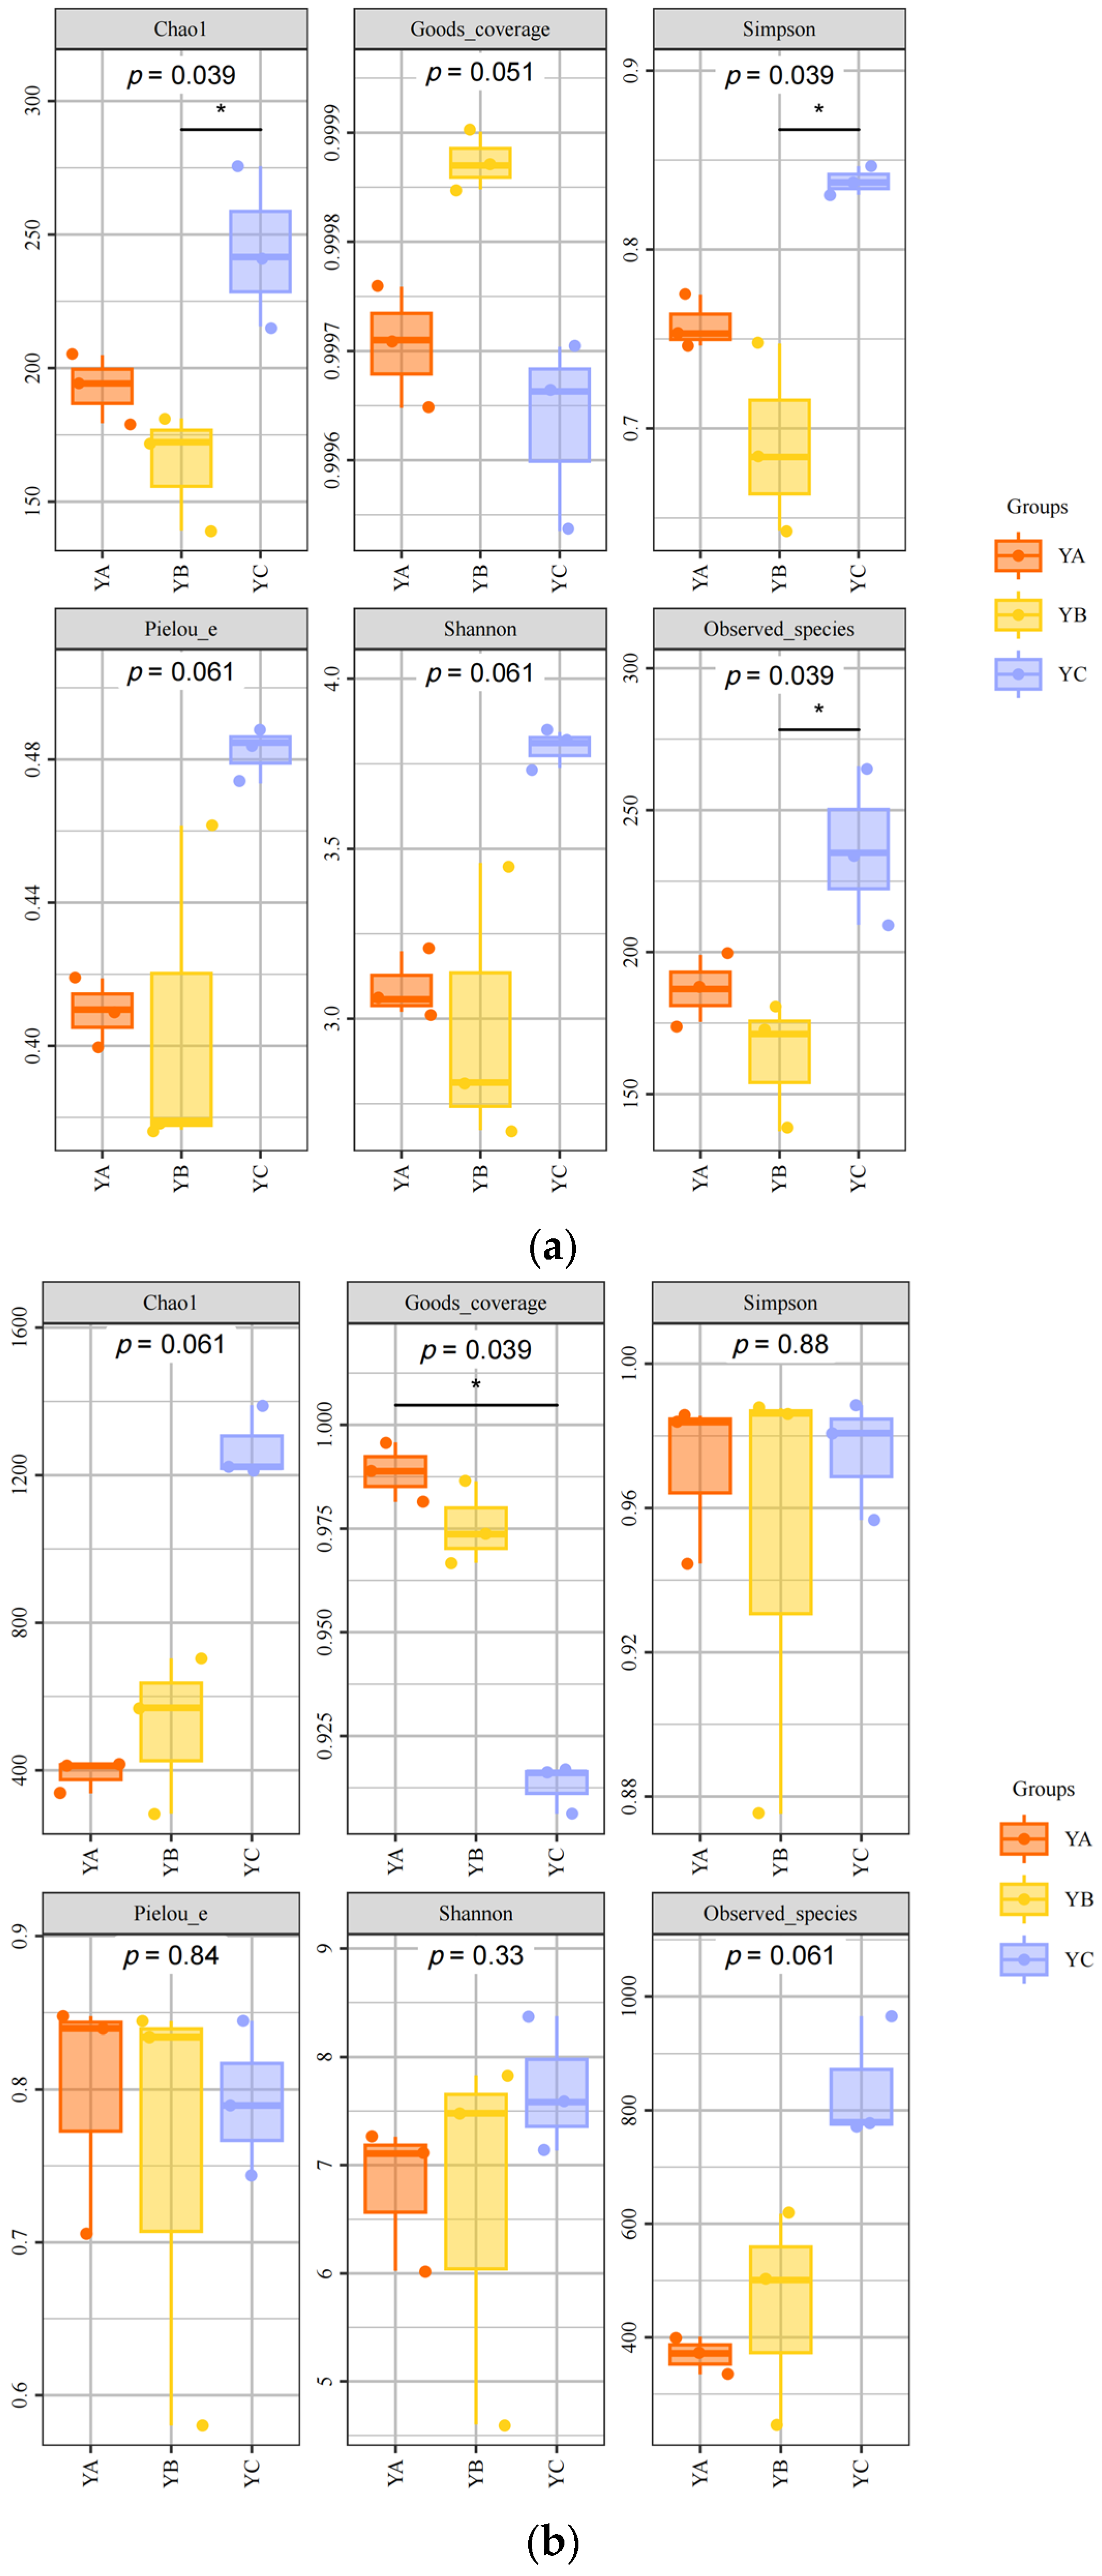
At the fungal level, the fungal composition exhibited significant variations among YA, YB, and YC in phyllosphere fungal Chao1 (p = 0.039), Goods_coverage (p = 0.051), Simpson (p = 0.039), Pielou_e (p = 0.061), Shannon (p = 0.061), and Observed species (p = 0.039). The Chao1 index, Simpson index, Pielou_e index, and Shannon index of YC were the highest, which were 275.64, 0.85, 0.49, and 3.84, respectively. The YB sample exhibited the lowest Chao1 index of 139.14 and Simpson index of 0.64 (Figure 3a).
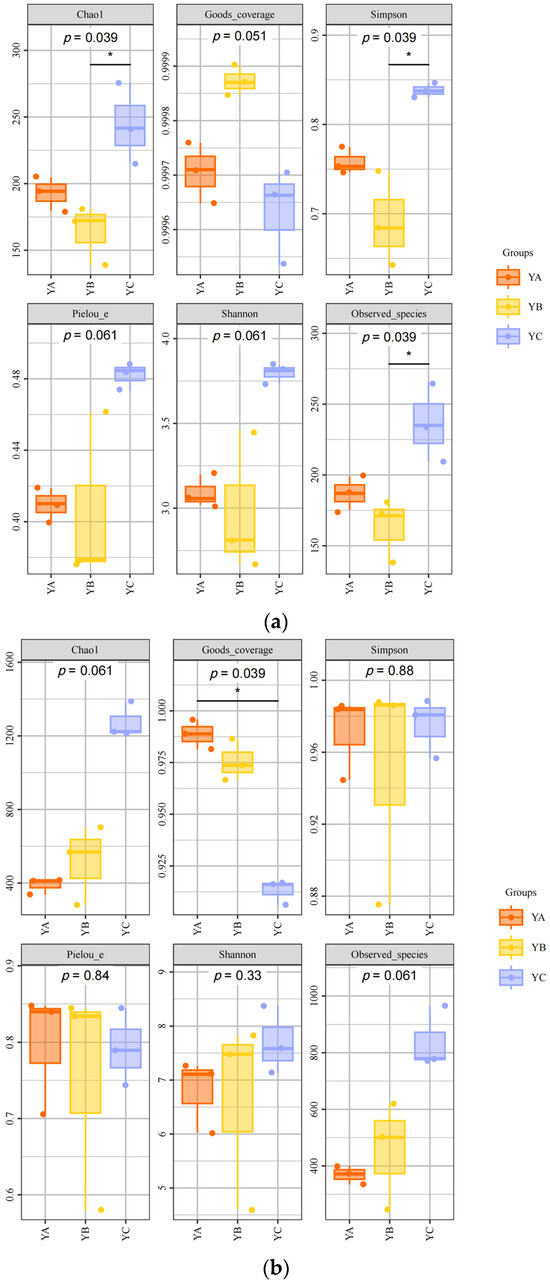
Figure 3.
Phyllosphere microbial diversity (* Reveals a notable variance with a confidence level of 95%. The black line represents a direct and significant difference between the two) (a) Alpha diversity analysis of phyllosphere fungal community. (b) Alpha diversity analysis of phyllosphere bacterial community.
While, at the bacterial level, there were significant differences in the phyllosphere bacterial communities among YA, YB, and YC in terms of Chao1 (p = 0.061), Good’s coverage (p = 0.039), Simpson (p = 0.88), Pielou_e (p = 0.84), Shannon (p = 0.33), and Observed species (p = 0.061). The Chao1 index, Shannon index, and Observed species were the highest in YC, which were 1389.9, 8.37, and 965.6, respectively. While the YB sample had the lowest Chao1 index, which was 282.08 (Figure 3b).
3.4. Composition of Phyllosphere Fungal and Bacterial Communities of Three Different Populus spp.
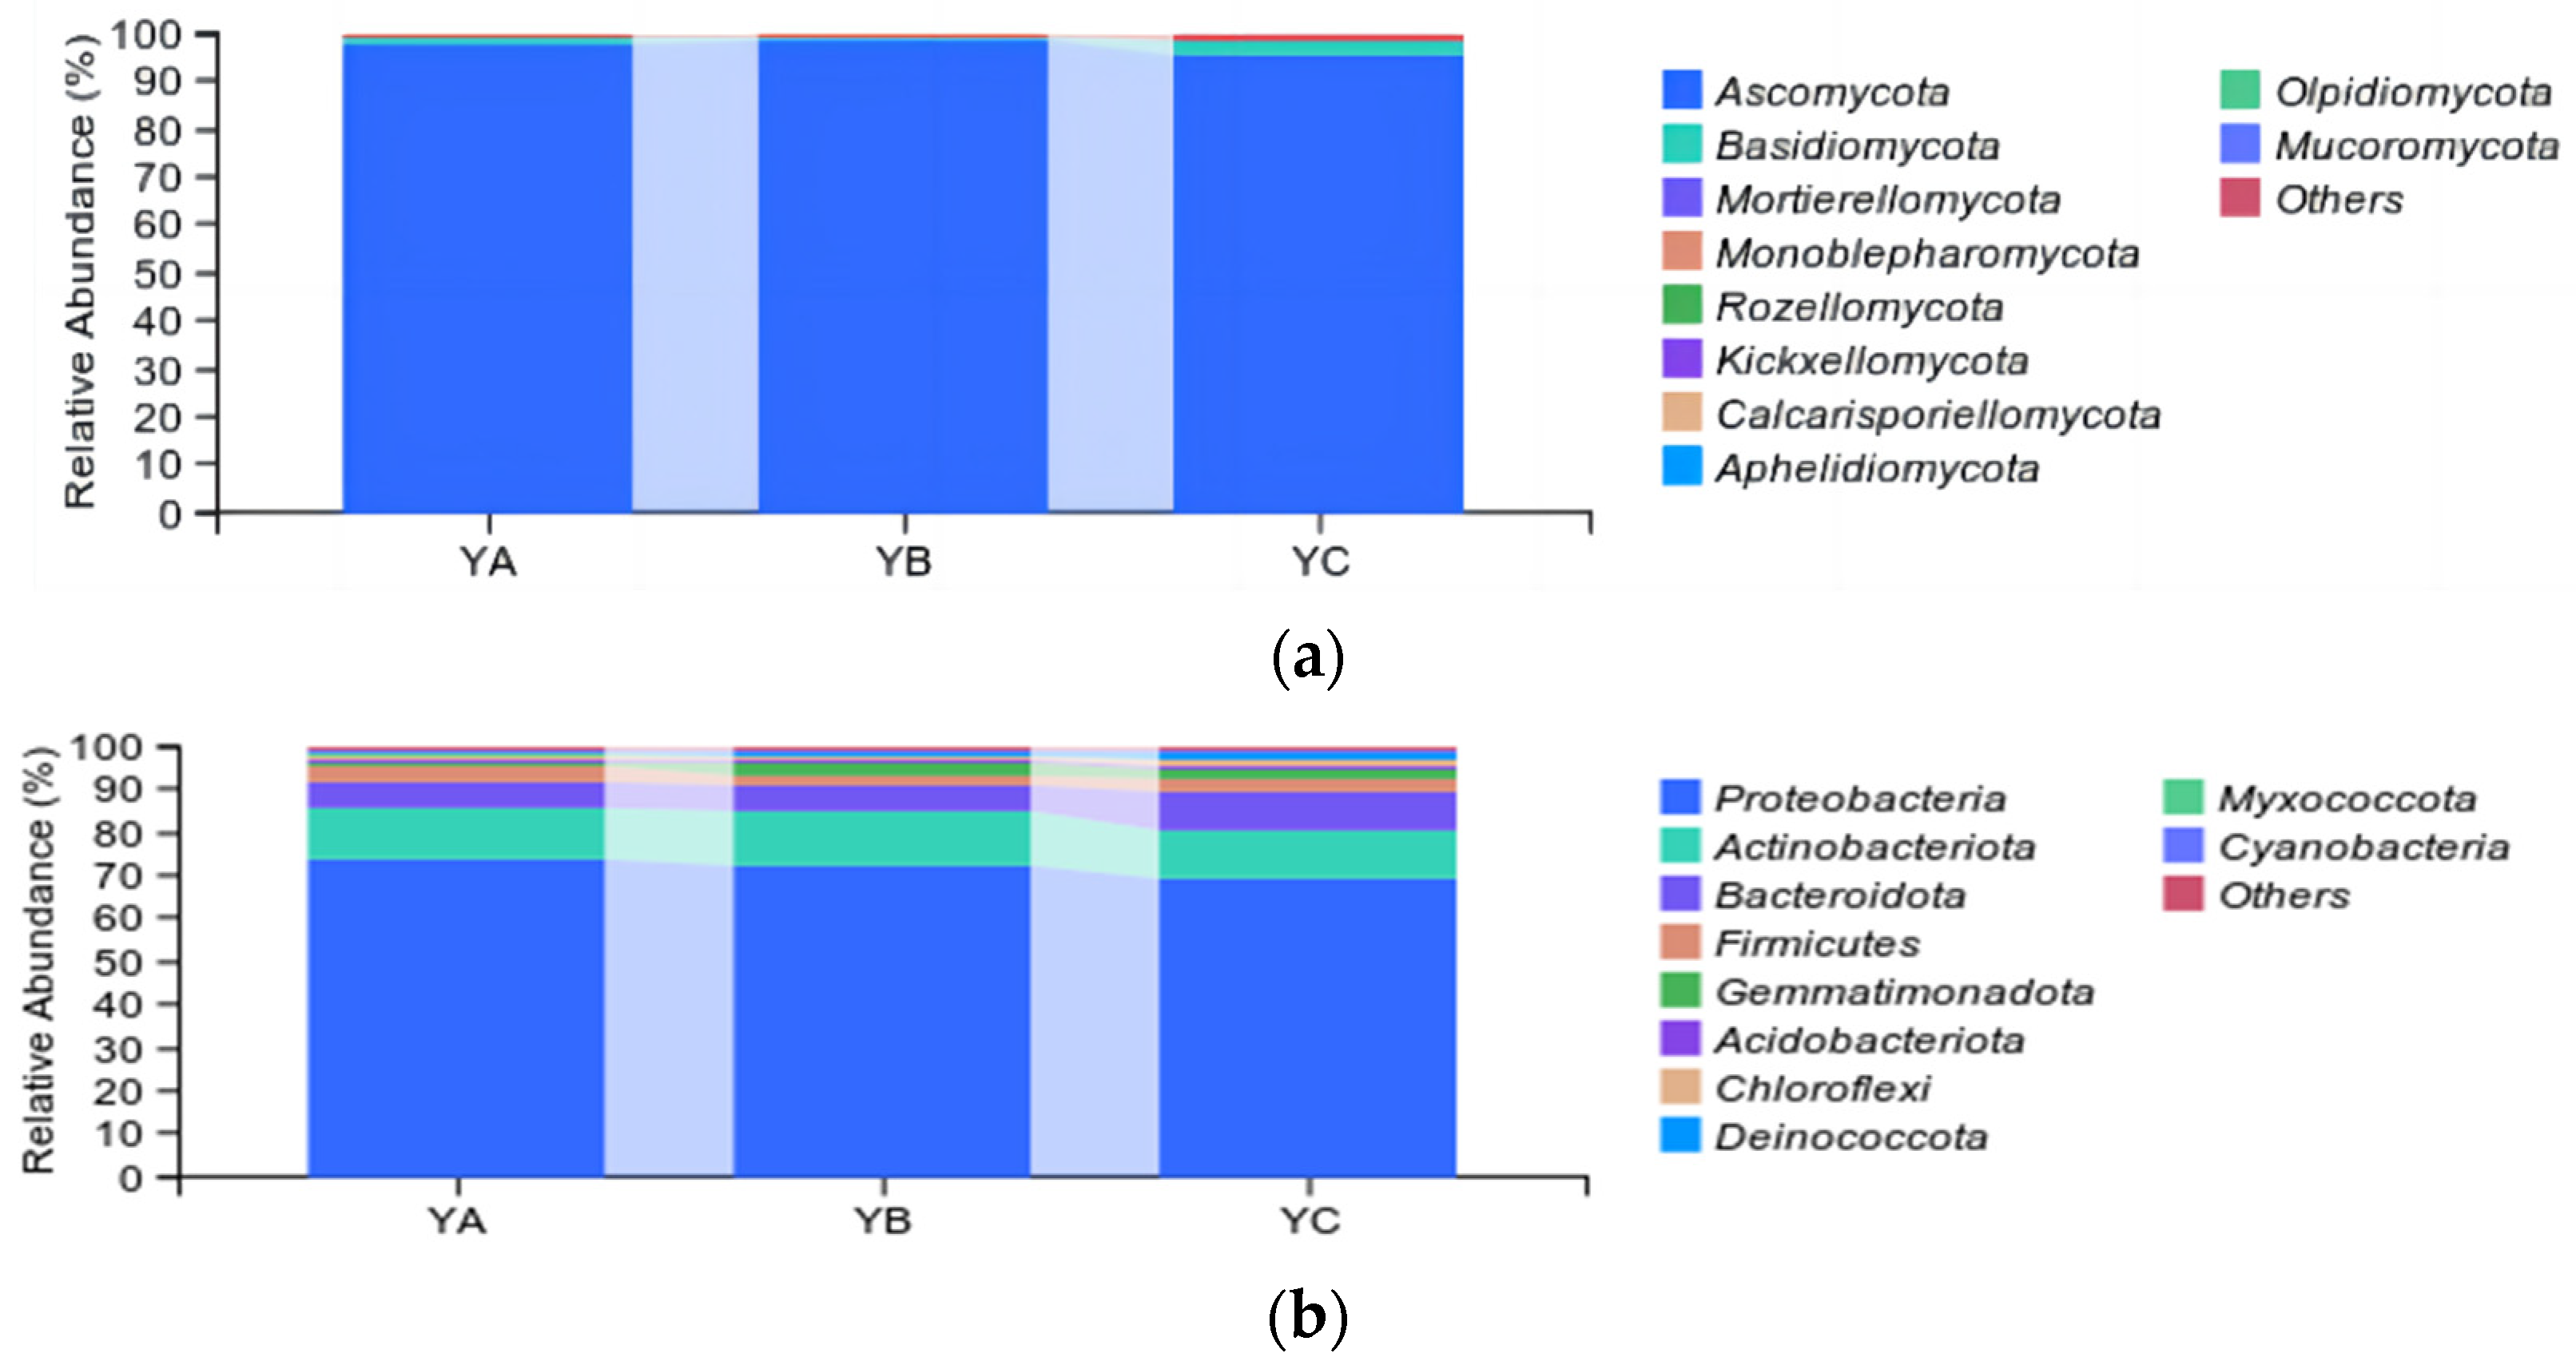
At the phylum level, the top 10 fungal taxa were identified, including Ascomycetes, Basidiomycetes, Mortierellomycota, Monoblepharomycot, Rozellomycota, and so on. Ascomycetes were the dominant phyllosphere community (97.27%), followed by Basidiomycetes (1.80%). The YB sample exhibited the highest proportion of Ascomycetes, accounting for 98.40%, followed by YA (97.83%) and YC (95.59%). Basidiomycetes were the highest in YC (2.57%) and the lowest in YB (1.14%) (Figure 4a).
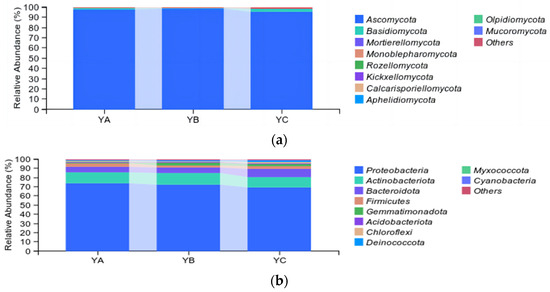
Figure 4.
Analysis of taxonomic composition at the phylum level. (a) Analysis of fungal taxonomic composition at the phylum level. (b) Analysis of bacterial taxonomic composition at the phylum level.
While, in the bacterial community, at the phylum level, the top 10 bacteria were identified, including Proteobacteria, Actinobacteriota, Bacteroidota, Firmicutes, Gemmatimonadota, and so on. Among them, Proteobacteria was the dominant phylum, with an average relative abundance of 71.71%, followed by Actinobacteriota and Bacteroidota, with an average relative abundance of 11.92% and 6.97%, respectively. The proportion of Proteobacteria was highest in YA (73.62%) and lowest in YC (69.01%). In contrast, Actinobacteriota had the highest relative abundance in the YB sample, accounting for 12.29% (Figure 4b).
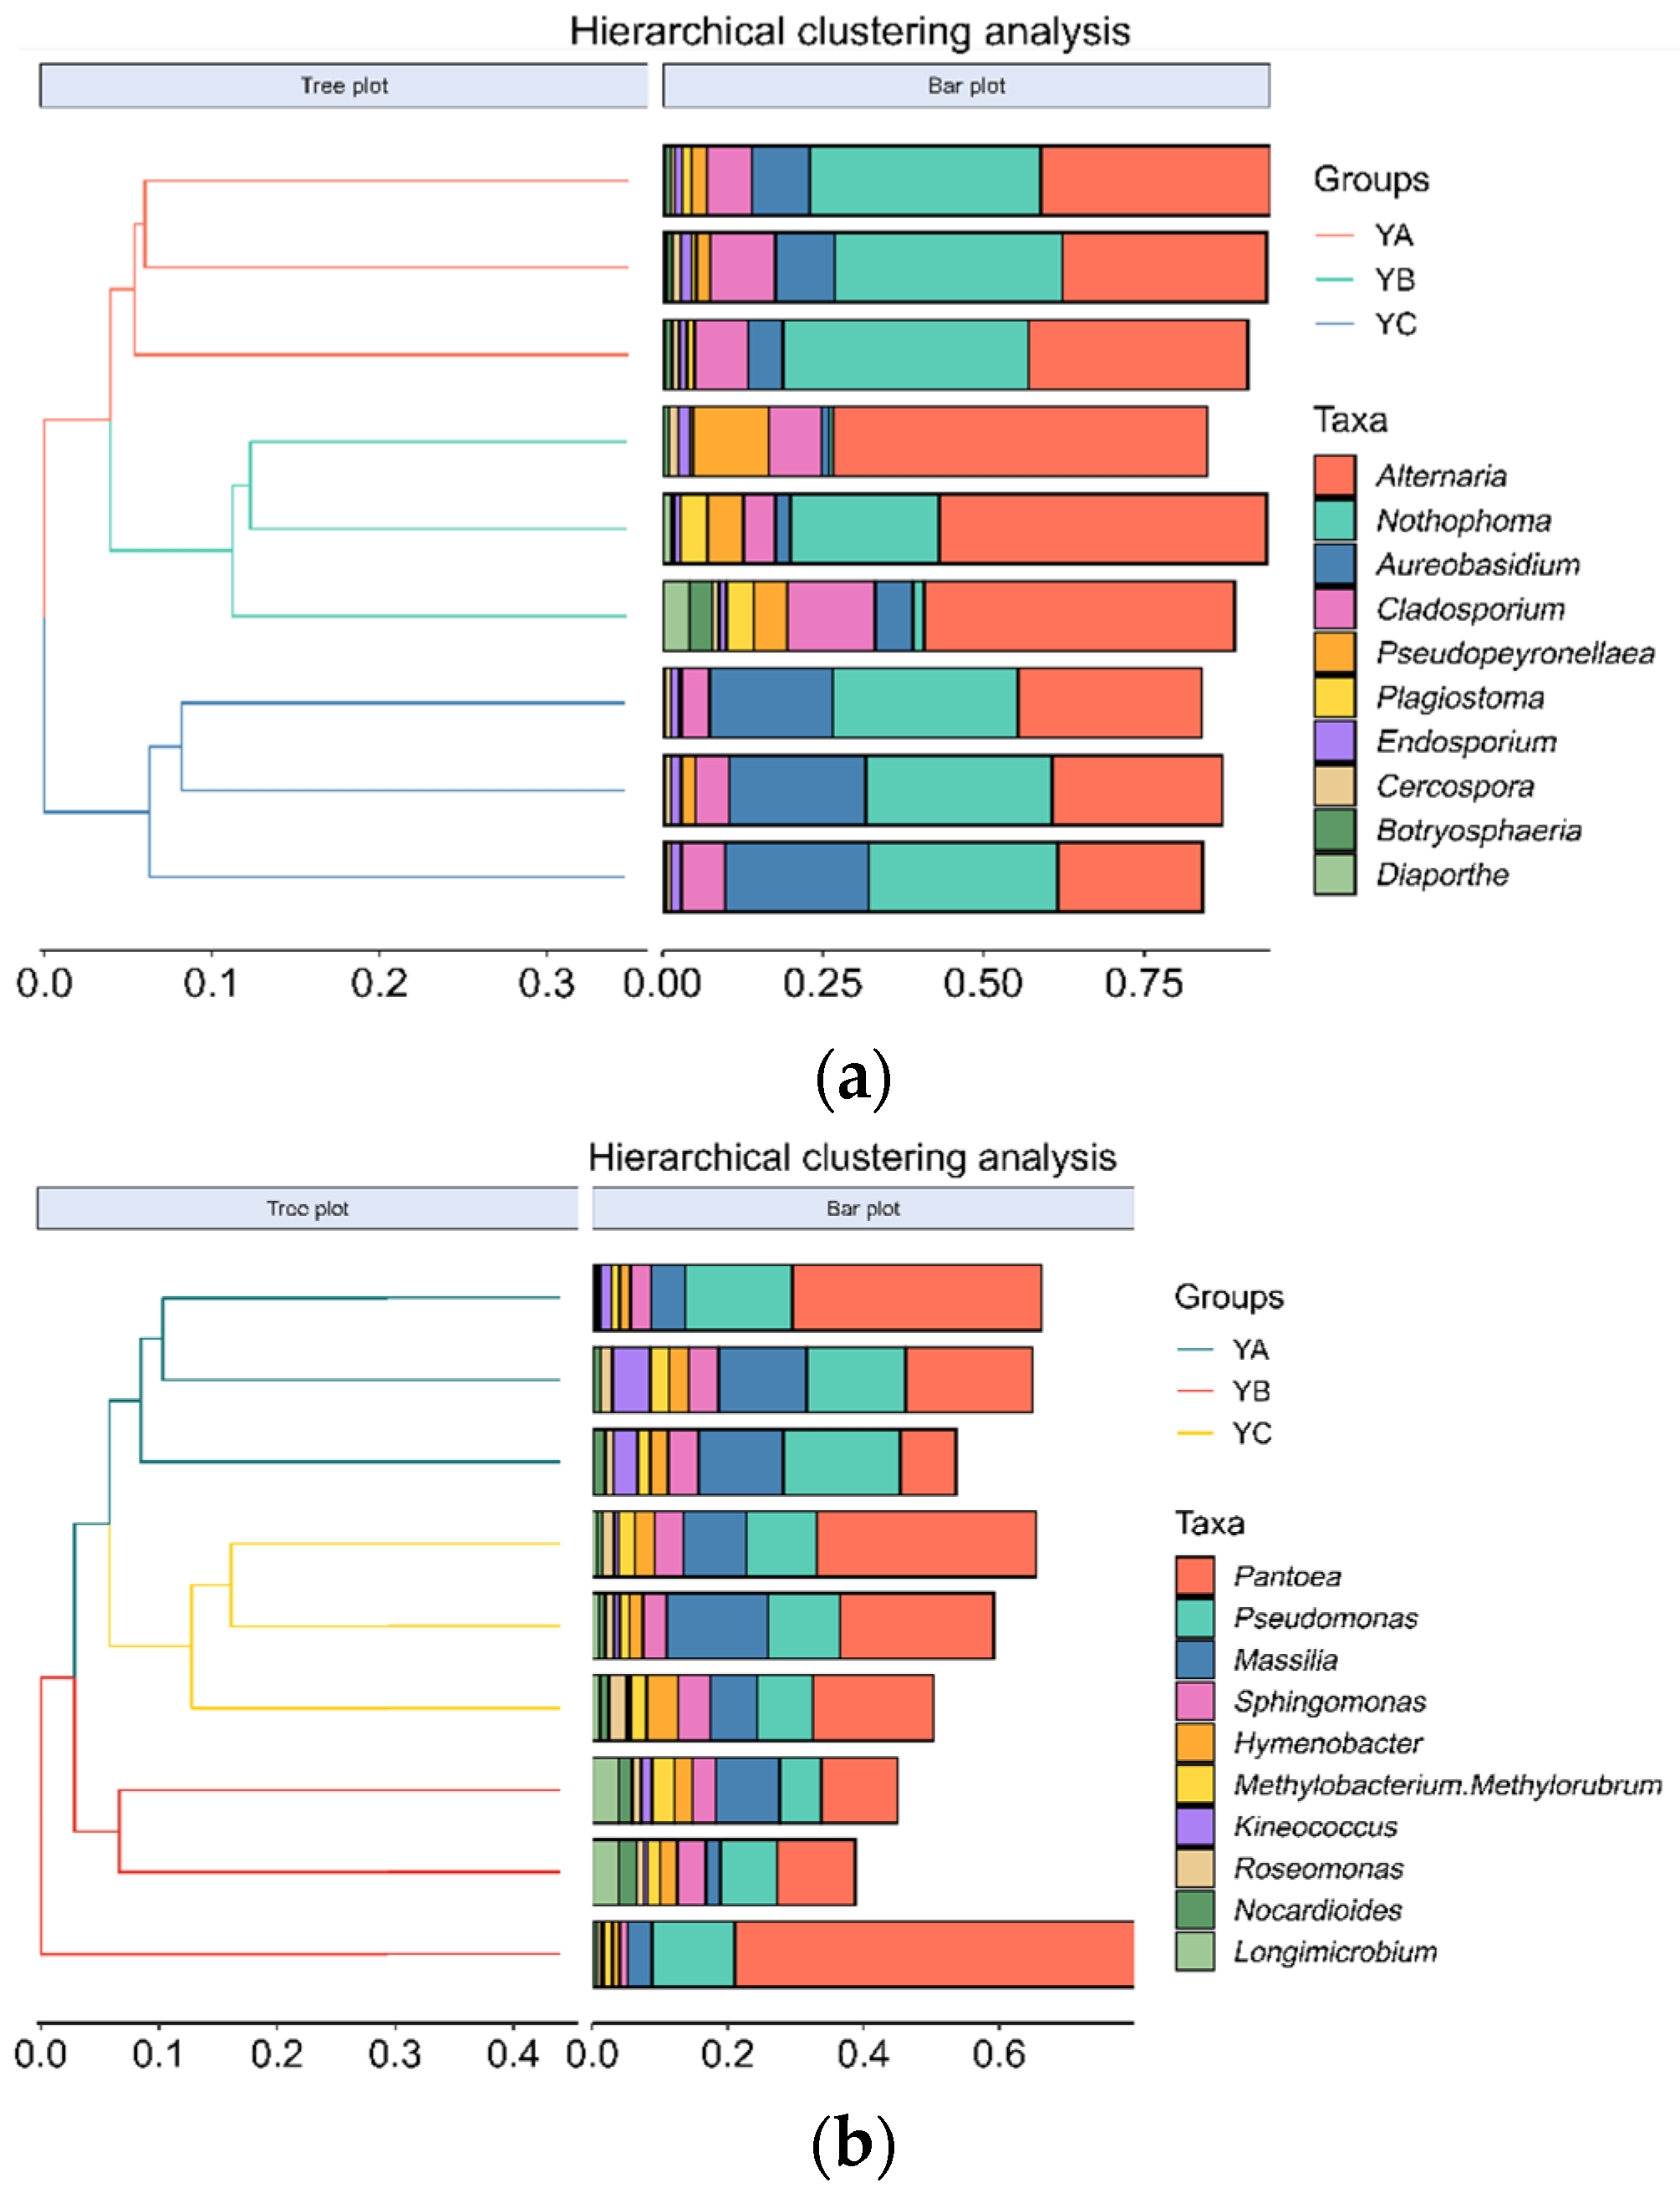
At the genus level, the top 10 fungal genera were identified, including Altemaria, Nothophoma, Aureobasidium, Cladosporium, Pseudopeyronellaea, and so on. Among them, Alternaria was the dominant phyllosphere community, and the group’s average relative abundance stood at 37.44%, followed by the Nothophoma and Aureobasidium, with an average relative abundance of 24.69% and 10.65%, respectively. The average relative abundance of Diaporthe was the lowest, which was 0.86%. The relative abundance of Alternaria in YB reached a peak at 52.52%. The highest proportion of Nothophom in YA was 36.53%, while YB had the lowest relative abundance at 8.50%. The relative abundance of Aureobasidium in YC was the highest (20.95%), and that in YB was the lowest (3.11%) (Figure 5a). YA, YB, and YC were divided into three groups by hierarchical clustering of the phylloshere fungal community (Figure 6a).
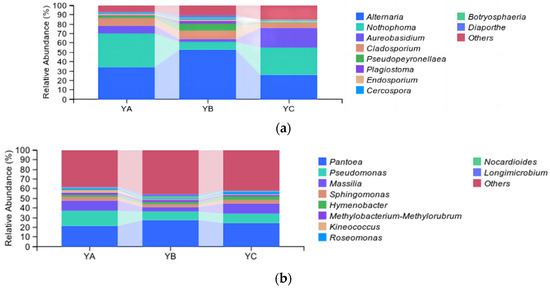
Figure 5.
Analysis of taxonomic composition at the genus level. (a) Analysis of fungal taxonomic composition at the genus level. (b) Analysis of bacterial taxonomic composition at the genus level.

Figure 6.
Hierarchical clustering analysis of phyllosphere microbial communities of different Populus spp. (at the genus level). (a) Hierarchical clustering analysis of phyllosphere fungal communities of different Populus spp. (b) Hierarchical clustering analysis of phyllosphere bacterial communities of different Populus spp.
At the genus level, the top 10 bacterial genera were identified, including Pantoea, Pseudomonas, Massilia, Sphingomonas, Hymenobacter, and so on. Among them, Pantoea stood out as the pre-eminent bacterial community, and the average relative abundance in the group was 24.23%, followed by Pseudomonas, with an average relative abundance of 11.5%. The relative abundance of Pantoea in YB was the highest, which was 27.19%, while it was the lowest in YA at 21.19%. The proportion of Pseudomonas was found to be the highest in YA (15.89%), while it exhibited the lowest occurrence in YB (8.90%) (Figure 5b). YA, YB, and YC were divided into three groups by hierarchical clustering of the phylloshere bacterial community (Figure 6b).
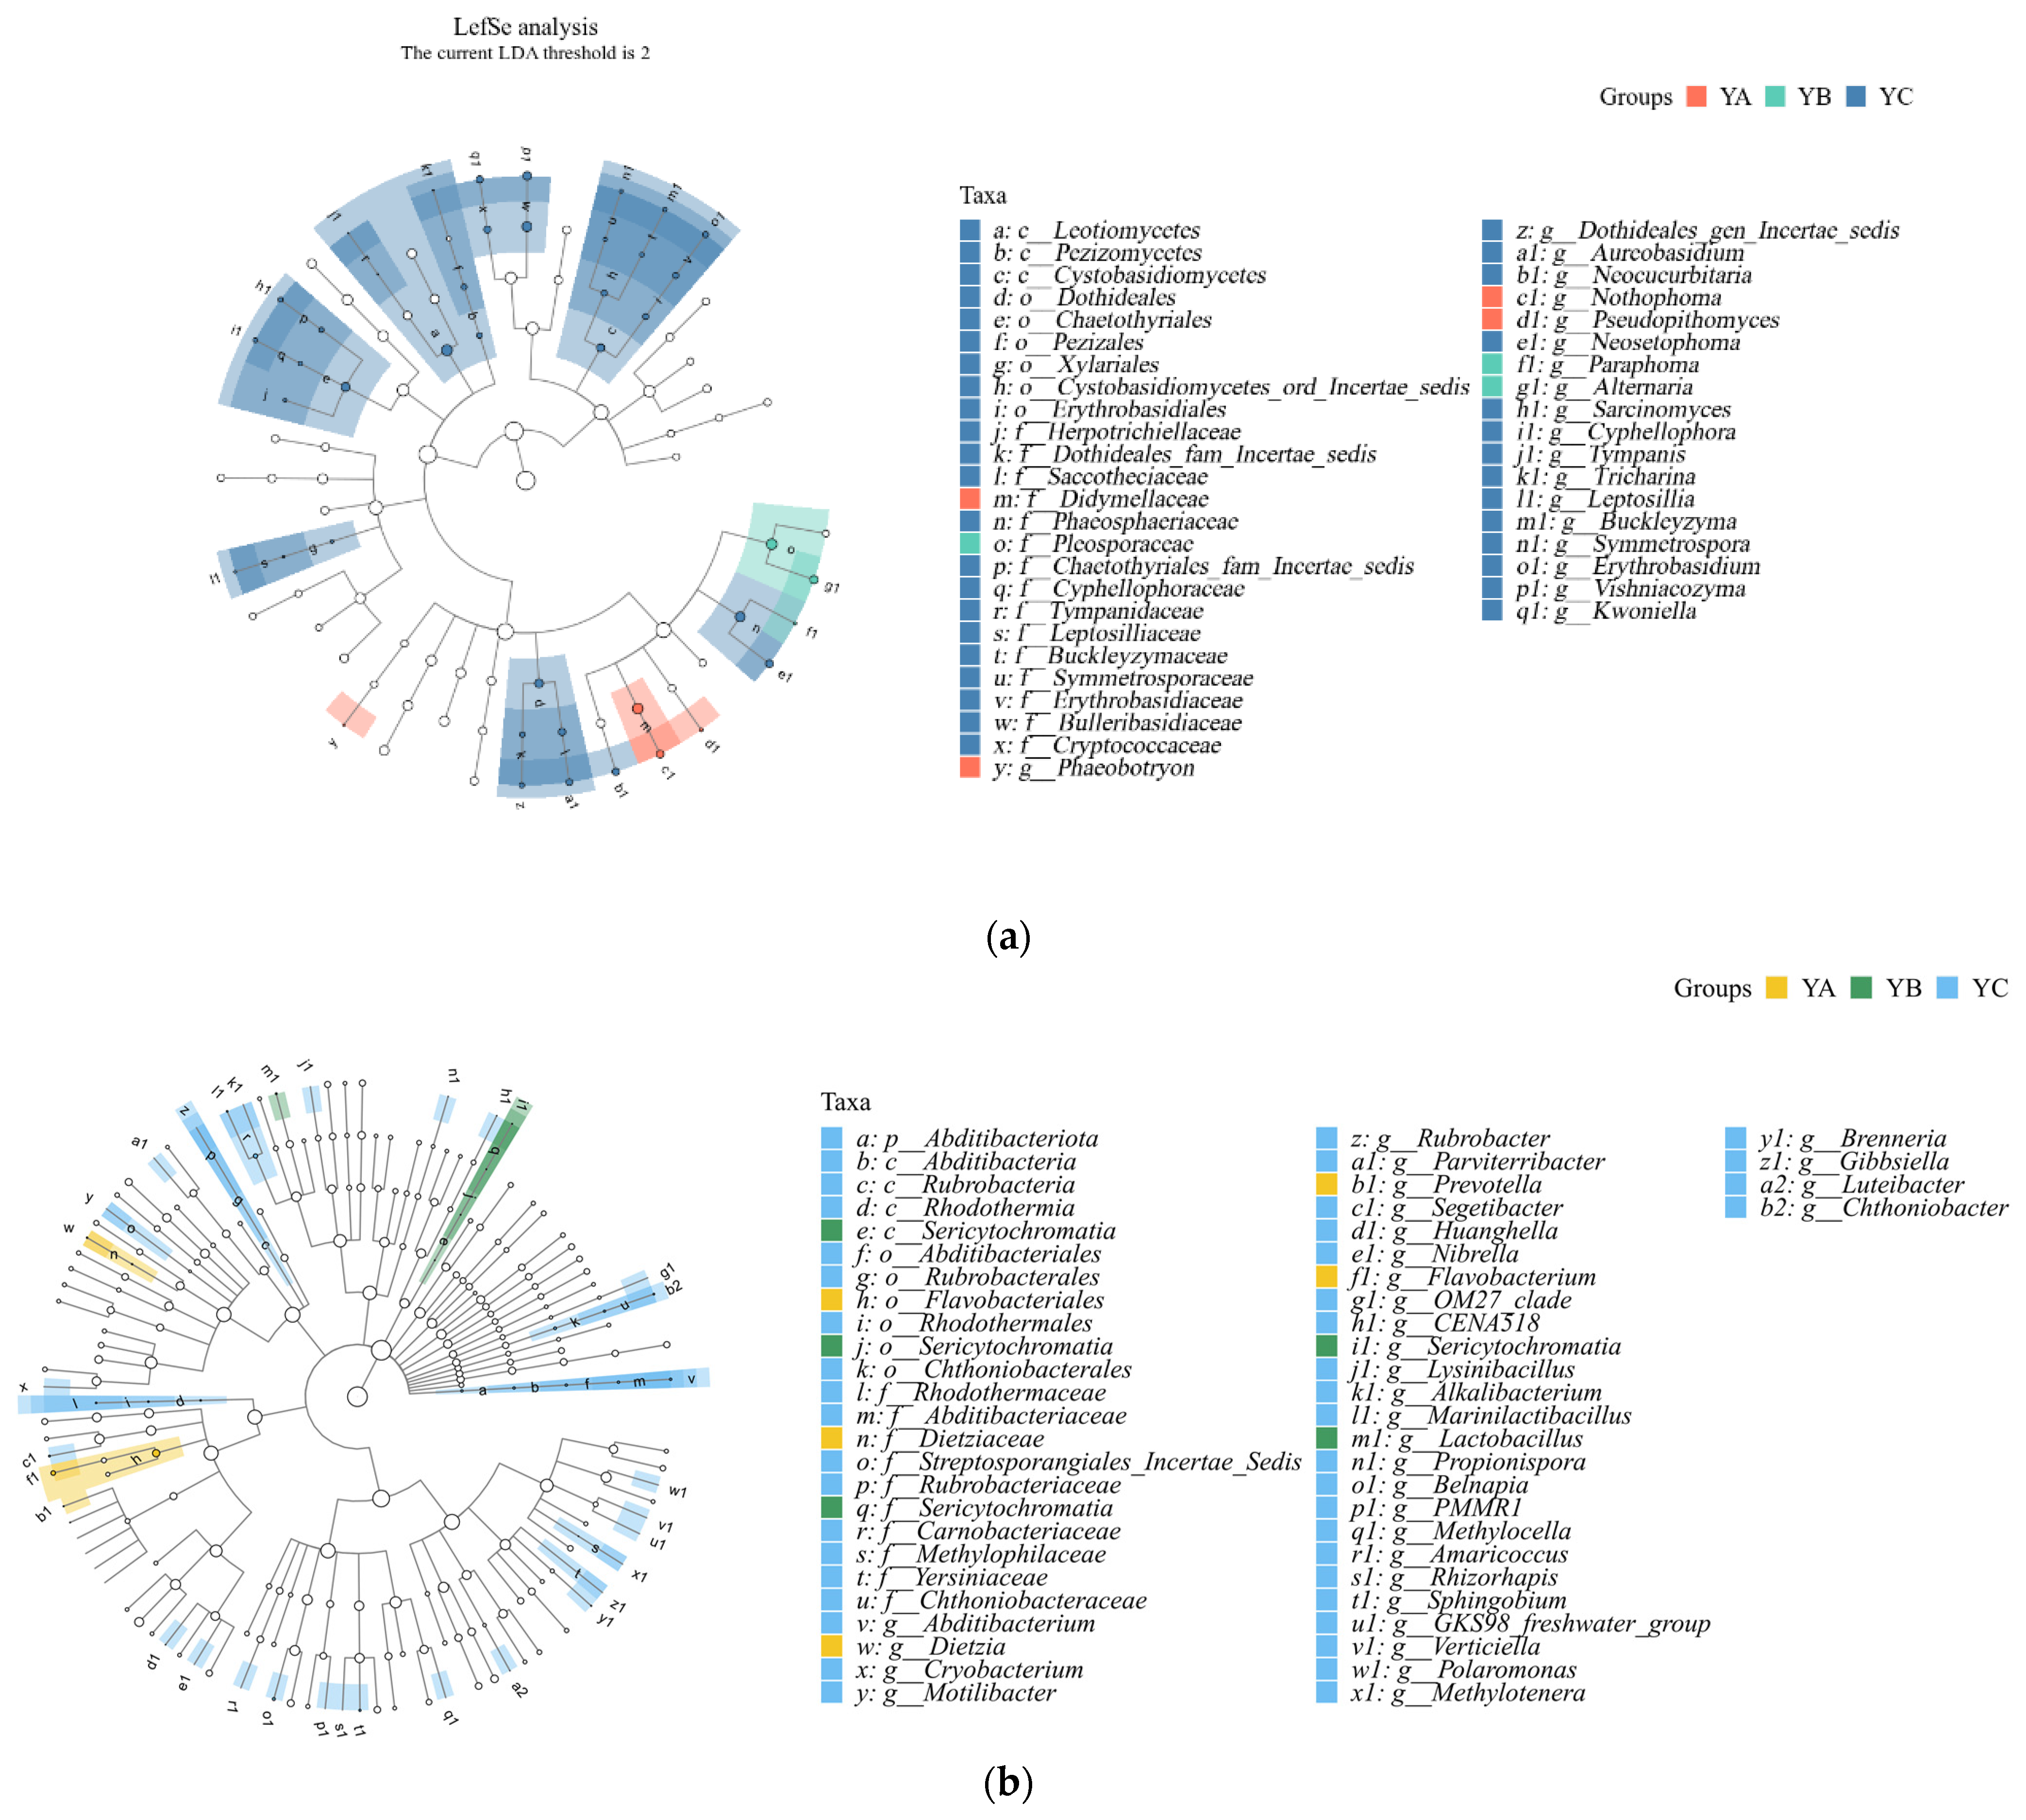
Among the fungal communities, Leotiomycetes, Didymellaceae, and Pleosporaceae were significantly different in YA, YB, and YC. YB exhibited a notable predominance of Pleosporaceae, while YC demonstrated a significant prevalence of Leotiomycetes. In terms of relative abundance, YA displayed the greatest occurrence of Didymellaceae (Figure 7a).

Figure 7.
LEFse analysis of phyllosphere fungal and bacterial community at the genus level. (a) LEFse analysis of phyllosphere fungal community at the genus level. (b) LEFse analysis of phyllosphere bacterial community at the genus level.
Among the bacterial communities, Abditibacyeriota, Sericytochromatia, and Flavobacteriales had significant differences in YA, YB, and YC. The relative abundance of Abditibacyeriota was the highest in YC. The relative abundance of Sericytochromatia was the highest in YB. Among the observed taxa, Flavobacteriales exhibited the highest relative abundance in YA (Figure 7b).
3.5. Correlation Analysis between the Composition Structure and Nutrient Content of Phyllosphere Fungal and Bacterial Communities in Different Varieties of Populus spp.
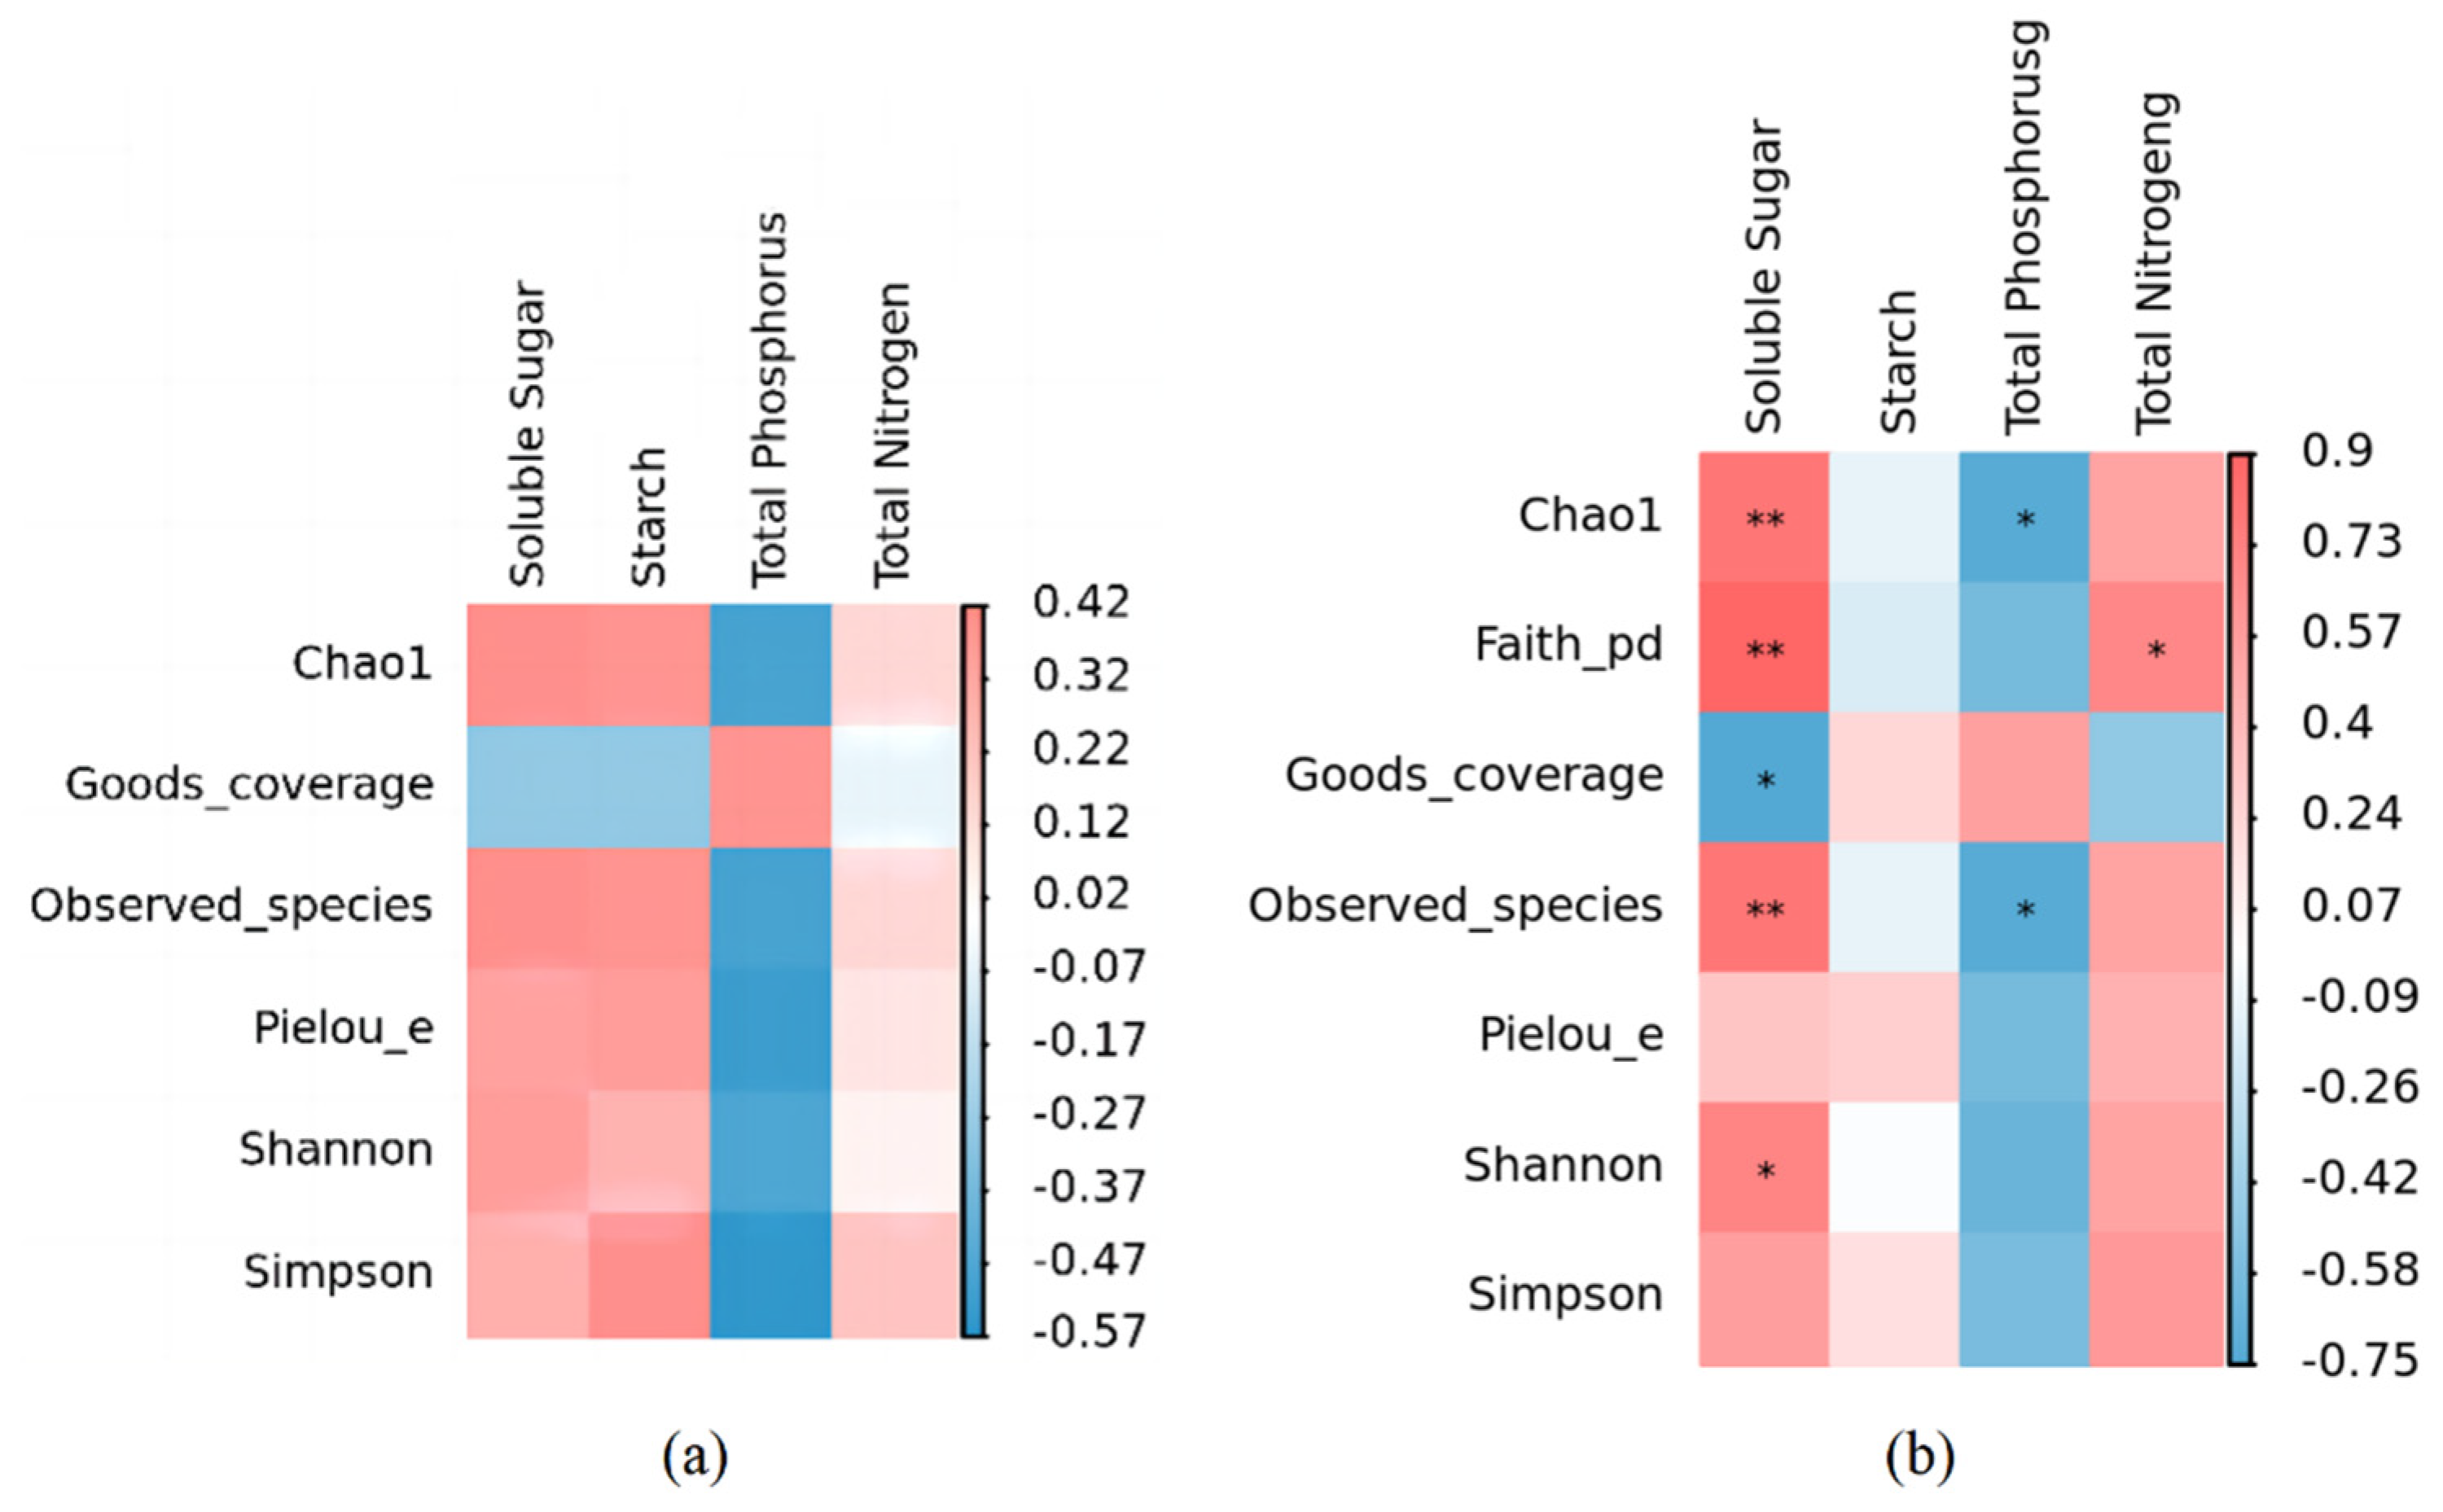
The α diversity index of the phyllosphere fungal community was affected by different leaf chemical properties, especially soluble sugar and total phosphorus content. In Figure 8a, although soluble sugar and total phosphorus contents did not show significant effects on the α diversity index of the phyllosphere fungal community, soluble sugar was positively correlated with Chao1, Observed_species, Pielou_e, Shannon, and Simpson, and there was a negative correlation with Goods_coverage. Phosphorus was negatively correlated with Chao1, Observed_species, Pielou_e, Shannon, and Simpson and positively associated with Goods_coverage. There was no notable association observed between the total nitrogen levels and α diversity index (Figure 8a).

Figure 8.
Correlation heatmap of leaf nutrient factors and α diversity of phyllosphere fungal and bacterial community. (a) Correlation heatmap of leaf nutrient factors and α diversity of phyllosphere fungal community. (b) Correlation heatmap of leaf nutrient factors and α diversity of phyllosphere bacterial community. * indicates that there is a significant correlation at the level of p < 0.05; ** indicates a significant correlation at the level of p < 0.01.
The analysis of correlations revealed that the physicochemical characteristics of leaves played a pivotal role in shaping the diversity of the bacterial community residing on leaf surfaces, known as the phyllosphere. Particularly, a notable positive association was observed between the soluble sugar content and the Chao1 index, Observed_species index, and Shannon index, while exhibiting a marked negative correlation with the Goods_coverage index. In contrast, total phosphorus exhibited a negative correlation with both the Chao1 index and Observed_species index but positively affected Goods Coverage. Conversely, starch did not exhibit any significant effect on these five indices (Figure 8b).
At the genus level, leaf nutrient content had a significant effect on the relative abundance of the phyllosphere fungal community. The content of soluble sugar in leaves was negatively correlated with Plagiostoma and Diaporthe, and positively correlated with Endosporium. Total phosphorus content was positively correlated with Plagiostoma and Diaporthe, while being negatively correlated with Endosporium. The total nitrogen content had a positive correlation with Endosporium. The relative abundance of fungal communities within the phyllosphere remained unaffected by variations in starch content (Figure 9a).
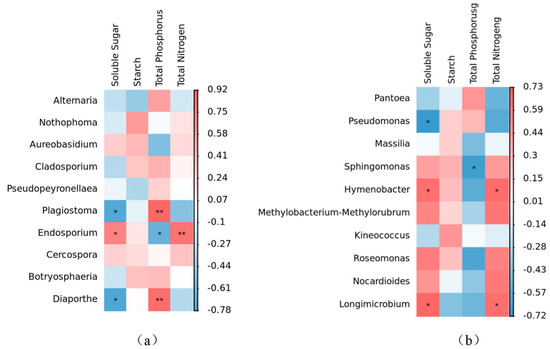
Figure 9.
Correlation heatmap of leaf nutrient factors and α diversity of phyllosphere fungal and bacterial community at genus level. (a) Correlation heatmap of leaf nutrient factors and α diversity of phyllosphere fungal community at genus level. (b) Correlation heatmap of leaf nutrient factors and α diversity of phyllosphere bacterial community at genus level. * signifies a statistically significant correlation at p < 0.05, whereas ** denotes an even stronger statistical significance at p < 0.01.
At the genus level, the bacterial genera were primarily influenced by leaf soluble sugar and total phosphorus. The relative abundance of Hymenobacter and Longimicrobium exhibited a noteworthy positive correlation with soluble sugar content. There was a significant negative correlation between phosphorus and the relative abundance of Sphingomonas. There was a significant positive correlation between total nitrogen and the relative abundance of Hymenobacter and Longimicrobium. It was worth noting that although starch content had no significant effect on the relative abundance of leaf bacterial genera, there was a positive correlation between starch content and the relative abundance of Sphingomonas, Hymenobacter, Pseudomonas, Massilia, and Kineococcus (Figure 9b).
4. Discussion
Previous studies have unequivocally demonstrated that the constituents of the phyllosphere microbial community exhibit a dynamic nature and that host plants, biogeography [33,42,43], seasonal changes [44], environmental pollution, and other factors are decisive factors for the composition and variety of the phyllosphere microbial community, as well as the potential functions of the phyllosphere microbial community [45,46]. The phyllosphere is an open ecological niche, and the dynamic microbial community is regulated by various factors. Distinct plant species exhibit variations in their physiological structures and the ecological niche of phyllosphere microorganisms, and plant genotype is considered to be one of the crucial factors for phyllosphere microbial colonization [47,48,49,50]. Host plant species crucially influence the composition and variety of the phyllosphere microbial community [51]. Radford and colleagues discovered insights into the bacterial community composition within pine tree leaf spaces through their thorough analysis, such that even within a larger geographical distance range, there is minimal differentiation of bacterial communities within the same plant species [30]. In this study, three types of poplar tree samples were used—Populus × Europeana cl. ‘64’, Populus × Europeana cv. ‘Guariento’, and Populus Cathayana × Canada “Xin lin 1” all originating from the same growth environment. However, variations were observed in the fungal and bacterial communities’ composition and organization among the three poplar samples. These results provide evidence that host plant species affect the composition and diversity of the phyllosphere microbial communities.
Variations in leaf microbial communities across diverse plant species may stem from disparities in leaf attributes [52], nutrient concentrations, and secondary metabolites of plants [53]. In an illustrative study, Kembel and colleagues (2014) [47] explored the impacts of 57 distinct host tree species on the characteristics of phyllosphere bacterial communities residing on leaves in Panama’s nascent tropical forests. Their findings revealed a pronounced association between the composition of leaf-associated microbial communities and various host attributes, encompassing wood density, specific leaf mass, leaf thickness, as well as nitrogen and phosphorus concentrations in leaves, along with tree growth and mortality rates [48]. Lajoie and his team (2020) conducted a quantitative assessment of the functional diversity of bacterial communities residing in the phyllosphere of 17 diverse tree species inhabiting the neotropical forests of Panama [8,49]. A pronounced relationship was discerned linking plant characteristics to the makeup of functional microbial consortia, exerting a substantial impact on various biological processes, including the synthesis and degradation of secondary metabolites, the generation of antibiotics, energy acquisition, and the relay of environmental cues, which facilitate the synchronization of microbial community functions with the trait gradients of their plant hosts. Bodenhausen et al. used plant mutants with altered leaf morphology and physiology of Arabidopsis thaliana to further enhance the contribution of plant traits to the formation of leaf microbial communities [54].
The diversity of leaf microbial communities is associated with multiple leaf properties, including leaf physicochemical properties. The results of this study indicate that there are differences in the physicochemical properties of three types of poplar leaves, including Total Nitrogen (f = 1.366, p = 0.300), Total Phosphorus (f = 16.193, p < 0.001), Soluble Sugar (f = 6.86, p = 0.006), and Starch (f = 4.052, p = 0.033) among YA, YB, and YC. Among them, the YA sample has the highest Total Nitrogen and Starch content, which are 0.68 g kg−1 and 586.56 mg g−1, respectively. The contents of Total Phosphorus and Soluble Sugar in the YB sample are the highest, which were 5.96 g kg−1 and 213.74 mg g−1, respectively (Table 1). Through the correlation analysis of the composition structure and nutrient content of phyllosphere microbial communities in different varieties of poplar, it can be found that the physicochemical properties of leaves (nitrogen, phosphorus, soluble sugars, and starch) are correlated with the composition and diversity of phyllosphere microbial communities (Figure 8 and Figure 9) [55]. In particular, soluble sugar, total nitrogen, and total phosphorus in leaves have significant effects on the α diversity and relative abundance of fungi and bacteria. The findings of this study indicate that the leaf characteristics are significantly influenced by different tree species, resulting in different host plants with different phyllosphere microbial communities. Previous studies have shown that geographic environment, climate change, host plants, human disturbance, and leaf nutrients all have an impact on the structure and diversity of phyllosphere microbial communities. The release of leaf nutrients provides the conditions for the growth of microorganisms. Leaf surface nutrients such as sugars and minerals may vary by tree species [56]. Through the analysis of the physicochemical properties and α diversity of phyllosphere fungi and bacteria, it is found that the content of leaf phosphorus and soluble sugar are the dominant factors affecting the variety of phyllosphere microbial communities. The element phosphorus is indispensable for the growth and development of plants [57]. and plays a major role in almost all ecological processes in plants. In many areas where soil nutrients are scarce, phosphorus is far more important to plants than nitrogen. As one of the 17 essential elements for plant growth, the proportion of dry weight of phosphorus in different plants varies from 0.05% to 0.5% [58]. Different host plants have different phosphorus content, which also confirms that host plants are the main factors affecting the diversity of phyllosphere microbial community and structure. Our experimental results support this idea. By determining the physical and chemical properties of the leaves, it was found that there were significant differences in the amount of phosphorus in the leaves of the three poplar species YA, YB, and YC. In addition, relevant studies also proved that the content of soluble sugar in leaves had a significant effect on the colonization of phyllosphere microorganisms, while starch had no significant correlation with the diversity and structure of phyllosphere microorganisms, which was similar to our findings. Therefore, we can conclude that the leaf starch content of the three poplar species YA, YB, and YC has no significant effect on the diversity and structure of the phyllosphere microbial communities, while the different phosphorus and soluble sugar contents of the three poplar species may be an essential reason for the differences in the phyllosphere microbial communities.

Table 1.
Variation in the chemical properties of the leaves of three species of Populus spp.
The high-throughput sequence analysis of DNA [59] shows that at the phylum level, Ascomycetes and Basidiomycetes are the dominant phyllosphere fungi; Cyanobacteria, Proteobacteria, and Actinomyces are the dominant phyllosphere bacteria, which is consistent with other studies [60]. The prevalence of Ascomycota is highest in the YB sample (98.40%), Basidiomycota is highest in the YC sample (2.57%), and lowest in the YB sample (1.14%) (Figure 5); the relative abundance of Cyanobacteria was the highest in YA (86.26%) and the lowest in YC (28.83%). The relative abundance of Proteobacteria is highest in YC (49.79%) and lowest in YA (11.24%) (Figure 5). The host plant has a filtering effect on microbial colonization [61], which means that the variation between different genotype species is significantly greater than that between individuals of the same species. However, it has been observed that there is a certain degree of similarity between the microbial communities in different leaf spaces, which reflects the correlation between the phylogeny of host plants and the microbial communities they inhabit [62,63]. In general, angiosperms usually contain Actinomyces and Gammaproteobacteria, while Bacteroidetes and beta-protein bacteria are common in the phyllosphere of gymnosperms.
5. Conclusions
In summary, it has been found that under identical site conditions, distinct poplar species exhibit diverse leaf characteristics, resulting in differences in phyllosphere microbial communities and structures, and the characteristics of the host species significantly affect the leaf characteristics. There are significant variations in the composition, relative abundance, and α diversity of the phyllosphere bacterial and fungal communities among the three poplar species in this study. The characteristics of plant leaves play a crucial role in shaping the structure and diversity of phyllosphere microbial communities (especially soluble sugar and phosphorus content). This study elucidated the association between leaf nutrient composition and phyllosphere microbial communities across diverse poplar varieties within a homogeneous stand environment, providing theoretical reference value for studying the dominant factors of microbial community structure differences and diversity among plant species.
Author Contributions
Conceptualization, R.W. and C.D.; methodology, W.Z. (Weixi Zhang); validation, X.C.; investigation, Y.G. and D.L.; resources, Z.P.; writing—original draft preparation, X.Y.; writing—review and editing, W.Z. (Wenxu Zhu); supervision, Y.P.; funding acquisition, C.D. All authors have read and agreed to the published version of the manuscript.
Funding
The funding for this research was provided by the National Key Research and Development Program of China (Grant No. 2021YFD2201205), the Basic Research Fund of CAF (Grant Nos. CAFYBB2023QB003 and CAFYBB2020SZ002), the National Natural Science Foundation of China (Grant No. 32271843).
Data Availability Statement
The raw high throughput sequencing data are assigned the NCBI database SRA accession numbers PRJNA1129515 (fungi) and PRJNA1129477 (bacteria).
Conflicts of Interest
Ms. Dan Li is employed by Liaoning Non-Ferrous Geological Exploration and Research Institute. The remaining authors declare that the research was conducted in the absence of any commercial or financial relationships that could be construed as a potential conflict of interest. The funders had no role in the design of the study; in the collection, analyses, or interpretation of data; in the writing of the manuscript; or in the decision to publish the results.
References
- Nelson, E.B. The seed microbiome: Origins, interactions, and impacts. Plant Soil. Int. J. Plant-Soil. Relatsh. 2018, 422, 7–34. [Google Scholar] [CrossRef]
- Reinhold-Hurek, B.; Bünger, W.; Burbano, C.S.; Sabale, M.; Hurek, T. Roots Shaping Their Microbiome: Global Hotspots for Microbial Activity. Annu. Rev. Phytopathol. 2015, 53, 403–424. [Google Scholar] [CrossRef]
- Ding, K.; Lv, W.Y.; Ren, H.Z.; Xiong, F.; Zhang, Y.T.; Zhang, J.H.; Tong, Z.K.; Wang, X.C.; Wang, Y.C. Small world but large differences: Cultivar-specific secondary metabolite-mediated phyllosphere fungal homeostasis in tea plant (Camellia sinensis). Plant Soil. 2024. [Google Scholar] [CrossRef]
- Vorholt, J.A. Microbial life in the phyllosphere. Nat. Rev. Microbiol. 2012, 10, 828–840. [Google Scholar] [CrossRef] [PubMed]
- del Carmen Orozco-Mosqueda, M.; del Carmen Rocha-Granados, M.; Glick, B.R.; Santoyo, G. Microbiome engineering to improve biocontrol and plant growth-promoting mechanisms. Microbiol. Res. 2018, 208, 25–31. [Google Scholar]
- Mendes, R.; Garbeva, P.; Raaijmakers, J.M. The rhizosphere microbiome: Significance of plant beneficial, plant pathogenic, and human pathogenic microorganisms. FEMS Microbiol. Rev. 2013, 37, 634–663. [Google Scholar] [CrossRef] [PubMed]
- Vandenkoornhuyse, P.; Quaiser, A.; Duhamel, M.; Le Van, A.; Dufresne, A. The importance of the microbiome of the plant holobiont. New Phytol. 2015, 206, 1196–1206. [Google Scholar] [CrossRef]
- Bashir, I.; War, A.F.; Rafiq, I.; Reshi, Z.A.; Rashid, I.; Shouche, Y.S. Phyllosphere microbiome: Diversity and functions. Microbiol. Res. 2022, 254, 126888. [Google Scholar]
- Morris, C.E.; Kinkel, L.L. Fifty years of phyllosphere microbiology: Significant contributions to research in related fields. Phyllosphere Microbiol. 2002. [Google Scholar]
- Lindow, S.E.; Brandl, M.T. Microbiology of the phyllosphere. Appl. Environ. Microbiol. 2003, 69, 1875–1883. [Google Scholar] [CrossRef] [PubMed]
- Bulgarelli, D.; Schlaeppi, K.; Spaepen, S.; Themaat, E.V.L.v.; Schulze-Lefert, P. Structure and Functions of the Bacterial Microbiota of Plants. Annu. Rev. Plant Biol. 2013, 64, 807–838. [Google Scholar] [CrossRef] [PubMed]
- Guttman, D.S.; McHardy, A.C.; Schulze-Lefert, P. Microbial genome-enabled insights into plant-microorganism interactions., Microbial genome-enabled insights into plant-microorganism interactions. Nat. Rev. Genet. 2014, 15, 797–813. [Google Scholar] [CrossRef] [PubMed]
- Kishore, G.K.; Pande, S.; Podile, A.R. Biological Control of Late Leaf Spot of Peanut (Arachis hypogaea) with Chitinolytic Bacteria. Phytopathology 2005, 95, 1157–1165. [Google Scholar] [CrossRef] [PubMed]
- Ab Razak, N.; Gange, A.C.; Currie, A.F.; Sutton, B.C.; Mansor, A. Factors affecting the foliar endophyte community in the invasive weed, Impatiens glandulifera. Fungal Ecol. 2024, 70, 101356. [Google Scholar] [CrossRef]
- Krimm, U.; Abanda-Nkpwatt, D.; Schwab, W.; Schreiber, L. Epiphytic microorganisms on strawberry plants (Fragaria ananassa cv. Elsanta): Identification of bacterial isolates and analysis of their interaction with leaf surfaces. FEMS Microbiol. Ecol. 2005, 53, 483–492. [Google Scholar] [CrossRef] [PubMed]
- Burch, A.Y.; Browne, P.J.; Dunlap Christopher, A.; Price, N.P.; Lindow, S.E. Comparison of biosurfactant detection methods reveals hydrophobic surfactants and contact-regulated production. Environ. Microbiol. 2011, 13, 2681–2691. [Google Scholar] [CrossRef] [PubMed]
- Hacquard, S.; Wang, E.; Slater, H.; Martin, F. Impact of global change on the plant microbiome. Spec. Issue 2022, 234, 1907–1909. [Google Scholar] [CrossRef] [PubMed]
- Romero, F.M.; Marina, M.; Pieckenstain, F.L. Novel components of leaf bacterial communities of field-grown tomato plants and their potential for plant growth promotion and biocontrol of tomato diseases. Res. Microbiol. 2016, 167, 222–233. [Google Scholar] [CrossRef]
- Chen, T.; Nomura, K.; Wang, X.; Sohrabi, R.; Xu, J.; Yao, L.; Paasch, B.C.; Ma, L.I.; Kremer, J.; Cheng, Y.; et al. A plant genetic network for preventing dysbiosis in the phyllosphere. Nature 2020, 580, 653–657. [Google Scholar] [CrossRef]
- Trivedi, P.; Leach, J.E.; Tringe, S.G.; Sa, T.; Singh, B.K. Author Correction: Plant-microbiome interactions: From community assembly to plant health. Nat. Rev. Microbiol. 2020, 19, 72. [Google Scholar] [CrossRef]
- Ma, B. Research progress on soil microbial diversity technology. In Second International Conference on Biological Engineering and Medical Science (ICBioMed 2022); SPIE: Bellingham, WA, USA, 2023; Volume 12611, pp. 22–28. [Google Scholar]
- Li, P.; Wu, X.J.; Gao, F. Ozone pollution, water deficit stress and time drive poplar phyllospheric bacterial community structure. Ecotoxicol. Environ. Saf. 2023, 262, 115148. [Google Scholar] [CrossRef] [PubMed]
- Dinu, L.D.; Bach, S. Induction of viable but nonculturable Escherichia coli O157:H7 in the phyllosphere of lettuce: A food safety risk factor. Appl. Environ. Microbiol. 2011, 77, 8295–8302. [Google Scholar] [CrossRef] [PubMed]
- Gal, M.; Preston, G.M.; Massey, R.C.; Spiers, A.J.; Rainey, P.B. Genes encoding a cellulosic polymer contribute toward the ecological success of Pseudomonas fluorescens SBW25 on plant surfaces. Mol. Ecol. 2003, 12, 3109–3121. [Google Scholar] [CrossRef] [PubMed]
- Baldotto, L.E.B.; Olivares, F.L. Phylloepiphytic interaction between bacteria and different plant species in a tropical agricultural system. Can. J. Microbiol. 2008, 54, 918–931. [Google Scholar] [CrossRef]
- Schreiber, L.; Krimm, U.; Knoll, D.; Sayed, M.; Auling, G.; Kroppenstedt, R.M. Plant-microbe interactions: Identification of epiphytic bacteria and their ability to alter leaf surface permeability. New Phytol. 2005, 166, 589–594. [Google Scholar] [CrossRef] [PubMed]
- Helfrich, E.J.N.; Vogel, C.M.; Ueoka, R.; Schäfer, M.; Ryffel, F.; Müller, D.B.; Probst, S.; Kreuzer, M.; PIEL, J.; Vorholt, J.A. Bipartite interactions, antibiotic production and biosynthetic potential of the Arabidopsis leaf microbiome. Nat. Microbiol. 2018, 3, 909–919. [Google Scholar] [CrossRef]
- Fürnkranz, M.; Wanek, W.; Richter, A.; Abell, G.; Rasche, F.; Sessitsch, A. Nitrogen fixation by phyllosphere bacteria associated with higher plants and their colonizing epiphytes of a tropical lowland rainforest of Costa Rica. ISME J. 2008, 2, 561–570. [Google Scholar] [CrossRef] [PubMed]
- Meyer, K.M.; Leveau, J.H.J. Microbiology of the phyllosphere: A playground for testing ecological concepts. Oecologia 2012, 168, 621–629. [Google Scholar] [CrossRef] [PubMed]
- Redford, A.J.; Bowers, R.M.; Knight, R.; Linhart, Y.; Fierer, N. The ecology of the phyllosphere: Geographic and phylogenetic variability in the distribution of bacteria on tree leaves. Environ. Microbiol. 2010, 12, 2885–2893. [Google Scholar] [CrossRef]
- Bálint, M.; Tiffin, P.; Hallström, B.; O’Hara, R.B.; Olson, M.S.; Fankhauser, J.D.; Piepenbring, M.; Schmitt, I. Host genotype shapes the foliar fungal microbiome of balsam poplar (Populus balsamifera). PLoS ONE 2018, 8, e53987. [Google Scholar] [CrossRef]
- Finkel, O.; Burch, A.; Lindow, S.E.; Post, A.F.; Belkin, S. Geographical location determines the population structure in phyllosphere microbial communities of a salt-excreting desert tree. Appl. Environ. Microbiol. 2011, 77, 7647–7655. [Google Scholar] [CrossRef]
- Rastogi, G.; Sbodio, A.; Tech, J.J.; Suslow, T.V.; Coaker, G.L.; Leveau, J.H.J. Leaf microbiota in an agroecosystem: Spatiotemporal variation in bacterial community composition on field-grown lettuce. ISME J. 2012, 6, 1812–1822. [Google Scholar] [CrossRef] [PubMed]
- Finkel, O.M.; Burch, A.Y.; Elad, T.; Huse, S.M.; Lindow, S.E.; Post, A.F.; Belkin, S. Distance-Decay Relationships Partially Determine Diversity Patterns of Phyllosphere Bacteria on Tamarix Trees across the Sonoran Desert Appl. Environ. Microbiol. 2012, 78, 7818. [Google Scholar] [CrossRef]
- Hardoim, P.R.; Van Overbeek, L.S.; Berg, G.; Pirttilä, A.M.; Compant, S.; Campisano, A.; Döring, M.; Sessitsch, A. The Hidden World within Plants: Ecological and Evolutionary Considerations for Defining Functioning of Microbial Endophytes. Microbiol. Mol. Biol. Rev. MMB 2015, 79, 293–320. [Google Scholar] [CrossRef] [PubMed]
- Koskimäki, J.J.; Pirttilä, A.M.; Ihantola, E.L.; Halonen, O.; Frank, A.C. The intracellular Scots pine shoot symbiont Methylobacterium extorquens DSM13060 aggregates around the host nucleus and encodes eukaryote-like proteins. mBio 2015, 6, e00039-15. [Google Scholar]
- Bodenhausen, N.; Horton, M.W.; Bergelson, J. Bacterial communities associated with the leaves and the roots of Arabidopsis thaliana. PLoS ONE 2018, 8, e56329. [Google Scholar] [CrossRef] [PubMed]
- Osono, T.; Bhatta, B.K.; Takeda, H. Phyllosphere fungi on living and decomposing leaves of giant dogwood. Mycoscience 2004, 45, 35–41. [Google Scholar] [CrossRef]
- Whipps, J.M.; Hand, P.; Pink, D.; Bending, G.D. Phyllosphere microbiology with special reference to diversity and plant genotype. J. Appl. Microbiol. 2008, 105, 1744–1755. [Google Scholar] [CrossRef]
- Du, Y.; Zhao, Q.; Chen, L.; Yao, X.; Zhang, W.; Zhang, B.; Xie, F. Effect of drought stress on sugar metabolism in leaves and roots of soybean seedlings. Plant Physiol. Biochem. 2020, 146, 1–12. [Google Scholar] [CrossRef]
- Li, Q.; Song, X.; Chang, S.X.; Peng, C.; Xiao, W.; Zhang, J.; Xiang, W.; Li, Y.; Wang, W. Nitrogen depositions increase soil respiration and decrease temperature sensitivity in a Moso bamboo forest. Agric. For. Meteorol. 2019, 268, 48–54. [Google Scholar] [CrossRef]
- Knief, C.; Ramette, A.; Frances, L.; Alonso-Blanco, C.; Vorholt, J.A. Site and plant species are important determinants of the Methylobacterium community composition in the plant phyllosphere. ISME J. 2010, 4, 719–728. [Google Scholar] [CrossRef]
- Stone, B.W.G.; Jackson, C.R. Biogeographic Patterns Between Bacterial Phyllosphere Communities of the Southern Magnolia (Magnolia grandiflora) in a Small Forest. Microb. Ecol. 2016, 71, 954–961. [Google Scholar] [CrossRef] [PubMed]
- Copeland, J.K.; Yuan, L.J.; Layeghifard, M.; Wang, P.W.; Guttman, D.S. Seasonal community succession of the phyllosphere microbiome. Mol. Plant-Microbe Interact. MPMI 2015, 28, 274–285. [Google Scholar] [CrossRef] [PubMed]
- Qian, X.; Li, S.C.; Wu, B.W.; Wang, Y.L.; Ji, N.N.; Yao, H.; Cai, H.Y.; Shi, M.M.; Zhang, D.X. Mainland and island populations of Mussaenda kwangtungensis differ in their phyllosphere fungal community composition and network structure. Sci. Rep. 2020, 10, 952. [Google Scholar] [CrossRef] [PubMed]
- Bao, L.; Gu, L.; Sun, B.; Cai, W.; Zhang, S.; Zhuang, G.; Bai, Z.; Zhuang, X. Seasonal variation of epiphytic bacteria in the phyllosphere of Gingko biloba, Pinus bungeana and Sabina chinensis. FEMS Microbiol. Ecol. 2020, 96, fiaa017. [Google Scholar] [CrossRef] [PubMed]
- Kembel, S.W.; O’Connor, T.K.; Arnold, H.K.; Hubbell, S.P.; Wright, S.J.; Green, J.L. Relationships between phyllosphere bacterial communities and plant functional traits in a neotropical forest. Proc. Natl. Acad. Sci. USA 2014, 111, 13715–13720. [Google Scholar] [CrossRef] [PubMed]
- Leveau, J.H. A from the leaf: Latest research to inform our understanding of the phyllosphere microbiome. Curr. Opin. Microbiol. 2019, 49, 41–49. [Google Scholar] [CrossRef]
- Lajoie, G.; Maglione, R.; Kembel, S.W. Adaptive matching between phyllosphere bacteria and their tree hosts in a neotropical forest. Microbiome 2020, 8, 70. [Google Scholar] [CrossRef] [PubMed]
- Wagner, M.R.; Lundberg, D.S.; del Rio, T.G.; Tringe, S.G.; Dangl, J.L.; Mitchell-Olds, T. Host genotype and age shape the leaf and root microbiomes of a wild perennial plant. Nat. Commun. 2016, 7, 12151. [Google Scholar] [CrossRef] [PubMed]
- Cordier, T.; Robin, C.; Capdevielle, X.; Desprez-Loustau, M.L.; Vacher, C. Spatial variability of phyllosphere fungal assemblages: Genetic distance predominates over geographic distance in a European beech stand (Fagus sylvatica). Fungal Ecol. 2012, 5, 509–520. [Google Scholar] [CrossRef]
- Yadav, R.K.P.; Karamanoli, K.; Vokou, D. Bacterial colonization of the phyllosphere of mediterranean perennial species as influenced by leaf structural and chemical features. Microb. Ecol. 2005, 50, 185–196. [Google Scholar] [CrossRef]
- Ruppel, S.; Krumbein, A.; Schreiner, M. Composition of the phyllospheric microbial populations on vegetable plants with different glucosinolate and carotenoid compositions. Microb. Ecol. 2008, 56, 364–372. [Google Scholar] [CrossRef] [PubMed]
- Bodenhausen, N.; Bortfeld-Miller, M.; Ackermann, M.; Vorholt, J.A. A synthetic community approach reveals plant genotypes affecting the phyllosphere microbiota. PLoS Genet. 2014, 10, e1004283. [Google Scholar] [CrossRef] [PubMed]
- Kembel, S.W.; Mueller, R.C. Plant traits and taxonomy drive host associations in tropical phyllosphere fungal communities. Botany 2014, 92, 303–311. [Google Scholar] [CrossRef]
- Sivakumar, N.; Sathishkumar, R.; Selvakumar, G.; Shyamkumar, R.; Arjunekumar, K. Phyllospheric microbiomes: Diversity, ecological significance and biotechnological applications. Nat. Public Health Emerg. Collect. 2020, 25, 113–172. [Google Scholar]
- Lu, Z.Y.; Wang, Y.Y.; Degryse, F.; Hang, C.D.; Hou, C.H.; Wu, L.Q.; Jiang, R.F.; Mclaughlin, M.J.; Zhang, F.S. Magnesium-fortified phosphate fertilizers improve nutrient uptake and plant growth without reducing phosphorus availability. Pedosphere 2022, 32, 744–751. [Google Scholar] [CrossRef]
- Konvalinková, T.; Püschel, D.; Řezáčová, V.; Gryndlerová, H.; Jansa, J. Carbon flow from plant to arbuscular mycorrhizal fungi is reduced under phosphorus fertilization. Plant Soil 2017, 419, 319–333. [Google Scholar] [CrossRef]
- Rastogi, G.; Coaker, G.L.; Leveau, J. New insights into the structure and function of phyllosphere microbiota through high-throughput molecular approaches. Fems Microbiol. Lett. 2013, 348, 1–10. [Google Scholar] [CrossRef] [PubMed]
- Delmotte, N.; Knief, C.; Chaffron, S.; Innerebner, G.; Roschitzki, B.; Schlapbach, R.; von Mering, C.; Vorholt, J.A. Community proteogenomics reveals insights into the physiology of phyllosphere bacteria. Proc. Natl. Acad. Sci. USA 2009, 106, 16428–16433. [Google Scholar] [CrossRef]
- Steinauer, K.; Tilman, D.; Wragg, P.D.; Cesarz, S.; Cowles, J.M.; Pritsch, K.; Reich, P.B.; Weisser, W.W.; Eisenhauer, N. Plant diversity effects on soil microbial functions and enzymes are stronger than warming in a grassland experiment. Ecology 2015, 96, 99–112. [Google Scholar] [CrossRef]
- Xiong, C.; Zhu, Y.G.; Wang, J.T.; Singh, B.; Han, L.L.; Shen, J.P.; Li, P.P.; Wang, G.B.; Wu, C.F.; Ge, A.H.; et al. Host selection shapes crop microbiome assembly and network complexity. New Phytol. 2020, 229, 1091–1104. [Google Scholar] [CrossRef]
- Kim MinCheol, K.M.; Dharmesh Singh, D.S.; Ang LaiHoe, A.L.; Go RuSea, G.R.; Raha Abdul Rahim, R.A.R.; Ainuddin, A.N.; Chun JongSik, C.J.; Adams, J.M. Distinctive phyllosphere bacterial communities in tropical trees. Microb. Ecol. 2012, 63, 674–681. [Google Scholar] [PubMed]


Disclaimer/Publisher’s Note: The statements, opinions and data contained in all publications are solely those of the individual author(s) and contributor(s) and not of MDPI and/or the editor(s). MDPI and/or the editor(s) disclaim responsibility for any injury to people or property resulting from any ideas, methods, instructions or products referred to in the content. |
© 2024 by the authors. Licensee MDPI, Basel, Switzerland. This article is an open access article distributed under the terms and conditions of the Creative Commons Attribution (CC BY) license (https://creativecommons.org/licenses/by/4.0/).