Article

Study on the Influencing Factors of Forest Tree-Species Classification Based on Landsat and Sentinel-2 Imagery

1
College of Geomatics and Geoinformation, Guilin University of Technology, No. 12 Jian’gan Road, Guilin 541006, China
2
Guangxi Forest Inventory & Planning Institute, No. 14 Zhonghua Road, Nanning 530011, China
*
Author to whom correspondence should be addressed.
Forests 2024, 15(9), 1511; https://doi.org/10.3390/f15091511
Submission received: 24 July 2024 / Revised: 25 August 2024 / Accepted: 27 August 2024 / Published: 29 August 2024
(This article belongs to the Section Forest Inventory, Modeling and Remote Sensing)

Abstract

:
Accurate forest tree-species classification not only provides data support for forest resource management but also serves as a crucial parameter for simulating various ecological processes. However, the results of forest tree-species classification have been affected by multiple factors, such as the spectral resolution, spatial resolution, and radiometric resolution of imagery, the classification algorithms used, the sample size, and the timing of image acquisition phases. Although there are many studies on the impact of individual factors on tree-species classification, there is a lack of systematic studies quantifying the magnitude of these factors’ influences, leading to uncertainties about the relative importance of different factors. In this study, Landsat-8, Landsat-9, and Sentinel-2 imagery was used as the foundational data, and random forest (RF), gradient tree boosting (GTB), and support vector machine (SVM) algorithms were employed to classify forest tree species. High-accuracy regional forest tree-species classification was achieved by exploring the impacts of spectral resolution, spatial resolution, radiometric resolution, classification algorithms, sample size, and image time phases. The results show that, for the commonly used Landsat-8, Landsat-9, and Sentinel-2 imagery, the tree-species classification results from Landsat-9 are the best, with an overall accuracy of 74.21% and a kappa of 0.71. Among the various influencing factors, the classification algorithm, image time phases, and sample size have relatively larger impacts on tree-species classification results, each exceeding 10%, while the positive impact of radiometric resolution is the smallest, at only 3.15%. Conversely, spectral and spatial resolutions had negative effects on tree-species classification results, at −4.09% and −1.4%, respectively. Based on the 30-m spring Landsat-9 and Sentinel-2 imagery, with 300 samples for each tree-species category, the classification results using the RF algorithm were the best, with an overall accuracy of 87.07% and a kappa coefficient of 0.85. The results indicate that different factors have different impacts on forest tree-species classification results, with classification algorithms, image time phases, and sample size having the largest impacts. Higher spatial and spectral resolutions do not improve the classification accuracy. Therefore, future studies should focus on selecting appropriate classification algorithms, sample sizes, and images from seasons with greater tree differences to improve tree-species classification results.

1. Introduction

Forests are essential to terrestrial ecosystems, supporting worldwide climate conditions’ regulation, preserving biodiversity, maintaining ecological balance, and contributing to the planetary carbon and water cycles [1]. Forest species are essential for characterizing forest ecosystems, serving as critical foundations for forest planning, design, and management and as key inputs for simulating various ecological processes [2]. Accurately classifying tree species across extensive forest areas is crucial for the scientific management and optimal utilization of forest resources [3,4]. Traditional data on forest tree species are mostly derived from field surveys, which, while accurate, are costly, time-consuming, and challenging to replicate across large areas [5]. The progress in satellite remote-sensing technology has successfully addressed the limitations of traditional field surveys and is now widely utilized in forest-resource inventories and tree-species classification studies [6,7]. For example, Welle et al. [8] utilized time-series Sentinel-2 imagery and the XGBoost algorithm to classify dominant tree species in Germany, resulting in weighted average F1 scores ranging from 0.77 to 0.91 for broadleaf species such as beech, oak, larch, and other broadleaves and from 0.85 to 0.94 for coniferous species like spruce, pine, and Douglas fir. The classification results exhibited good consistency with national forest inventory data. Walsh [9] used Landsat-1 imagery to classify and identify 12 land-cover types (including seven coniferous species) in Crater Lake National Park, Oregon, achieving an average accuracy of 88.8%. Wessel et al. [10] conducted tree-species classification in two forest areas of Germany using Sentinel-2 imagery, achieving the best classification accuracy of 91%. These studies show that Landsat and Sentinel-2 satellite imagery is the most commonly used optical satellite data for classifying forest tree species due to their worldwide coverage, publicly available and free data [11], and high data quality. Although Landsat and Sentinel-2 imagery is important an data source for the large-area classification of forest tree species, there are certain differences between the two data sources in terms of their spectral, spatial, and radiometric resolution [12,13]. For instance, Landsat-8 and Landsat-9 have a spatial resolution of 30 m and 11 spectral bands. The radiometric resolution of Landsat-8 is 12-bit, while the radiometric resolution of Landsat-9 is 14-bit. Sentinel-2 has spatial resolutions of 10 m, 20 m, and 60 m, with 13 spectral bands and a radiometric resolution of 14-bit. To further select suitable data sources for the classification of forest tree species, it is imperative to conduct a comparative analysis of the classification results derived from the commonly used Landsat and Sentinel-2.
The classification of forest tree-species results is determined not solely via the spectral, spatial, and radiometric resolutions of the imagery but also through a multitude of factors, such as the temporal phase of the optical imagery, the number of classification samples, and the classification algorithms employed. For example, Li et al. [14] used a decision tree, a random forest, and a support vector machine to classify forest types, with the support vector machine achieving the highest classification accuracy of 88.20% and a kappa coefficient of 0.79, surpassing both the decision tree (with an OA of 87.3% and a kappa of 0.773) and the random forest (with an OA of 87.3%, and a kappa of 0.773). Grabska et al. [15] utilized RF algorithm with time-series Sentinel-2 data for the classification of tree species, finding an improvement in classification accuracy of 5%–10% compared to classification results obtained from single-date imagery. Thanh Noi et al. [16] employed a random forest algorithm, a k-nearest neighbor algorithm, and a support vector machine for land-use and cover classification in 14 different areas of the Red River Delta, Vietnam, using Sentinel-2 data. The results indicated that, when the training sample size was sufficiently large (750 pixels per class or 0.25% of the total study area), all three classifiers performed well with high overall classification accuracy. Liu et al. [17] combined Sentinel-2 data with multi-temporal Landsat-8 data for the classification of forest tree species, achieving an overall accuracy of 76.82%, which was 22.51% and 26.82% higher than using Sentinel-2 data alone (54.31%) and single-date Landsat-8 data (50.00%), respectively. Immitzer et al. [18] used an RF algorithm based on multi-temporal Sentinel-2 imagery for the classification of 12 forest tree species (five coniferous and seven broad-leaved) in Central Europe, achieving overall accuracies of 85.7% and 95.3% for broad-leaved and coniferous forests, respectively, and surpassing the classification results obtained from single-temporal imagery (with an overall accuracy of 72.9% for broad-leaved and 83.8% for coniferous forests). Lewandowska et al. [19] conducted a forest classification study in the mountainous regions of southern Poland using Sentinel-2 data. It was found that, by combining topographic information with multi-temporal Sentinel-2 data, the overall accuracy of classifying eight tree species improved from 75.6% to 81.7%. These studies show that the spectral, spatial, and radiometric resolution of imagery, classification algorithms, sample sizes, and image time phases all influence classification results. However, the magnitudes of the impacts of each factor require further systematic study with the aim of achieving an accurate classification of forest tree species under the optimal combination of influencing factors.
Consequently, based on previous single-factor studies on tree-species classification, this research systematically quantified the effects of various factors—including spectral resolution, spatial resolution, radiometric resolution, classification algorithms, sample size, and image acquisition time—using Landsat-8, Landsat-9, and Sentinel-2 imagery. The study aimed to clarify the relative importance of these factors to achieve the precise, large-scale classification of forest tree species using optical imagery. The specific objectives were as follows: (1) to investigate the differences in the classification of forest tree-species results using Landsat and Sentinel-2 imagery; (2) to explore and quantify the impact of different factors on classification results; and (3) to achieve an accurate regional classification of forest species with optimal factor combinations, providing high-accuracy foundational data for forest resource management.

2. Study Area and Data Introduction
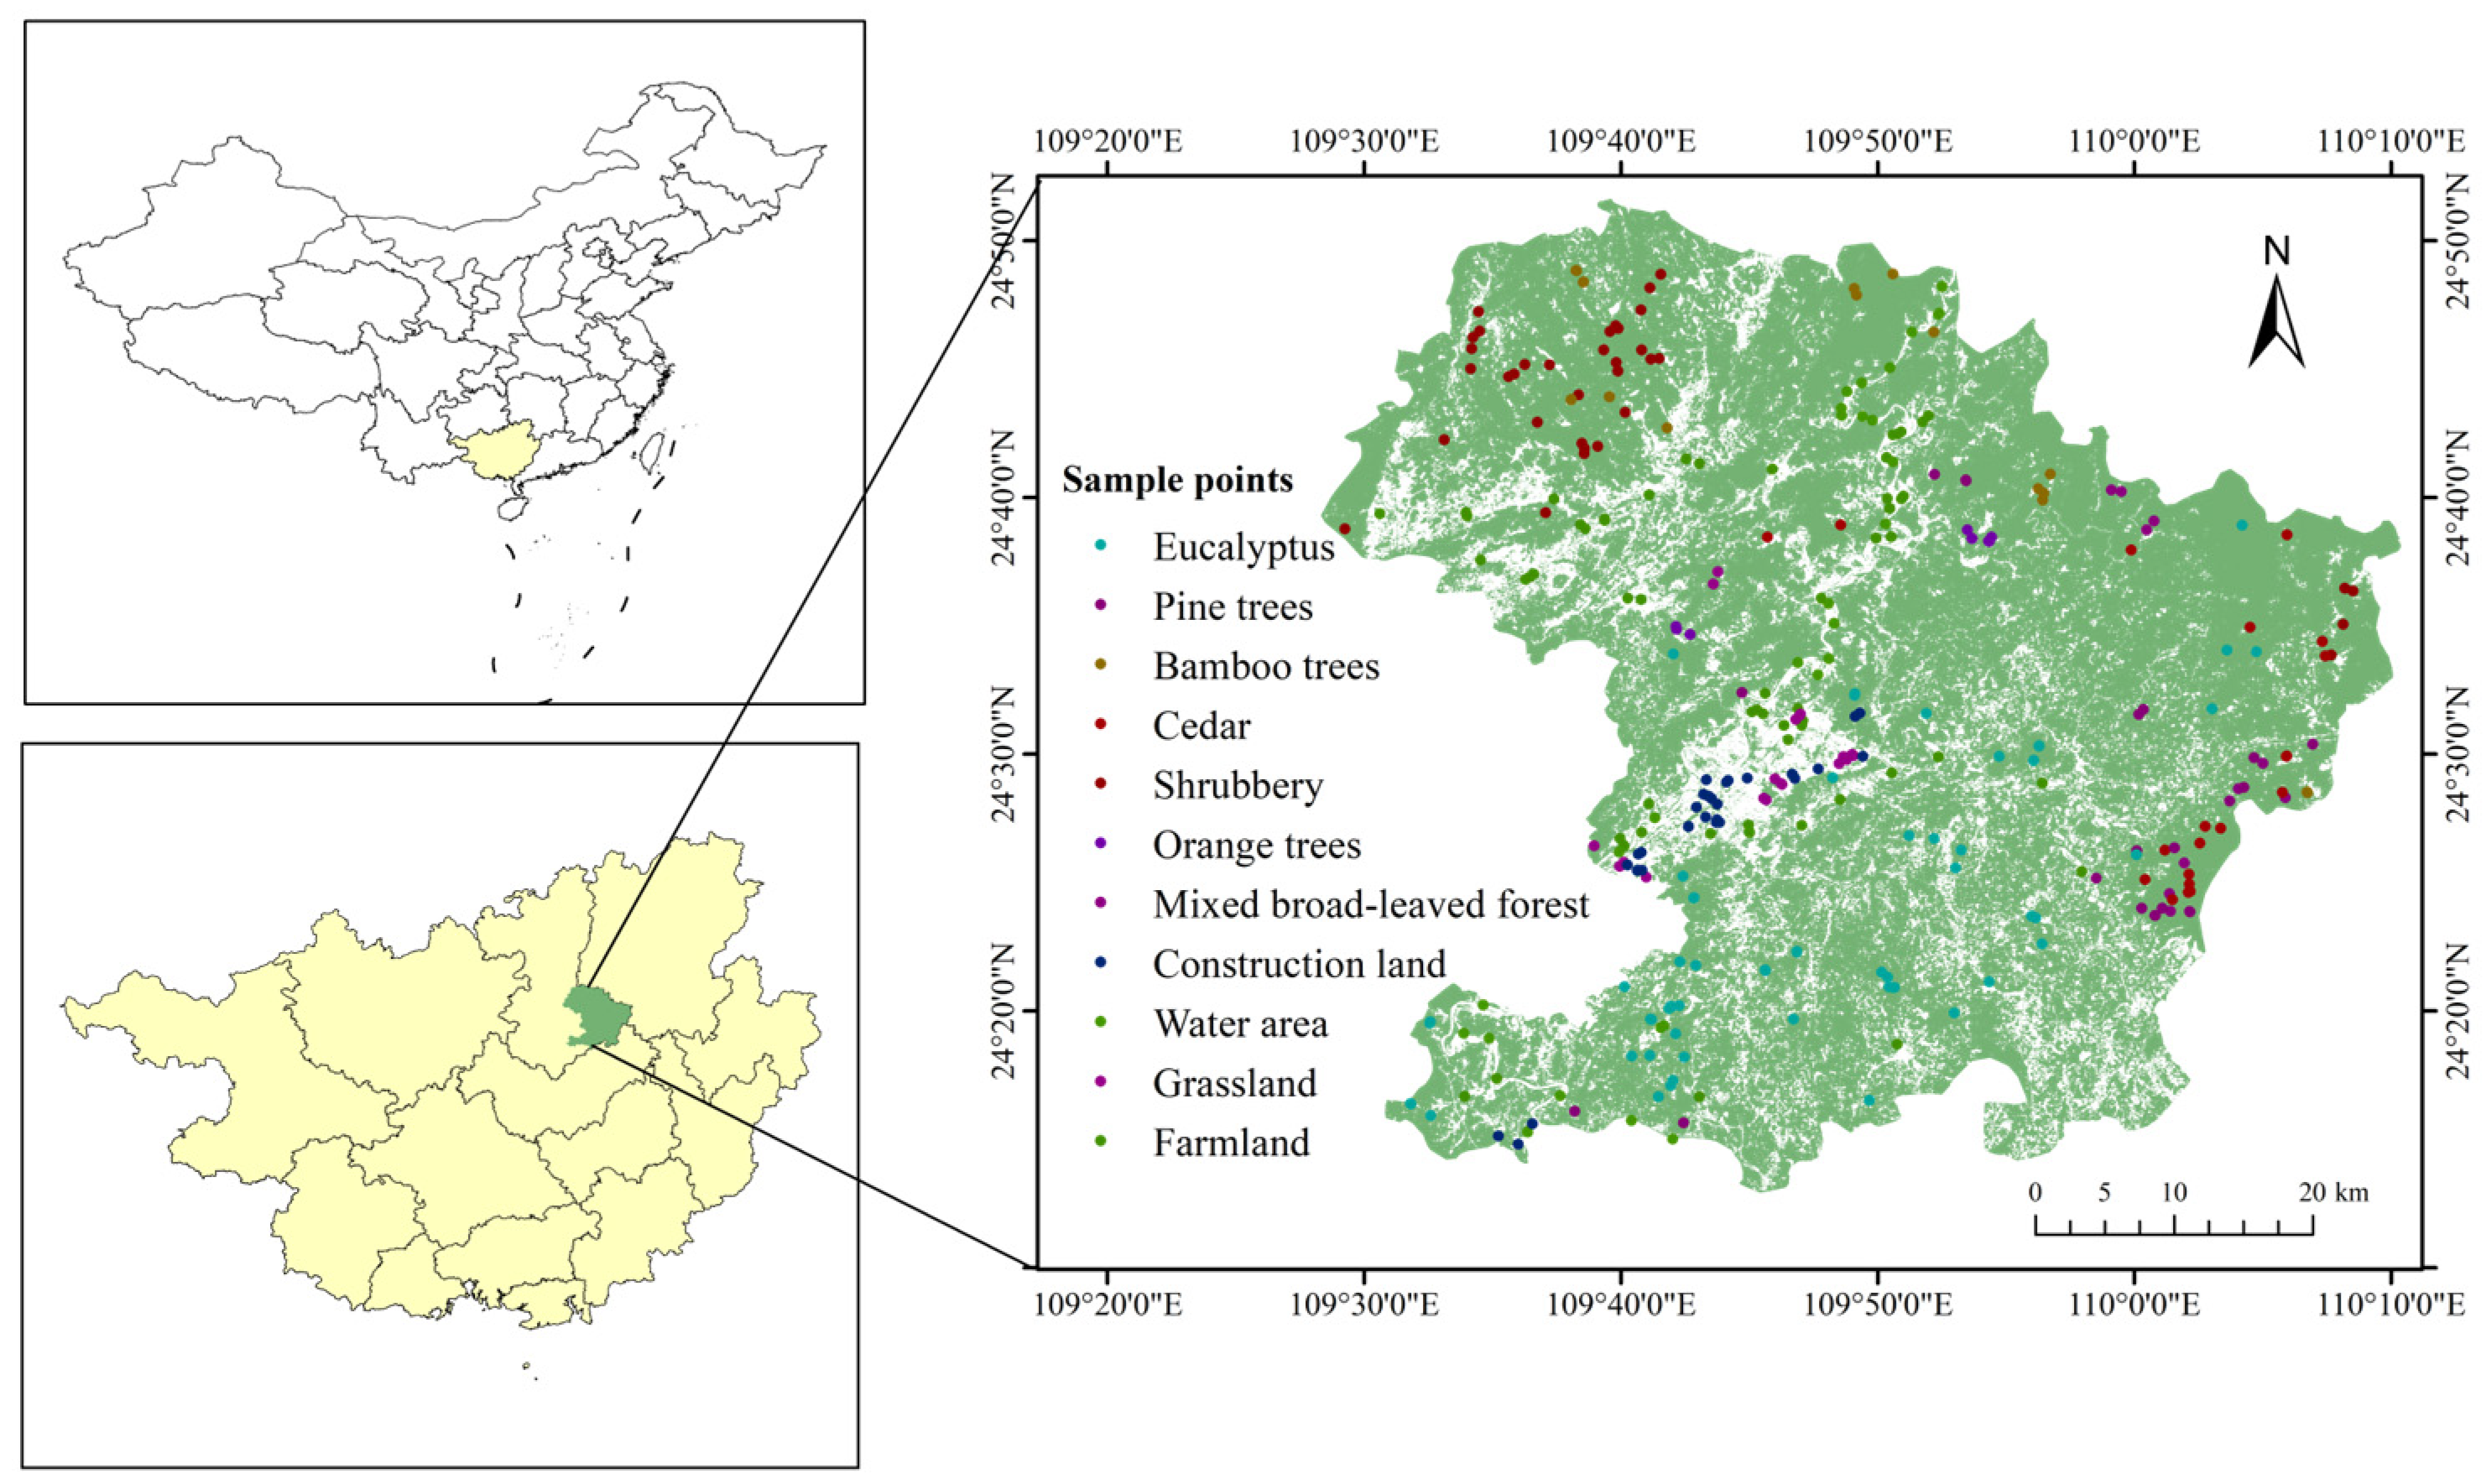
2.1. Study Area

This study area is situated in Luzhai County, Liuzhou City, within the Guangxi Zhuang Autonomous Region of China (108°42′–110°27′ E, 23°55′–26°04′ N) (Figure 1). The elevation in this area varies from 84 m to 150 m. The region experiences a subtropical monsoon climate, marked by a temperature of 21 °C and yearly precipitation ranging from 1400 to 1500 mm, as well as over 1600 h of sunshine annually. The frost-free period extends for about 300 days, and the forest coverage rate stands at 66.75% with rich forest tree species. The forests primarily consist of eucalyptus trees (Eucalyptus robusta Smith), bamboo (Phyllostachys edulis (Carriere) J. Houzeau), orange trees (Citrus reticulate L.), shrubbery, and mixed broad-leaved forests. The coniferous forests are predominantly made up of cedar (Cunninghamia lanceolata (Lamb.) Hood) and pine trees (Pinus L.).

2.2. Data Introduction

2.2.1. Field Survey Data

To ensure the distribution of sampling plots throughout the study area, sampling plots were initially selected based on the land-use spatial distribution map and Sentinel-2 images of the study area. Field sampling plot-data collection was conducted in September 2021, and the sampling plots were adjusted according to the actual situation during field-data collection. To match the spatial resolution of Landsat images, the square sample plots with 30 m were sampled, a real-time kinematic was used to locate the center of the plot, and the tree species were recorded. A Haglof Vertex laser altimeter was used to measure the height of individual trees in some plots. A breast-height diameter ruler was used to measure the breast-height diameter of individual trees, and a meter ruler was used to measure the crown width. The above measurements were used to calculate the biomass of the plot in the future. Based on the data of the field survey, the forest types in the study area were subdivided into eight categories: eucalyptus, shrubbery, cedar, bamboo, pine trees, orange trees, and mixed broad-leaved forest. Non-forest areas mainly included farmland, grassland, water areas, and construction land. Based on the field-data collection, sample data were expanded using high-definition historical images from Google Earth. Figure 1 shows the specific sample locations, and Table 1 lists the number of samples for each category.
To verify the influence of different sample sizes on the results of forest tree-species classification, using the samples listed in Table 1, the random forest algorithm was applied to classify forest tree species in Landsat-8, Landsat-9, and Sentinel-2 satellite imagery in the same month, separately. The intersection of each category in the three tree-species classification results was taken, and stratified random sampling was performed, based on the intersection of each category. The number of samples for each category was 50, 100, 150, …, and 400 to study the impact of sample sizes on forest tree-species classification results.

2.2.2. Landsat Data

Landsat is a vital medium-resolution remote sensing system within the U.S. Earth observation program. Since 1972, it has advanced through four generations, with Landsat-8 and Landsat-9 being the most frequently utilized today. The details of Landsat-8 and Landsat-9 sensors can be found in the reference [20,21], and the main parameters are shown in Table 2.
Due to the influence of clouds and rain, the availability of high-quality optical imagery is limited. Through selection, it was found that there were available high-quality images from December 2022 for both Landsat and Sentinel-2. Therefore, the images from December 2022 were selected for a comparative study of tree-species classification results. At the same time, in order to study the impact of images from different seasons on the classification results, the Landsat-9 images of four seasons were selected

2.2.3. Sentinel-2 Data

Sentinel-2, a multispectral Earth-observation satellite developed by the European Space Agency through the Copernicus program, is equipped with 13 spectral bands offering spatial resolutions of 10 m, 20 m, and 60 m, along with a radiometric resolution of 14 bits. The main parameters of the Sentinel-2 sensors are shown in Table 3.

3. Method

In this study, Landsat-8 imagery, Landsat-9 imagery, and Sentinel-2 imagery were used as the basic data. Spectral reflectance, indices, and texture data were extracted through the preprocessing of the images. Random forest, gradient tree boosting, and support vector machine algorithms were used for the classification of forest tree species. The classification results were compared to explore the impact of different factors—including spectral resolution, spatial resolution, radiometric resolution, classification algorithms, sample size, and image acquisition time—on tree-species classification results, clarify the strength of each factor’s influence, and achieve an accurate classification and mapping of forest species across extensive areas using optical satellite imagery. The flowchart used is shown in Figure 2.

3.1. Feature Variable Extraction

Before feature parameters are extracted, Landsat-8, Landsat-9 and Sentinel-2 images undergo preprocessing steps, including resampling, mosaicking, and cropping. Following this, feature parameters such as spectral reflectance, spectral indices, and texture information are extracted (Table 4) The specific calculation process of the indices can be found in the referenced literature [22,23,24,25,26,27,28,29,30,31,32,33].

3.2. Classification Algorithm

To achieve accurate forest tree-species classification, this study used three commonly used machine learning algorithms: random forest (RF), gradient tree boosting (GTB), and support vector machines (SVMs). The detailed descriptions of each algorithm are as follows.
The RF algorithm, proposed by Breiman et al. [34], is a machine learning algorithm that consists of numerous decision trees. During the training phase, it builds multiple decision trees and then combines their outputs to make predictions either by selecting the majority class (for classification) or by averaging the predictions (for regression). In RF, the final classification of an unknown sample is determined according to the majority vote across all trees in the ensemble. This method effectively mitigates the overfitting problem often encountered with individual decision trees. The significance of each spectral band can be assessed by methodically comparing the performance of models that incorporate specific bands with those that omit them [35].
GTB is an iterative decision tree algorithm and an ensemble model that randomly selects a subset of training data for each iteration. The base learner is fitted to this subset, and the model is updated in subsequent iterations to gradually reduce the cumulative loss [36]. In essence, in parameter space, gradient descent leverages gradient information to update parameters and minimize the loss function. Gradient tree boosting is one of the most effective algorithms for approximating real distributions among traditional machine learning methods. As a robust classifier, it usually surpasses decision trees in accuracy, and it can autonomously select its loss function.
SVMs encompass a family of supervised learning techniques widely utilized for both classification and regression tasks, particularly in data analysis and pattern recognition. The specific approach within SVMs varies based on the structure and characteristics of the classifier. The linear classifier is the most commonly employed SVM, designed to predict the class membership of inputs across two possible categories. SVMs achieve data separation by constructing a hyperplane, or multiple hyperplanes, in a high-dimensional space. The support vectors, which are the data points nearest to the margin, play a vital role in determining the hyperplane. SVMs are particularly effective when working with finite training datasets and high-dimensional feature spaces [37].

3.3. Accuracy Assessment

Due to the relatively small number of samples in certain categories, and to minimize the impact of random sample variability on the classification results, this study employed ten-fold cross-validation for the construction and validation of the classification of forest tree-species models. The evaluation metrics for the classification results included the overall accuracy (OA), kappa coefficient, user accuracy (UA), and producer accuracy (PA). The specific formulas for these metrics are as follows:
U A i = p i i p i + ,
P A i = p i i p + i ,
O A = i = 1 k p i i p ,
Kappa = p i = 1 k p i i i = 1 k p i + p + i p 2 i = 1 k p i + p + i
Let p denote the sample size, k represent the category count, pii correspond to the count of accurately classified samples, p+i refer to the number of samples belonging to class i, and pi+ represent the overall number of samples predicted to belong to class i.

4. Results

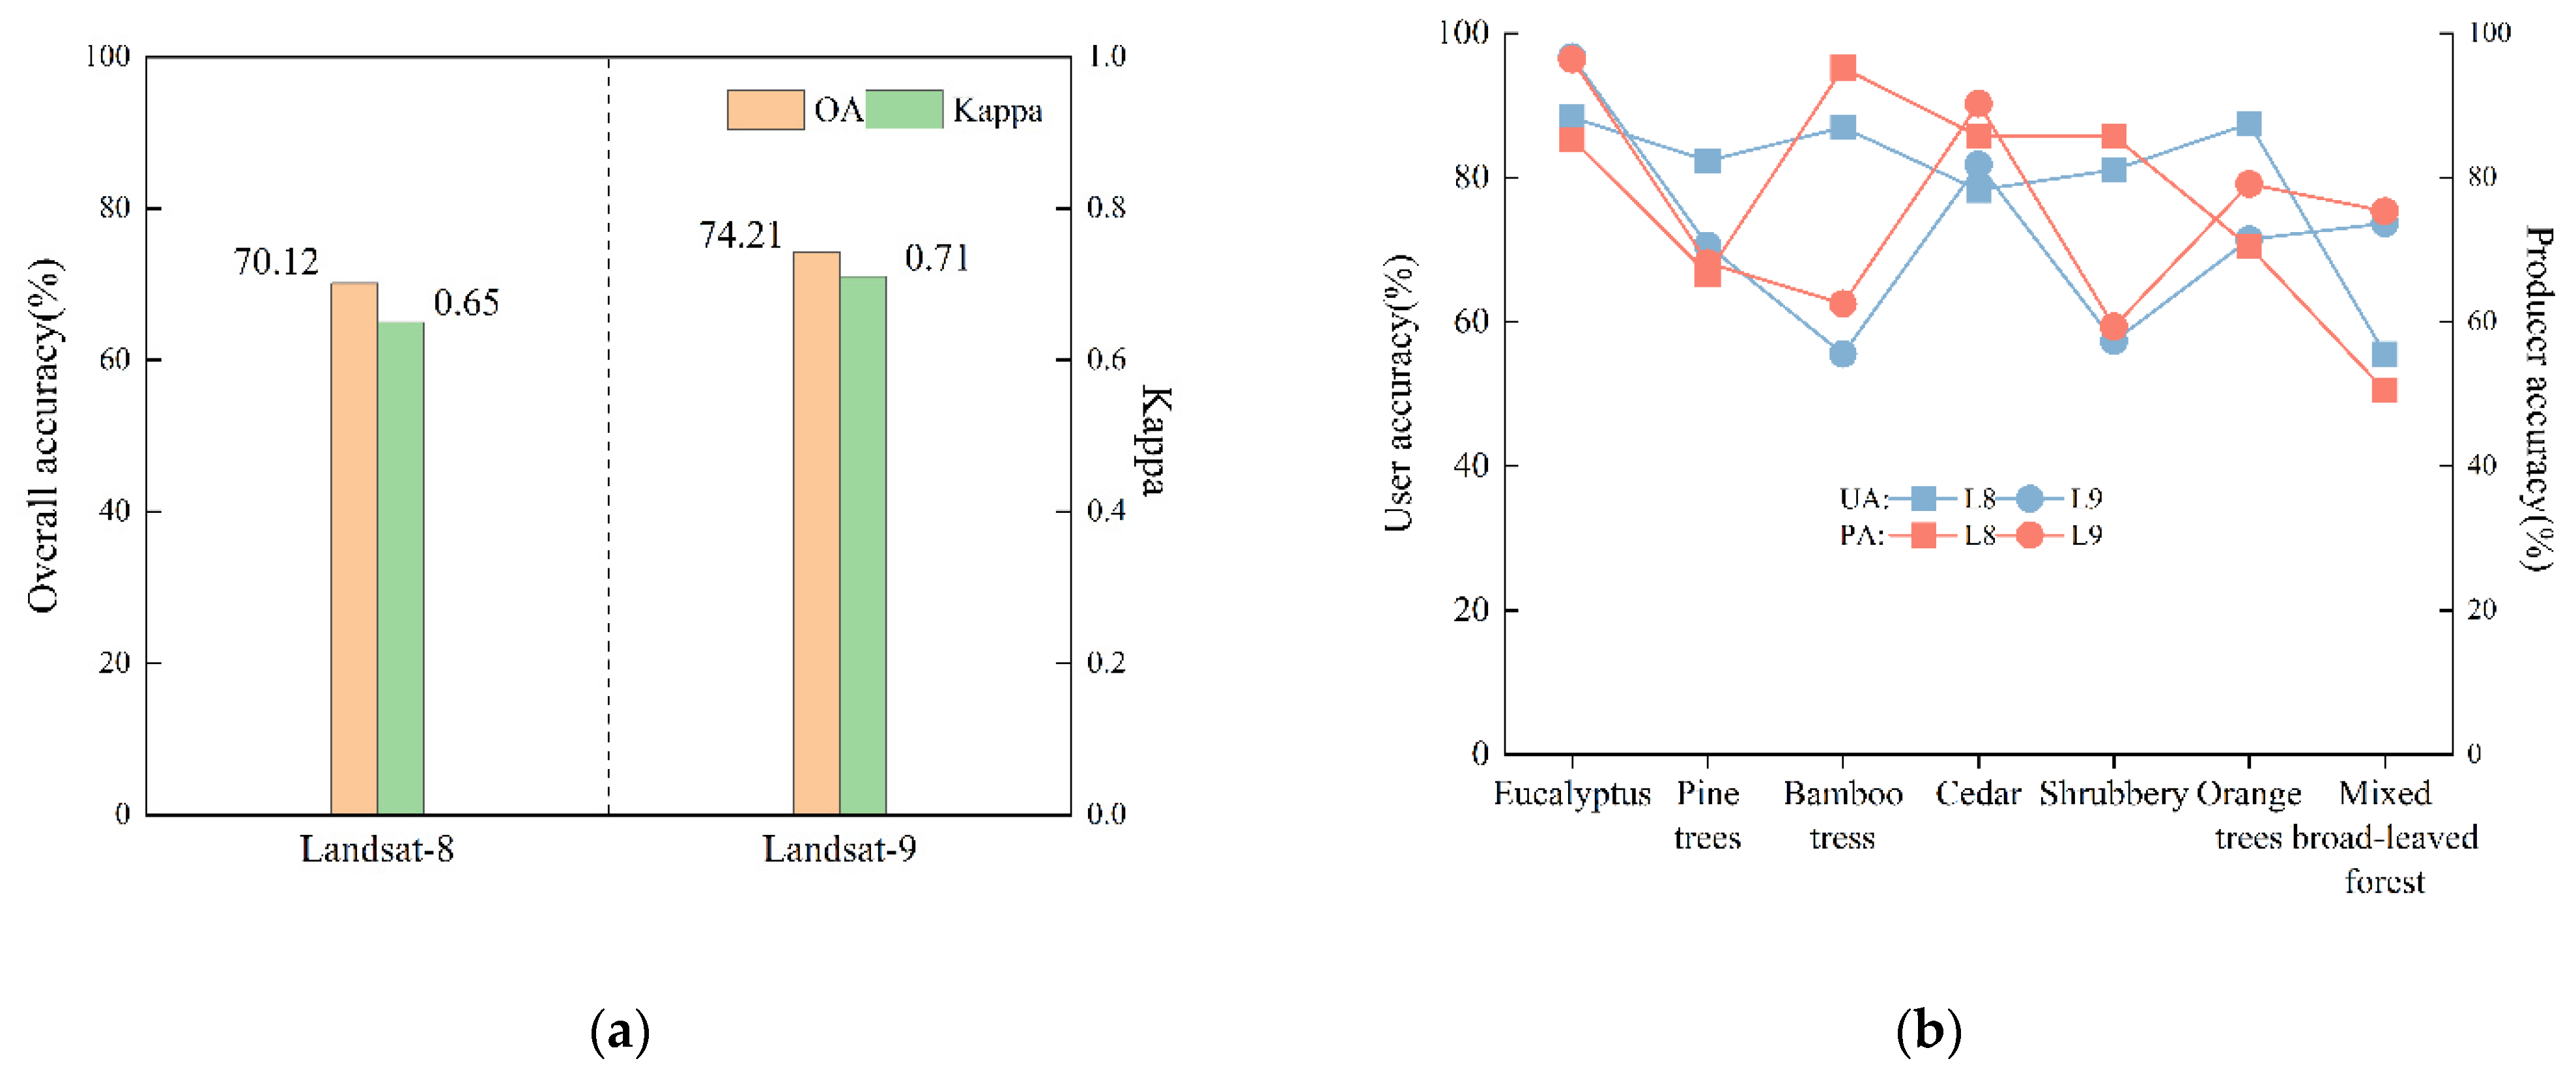
4.1. Forest Tree-Species Classification Results with Different Algorithms

Utilizing images from Landsat-8, Landsat-9, and Sentinel-2, tree-species classification was conducted, employing RF, GTB, and SVM algorithms, respectively. The results are shown in Table 5.
According to the results in Table 5, the RF algorithm achieved the best tree-species classification results, superior to those of the GTB algorithm, whereas the SVM algorithm produced the lowest-quality results. For Landsat-8 imagery, the RF algorithm achieved an OA of 70.12% and a kappa of 0.65, outperforming the classification outcomes of the GTB algorithm (with an OA of 66.43% and a kappa of 0.61) and the SVM results (with an OA of 59.38% and a kappa of 0.53). For Landsat-9 imagery, the RF algorithm produced an overall accuracy of 74.21%, representing an improvement of 4.09% and 16.08% over the GTB and SVM algorithms, respectively. In the case of Sentinel-2 imagery, the RF algorithm achieved an overall accuracy of 68.38%, which was 2.76% and 5.13% higher than the GTB and SVM classification results, respectively.

4.2. Forest Tree-Species Classification Results with Different Radiometric Resolutions

The previous analysis indicates that the RF algorithm has the best classification accuracy among RF, GTB, and SVM algorithms. Therefore, the RF algorithm was applied separately to classify forest tree species using Landsat-8 imagery and Landsat-9 imagery, and the results are shown in Figure 3.
As illustrated in Figure 3, the tree-species classification using Landsat-9 imagery achieved an OA of 74.21% and a kappa of 0.71, surpassing the Landsat-8 results (OA = 70.12%; kappa = 0.65). However, the accuracy for bamboo and shrubs was lower with Landsat-9. These findings suggest that a higher radiometric resolution enhances the classification of various tree species. Please refer to Tables S1 and S2 for analysis of significance of differences in results.

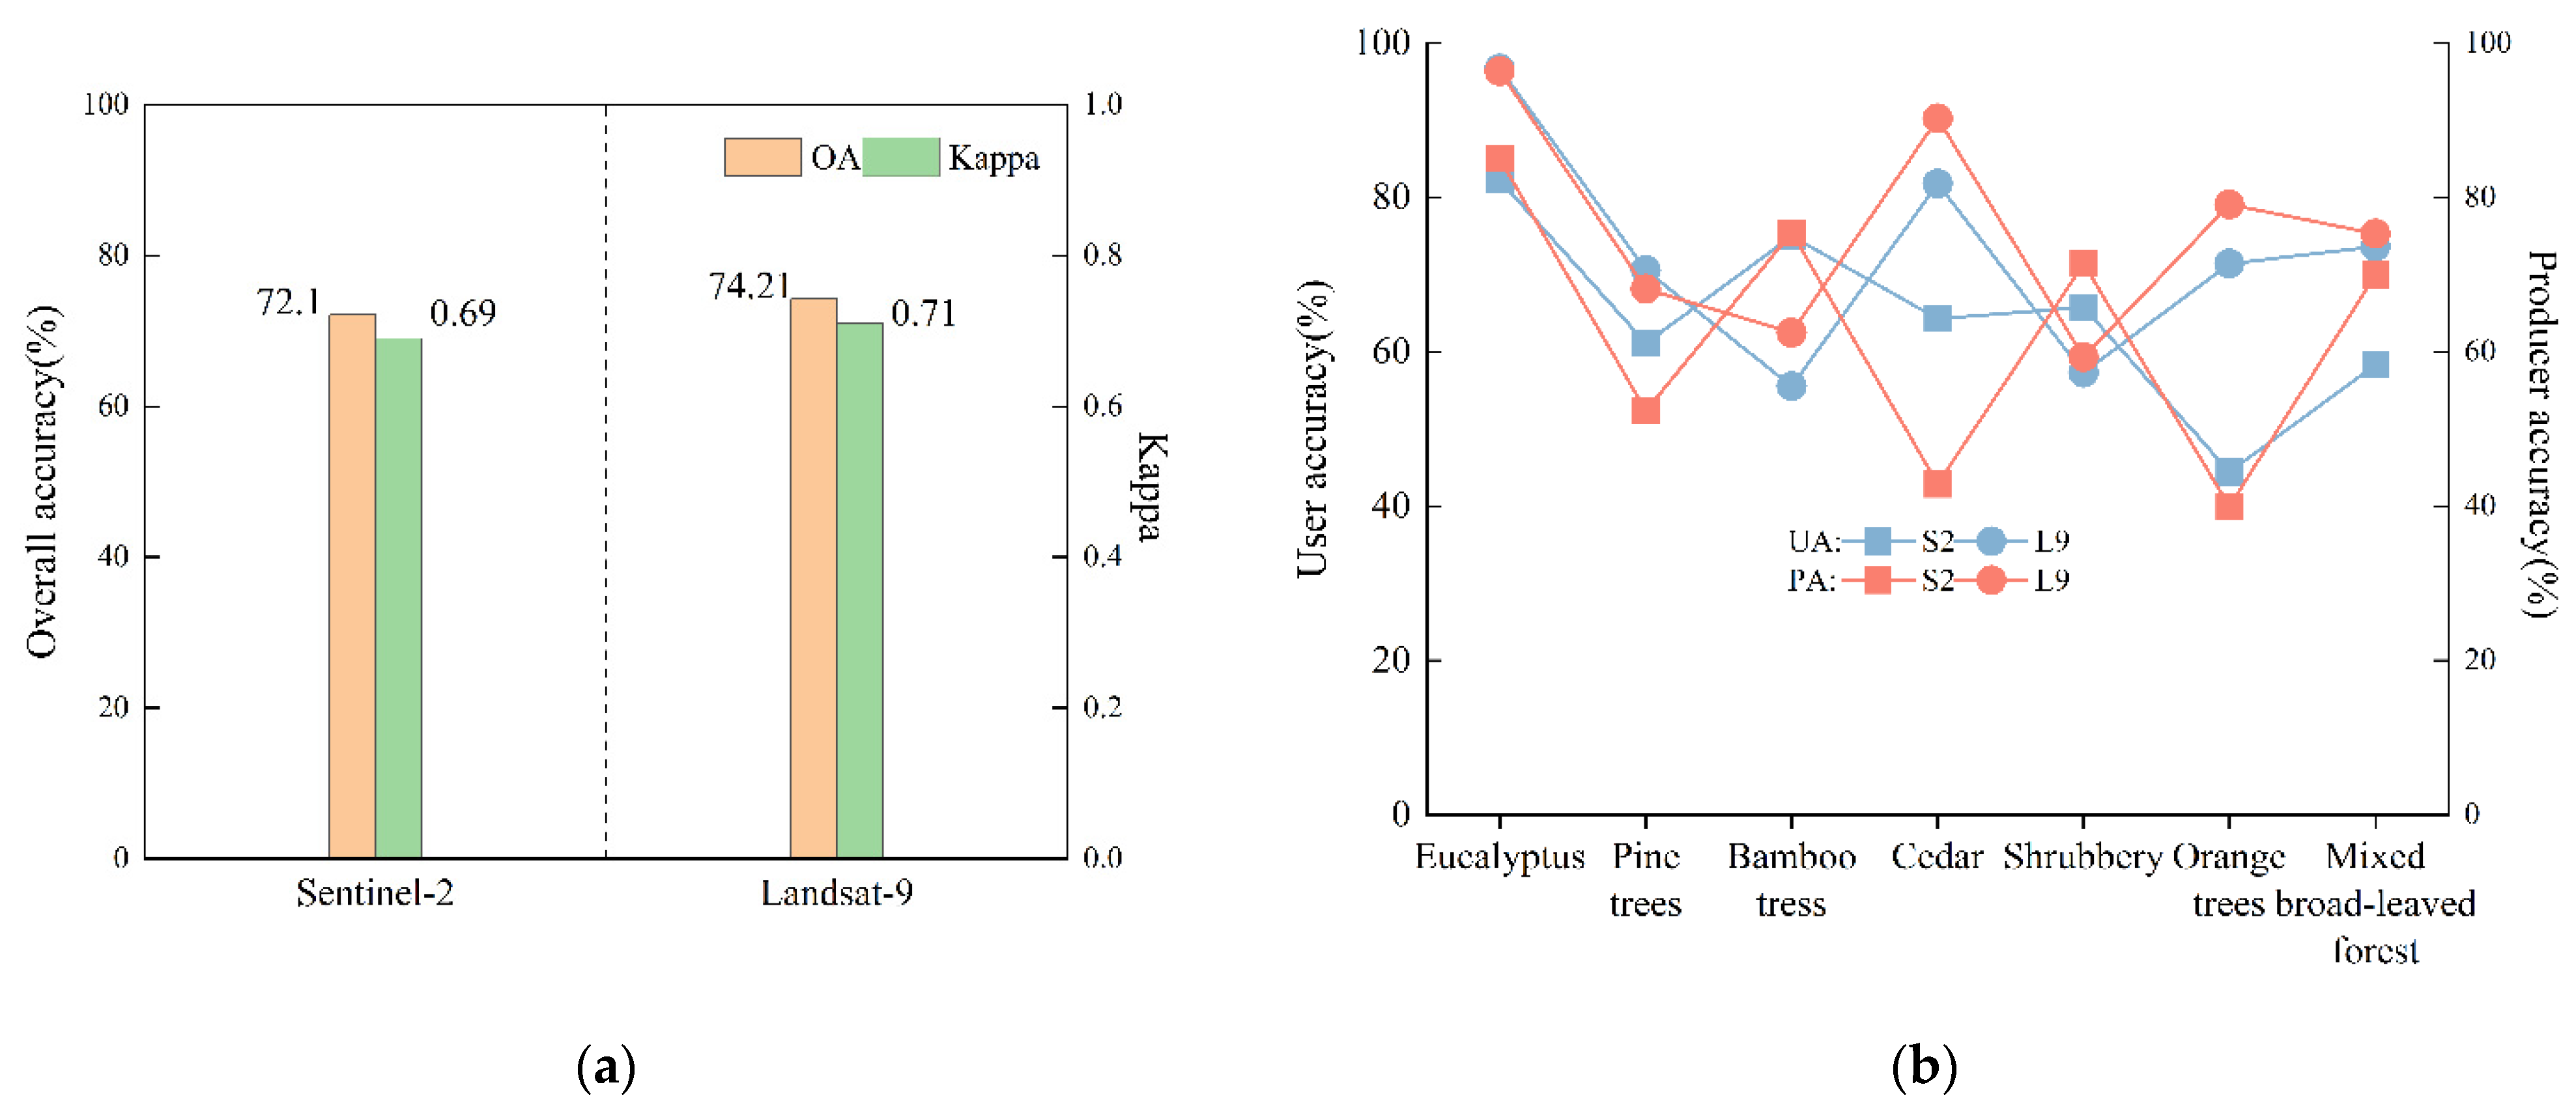
4.3. Forest Tree-Species Classification Results with Different Spectral Resolutions

The Sentinel-2 imagery was resampled to a 30-m resolution. The forest species were classified using the RF algorithm, based on Landsat-9 and resampled Sentinel-2 imagery. The results are presented in Figure 4.
Figure 4 shows that the tree-species classification using Landsat-9 imagery achieved an OA of 74.21% and a kappa of 0.71, outperforming the classification results from Sentinel-2 imagery (OA = 72.10%; kappa = 0.69). Furthermore, most tree-species classification results from Landsat-9 imagery outperformed those from Sentinel-2, except for shrubbery and bamboo. These findings suggest that the additional spectral and red-edge bands of Sentinel-2, when applied at a 30-m spatial resolution, do not improve the accuracy classification. Please refer to Tables S3 and S4 for analysis of significance of differences in results.

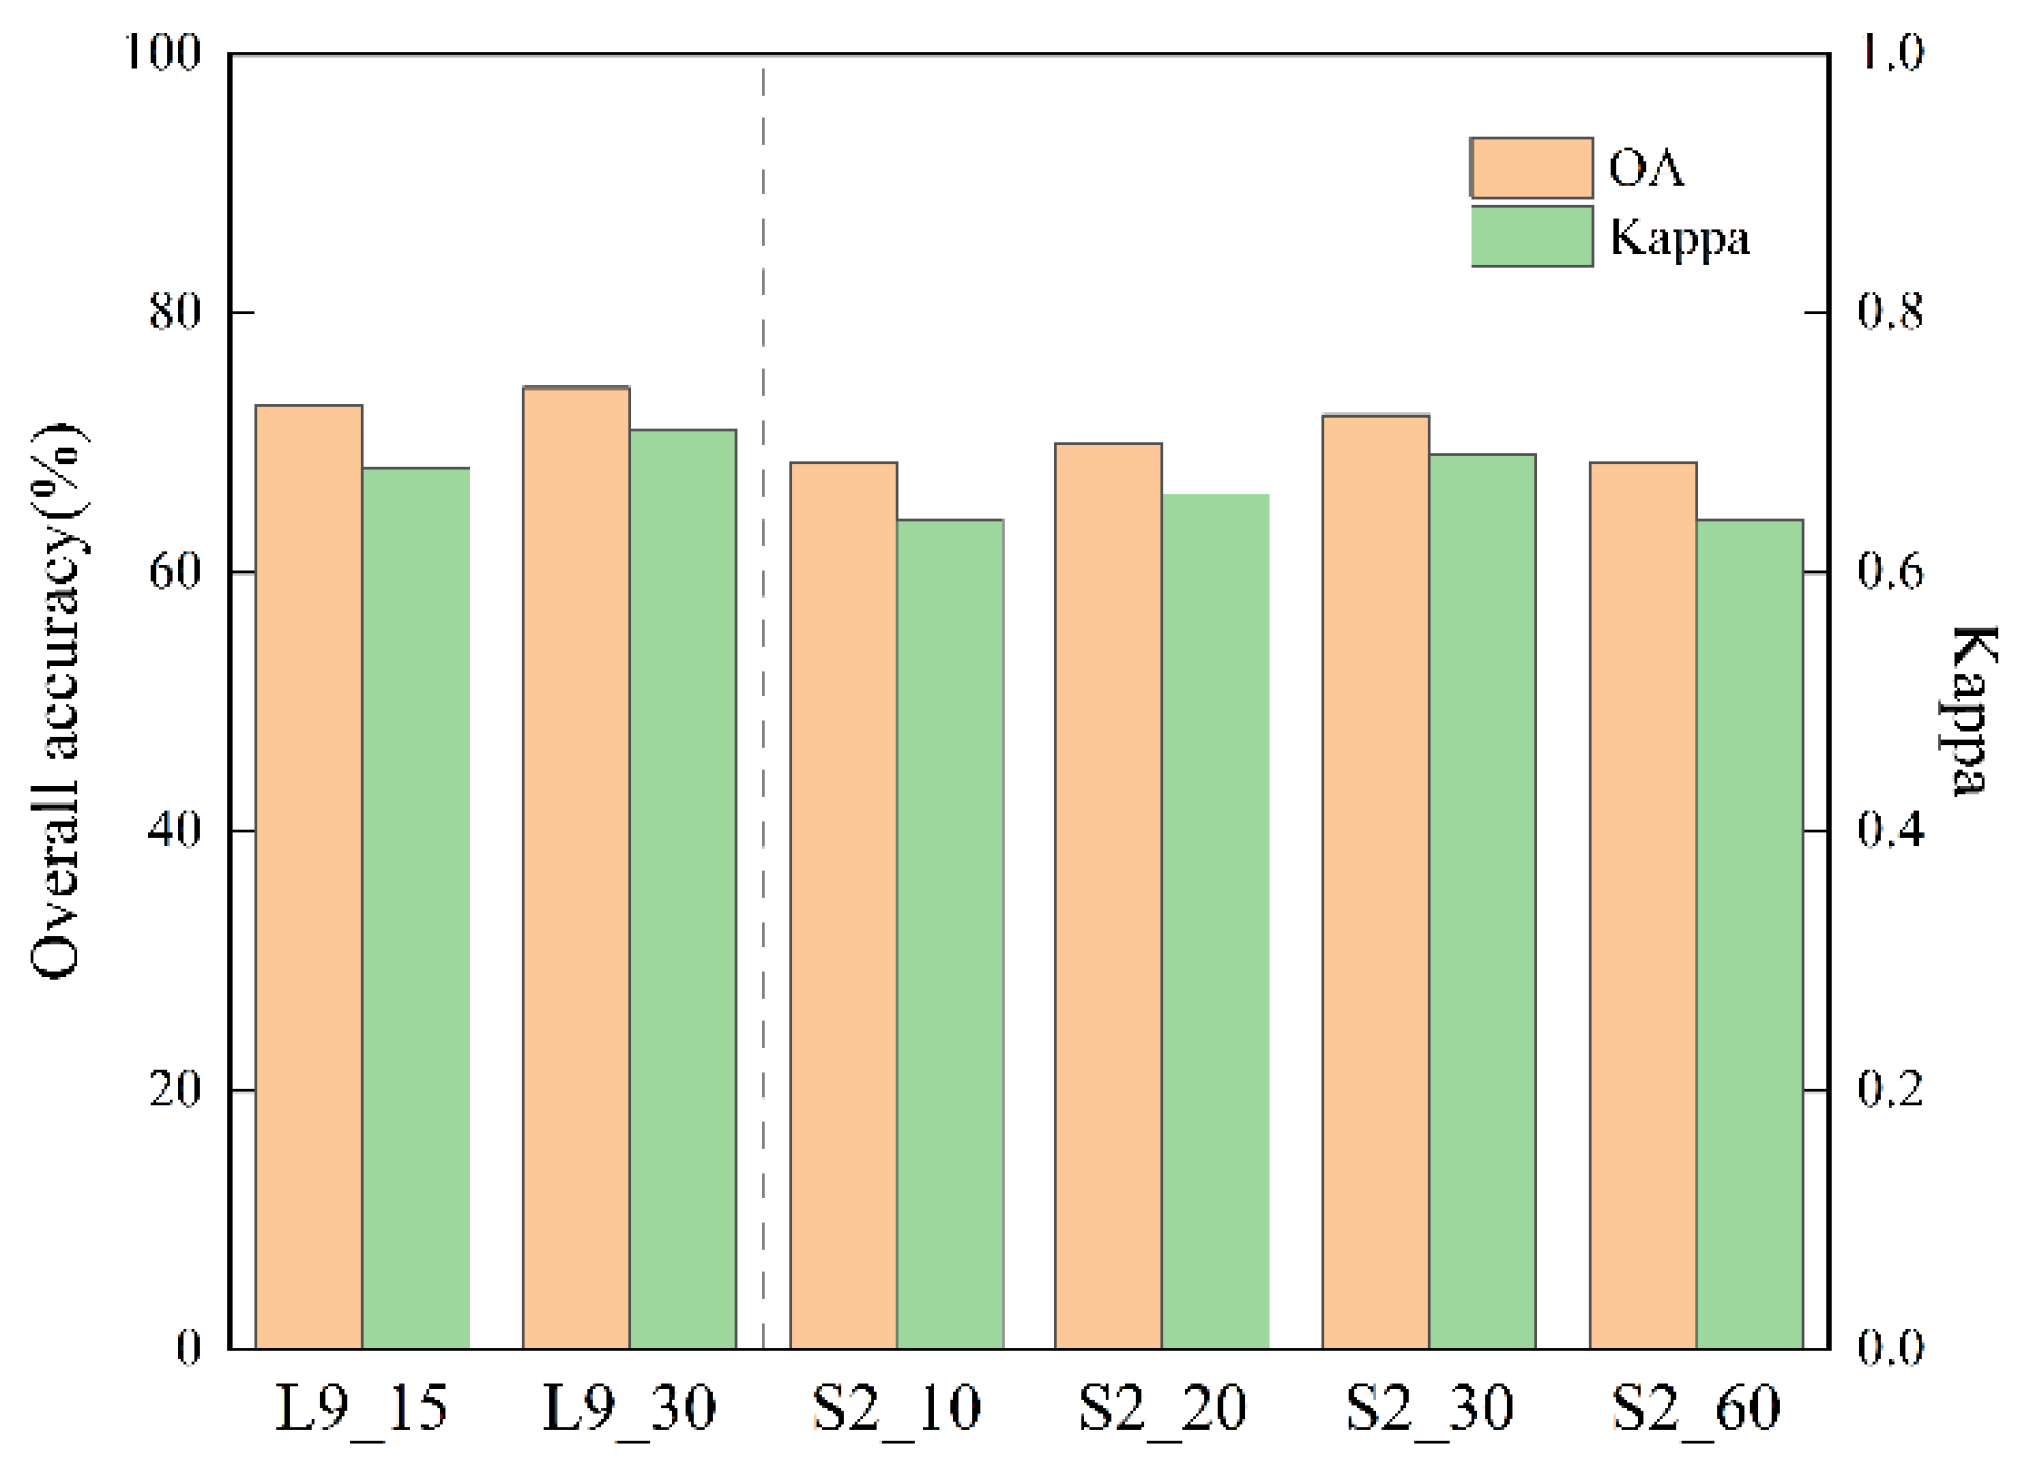
4.4. Forest Tree-Species Classification Results with Different Spatial Resolutions

Landsat-9 imagery was resampled to 15 m and 30 m, and Sentinel-2 imagery was resampled to 10 m, 20 m, 30 m, and 60 m, respectively. The forest tree species were classified using the RF algorithm, based on the resampled Landsat-9 and Sentinel-2 imagery (Figure 5 and Figure 6).
As shown in Figure 5 and Figure 6, for Landsat-9 imagery, the classification results were superior at a spatial resolution of 30 m, with an OA of 74.21% and a kappa of 0.71, which were better than the classification results at a spatial resolution of 15 m (OA = 72.81%; kappa = 0.68). For different tree species, the classification accuracies of Landsat-9 imagery at a spatial resolution of 30 m were generally better than those of a 15-m spatial resolution, except for orange trees. For Sentinel-2 imagery, the tree-species classification results at a spatial resolution of 30 m were also superior, with an OA of 72.10% and a kappa of 0.69, which were better than the classification results at spatial resolutions of 20 m, 10 m, and 60 m. For different tree species, the classification accuracies at spatial resolutions of 20 m and 30 m were generally better than those of the 10-m and 60-m spatial resolutions. The classification accuracy of Sentinel-2 imagery at a 10-m spatial resolution for mixed broad-leaved forests was better than that of the other three spatial resolutions, while the Sentinel-2 imagery at a 60-m spatial resolution had better classification accuracy for eucalyptus and shrubs. The results indicate that, for tree-species classification, a higher spatial resolution does not necessarily yield better classification results.
In summary, for Landsat-8, Landsat-9, and Sentinel-2 imagery, the results of classification using Landsat-9 imagery were the most accurate, outperforming those obtained from Sentinel-2 and Landsat-8 imagery.

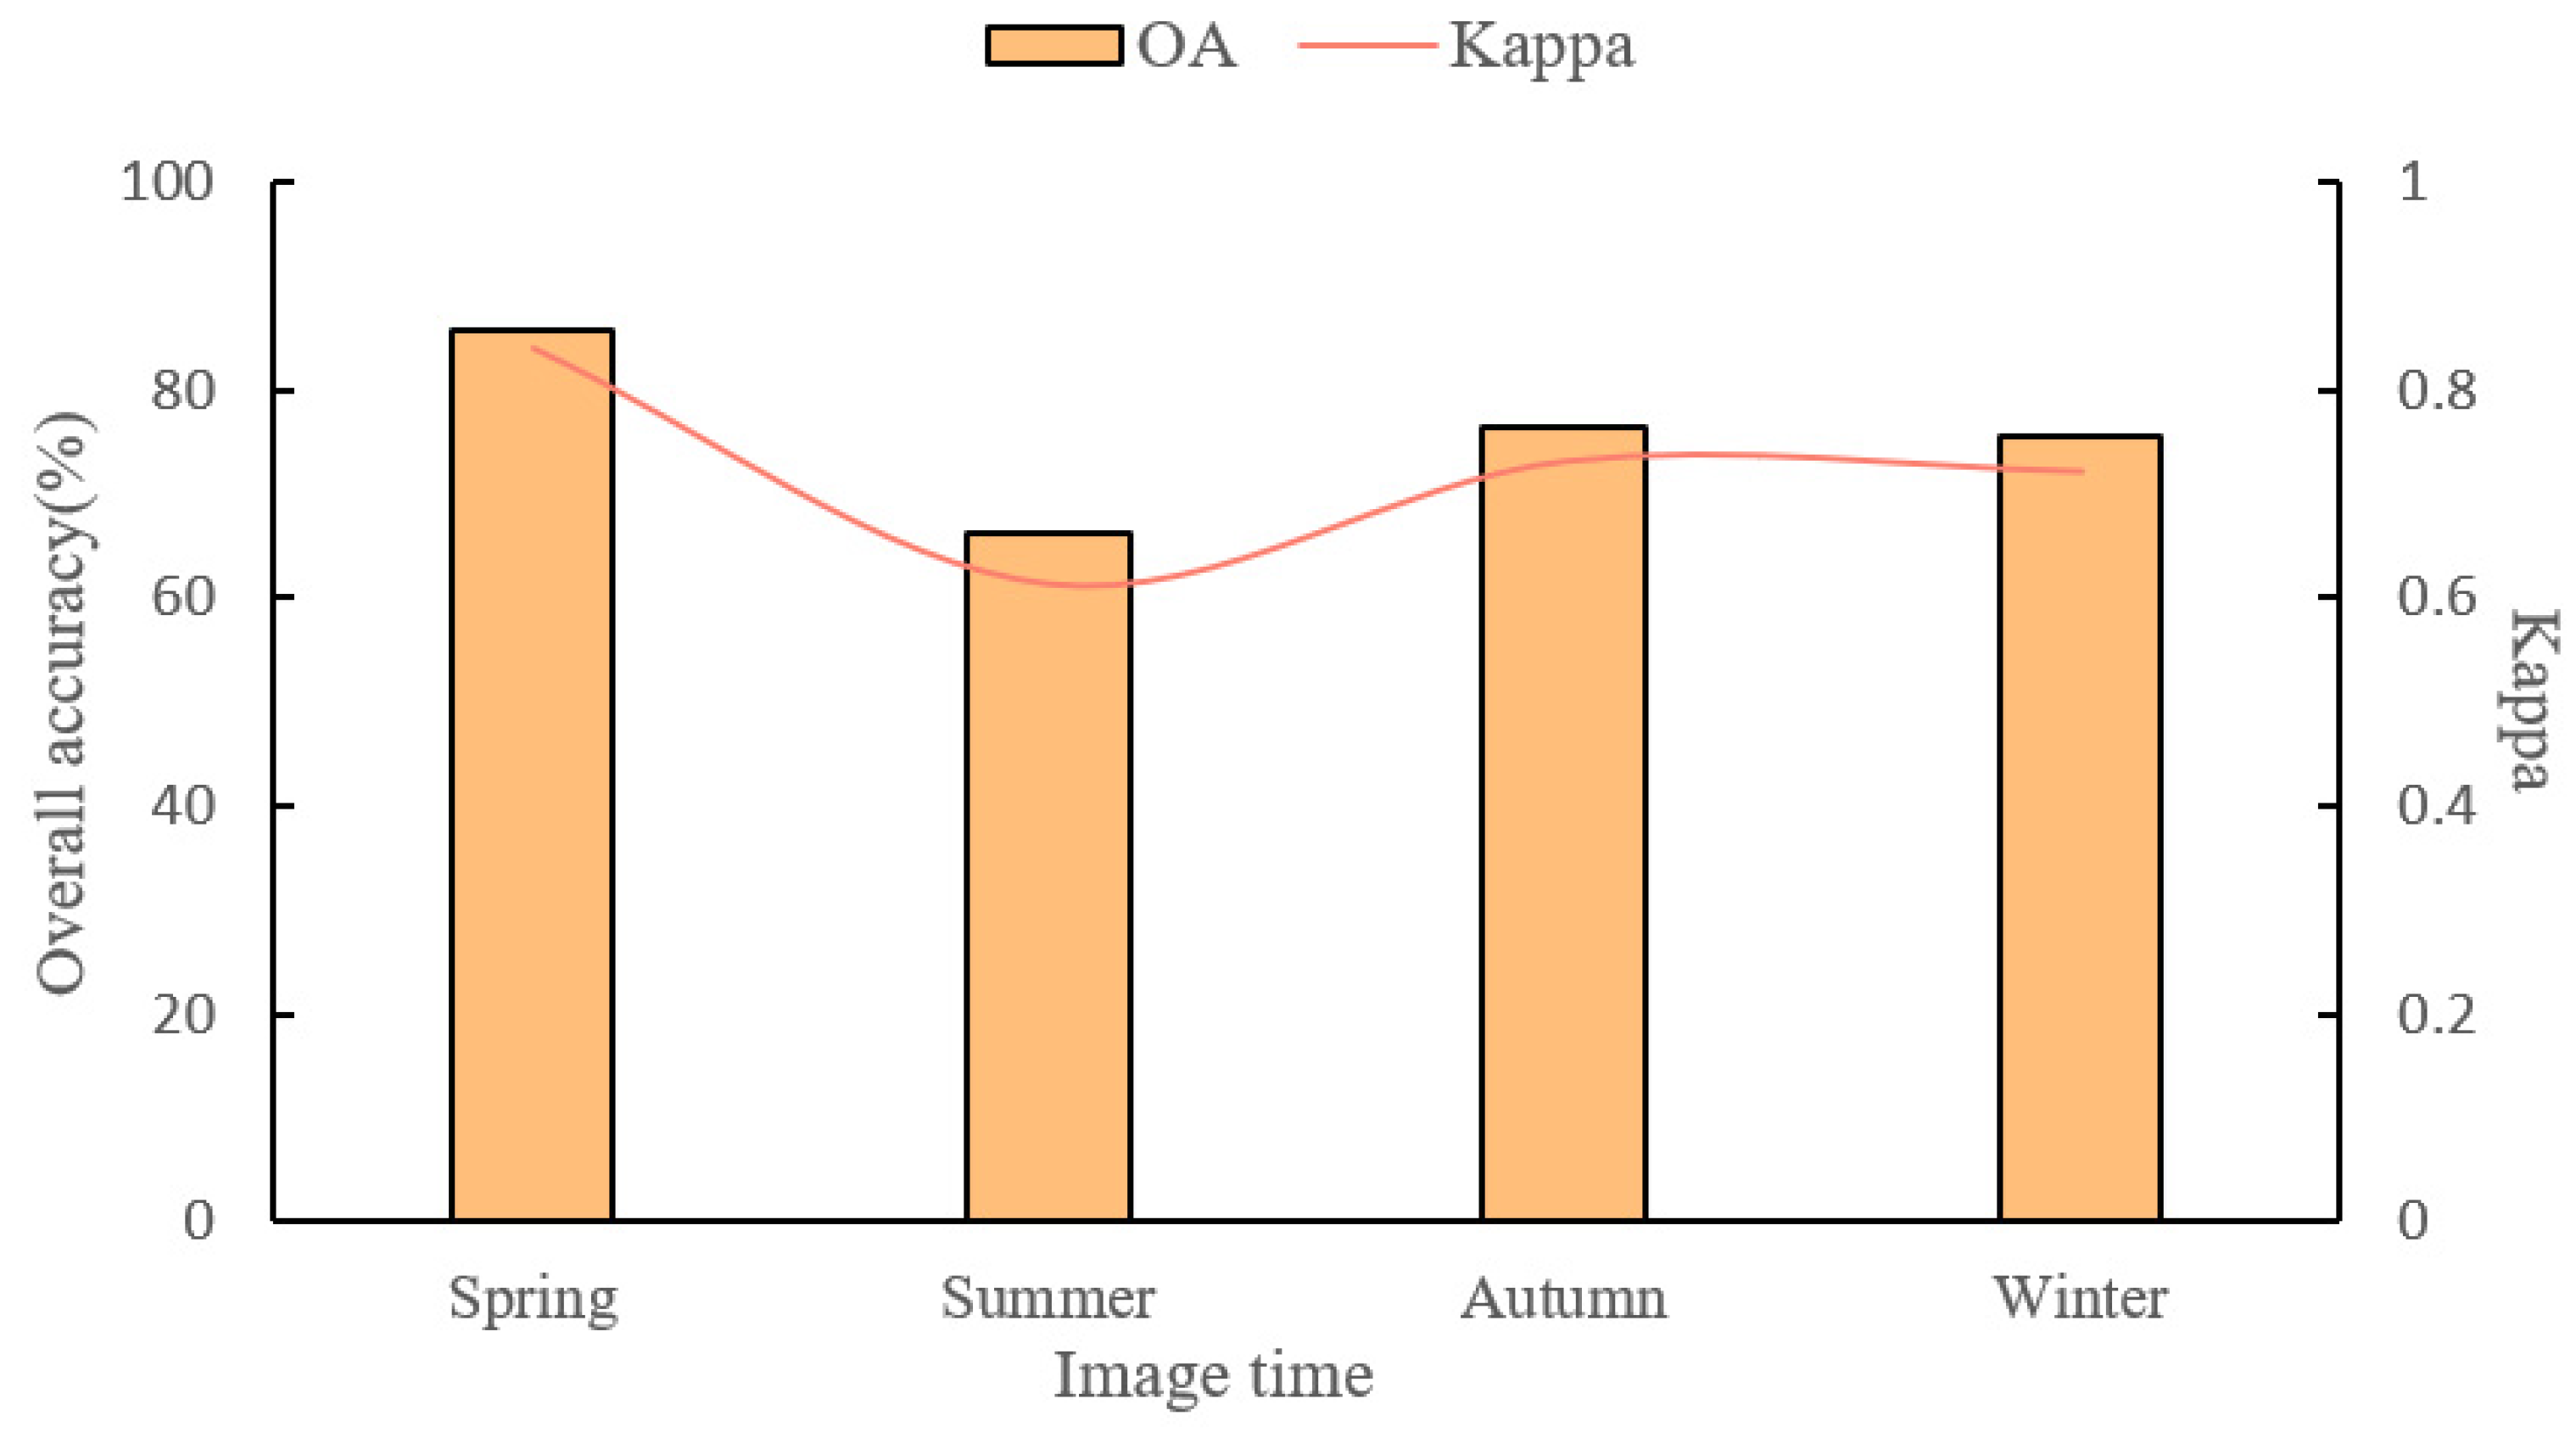
4.5. Forest Tree-Species Classification Results with Different Seasonal Imagery

The analysis shows that Landsat-9 imagery provides optimal forest tree-species classification. Consequently, Landsat-9 imagery from different seasons was used for classification, with results displayed in Figure 7.
Figure 7 shows that spring Landsat-9 imagery yielded the best classification, achieving an OA of 85.93% and a kappa of 0.84 and outperforming autumn, winter, and summer. The summer period exhibited the lowest accuracy, with 66.12% and a kappa coefficient of 0.61. This is mainly because, in spring, trees exhibit varying stages of leaf growth, making species differences more pronounced. In summer, fully grown leaves result in smaller characteristic differences, leading to a lower classification accuracy. Thus, spring imagery is recommended for future subtropical forest classification studies to enhance accuracy. Please refer to Tables S5 and S6 for analysis of significance of differences in results.

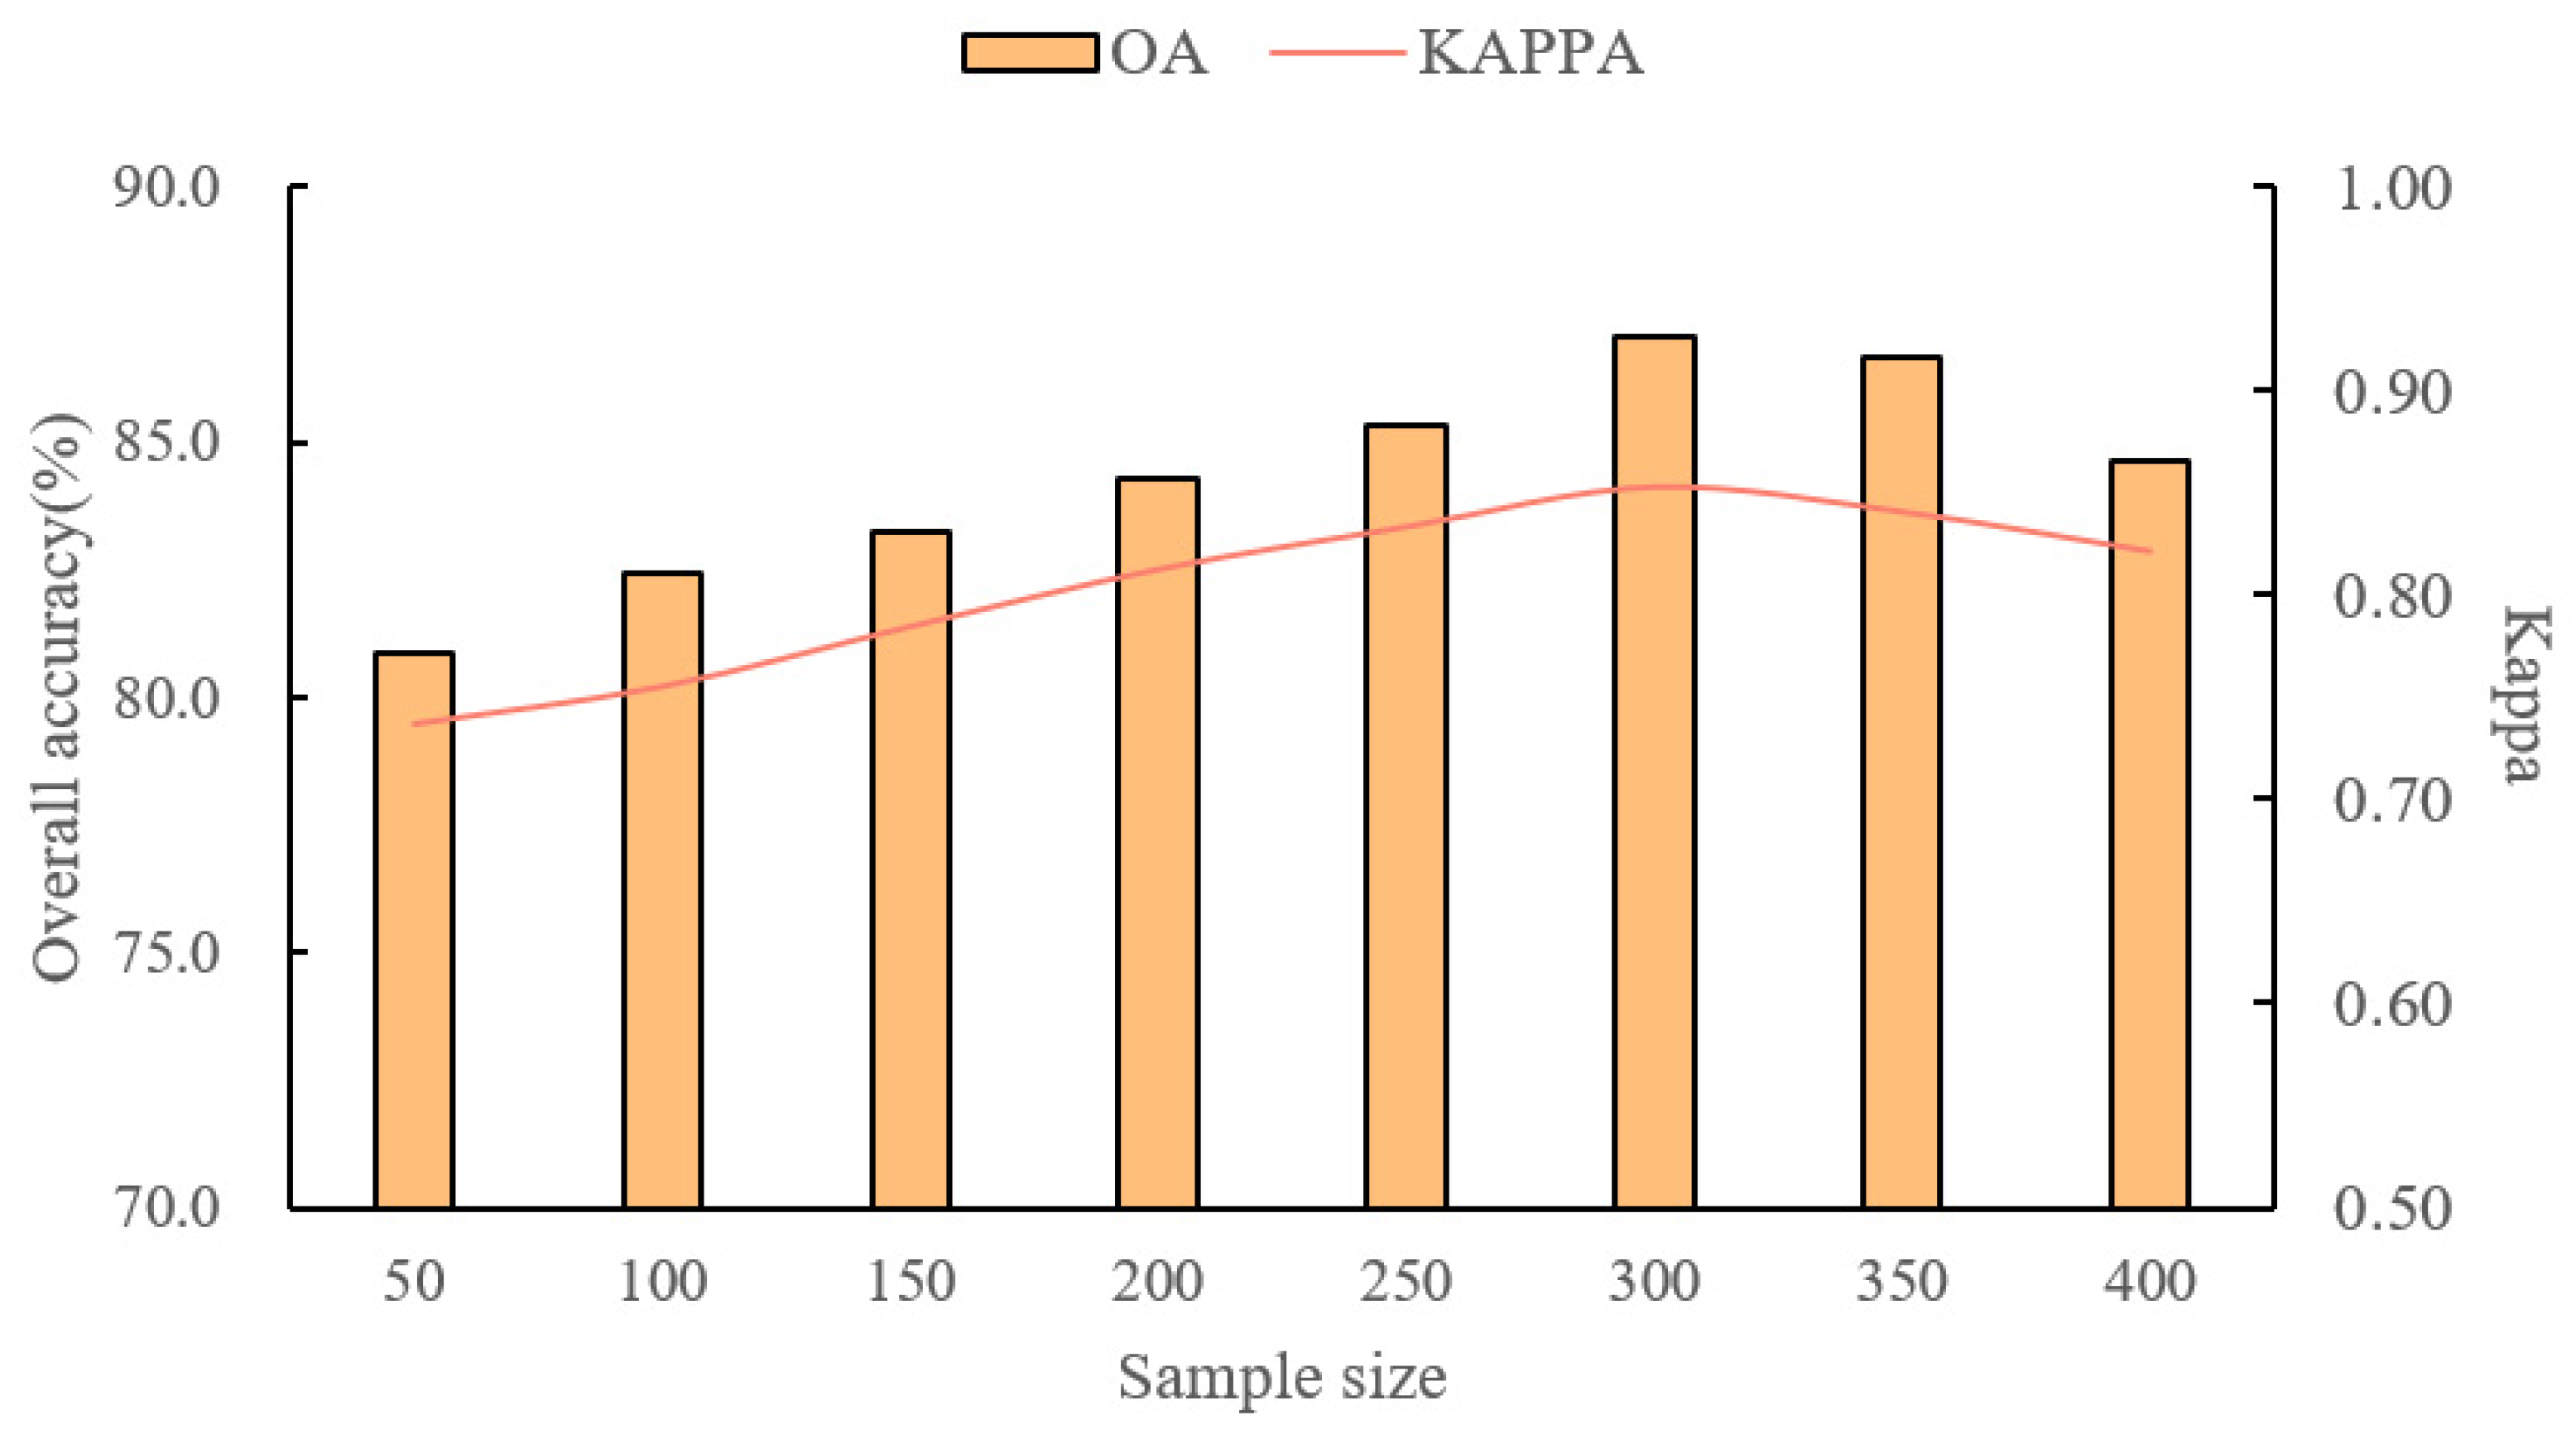
4.6. Forest Tree-Species Classification Results with Different Sample Sizes

Based on Landsat-9 imagery in December 2022, the forest tree species were classified using RF, depending on varying sample sizes. The results are presented in Figure 8.
As depicted in Figure 8, the classification accuracy of forest tree species improves as the number of samples in each category increases, eventually reaching a point of stabilization. This stabilization occurs when the sample count in each category reaches 300 and when the classification results are optimal with an overall accuracy of 87.07% and a kappa coefficient of 0.85. The results indicate that appropriately increasing the number of samples is beneficial for improving the accuracy of tree-species classification, but an excessive number of samples can actually reduce the accuracy and increase computational costs. Therefore, future studies on tree-species classification should select an appropriate number of samples.

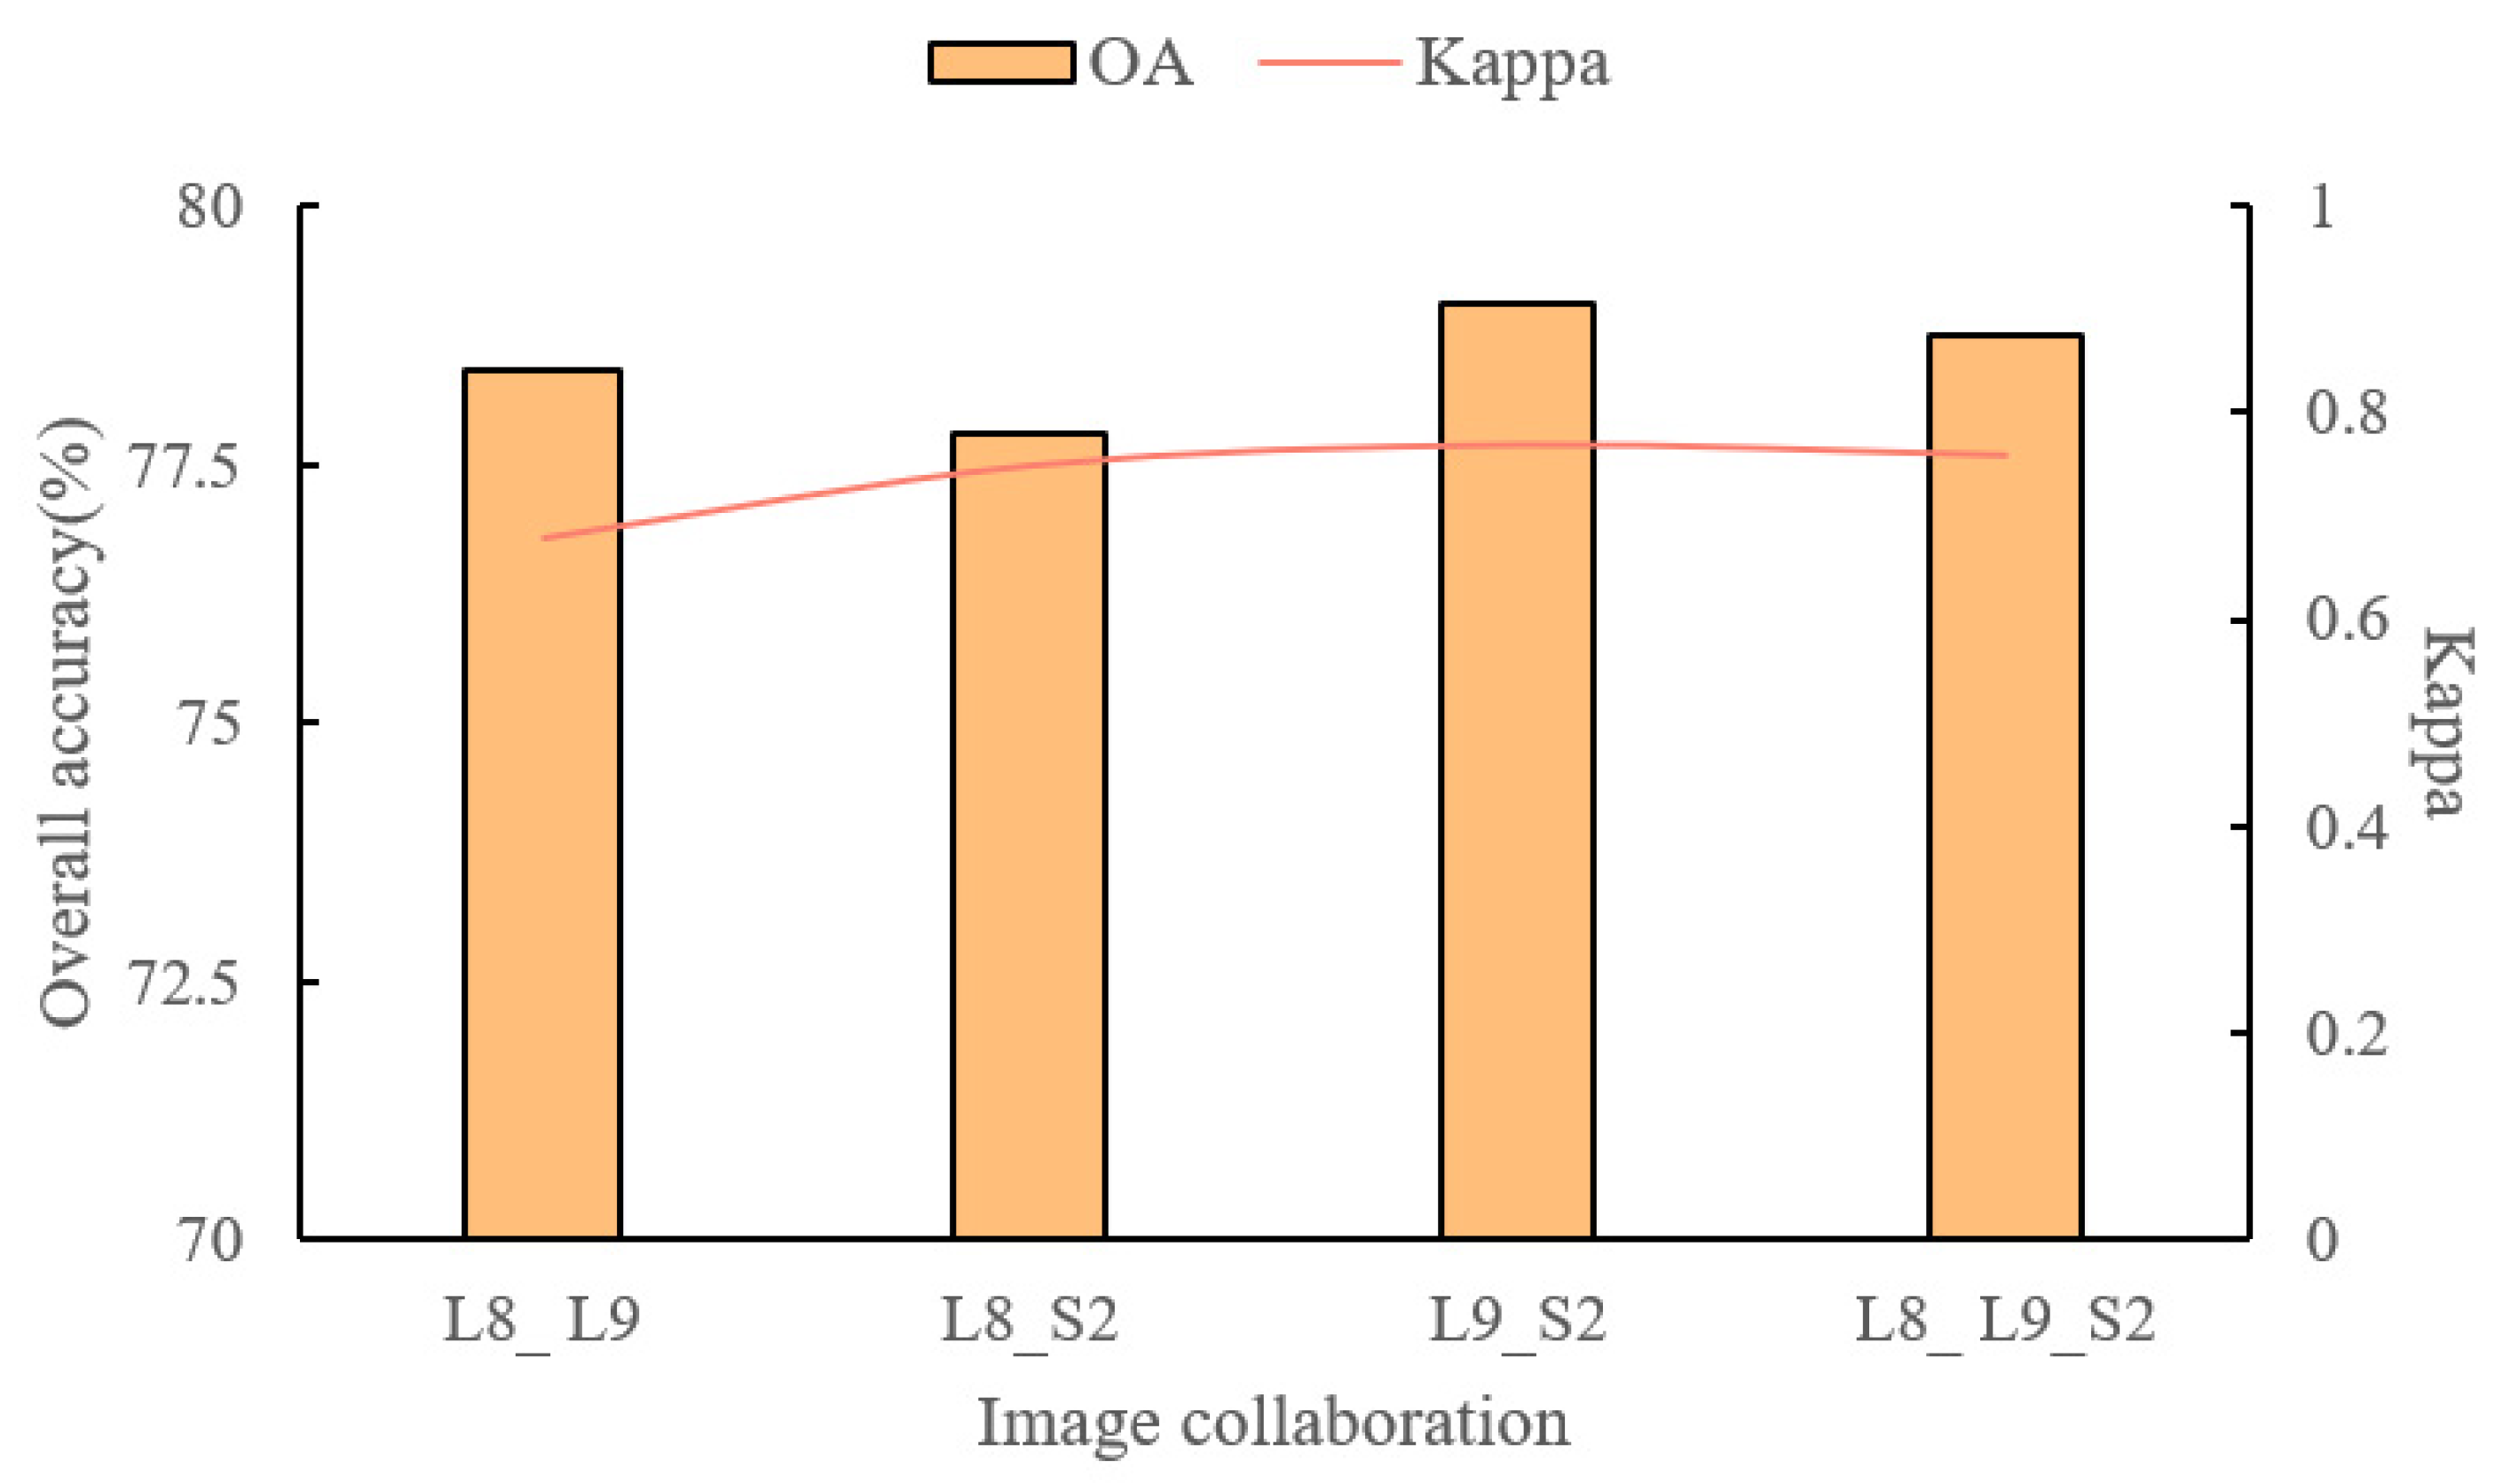
4.7. Forest Tree-Species Classification Results with Multi-Source Data Integration

Preliminary analysis revealed differences in classification results across Landsat-8 imagery, Landsat-9 imagery, and Sentinel-2 imagery, with varying impacts on different tree-species categories. To investigate whether multi-source data integration enhanced classification accuracy, this study combined feature parameters from Landsat-8, Landsat-9, and Sentinel-2 images, both in pairs and collectively. The RF algorithm was then applied to categorize forest tree species, with the results displayed in Figure 9.
Figure 9 shows that the highest classification accuracy for forest tree species was achieved by combining Landsat-9 and Sentinel-2 imagery, with an overall accuracy of 79.06% and a kappa of 0.77. In contrast, the combination of Landsat-8 and Sentinel-2 imagery resulted in the lowest accuracy, with 77.81% and a kappa coefficient of 0.75. These findings suggest that multi-source data integration can enhance classification accuracy, but the inclusion of lower-quality data may reduce it. Therefore, selecting appropriate data sources, such as Landsat and Sentinel-2, is crucial for improving classification accuracy.
In summary, various factors differently affect the classification results. The original 30-m Landsat-9-imagery classification results were used as a benchmark, and these impacts were quantified and compared, as shown in Figure 10. Please refer to Tables S7 and S8 for analysis of significance of differences in results
As shown in Figure 10, among the influencing factors, the classification algorithm, image time phase, and sample size had relatively large impacts on tree-species classification results, each exceeding 10%. The positive impact of radiometric resolution was the smallest, at only 3.15%. The impacts of spectral resolution and spatial resolution on tree-species classification results were negative, at −2.11% and −1.4%, respectively. The results indicate that, for the classification of forest tree species, higher spatial and spectral resolutions do not necessarily yield better results. Therefore, future forest tree-species classification studies should prioritize the impacts of the image time phase and sample size among the various influencing factors.

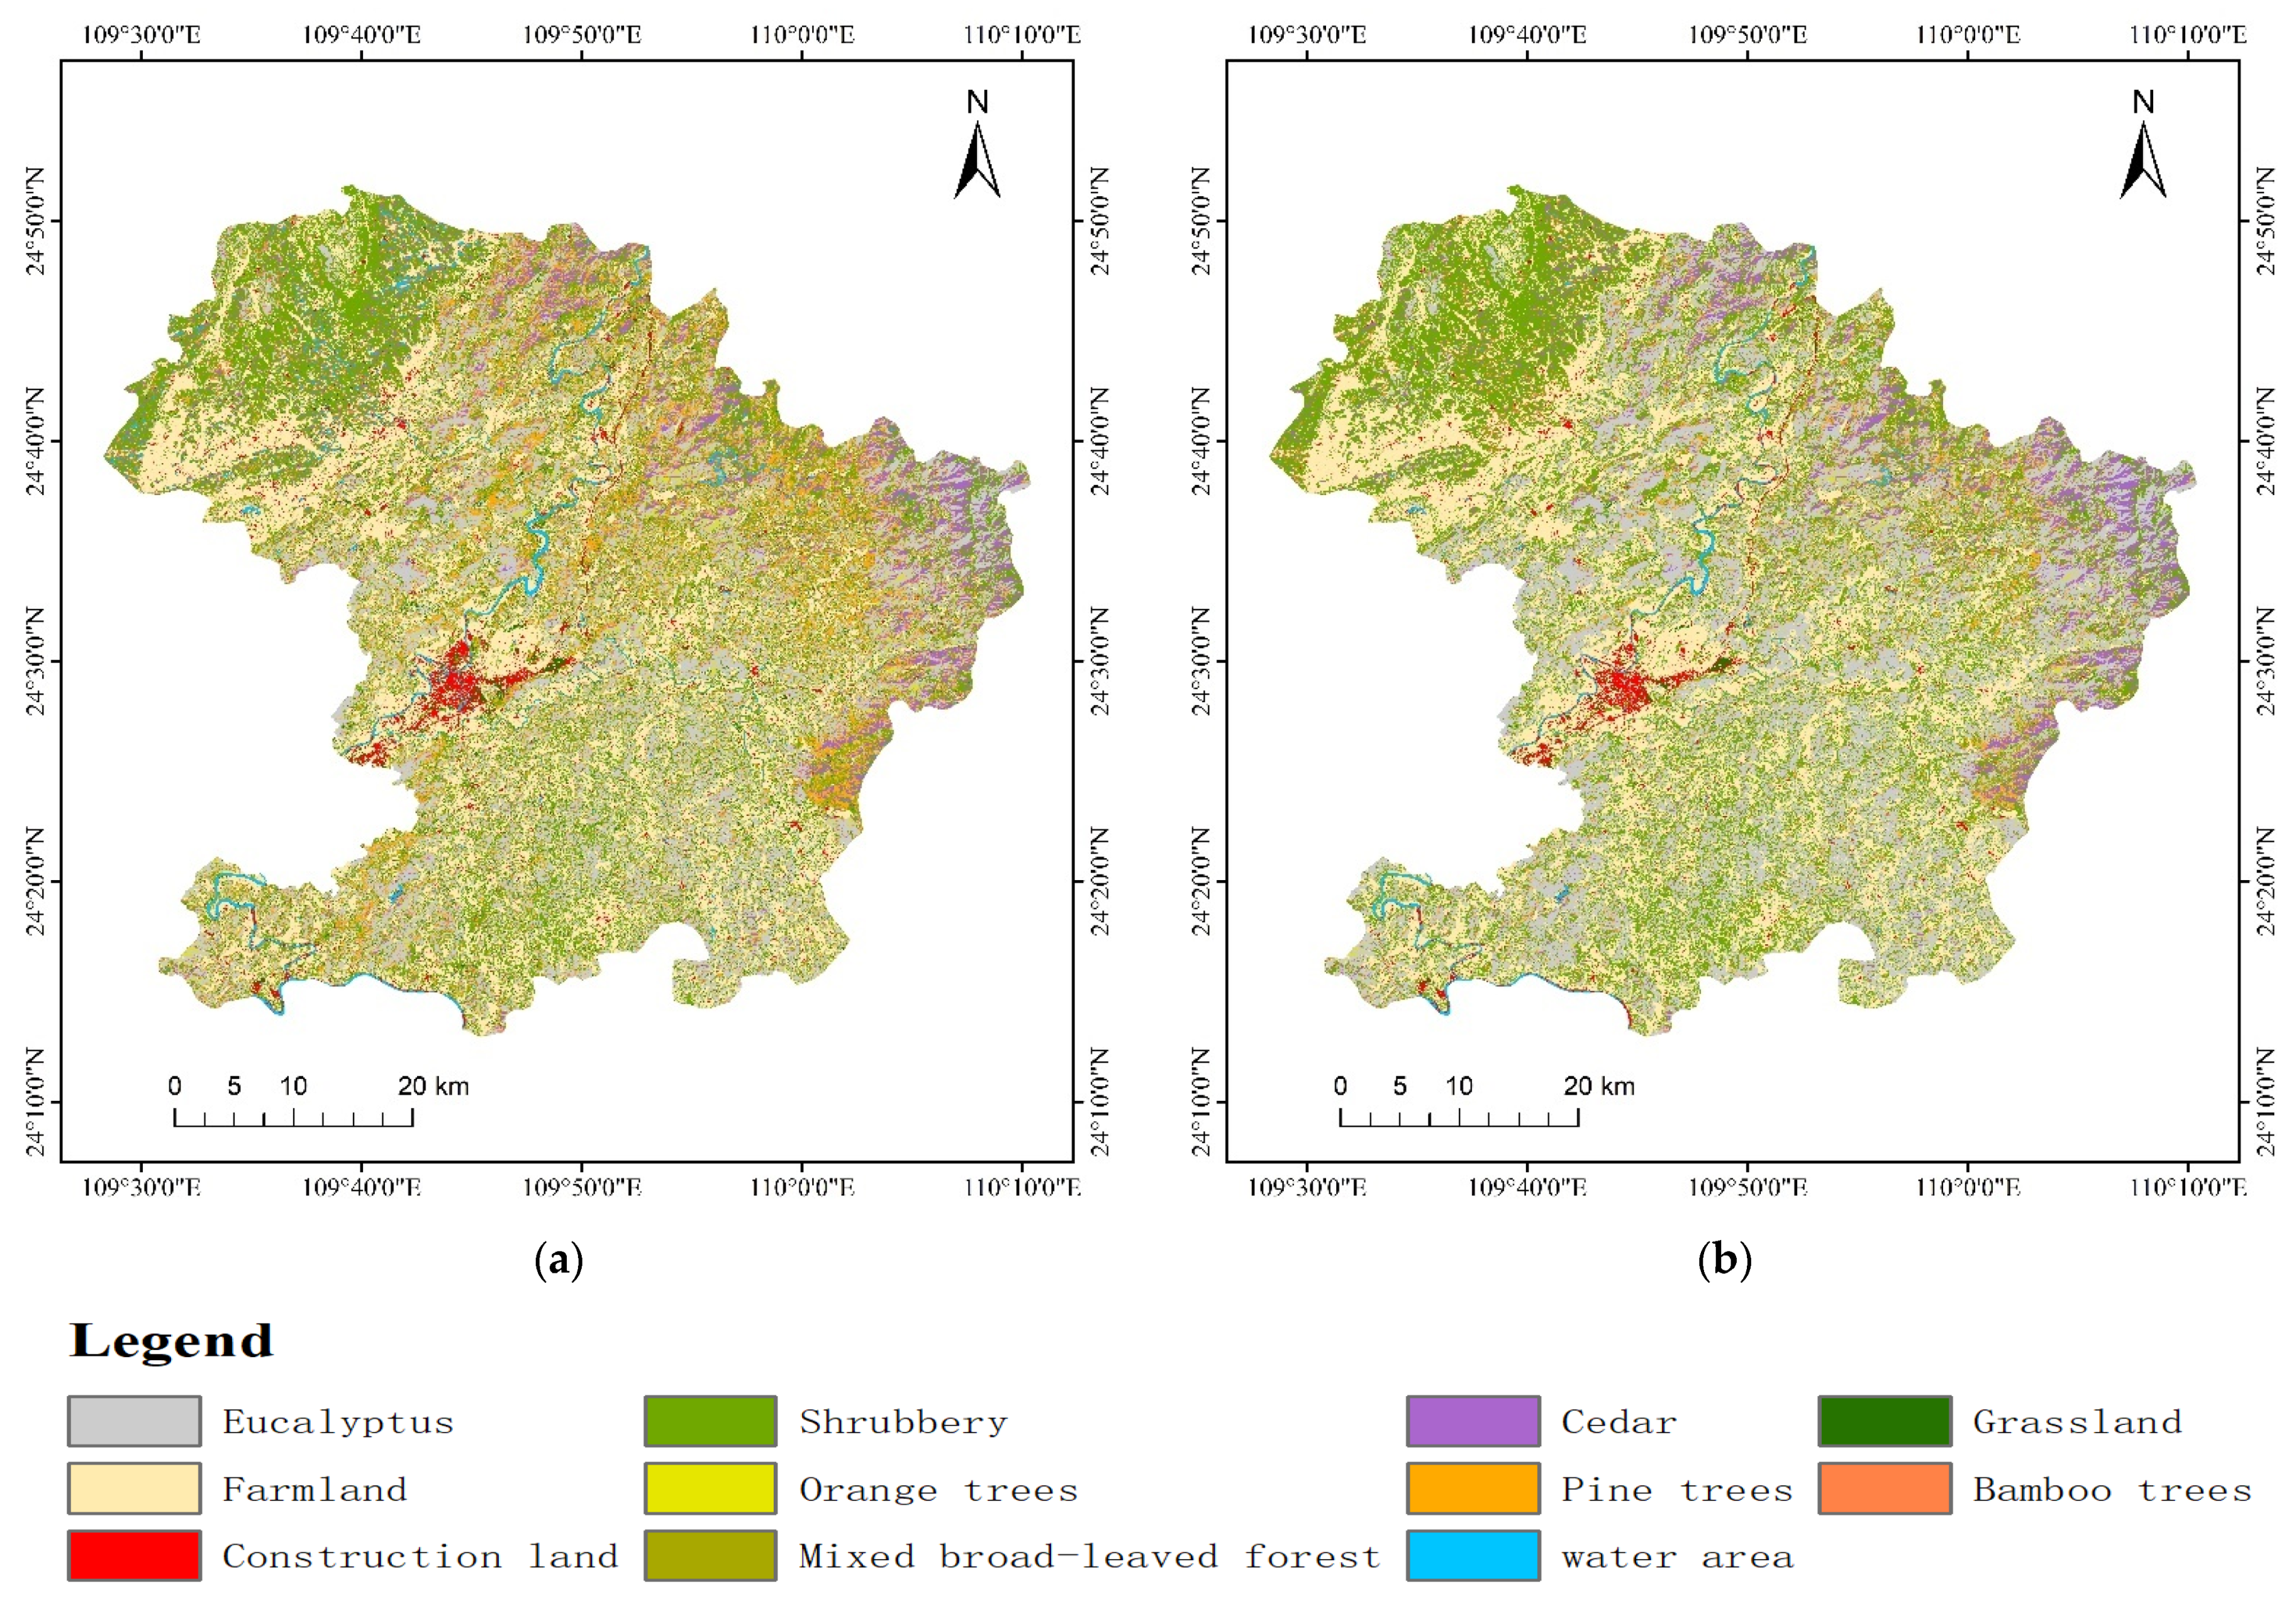
4.8. Forest Tree-Species Classification Results with Optimal Scheme

Based on the previous analysis, using the RF algorithm for classification based on 30 m spring Landsat-9 and Sentinel-2 imagery with a sample size of 300 for each category of tree species yields the best result (Figure 11).
The overall accuracy of the classification results based on the optimal scheme was 87.61%, and the kappa coefficient was 0.86, which were improvements of 13.40% and 0.15 compared to the tree-species classification results using 30-m Landsat-9 imagery (OA = 74.21% and kappa = 0.71). Figure 11 shows that the classification results based on the optimal scheme extracted more eucalyptus areas. Comparing by region reveals that differences in the classification results for eucalyptus and pine trees were observed in the northern area; discrepancies in shrubbery and orange-tree classifications were observed in the central area, and differences in eucalyptus and mixed broad-leaved forest were observed in the lower right area. The overall extraction differences between the two schemes were significant, especially in the border areas between different tree species. A comparison with Google Earth real-time imagery indicates that the tree-species classification results based on the optimal scheme were closer to actual conditions.

5. Discussion

5.1. Analysis of Differences in Forest-Species Classification between Landsat and Sentinel-2 Imagery Data

Landsat and Sentinel-2 satellite imagery are the most commonly used optical remote-sensing data for the classification of forest tree species. This is not only because Landsat and Sentinel-2 series satellite imagery covers the entire globe, are publicly available, and are free of charge but also because their spatial resolution is suitable for forest resource monitoring. However, due to some differences in spectral resolution, spatial resolution, and radiometric resolution between the two data sources, there are some differences in tree-species classification results. As shown in the results of this study, for Landsat-8, Landsat-9, and Sentinel-2 imagery, the classification of tree species results derived from Landsat-9 data outperform those derived from Sentinel-2 imagery and Landsat-8 imagery. Although Sentinel-2 imagery has a higher spatial resolution and more spectral bands than Landsat-9, its tree-species classification results are inferior to those of Landsat-9 imagery. This indicates that increasing spatial and spectral resolutions does not necessarily improve classification accuracy. This aligns with the findings of previous research. For instance, Jombo et al. [38] applied random forest and k-nearest neighbor algorithms to land-use and land-cover (LULC) classification based on Landsat-9, Landsat-8, and Sentinel-2 data. The results indicated that the RF classifier outperformed k-nearest neighbor in LULC, with overall accuracies of 96%, 92%, and 94% for Landsat-9, Landsat-8, and Sentinel-2 images, respectively. Similarly, the overall accuracies in k-nearest neighbor were 95% (Landsat-9), 91% (Landsat-8), and 90% (Sentinel-2). This study also shows that the Landsat-9 and Sentinel-2 imagery classification results are better than those of Landsat-8, indicating that higher radiometric resolution is more conducive to classification in forest tree-species studies. It is mainly because the radiometric resolution of Landsat-9 and Sentinel-2 images is 14 bits, while that of Landsat-8 images is 12 bits. This is in agreement with earlier research findings. For instance, You et al. [21] applied a gradient tree boosting algorithm utilizing Landsat-9 and Landsat-8 for classification, finding that Landsat-9 produced better forest tree-species classification results than Landsat-8, with an OA improvement of 6.01%. Shahfahad et al. [39] also applied a support vector machine for land-use classification based on Landsat-8 and Landsat-9 imagery, and the classification results of Landsat-9 images (with an overall accuracy of 94.1%) outperformed those of Landsat-8 imagery (with an OA of 87.00%). In summary, spatial resolution, radiometric resolution, and spectral resolution are factors that affect the classification of forest tree-species results. Therefore, future classification studies should select suitable spatial resolution and higher radiometric resolution imagery to improve the accuracy of classification results.

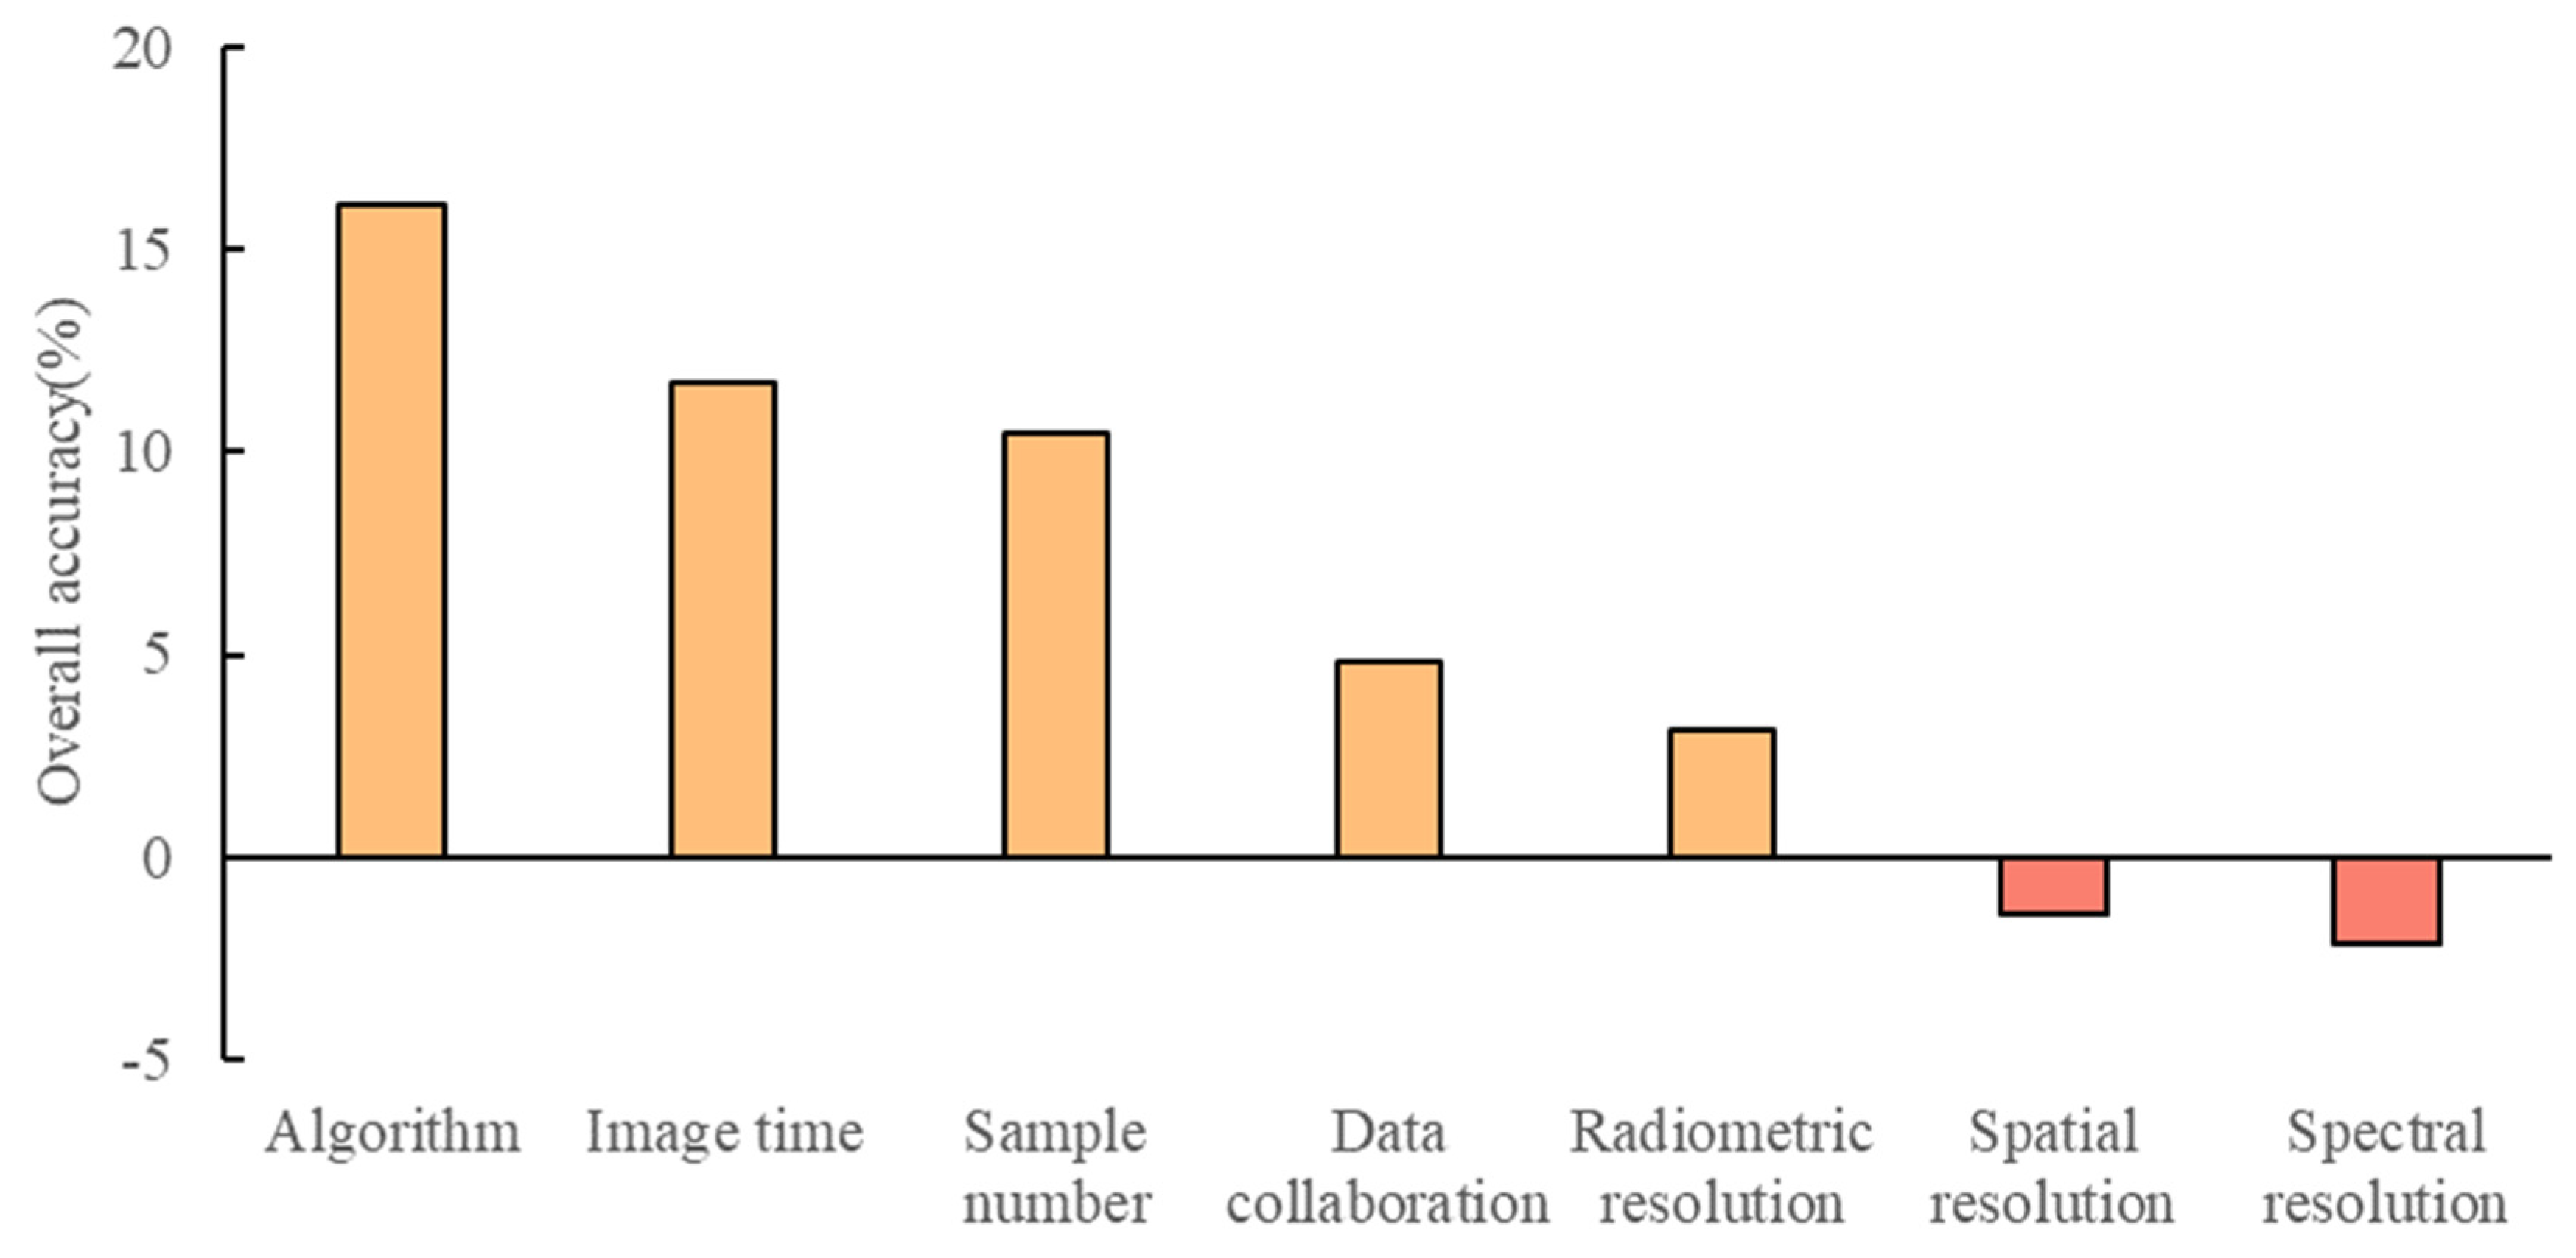
5.2. Analysis of Influencing Factors on Forest Tree-Species Classification

Previous studies have shown that forest tree-species classification results are influenced by various factors, such as image quality, classification algorithms, samples, and image time phases. Therefore, exploring the impacts of different factors is crucial for improving forest tree-species classification results. Researchers have conducted many related studies. For example, Li et al. [14] used decision trees, random forests, and support vector machines to identify forest types based on multi-temporal Landsat data. The results indicated that the classification accuracy using random forests and support vector machines was relatively high, at 87.3% and 88.2%, respectively, which was superior to the results of decision trees. Higgs et al. [40] used the random forest method to classify plantation forests based on Sentinel-2 imagery. The results showed that larger sample sizes would result in a higher overall accuracy. When the sample size increased from 67% to 100%, the overall accuracy increased by only 2%. Shirazinejad et al. [41] conducted a classification of forest tree species using time-series Sentinel-2 imagery, and the results showed that multi-temporal tree-species classification results were 28% higher in overall accuracy compared to single-temporal Sentinel-2 imagery. To further quantify and compare the impacts of different factors, this study systematically compared the impacts of different factors based on single-factor studies. The results show that, among spectral resolution, spatial resolution, radiometric resolution, classification algorithm, sample size, and image time phase influences, the impacts of the image time phase and sample size on tree-species classification results are relatively large, with radiometric resolution having the smallest positive impact. This is similar to the findings of Verde et al. [42]. Verde et al. used the Bagging classification trees algorithm to study the impact of radiometric resolution on remote sensing data classification accuracy based on Ikonos-2 imagery, and the results showed that using a lower radiometric resolution (resampling Ikonos radiometric resolution to 8-bit) yielded a slightly increased overall accuracy (OA = 88%; kappa = 0.75) in comparison to the finer 11-bit radiometric-resolution imagery (OA = 86%; kappa = 0.72), while also requiring less computation time. This study also shows that increasing the spectral and spatial resolution did not improve tree-species classification accuracy, which is consistent with the findings of Duveiller et al. [43]. Duveiller concluded that increasing spatial resolution does not always improve classification accuracy, as a higher spatial resolution introduces greater within-class variance. Similar to the radiometric resolution effect identified by Verde et al., Awuah et al. [44] observed that areas with rich detail, such as urban regions, performed better with a higher spatial resolution, while larger, less detailed categories like grasslands showed improved accuracy with a lower spatial resolution. For specific targets, sensor selection should not be based solely on the number of bands or spectral resolution but should instead comprehensively consider the target’s spectral characteristics and the required ground resolution.

6. Conclusions

To compare the differences in the commonly used optical imagery in tree-species classification studies and quantify the impacts of various factors on tree-species classification results, this study used Landsat-8, Landsat-9, and Sentinel-2 imagery and employed RF, GTB, and SVM algorithms for the classification of forest species. The main conclusions are as follows:
(1)
Among Landsat-8, Landsat-9, and Sentinel-2 imagery, Landsat-9 provides the best tree-species classification results, while Landsat-8 performs the worst. The findings indicate that a higher radiometric resolution improves tree-species classification.
(2)
Among the influencing factors such as spectral resolution, spatial resolution, radiometric resolution, classification algorithm, sample size, and image time phase, the impacts of the image time phase and sample size on tree-species classification results are relatively large, each exceeding 10%, while the positive impact of radiometric resolution is the smallest, at only 3.15%. However, the impacts of spectral resolution and spatial resolution on tree-species classification results are negative, at −2.11% and −1.4%, respectively.
(3)
Using the RF algorithm with 300 samples per tree species category on 30-m spring Landsat-9 and Sentinel-2 imagery yields the most accurate classification results, achieving an OA of 85.93% and a kappa of 0.84. This represents improvements of 11.72% in accuracy and 0.13 in the kappa coefficient compared to results using only 30-m Landsat-9 imagery.
Although this study investigated the differences in tree-species classification using commonly used optical imagery (Landsat-8, Landsat-9, and Sentinel-2) and quantified the impacts of various factors on tree-species classification results, it only focused on forest tree-species classification under subtropical climate conditions. As for other climate zones, such as tropical and temperate regions, the classification results still need further validation. Due to the influence of clouds and rain, this study only investigated the differences in tree-species classification results for four seasons, without in-depth monthly analysis. Future studies will further enhance multi-regional validation and specific monthly-scale result verification to improve the accurate regional classification of forest tree species.

Supplementary Materials

The following supporting information can be downloaded at https://www.mdpi.com/article/10.3390/f15091511/s1, Table S1: UA and PA of forest species classification for different radiometric resolution images; Table S2: Significance test results of forest species classification UA and PA using different radiometric resolution images; Table S3: UA and PA of forest species classification for different spectral resolution images; Table S4: Significance test results of forest species classification UA and PA using different spectral resolution images; Table S5: UA and PA of forests tree species using Landsat-9 images in different seasons; Table S6: The one-way ANOVA test results of forest tree species UA and PA using Landsat-9 images from four seasons; Table S7: UA and PA of forest species classification with multi-source data integration; Table S8: The one-way ANOVA test results of forest tree species UA and PA using Landsat-9 images with multi-source data integration.

Author Contributions

Conceptualization, X.L. and H.Y.; methodology, X.L.; software, X.L.; validation, Z.R., Y.L., and R.H.; formal analysis, J.C.; investigation, X.T.; writing—original draft preparation, X.L. and H.Y.; writing—review and editing, H.Y.; supervision, H.Y. and J.C.; funding acquisition, H.Y. All authors have read and agreed to the published version of the manuscript.

Funding

This study was supported by grants from the National Natural Science Foundation of China (42261063 and 41901370), the Guangxi Natural Science Foundation (2018GXNSFBA281075), the Guangxi Science and Technology Base and Talent Project (GuikeAD19110064), and the Scientific Research Foundation of Guilin University of Technology (GLUTQD2017094).

Data Availability Statement

The original contributions presented in the study are included in the article/supplementary material, further inquiries can be directed to the corresponding author/s.

Acknowledgments

The authors sincerely thank the editors and the anonymous reviewers for their constructive feedback and valuable suggestions, which have greatly contributed to the improvement of this manuscript. We would also like to thank NASA for providing data and the GEE platform for providing access to other multi-source remote-sensing data.

Conflicts of Interest

The authors declare no conflicts of interest.

References

  1. Silva, L.C.R.; Anand, M. Probing for the Influence of Atmospheric CO2 and Climate Change on Forest Ecosystems across Biomes. Glob. Ecol. Biogeogr. 2013, 22, 83–92. [Google Scholar] [CrossRef]
  2. Torello-Raventos, M.; Feldpausch, T.R.; Veenendaal, E.; Schrodt, F.; Saiz, G.; Domingues, T.F.; Djagbletey, G.; Ford, A.; Kemp, J.; Marimon, B.S.; et al. On the Delineation of Tropical Vegetation Types with an Emphasis on Forest/Savanna Transitions. Plant Ecol. Divers. 2013, 6, 101–137. [Google Scholar] [CrossRef]
  3. Mellor, A.; Haywood, A.; Stone, C.; Jones, S. The Performance of Random Forests in an Operational Setting for Large Area Sclerophyll Forest Classification. Remote Sens. 2013, 5, 2838–2856. [Google Scholar] [CrossRef]
  4. Leckie, D.G.; Gougeon, F.; McQueen, R.; Oddleifson, K.; Hughes, N.; Walsworth, N.; Gray, S. Production of a Large-Area Individual Tree Species Map for Forest Inventory in a Complex Forest Setting and Lessons Learned. Can. J. Remote Sens. 2017, 43, 140–167. [Google Scholar] [CrossRef]
  5. Jurjević, L.; Liang, X.; Gašparović, M.; Balenović, I. Is Field-Measured Tree Height as Reliable as Believed—Part II, A Comparison Study of Tree Height Estimates from Conventional Field Measurement and Low-Cost Close-Range Remote Sensing in a Deciduous Forest. ISPRS J. Photogramm. Remote Sens. 2020, 169, 227–241. [Google Scholar] [CrossRef]
  6. Pu, R. Mapping Tree Species Using Advanced Remote Sensing Technologies: A State-of-the-Art Review and Perspective. J. Remote Sens. 2021. [Google Scholar] [CrossRef]
  7. Wang, K.; Franklin, S.E.; Guo, X.; Cattet, M. Remote Sensing of Ecology, Biodiversity and Conservation: A Review from the Perspective of Remote Sensing Specialists. Sensors 2010, 10, 9647–9667. [Google Scholar] [CrossRef] [PubMed]
  8. Welle, T.; Aschenbrenner, L.; Kuonath, K.; Kirmaier, S.; Franke, J. Mapping Dominant Tree Species of German Forests. Remote Sens. 2022, 14, 3330. [Google Scholar] [CrossRef]
  9. Walsh, S.J. Coniferous Tree Species Mapping Using LANDSAT Data. Remote Sens. Environ. 1980, 9, 11–26. [Google Scholar] [CrossRef]
  10. Wessel, M.; Brandmeier, M.; Tiede, D. Evaluation of Different Machine Learning Algorithms for Scalable Classification of Tree Types and Tree Species Based on Sentinel-2 Data. Remote Sens. 2018, 10, 1419. [Google Scholar] [CrossRef]
  11. Soleimannejad, L.; Ullah, S.; Abedi, R.; Dees, M.; Koch, B. Evaluating the Potential of Sentinel-2, Landsat-8, and Irs Satellite Images in Tree Species Classification of Hyrcanian Forest of Iran Using Random Forest. J. Sustain. For. 2019, 38, 615–628. [Google Scholar] [CrossRef]
  12. Phiri, D.; Simwanda, M.; Salekin, S.; Nyirenda, V.R.; Murayama, Y.; Ranagalage, M. Sentinel-2 Data for Land Cover/Use Mapping: A Review. Remote Sens. 2020, 12, 2291. [Google Scholar] [CrossRef]
  13. Isbaex, C.; Coelho, A.M.; Isbaex, C.; Coelho, A.M. The Potential of Sentinel-2 Satellite Images for Land-Cover/Land-Use and Forest Biomass Estimation: A Review. In Forest Biomass—From Trees to Energy; IntechOpen: Rijeka, Croatia, 2021; ISBN 978-1-83962-971-6. [Google Scholar]
  14. Li, M.; Im, J.; Beier, C. Machine Learning Approaches for Forest Classification and Change Analysis Using Multi-Temporal Landsat TM Images over Huntington Wildlife Forest. GIScience Remote Sens. 2013, 50, 361–384. [Google Scholar] [CrossRef]
  15. Grabska, E.; Hostert, P.; Pflugmacher, D.; Ostapowicz, K. Forest Stand Species Mapping Using the Sentinel-2 Time Series. Remote Sens. 2019, 11, 1197. [Google Scholar] [CrossRef]
  16. Thanh Noi, P.; Kappas, M. Comparison of Random Forest, k-Nearest Neighbor, and Support Vector Machine Classifiers for Land Cover Classification Using Sentinel-2 Imagery. Sensors 2018, 18, 18. [Google Scholar] [CrossRef]
  17. Liu, Y.; Gong, W.; Hu, X.; Gong, J. Forest Type Identification with Random Forest Using Sentinel-1A, Sentinel-2A, Multi-Temporal Landsat-8 and DEM Data. Remote Sens. 2018, 10, 946. [Google Scholar] [CrossRef]
  18. Immitzer, M.; Neuwirth, M.; Böck, S.; Brenner, H.; Vuolo, F.; Atzberger, C. Optimal Input Features for Tree Species Classification in Central Europe Based on Multi-Temporal Sentinel-2 Data. Remote Sens. 2019, 11, 2599. [Google Scholar] [CrossRef]
  19. Hościło, A.; Lewandowska, A. Mapping Forest Type and Tree Species on a Regional Scale Using Multi-Temporal Sentinel-2 Data. Remote Sens. 2019, 11, 929. [Google Scholar] [CrossRef]
  20. Masek, J.G.; Wulder, M.A.; Markham, B.; McCorkel, J.; Crawford, C.J.; Storey, J.; Jenstrom, D.T. Landsat 9: Empowering Open Science and Applications through Continuity. Remote Sens. Environ. 2020, 248, 111968. [Google Scholar] [CrossRef]
  21. You, H.; Huang, Y.; Qin, Z.; Chen, J.; Liu, Y. Forest Tree Species Classification Based on Sentinel-2 Images and Auxiliary Data. Forests 2022, 13, 1416. [Google Scholar] [CrossRef]
  22. Broge, N.H.; Leblanc, E. Comparing Prediction Power and Stability of Broadband and Hyperspectral Vegetation Indices for Estimation of Green Leaf Area Index and Canopy Chlorophyll Density. Remote Sens. Environ. 2001, 76, 156–172. [Google Scholar] [CrossRef]
  23. Haboudane, D.; Miller, J.R.; Tremblay, N.; Zarco-Tejada, P.J.; Dextraze, L. Integrated Narrow-Band Vegetation Indices for Prediction of Crop Chlorophyll Content for Application to Precision Agriculture. Remote Sens. Environ. 2002, 81, 416–426. [Google Scholar] [CrossRef]
  24. McFeeters, S.K. The Use of the Normalized Difference Water Index (NDWI) in the Delineation of Open Water Features. Int. J. Remote Sens. 1996, 17, 1425–1432. [Google Scholar] [CrossRef]
  25. Daughtry, C.S.T.; Walthall, C.L.; Kim, M.S.; de Colstoun, E.B.; McMurtrey, J.E. Estimating Corn Leaf Chlorophyll Concentration from Leaf and Canopy Reflectance. Remote Sens. Environ. 2000, 74, 229–239. [Google Scholar] [CrossRef]
  26. Huete, A.; Justice, C.; Liu, H. Development of Vegetation and Soil Indices for MODIS-EOS. Remote Sens. Environ. 1994, 49, 224–234. [Google Scholar] [CrossRef]
  27. Broge, N.H.; Mortensen, J.V. Deriving Green Crop Area Index and Canopy Chlorophyll Density of Winter Wheat from Spectral Reflectance Data. Remote Sens. Environ. 2002, 81, 45–57. [Google Scholar] [CrossRef]
  28. Bolyn, C.; Michez, A.; Gaucher, P.; Lejeune, P.; Bonnet, S. Forest Mapping and Species Composition Using Supervised per Pixel Classification of Sentinel-2 Imagery. Biotechnol. Agron. Société Environ. 2018, 22, 16. [Google Scholar] [CrossRef]
  29. Bridhikitti, A.; Overcamp, T.J. Estimation of Southeast Asian Rice Paddy Areas with Different Ecosystems from Moderate-Resolution Satellite Imagery. Agric. Ecosyst. Environ. 2012, 146, 113–120. [Google Scholar] [CrossRef]
  30. Gamon, J.A.; Surfus, J.S. Assessing Leaf Pigment Content and Activity with a Reflectometer. New Phytol. 1999, 143, 105–117. [Google Scholar] [CrossRef]
  31. le Maire, G.; François, C.; Dufrêne, E. Towards Universal Broad Leaf Chlorophyll Indices Using PROSPECT Simulated Database and Hyperspectral Reflectance Measurements. Remote Sens. Environ. 2004, 89, 1–28. [Google Scholar] [CrossRef]
  32. Fourty, T.; Baret, F.; Jacquemoud, S.; Schmuck, G.; Verdebout, J. Leaf Optical Properties with Explicit Description of Its Biochemical Composition: Direct and Inverse Problems. Remote Sens. Environ. 1996, 56, 104–117. [Google Scholar] [CrossRef]
  33. Gitelson, A.A.; Gritz, Y.; Merzlyak, M.N. Relationships between Leaf Chlorophyll Content and Spectral Reflectance and Algorithms for Non-Destructive Chlorophyll Assessment in Higher Plant Leaves. J. Plant Physiol. 2003, 160, 271–282. [Google Scholar] [CrossRef] [PubMed]
  34. Breiman, L. Random Forests. Mach. Learn. 2001, 45, 5–32. [Google Scholar] [CrossRef]
  35. Pal, M. Random Forest Classifier for Remote Sensing Classification. Int. J. Remote Sens. 2005, 26, 217–222. [Google Scholar] [CrossRef]
  36. Vu, Q.-V.; Truong, V.-H.; Thai, H.-T. Machine Learning-Based Prediction of CFST Columns Using Gradient Tree Boosting Algorithm. Compos. Struct. 2021, 259, 113505. [Google Scholar] [CrossRef]
  37. Pal, M.; Mather, P.M. Support Vector Machines for Classification in Remote Sensing. Int. J. Remote Sens. 2005, 26, 1007–1011. [Google Scholar] [CrossRef]
  38. Jombo, S.; Adelabu, S. Evaluating Landsat-8, Landsat-9 and Sentinel-2 Imageries in Land Use and Land Cover (LULC) Classification in a Heterogeneous Urban Area. GeoJournal 2023, 88, 377–399. [Google Scholar] [CrossRef]
  39. Shahfahad, T.S.; Naikoo, M.W.; Rahman, A.; Gagnon, A.S.; Islam, A.R.M.T.; Mosavi, A. Comparative Evaluation of Operational Land Imager Sensor on Board Landsat 8 and Landsat 9 for Land Use Land Cover Mapping over a Heterogeneous Landscape. Geocarto Int. 2023, 38, 2152496. [Google Scholar] [CrossRef]
  40. Higgs, C.; van Niekerk, A. Impact of Training Set Configurations for Differentiating Plantation Forest Genera with Sentinel-2 Imagery and Machine Learning. Remote Sens. 2022, 14, 3992. [Google Scholar] [CrossRef]
  41. Shirazinejad, G.; Javad Valadan Zoej, M.; Latifi, H. Applying Multidate Sentinel-2 Data for Forest-Type Classification in Complex Broadleaf Forest Stands. For. Int. J. For. Res. 2022, 95, 363–379. [Google Scholar] [CrossRef]
  42. Verde, N.; Mallinis, G.; Tsakiri-Strati, M.; Georgiadis, C.; Patias, P. Assessment of Radiometric Resolution Impact on Remote Sensing Data Classification Accuracy. Remote Sens. 2018, 10, 1267. [Google Scholar] [CrossRef]
  43. Löw, F.; Duveiller, G. Defining the Spatial Resolution Requirements for Crop Identification Using Optical Remote Sensing. Remote Sens. 2014, 6, 9034–9063. [Google Scholar] [CrossRef]
  44. Awuah, K.T.; Nölke, N.; Freudenberg, M.; Diwakara, B.N.; Tewari, V.P.; Kleinn, C. Spatial Resolution and Landscape Structure along an Urban-Rural Gradient: Do They Relate to Remote Sensing Classification Accuracy?—A Case Study in the Megacity of Bengaluru, India. Remote Sens. Appl. Soc. Environ. 2018, 12, 89–98. [Google Scholar] [CrossRef]
Figure 1. Spatial distribution map and sampling locations of the study area.
Forests 15 01511 g001
Figure 2. The flowchart of the study.
Forests 15 01511 g002
Figure 3. Results of forest-species classification for different radiometric-resolution images: (a) OA and kappa; (b) UA and PA.
Forests 15 01511 g003
Figure 4. Results of forest tree-species classification for different spectral-resolution images: (a) OA and kappa; (b) UA and PA.
Forests 15 01511 g004
Figure 5. OA and kappa statistics for classification results across different resolutions.
Forests 15 01511 g005
Figure 6. Classification results of forest-tree species in different spatial resolutions of Landsat-9 and Sentinel-2 images: (a) UA and (b) PA.
Forests 15 01511 g006
Figure 7. Classification results using Landsat-9 images in different seasons.
Forests 15 01511 g007
Figure 8. Classification results of forest tree species with different sample sizes.
Forests 15 01511 g008
Figure 9. OA and kappa of tree-species classification with multi-source data integration.
Forests 15 01511 g009
Figure 10. Influence of different factors on forest species classification outcomes (using 30-m Landsat-9 data). Light orange represents positive values and light red represents negative values.
Forests 15 01511 g010
Figure 11. Forest-species classification in the study area: (a) tree-species classification using 30-m Landsat-9 imagery; (b) classification results using the optimal scheme.
Forests 15 01511 g011
Table 1. Number of sample points in each category.
CategoriesNumber of Samples
Eucalyptus60
Bamboo trees35
Pine trees35
Cedar35
Orange trees35
Shrubbery35
Mixed broad-leaved forest30
Water area30
Farmland60
Construction land25
Grassland25
Table 2. Parameters of Landsat 8 and Landsat 9 sensors.
SensorBandWavelength/μmRadiometric Resolution/BitImage Time Used
OLI/OLI-2Band 10.435–0.451/0.435–0.45012/14OLI images from December 2022
OLI-2 images from March 2022 to March 2023
Band 20.452–0.512/0.452–0.51212/14
Band 30.533–0.590/0.532–0.58912/14
Band 40.636–0.673/0.636–0.67212/14
Band 50.851–0.879/0.850–0.87912/14
Band 61.566–1.651/1.565–1.65112/14
Band 72.107–2.294/2.105–2.29412/14
Band 80.504–0.676/0.503–0.67512/14
Band 91.363–1.384/1.363–1.38412/14
Table 3. Parameters of the Sentinel-2 sensor.
BandWavelength/(μm)Spatial Resolution (m)Image Time Used
B1 (Aerosols)0.443–0.45360December 2022
B2 (Blue)0.458–0.52310
B3 (Green)0.543–0.57810
B4 (Red)0.650–0.68010
B5 (Red Edge 1)0.698–0.71320
B6 (Red Edge 2)0.733–0.74820
B7 (Red Edge 3)0.773–0.79320
B8 (NIR)0.785–0.90010
B8a (VNIR)0.855–0.87520
B9 (Water vapor)0.935–0.95560
B10 (SWIR Cirrus)1.360–1.39060
B11 (SWIR 1)1.565–1.65520
B12 (SWIR 2)2.100–2.28020
Table 4. Distinct feature variables of various characteristics.
FeaturesDataFeature Variable
Spectral reflectanceSentinel-2Band 1, Band 2, Band 3, Band 4, Band 5, Band 6, Band 7, Band 8, Band 8A, Band 9, Band 11, Band 12
Landsat-9Band 1, Band 2, Band 3, Band 4, Band 5, Band 6, Band 7, Band 8, Band 9, Band 10, Band 11
Spectral indicesSentinel-2NDVI, TCARI, TVI, NDWI, SAVI, MSI, LSWI, RDVI, MCARI, NDVI red_ edge, mNDVIred_edge, MSRred_edge, CIred_edge
Landsat-9NDVI, NDWI, TCARI, RDVI, MCARI, TVI, SAVI, MSI, LSWI
Texture featuresSentinel-2Texture metrics are derived from the co-occurrence matrix calculated for each pixel across every spectral band, with each band producing 18 distinct texture features
Landsat-9
Table 5. Tree-species classification results using three different algorithms.
Landsat-8Landsat-9Sentinel-2
OA/%KappaOA/%KappaOA/%Kappa
RF70.12 0.65 74.21 0.71 68.38 0.64
GTB66.43 0.61 70.12 0.66 65.62 0.63
SVM59.38 0.53 58.13 0.51 63.25 0.60
Disclaimer/Publisher’s Note: The statements, opinions and data contained in all publications are solely those of the individual author(s) and contributor(s) and not of MDPI and/or the editor(s). MDPI and/or the editor(s) disclaim responsibility for any injury to people or property resulting from any ideas, methods, instructions or products referred to in the content.

