Article

Effects of Milling Methods on Cutting Performance of Wood–Plastic Composites Based on Principal Component Analysis

1
Co-Innovation Center of Efficient Processing and Utilization of Forest Resources, Nanjing Forestry University, Nanjing 210037, China
2
College of Furnishings and Industrial Design, Nanjing Forestry University, Nanjing 210037, China
3
Wood Science and Engineering, Luleå University of Technology, 931 87 Skellefteå, Sweden
4
Mengtian Furnishings Co., Ltd., Jiashang 314100, China
*
Author to whom correspondence should be addressed.
These authors contributed equally to this work.
Forests 2024, 15(9), 1516; https://doi.org/10.3390/f15091516 (registering DOI)
Submission received: 17 July 2024 / Revised: 21 August 2024 / Accepted: 28 August 2024 / Published: 29 August 2024
(This article belongs to the Special Issue Advances in Technology and Solutions for Wood Processing)

Abstract

:
In the industrial machining of wood–plastic composites, optimization of cutting parameters is key to improving workpiece machinability. To explore the influence of different milling methods of straight-tooth milling, helical milling, and tapered milling on the machinability of wood–plastic composite, a milling experiment was performed. Cutting force, cutting temperature, and surface roughness were selected as evaluative factors. Based on experimental results, principal component analysis was used to analyze the significance of each factor’s contribution and to assess different milling methods of wood–plastic composite for different needs. By calculating the total score from principal component analysis, the optimized cutting mode was determined to be straight-tooth milling, with feed per tooth of 0.2 mm and cutting depth of 0.5 mm. Milling methods in order of decreasing cutting force were helical milling > straight-tooth milling > tapered milling. Milling methods in order of decreasing cutting temperature were helical milling > tapered milling > straight-tooth milling. In terms of the tradeoff between surface quality and processing efficiency, tapered milling is suitable for finishing, considering the machining quality, while helical milling is suitable for roughing, considering the machining efficiency. One of the contributions of this study is to link three separate milling study systems (straight-tooth milling, helical milling, and tapered milling) into one system.

1. Introduction

The world’s forest area is currently in a linear downward trend as forest resources continue to be exploited and destroyed. Global forest area is projected to decline by 477 million hectares between 1999 and 2030, with the largest decline in Asia and Africa [1]. The shortage of timber resources has become an internationally recognized problem, while in many nations the rate of timber consumption is increasing. Meanwhile, vast amounts of timber waste are being discarded, a fact that has aroused wide concern and brought pressures for the environment. Improved recycling methods are urgently needed to minimize environmental impacts [2,3].
Wood–plastic composite (WPC) is a composite material made by mixing wood fiber or wood chips with plastic, followed by extruding and hot pressing [4]. Waste and by-products from wood and agricultural industries can be repurposed as raw materials. For instance, side fractions and paper mill sludge can be reused as a way to simultaneously dispose of waste and reduce consumption of timber resources under certain conditions [3,5,6]. In addition to being a clean material, wood–plastic composite is potentially biodegradable and self-recyclable, which makes it environmentally friendly [7,8]. Moreover, WPC possesses physical and chemical properties that are similar to wood and plastic, and WPC retains advantages of each. For instance, it is mothproof, resistant to corrosion, and exhibits plasticity [9,10,11]. WPC also has the additional advantages of being glue-free, high-strength, and heat-resistant, characteristics that confer wide applicability, such as in interior and exterior products pertaining to furnishing, decorating, and packing [12,13,14]. Previous research has shown that traditional wood cutting theories are not applicable to WPC. WPC has a more homogeneous composition than conventional wood, which exhibits anisotropic and complex properties [15].
Several studies have examined the cutting process in WPC. In straight-tooth milling of WPC, previous results showed that the largest factor in cutting temperature was cutting depth, followed by cutting speed [16,17]. Related work showed that a shallower cutting depth should be used in finishing to maintain surface quality, while deeper cutting depth can be used for pre-cutting to improve cutting efficiency [18]. Results revealed that the main milling parameters significantly affected the surface roughness of WPC [19]. The roughness of the milled surface was analyzed and measured during the cutting process, like cut-in, cutting, and cut-out sections [20]. In this regard, surface roughness in high-speed milling of wood–plastic composite has been systematically studied [21,22]. It increased with an increase in the axial depth, feed rate, and radial depth but decreased with an increase in the spindle speed. Cutting force increased gradually with increasing feed rate [23]. Optimal parameters for improved machinability of WPC have been calculated by the Taguchi method. This research thoroughly investigated the relationship between chip morphology and surface quality and determined that the cutting parameters for optimal surface quality were feed per tooth 0.3 mm and cutting depth 1.5 mm. This provided guidance for the selection of cutting parameters in the present study [24].
When it comes to helical milling, helical edges provided better wear resistance, better surface quality, and lower noise emission compared to the conventional edge of 0° [25]. Thus, it is important to select the proper angles of cutters. Zhu et al. evaluated the effect of cutting depth, spiral angle, and feed per tooth on the power efficiency of the cutting tool by using response surface methodology and selecting a rake angle of 10° [26]. A series of related studies showed that cutting depth was positively correlated with power efficiency in helical milling. Cutting forces were positively related to the depth of cut but negatively correlated with the inclination angle of the cutting edge and with cutting speed [27,28].
So far, no study worldwide has concentrated on the comparison of milling effects between straight-tooth milling, helical milling, and tapered milling on WPC. One of the contributions of this study is the linking of these three milling study systems into one system, which is necessary for woodworking research. In addition, it seeks to provide a scientific reference for industrial machining of WPC.

2. Materials and Methods

2.1. Materials

Material used in this study was WPC board, with dimensions of 150 mm × 70 mm × 20 mm in length, width, and thickness, respectively. The WPC machining experiment was conducted on a computer numerical control (CNC) machining center (MGK01, Nanxing Machinery Co. Ltd., Donguan, China). This CNC machining center had a maximum spindle feed speed of 50 m/min and a maximum rotational speed of 24,000 min−1. WPC was milled using polycrystalline diamond (PCD) cutting tools (Leuco Precision Tooling Co., Ltd., Suzhou, China) under three cutting methods: straight-tooth milling, helical milling, and tapered milling. Number of teeth was 6, and tool diameter was 140 mm. The hardness of milling cutters is 8000 HV. The tool angles are shown in Table 1.

2.2. Experimental Design

During the milling process, cutting force was obtained in three directions (Fx, Fy, and Fz) by dynamometer (Kistler 9257B, Kistler Group, Winterthur, Switzerland) with a measuring range of −5 kN to +5 kN. Fx, Fy, and Fz denote the lateral force, parallel force, and normal force, respectively. The combined cutting force (F) was calculated using the following formula:
F = F x 2 + F y 2 + F z 2
Cutting force was obtained at a sampling frequency of 7100 Hz. The signal was transferred to a signal amplifier and an analog-to-digital converter to obtain the cutting force data. Cutting temperature data was obtained by an infrared imager (ThermoVision A20-M, FLIR Systems Inc., Wilsonville, OR, USA) at a sampling rate of 50 Hz. During milling, the highest temperature between the workpiece and cutting edge was collected (Figure 1).
In addition, surface roughness, which reflects the smoothness of a machined surface, was obtained through a precision roughness tester (JB-4C, Sh-Optical Co. Ltd., Shanghai, China). The direction of the probe measurement was parallel to the feeding direction.
It was convenient for specific adjustment of other processing parameters by controlling feed per tooth, which maintained consistent spacing between successive tooth impacts. As shown in Table 2, the milling parameters were determined by actual production and reference values, with feed rate and cutting length remaining at constant values of 12 m/min and 150 mm, respectively, during the experiments.
The detailed experimental design was given in Table 3. In this work, principal component analysis (PCA) can be used to model and analyze the milling performance of WPC, with the aim of assessing machining modes to ultimately determine the optimal modes for various applications. In addition, it assists in determining the best milling method between straight-tooth milling, helical milling, and tapered milling. In this work, principal component analysis was conducted using SPSS software (Version 27, IBM Inc., Chicago, IL, USA).
Initially, N samples are obtained from cutting experiments, and each sample has P variables (Equation (2)), which forms an N × P data matrix. X1, X2, … Xp are original variables, while Z1, Z2, … Zm (mp) are new variables after principal component extraction, which can be converted into Equation (3).
X = X 11 X 12 X 1 P X 21 X 22 X 2 P   X n 1 X n 2 X 2 P
Z 1 = l 11 X 1 + l 12 X 2 + + l 1 P X P Z 2 = l 21 X 1 + l 22 X 2 + + l 2 P X P                                                   Z m = l m 1 X 1 + l m 2 X 2 + + l m P X P
In Equation (3), lmp is a variable extracted from the main component and determined by the following principles:
(1) Zi and Zj are independent of each other (ij; i, j = 1, 2, … m).
(2) Z1 is the variance maximization of all linear combinations of X1, X2, … Xp; Z2 is the variance maximization of all linear combinations of X1, X2, … Xp that are uncorrelated with Z1; Zm has the largest variance among all linear combinations of X1 and X2 that are uncorrelated with Z1, Z2, … Zm−1.
The essence of principal component analysis is to determine the load lij of the variable on the extracted principal component, which is shown in Equation (4):
l i j = p ( Z i ,   X j ) = λ i e i j
where λi is the eigenvalue of the corresponding ith principal component, and eij represents the jth component of the vector ei. According to the principal component comprehensive model and principal component score, the total principal component score can be calculated along with the sorted total, as shown in Equation (5) [29].
Z = λ 1 p k = 1 λ k Z 1 + λ 2 p k = 1 λ k Z 2 + + λ m p k = 1 λ k Z m
Based on the data in Table 4 and Equations of (2)–(5), the results of correlation matrix of evaluation index, Kaiser–Meyer–Olkin (KMO) test and Bartlett’s test of sphericity, total variance explained, component matrix, component score coefficient matrix, and total score and rank of each experiment, were obtained, which were listed in Table 5, Table 6, Table 7, Table 8, Table 9 and Table 10, respectively.

3. Results and Discussion

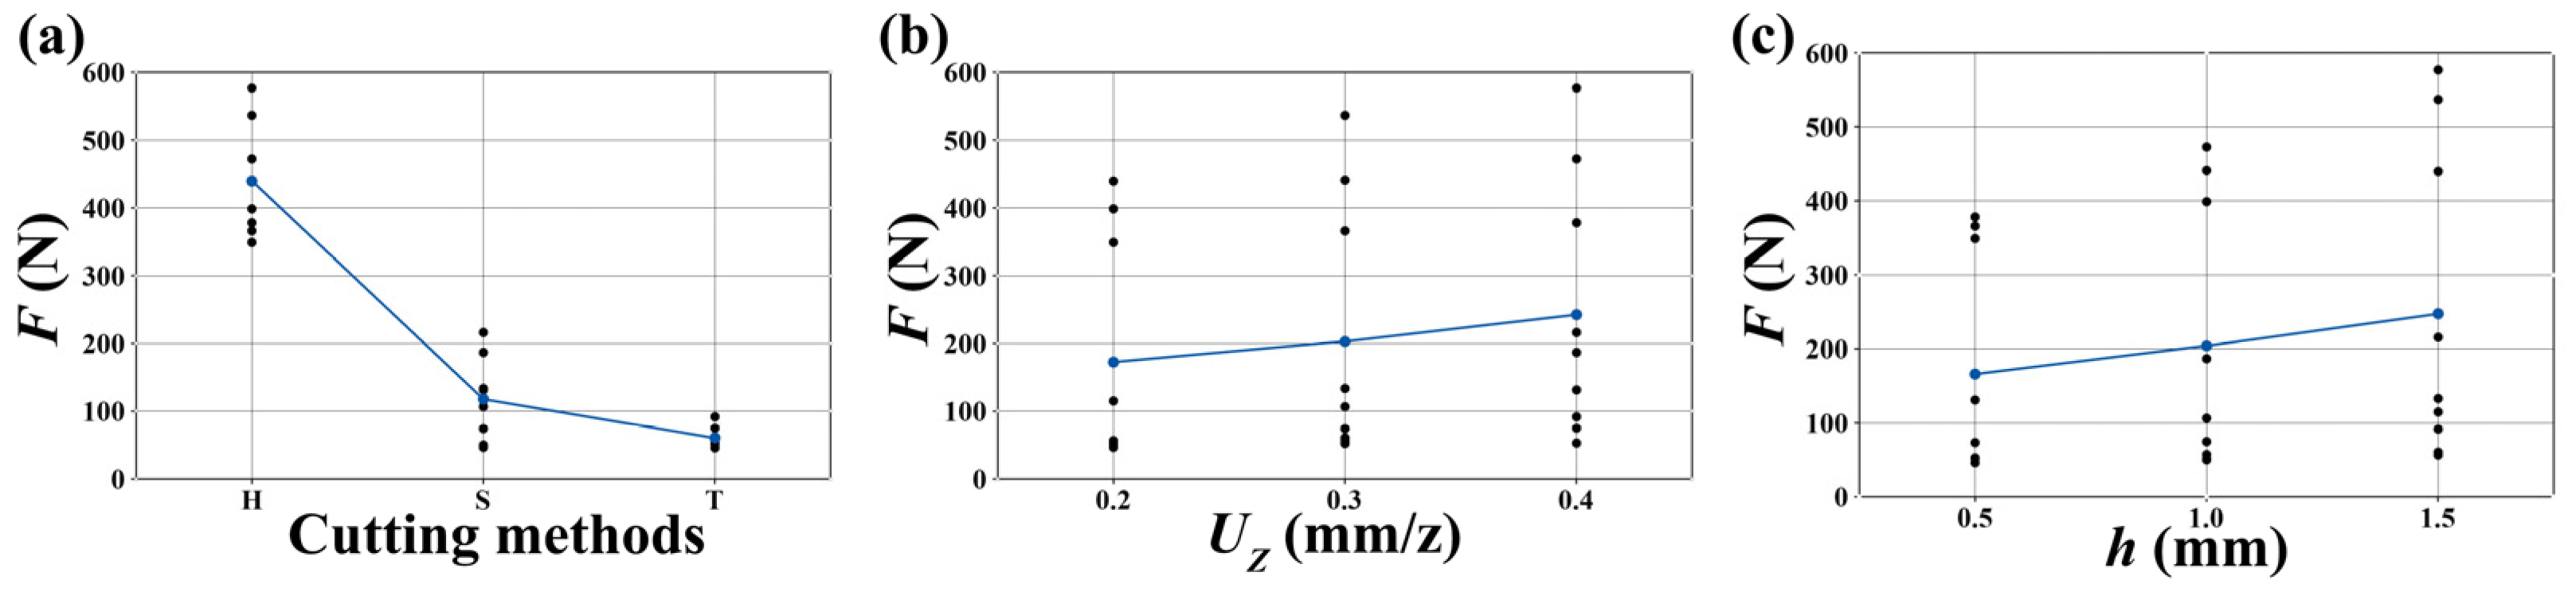
3.1. Changes in Cutting Forces of WPC

As shown in Figure 2a, cutting force shows great difference in milling methods. This difference is small between straight-tooth milling and tapered milling, while it is much greater in helical milling because axial forces exist in addition to tangential and radial forces. Additionally, there is also a friction force along the cutting edge and a normal force along the tooth of the cutter [30,31]. Because of the existence of the component of movement along the cutting edge, a friction force exists in the opposite direction, increasing the deformation of the chip. These forces result in a much greater cutting force for helical milling than for straight-tooth milling or tapered milling.
When feed per tooth increases, cutting force increases significantly. Feed per tooth reflects the specific relationship between feeding speed and cutting speed. When feeding speed is fixed, feed per tooth is inversely proportional to cutting speed; as the feed per tooth increases, cutting speed slows down. As the temperature of the cutting area rises and the hardness of the WPC cutting surface decreases, the workpiece becomes easier to cut, reducing the cutting force. Thus, when the feed per tooth increases, the temperature is lower and the surface is harder, making it more difficult to mill. This is why cutting force increases when the feed per tooth increases (Figure 2b).
As displayed in Figure 2c, with an increase in cutting depth, cutting force shows a positive (increasing) trend. The more material the cutter must separate from the board surface, the more resistance the cutter needs to overcome, leading to an increase in cutting force.

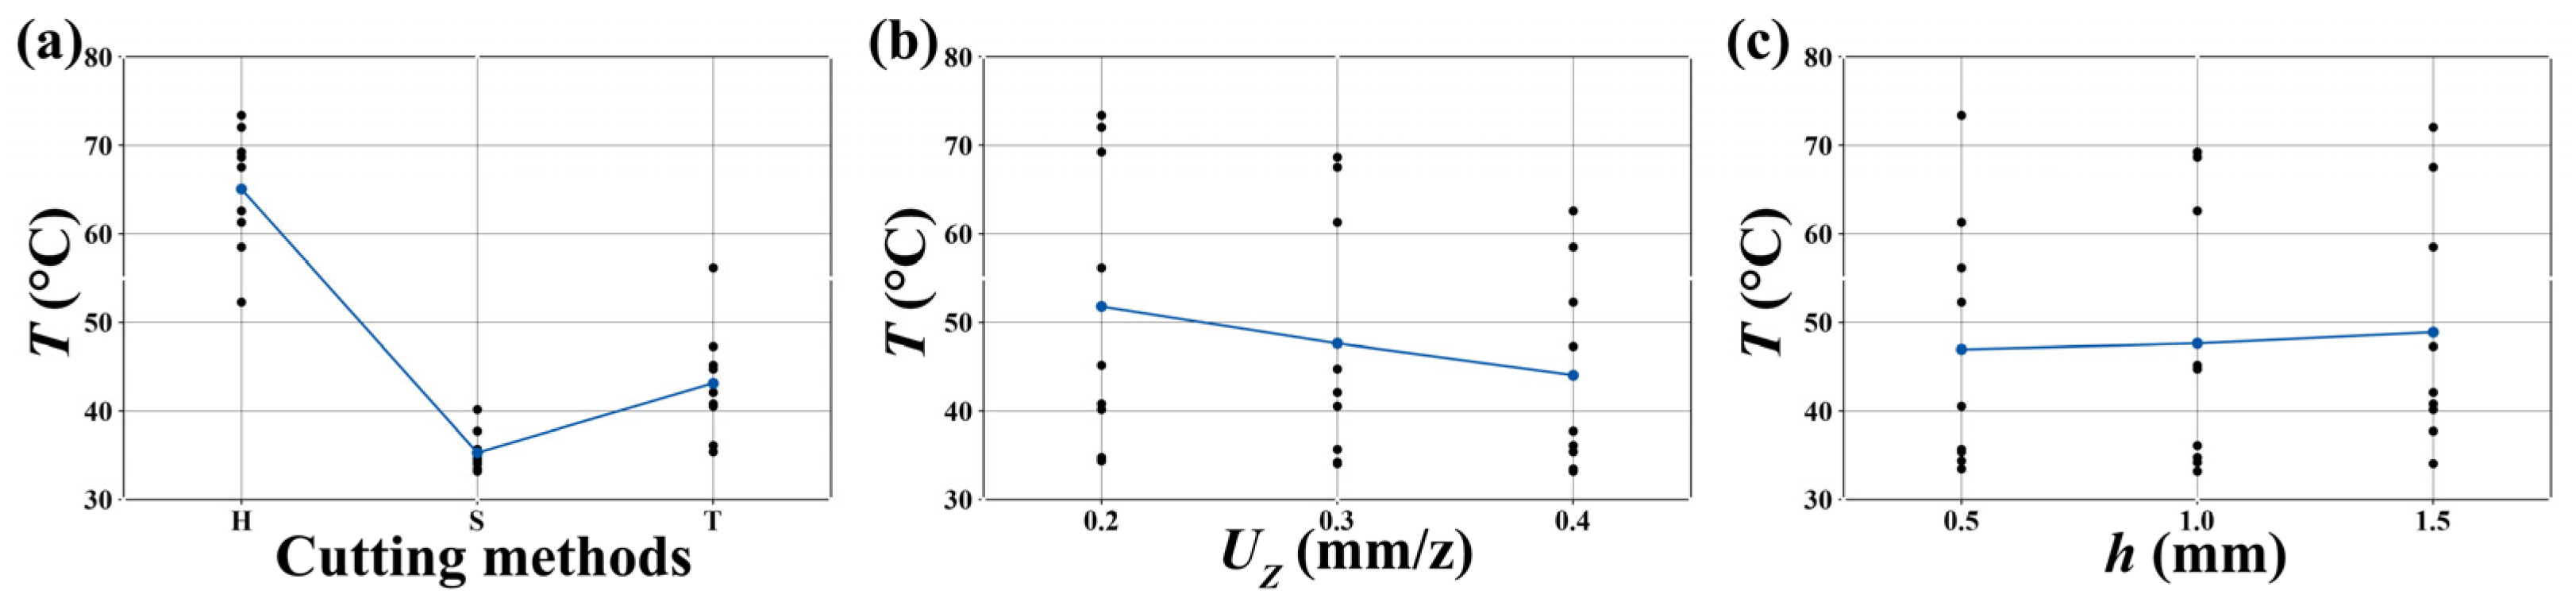
3.2. Changes in Cutting Temperature of WPC

From the results shown in Figure 3a, it can be concluded that the cutting temperature of helical milling is much higher than that of either straight-tooth milling or tapered milling, while the cutting temperature of straight-tooth milling is modestly higher than that of tapered milling. As previously mentioned, during the process of helical milling, the cutting force is much larger than straight-tooth milling and tapered milling. A friction force also acts on the teeth of the helical cutter, which increases the deformation of the chip. Thus, under the influence of these interacting factors, the cutting temperature of helical milling is much higher than either straight-tooth milling or tapered milling.
Figure 3b shows that cutting temperature is inversely proportional to the feed per tooth. The cutting temperature is positively related to cutting power. That is, the greater the cutting force or cutting speed, the higher the temperature of the tool will become [32,33]. Hence, when the feed per tooth increases, cutting speed and cutting power both decrease, leading to the reduction in cutting temperature.
As cutting depth increases (Figure 3c), cutting temperature increases rapidly. During the cutting process, the teeth of the cutter generate heat as they separate chips from the machined surface. Simultaneously, heat transfers from the edge of the tooth to the entire cutting edge and into the body of the tool via heat conduction. When cutting depth increases, chips become thicker, and it takes more power to overcome the friction. Therefore, the cutting temperature increases with increasing cutting depth.

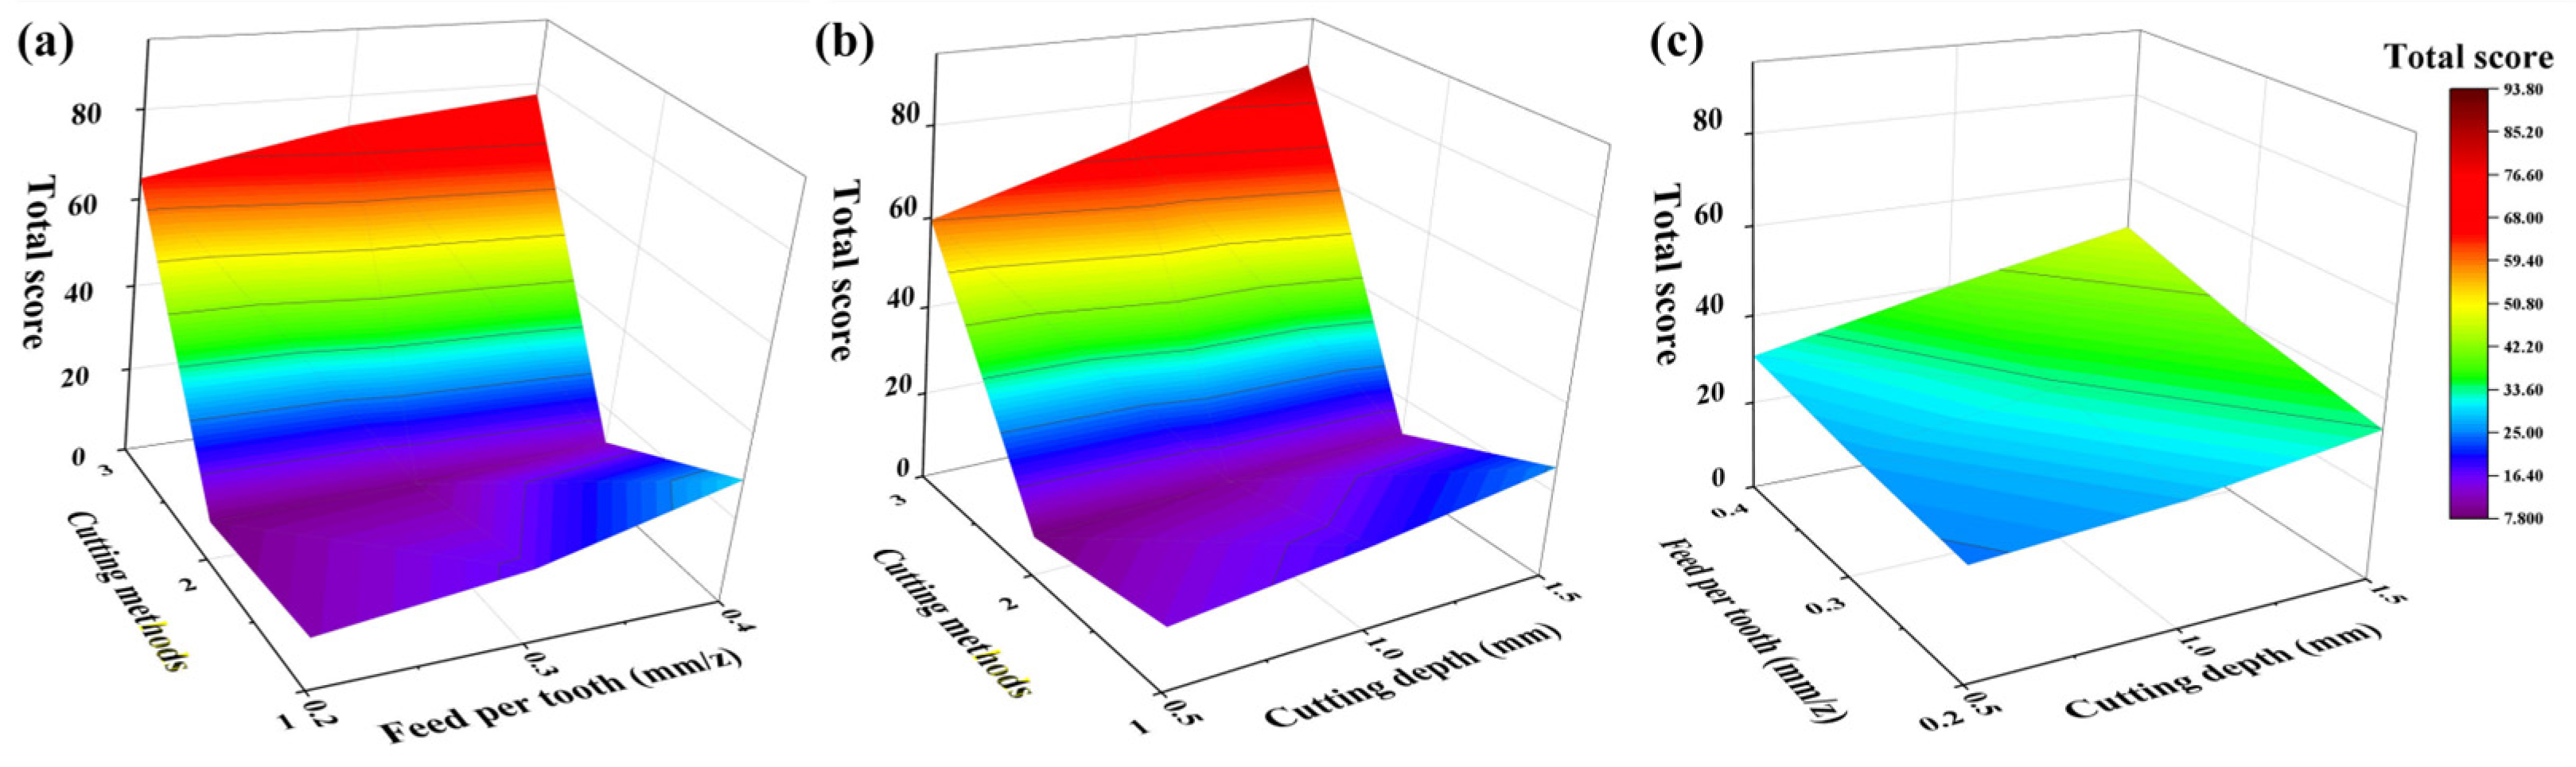
3.3. Establishment of Principal Component Analysis

Data obtained from the experiments was further processed by principal component analysis (PCA). The arithmetic mean deviation of the roughness profile (Ra), the root mean square deviation of the roughness profile (Rq), and the ten-point height of microcosmic unflatness (Rz) were added to the analysis to quantify the quality of the milled surface.
The Kaiser–Meyer–Olkin (KMO) test is used to compare the correlation coefficient and partial correlation coefficient between variables. The KMO test value ranges from 0 to 1. A larger test value indicates a stronger correlation between variables. Bartlett’s test examines the degree of correlation between individual variables. The test is generally performed before doing factor analysis and is used to determine whether the variables are suitable for factor analysis.
As shown in Table 6, the KMO test coefficient is 0.631, and Bartlett’s test result is p < 0.001, where the data structure was proved to be reasonable. This indicates that the variables are correlated and the factor analysis is valid. Thus, the principal components method can be used.
Principal component analysis can transform a set of potentially linearly correlated variables into a new set of linearly uncorrelated variables by orthogonal transformation, using the new variables to demonstrate the characteristics of the data in a smaller dimension set. These contain most of the features of the previous data and have lower dimensionality. PCA is able to take into account the influence of each measured parameter on the cutting effect and to quantify the advantages and disadvantages of the cutting performance for each milling method.
The first two principal components are extracted based on the criterion of eigenvalues greater than one. The variance contribution of the two components is 92.697%, covering most of the effect. Z1 and Z2 are extracted from the principal components, where Z1 covers initial factors Ra, Rq, Rz, and Z2 covers initial factors F and T.
In Equation (3), the loadings of each initial factor are derived from the two selected principal components (Table 7), thus obtaining two principal component equations, shown in Equations (6) and (7):
Z 1 = 0.144 F 0.333 T + 0.566 R a + 0 . 567 R q + 0 . 476 R z
Z 2 = 0.707 F + 0.594 T + 0.097 R a + 0 . 144 R q + 0 . 342 R z
As shown in Equation (8), total score Z is calculated by adding Z1 and Z2 multiplied by their corresponding weights. The weights are calculated as the corresponding variance contribution of each principal component divided by the cumulative variance contribution ratio.
Z = 0.581 Z 1 + 0.346 Z 2
The scores sorted by total score (Table 10) reflect the integrated processing result as a key evaluation indicator. The lowest total score value represents the most ideal machining result.
The total score is lowest when the feed per tooth is 0.2 mm, the cutting depth is 0.5 mm, and the method is straight-tooth milling. Therefore, for this experimental setup, these cutting parameters represent the optimal combination, taking F, T, Ra, Rq, and Rz into consideration. The second lowest score, tapered milling, has close values for all factors except cutting temperature, which was much higher than for the lowest score condition (Table 10).
The total score calculated by PCA can quantitatively demonstrate cutting quality. Figure 4 demonstrates the effect of cutting method, feed per tooth, and cutting depth on total score. As the total score decreases, the cutting quality becomes better. In general, the total scores for tapered milling and straight-tooth milling are much smaller than for helical milling. The total score decreases as feed per tooth and cutting depth decrease. Considering the interaction effect of feed per tooth and cutting depth, milling is more optimal when the feed per tooth and cutting depth are smaller. At the same time, the milling method has a greater influence on milling performance than does feed per tooth or cutting depth.

4. Conclusions

This study focused on the evaluation of the cutting performance of WPC using the principal component analysis methodology. A major contribution of this study was linking the three separate milling study systems, i.e., straight-tooth milling, helical milling, and tapered milling, into one system. Changes in cutting force, temperature, and surface roughness were measured under different cutting methods. By comparing cutting effects between straight-tooth milling, helical milling, and tapered milling, differences among these methods could be determined. The main conclusions are as follows:
(1) Cutting force is positively related to feed per tooth and cutting depth. The order of milling methods in terms of decreasing cutting force is helical milling > straight-tooth milling > tapered milling.
(2) Cutting temperature is negatively related to feed per tooth and positively related to cutting depth. The order of milling methods in terms of decreasing cutting temperature is helical milling > tapered milling > straight-tooth milling.
(3) The optimal cutting conditions for milling are determined to be straight-tooth milling, feed per tooth of 0.2 mm, and cutting depth of 0.5 mm.
(4) In practical production, tapered milling is suitable for finishing applications that require high surface quality; helical milling is suitable for roughing, which prioritizes processing efficiency.
(5) In this experiment, roughness was not analyzed because surface roughness variability was not significant for the tested conditions. The effect of different cutting methods on surface roughness will be further studied in follow-up research.

Author Contributions

Conceptualization, Y.Z. and D.B.; methodology, Y.Z.; software, J.G.; validation, Q.T., X.G. and Z.Z.; formal analysis, M.S.; investigation, Y.Z.; resources, Z.Z.; data curation, Y.Z.; writing—original draft preparation, Y.Z.; writing—review and editing, D.B.; visualization, Z.Z.; supervision, Z.Z.; project administration, Z.Z.; funding acquisition, Z.Z. All authors have read and agreed to the published version of the manuscript.

Funding

This research was funded by 2024 Nanjing Forestry University Students’ Practical Innovation Training Program Project (2024NFUSPITP0168), the Postgraduate Research & Practice Innovation Program of Jiangsu Province (SJCX24 0396), and the International Cooperation Joint Laboratory for Production, Education, Research, and Application of Ecological Health Care on Home Furnishing. The authors gratefully acknowledge the considerable support of the CT WOOD at Luleå University of Technology.

Data Availability Statement

Data are contained within the article.

Conflicts of Interest

Authors Jun Guan and Qi Tang were employed by the company Mengtian Furnishings Co. Ltd. The remaining authors declare that the research was conducted in the absence of any commercial or financial relationships that could be construed as a potential conflict of interest.

References

  1. Turner, J.A.; Buongiorno, J.; Zhu, S.S. An economic model of international wood supply, forest stock and forest area change. Scand. J. For. Res. 2006, 21, 73–86. [Google Scholar] [CrossRef]
  2. Sommerhuber, P.F.; Wang, T.Y.; Krause, A. Wood-plastic composites as potential applications of recycled plastics of electronic waste and recycled particleboard. J. Clean. Prod. 2016, 121, 176–185. [Google Scholar] [CrossRef]
  3. Keskisaari, A.; Kärki, T. The use of waste materials in wood-plastic composites and their impact on the profitability of the product. Resour. Conserv. Recycl. 2018, 134, 257–261. [Google Scholar] [CrossRef]
  4. Fabiyi, J.S.; McDonald, A.G. Effect of wood species on property and weathering performance of wood plastic composites. Compos. Part A Appl. Sci. Manuf. 2010, 41, 1434–1440. [Google Scholar] [CrossRef]
  5. Yang, X.H.; Zhang, X.Q.; Wang, W.H.; Huang, H.B.; Sui, S.J. Properties of paper mill sludge-wood fiber-HDPE composites after exposure to xenon-arc weathering. J. For. Res. 2015, 26, 509–515. [Google Scholar] [CrossRef]
  6. Girones, J.; Pardini, G.; Vilaseca, F.; Pelach, M.A.; Mutje, P. Recycling of Paper Mill Sludge as Filler/Reinforcement in Polypropylene Composites. J. Polym. Environ. 2010, 18, 407–412. [Google Scholar] [CrossRef]
  7. Teuber, L.; Osburg, V.-S.; Toporowski, W.; Militz, H.; Krause, A. Wood polymer composites and their contribution to cascading utilisation. J. Clean. Prod. 2016, 110, 9–15. [Google Scholar] [CrossRef]
  8. Ribeiro, L.S.; Stolz, C.M.; Amario, M.; da Silva, A.L.N.; Haddad, A.N. Use of Post-Consumer Plastics in the Production of Wood-Plastic Composites for Building Components: A Systematic Review. Energies 2023, 16, 6549. [Google Scholar] [CrossRef]
  9. Yang, Y.Q.; Xu, W.; Liu, X.; Wang, X.D. Study on permeability of cunninghamia lanceolata based on steam treatment and freeze treatment. Wood Res. 2021, 66, 721–731. [Google Scholar] [CrossRef]
  10. Zhang, N.; Mao, Y.Q.; Wu, S.S.; Xu, W. Effects of the Ball Milling Process on the Particle Size of Graphene Oxide and Its Application in Enhancing the Thermal Conductivity of Wood. Forests 2022, 13, 1325. [Google Scholar] [CrossRef]
  11. Wu, S.S.; Zhou, J.C.; Xu, W. A convenient approach to manufacturing lightweight and high-sound-insulation plywood using furfuryl alcohol/multilayer graphene oxide as a shielding layer. Wood Mater. Sci. Eng. 2024, 1–8. [Google Scholar] [CrossRef]
  12. Jian, B.Y.; Mohrmann, S.; Li, H.T.; Li, Y.J.; Ashraf, M.; Zhou, J.; Zheng, X.Y. A Review on Flexural Properties of Wood-Plastic Composites. Polymers 2022, 14, 3942. [Google Scholar] [CrossRef] [PubMed]
  13. Xiong, X.Q.; Guo, W.J.; Fang, L.; Zhang, M.; Wu, Z.H.; Lu, R.; Miyakoshi, T. Current state and development trend of Chinese furniture industry. J. Wood Sci. 2017, 63, 433–444. [Google Scholar] [CrossRef]
  14. Akter, M.; Uddin, M.H.; Tania, I.S. Biocomposites based on natural fibers and polymers: A review on properties and potential applications. J. Reinf. Plast. Compos. 2022, 41, 705–742. [Google Scholar] [CrossRef]
  15. Wechsler, A.; Hiziroglu, S. Some of the properties of wood–plastic composites. Build. Environ. 2007, 42, 2637–2644. [Google Scholar] [CrossRef]
  16. Pei, Z.J.; Zhu, N.F.; Gong, Y. A study on cutting temperature for wood-plastic composite. J. Thermoplast. Compos. Mater. 2016, 29, 1627–1640. [Google Scholar] [CrossRef]
  17. Choudhury, M.R.; Rao, G.S.; Debnath, K.; Mahapatra, R.N. Analysis of Force, Temperature, and Surface Roughness during End Milling of Green Composites. J. Nat. Fibers 2022, 19, 5019–5033. [Google Scholar] [CrossRef]
  18. Wei, W.H.; Li, Y.T.; Xue, T.M.; Liu, X.; Chen, L.; Wang, J.; Wang, T.Y.; Cai, Y.N. Research on Milling Forces During High-speed Milling of Wood-plastic Composites. Bioresources 2019, 14, 769–779. [Google Scholar] [CrossRef]
  19. Homkhiew, C.; Cheewawuttipong, W.; Srivabut, C.; Boonchouytan, W.; Rawangwong, S. Machinability of wood-plastic composites from the CNC milling process using the Box-Behnken design and response surface methodology for building applications. J. Thermoplast. Compos. Mater. 2024. [Google Scholar] [CrossRef]
  20. Shi, W.Y.; Ma, Y.; Yang, C.M.; Jiang, B.; Li, Z. Evaluation of a regression prediction model for surface roughness of wood-polyethylene composite (WPC). Surf. Rev. Lett. 2017, 24, 1850033. [Google Scholar] [CrossRef]
  21. Wei, W.H.; Cong, R.; Xue, T.M.; Abraham, A.D.; Yang, C.Y. Surface roughness and chip morphology of wood-plastic composites manufactured via high-speed milling. Bioresources 2021, 16, 5733–5745. [Google Scholar] [CrossRef]
  22. Somsakova, Z.; Zajac, J.; Michalik, P.; Kasina, M. Machining of Wood Plastic Composite (Pilot Experiment). Mater. Plast. 2012, 49, 55–57. [Google Scholar]
  23. Shi, W.Y.; Fang, W.B.; Jiang, B.; Li, Z. Analysis of cutting technology and energy consumption model of polyethylene WPC. Ferroelectrics 2022, 593, 112–123. [Google Scholar] [CrossRef]
  24. Zhu, Z.L.; Buck, D.; Wang, J.X.; Wu, Z.W.; Xu, W.; Guo, X.L. Machinability of Different Wood-Plastic Composites during Peripheral Milling. Materials 2022, 15, 1303. [Google Scholar] [CrossRef]
  25. Pangestu, K.T.P.; Nandika, D.; Wahyudi, I.; Usuki, H.; Darmawan, W. Innovation of helical cutting tool edge for eco-friendly milling of wood-based materials. Wood Mater. Sci. Eng. 2022, 17, 607–616. [Google Scholar] [CrossRef]
  26. Zhu, Z.L.; Buck, D.; Guo, X.L.; Xiong, X.Q.; Xu, W.; Cao, P.X. Energy Efficiency Optimization for Machining of Wood Plastic Composite. Machines 2022, 10, 104. [Google Scholar] [CrossRef]
  27. Jin, D.; Wei, K.J. Machinability of Scots Pine during Peripheral Milling with Helical Cutters. Bioresources 2021, 16, 8172–8183. [Google Scholar] [CrossRef]
  28. Qi, X.; Shang, Y.Y.; Ding, Z.J.; Wei, W.H. Particularities and research progress of the cutting machinability of wood-plastic composites. Mater. Today Commun. 2023, 37, 106924. [Google Scholar] [CrossRef]
  29. Liu, R.X.; Kuang, J.; Gong, Q.; Hou, X.L. Principal component regression analysis with SPSS. Comput. Methods Programs Biomed. 2003, 71, 141–147. [Google Scholar] [CrossRef]
  30. Li, R.R.; He, C.J.; Xu, W.; Wang, X.D. Modeling and optimizing the specific cutting energy of medium density fiberboard during the helical up-milling process. Wood Mater. Sci. Eng. 2023, 18, 464–471. [Google Scholar] [CrossRef]
  31. Li, R.R.; Yang, F.; Wang, X.D. Modeling and Predicting the Machined Surface Roughness and Milling Power in Scot’s Pine Helical Milling Process. Machines 2022, 10, 331. [Google Scholar] [CrossRef]
  32. Hu, W.G.; Guan, H.Y. Experimental and numerical investigation on compression creep behavior of wood. For. Prod. J. 2018, 68, 138–146. [Google Scholar] [CrossRef]
  33. Li, R.R.; Yao, Q.; Xu, W.; Li, J.Y.; Wang, X.D. Study of Cutting power and power efficiency during straight-tooth cylindrical milling process of particle boards. Materials 2022, 15, 879. [Google Scholar] [CrossRef]
Figure 1. Experimental design and equipment: (a) cutters, (b) CNC machining center, dynamometer, infrared imager, and roughness tester.
Forests 15 01516 g001
Figure 2. Effects of cutting parameters on cutting force: (a) cutting methods, (b) feed per tooth, and (c) cutting depth.
Forests 15 01516 g002
Figure 3. Effects of cutting parameters on cutting temperature: (a) cutting methods, (b) feed per tooth, and (c) cutting depth.
Forests 15 01516 g003
Figure 4. Contour map of the total score and cutting parameters of (a) cutting methods and feed per tooth, (b) cutting methods and cutting depth, and (c) feed per tooth and cutting depth, where 1, 2, and 3 represent straight-tooth milling, tapered milling, and helical milling, respectively.
Forests 15 01516 g004
Table 1. Tool angles used in this work.
No.Cutting MethodTool Angle
1Straight-tooth millingWedge angle 72°Rake angle 10°Flake angle 8°
2Helical millingHelical angle 62°Rake angle 10°Flake angle 8°
3Tapered millingTaper angle 25°Rake angle 10°Flake angle 8°
Table 2. The milling parameters.
Parameters CodesRanges
Milling method 1A123
Feed per tooth (mm)B0.20.30.4
Cutting depth (mm)C0.51.01.5
1 Note: Straight-tooth milling, tapered milling, and helical milling are denoted as milling methods 1, 2, and 3, respectively.
Table 3. Experimental parameters and obtained data.
No.Cutting MethodsUz (mm·Z−1)h (mm)F (N)T (°C)Ra (µm)
1S0.20.546.0934.370.023
2S0.21.049.9534.800.019
3S0.21.5114.7340.170.016
4S0.30.573.7135.670.013
5S0.31.0106.1534.230.021
6S0.31.5133.0934.070.013
7S0.40.5131.0733.470.014
8S0.41.0186.7833.230.012
9S0.41.5216.1337.730.017
10H0.20.5349.0173.400.020
11H0.21.0398.7169.230.015
12H0.21.5440.0572.030.016
13H0.30.5366.3061.300.017
14H0.31.0441.2568.670.018
15H0.31.5536.6867.500.016
16H0.40.5378.2452.330.013
17H0.41.0472.5762.600.011
18H0.41.5577.3258.500.013
19T0.20.545.9056.200.018
20T0.21.051.3045.200.018
21T0.21.556.3840.800.018
22T0.30.552.0640.530.018
23T0.31.057.0744.750.020
24T0.31.560.5642.100.020
25T0.40.552.5135.400.017
26T0.41.074.4836.100.017
27T0.41.591.3147.300.017
Note: Uz represents feed per tooth; h represents cutting depth; S represents straight-tooth milling; H represents helical milling; and T represents tapered milling.
Table 4. Experimental data.
No.FTRaRqRz
146.0934.370.0230.0340.222
249.9534.800.0190.0290.250
3114.7340.170.0160.0250.184
473.7135.670.0130.0210.176
5106.1534.230.0210.0330.276
6133.0934.070.0130.0210.185
7131.0733.470.0140.0230.196
8186.7833.230.0120.0210.198
9216.1337.730.0170.0260.233
10349.0173.400.0200.0320.264
11398.7169.230.0150.0240.204
12440.0572.030.0160.0240.218
13366.3061.300.0170.0270.258
14441.2568.670.0180.0300.265
15536.6867.500.0160.0250.237
16378.2452.330.0130.0210.210
17472.5762.600.0110.0190.181
18577.3258.500.0130.0200.169
1945.9056.200.0180.0290.226
2051.3045.200.0180.0270.217
2156.3840.800.0180.0280.231
2252.0640.530.0180.0270.229
2357.0744.750.0200.0310.243
2460.5642.100.0200.0300.240
2552.5135.400.0170.0260.220
2674.4836.100.0170.0260.223
2791.3147.300.0170.0250.221
Table 5. Correlation matrix of evaluation index.
CorrelationFTRaRqRz
F1.0000.802−0.101−0.0510.165
T0.8021.000−0.438−0.393−0.098
Ra−0.101−0.4381.0000.9770.764
Rq−0.051−0.3930.9771.0000.818
Rz0.165−0.0980.7640.8181.000
Table 6. Kaiser–Meyer–Olkin (KMO) test and Bartlett’s test of sphericity results.
KMO Measure of Sampling Adequacy0.631
Bartlett’s test of sphericityApprox. chi-square140.649
Degrees of freedom10
Significance<0.001
Table 7. Total variance explained.
ComponentInitial EigenvaluesRotation Sums of Squared Loadings
TotalPercent of
Variance
Cumulative %TotalPercent of
Variance
Cumulative %
12.90458.08458.0842.90458.08458.084
21.73134.61392.6971.73134.61392.697
30.2274.54397.240
40.1202.39199.631
50.0180.369100.000
Table 8. Component matrix.
Evaluation IndexPrincipal Component
Z1Z2
F−0.2460.930
T−0.5670.782
Ra0.9650.128
Rq0.9670.189
Rz0.8110.450
Table 9. Component score coefficient matrix.
Evaluation IndexPrincipal Component
Z1Z2
Z score (F)−0.0850.537
Z score (T)−0.1950.452
Z score (Ra)0.3320.074
Z score (Rq)0.3330.109
Z score (Rz)0.2790.260
Table 10. Total score and rank of each experiment.
RankMethodUzhFTRaRqRzZ1 ScoreZ2 ScoreTotal Score
1S0.20.546.0934.370.0230.0340.222−17.94453.0847.942
2T0.20.545.9056.200.0180.0290.226−25.19065.9178.172
3S0.21.049.9534.800.0190.0290.250−18.63556.0778.576
4T0.21.051.3045.200.0180.0270.217−22.31063.1988.904
5T0.30.552.0640.530.0180.0270.229−20.85960.9658.975
6T0.40.552.5135.400.0170.0260.220−19.22158.2338.981
7T0.21.556.3840.800.0180.0280.231−21.56964.1819.675
8T0.31.057.0744.750.0200.0310.243−22.97567.0209.840
9T0.31.560.5642.100.0200.0300.240−22.59767.91210.368
10S0.30.573.7135.670.0130.0210.176−22.38973.36512.376
11T0.41.074.4836.100.0170.0260.223−22.61674.18212.527
12T0.41.591.3147.300.0170.0250.221−28.77192.73315.370
13S0.31.0106.1534.230.0210.0330.276−26.52295.48217.627
14S0.21.5114.7340.170.0160.0250.184−29.787105.04319.039
15S0.40.5131.0733.470.0140.0230.196−29.905112.61921.591
16S0.31.5133.0934.070.0130.0210.185−30.403114.40021.918
17S0.41.0186.7833.230.0120.0210.198−37.849151.86430.555
18S0.41.5216.1337.730.0170.0260.233−43.552175.30135.351
19H0.20.5349.0173.400.0200.0320.264−74.545290.44757.184
20H0.30.5366.3061.300.0170.0270.258−73.012295.48059.816
21H0.40.5378.2452.330.0130.0210.210−71.773298.57661.607
22H0.21.0398.7169.230.0150.0240.204−80.349323.08565.105
23H0.21.5440.0572.030.0160.0240.218−87.227353.98171.799
24H0.31.0441.2568.670.0180.0300.265−86.254352.85071.973
25H0.41.0472.5762.600.0110.0190.181−88.793371.35776.901
26H0.31.5536.6867.500.0160.0250.237−99.623419.61487.305
27H0.41.5577.3258.500.0130.0200.169−102.515442.97693.708
Disclaimer/Publisher’s Note: The statements, opinions and data contained in all publications are solely those of the individual author(s) and contributor(s) and not of MDPI and/or the editor(s). MDPI and/or the editor(s) disclaim responsibility for any injury to people or property resulting from any ideas, methods, instructions or products referred to in the content.

