Article

Optimizing Carbon Sequestration Potential for Chinese Fir Plantations Using Genetic Algorithm

1
College of Mathematics and Computer Sciences, Zhejiang A&F University, Hangzhou 311300, China
2
Sichuan Forestry and Grassland Survey and Planning Institute, Chengdu 610084, China
3
Zhejiang Provincial Key Laboratory of Forestry Intelligent Monitoring and Information Technology, Zhejiang A&F University, Hangzhou 311300, China
4
Institute of Remote Sensing and Geographic Information System, School of Earth and Space Sciences, Peking University, Beijing 100871, China
*
Author to whom correspondence should be addressed.
Forests 2024, 15(9), 1524; https://doi.org/10.3390/f15091524
Submission received: 28 June 2024 / Revised: 12 August 2024 / Accepted: 27 August 2024 / Published: 29 August 2024

Abstract

:
Carbon sequestration management of plantation forests has become an important topic in the current context of vigorously promoting carbon peaking and carbon neutrality goals and will be the goal and task of the forest industry for a long time. The objective of this study was to explore the applications of genetic algorithm (GA) in both near-optimal thinning regimes at stand level and near-optimal forest management planning at the regional level under the forest management objectives of carbon sequestration. This research integrates a carbon assessment technique with GA optimization to effectively enhance the management of carbon sequestration within plantation forests. Results indicate that the density effect model was an accurate and reliable carbon assessment method (R2 = 0.8701, RMSE = 7.548). The GA optimization approach is efficient in the near-optimal thinning regime and the appropriate forest management planning schedule under the forest management objectives of carbon sequestration. In the research area, the near-optimal carbon sequestration is 38,045.71 t, and in the 15 years from 2016 to 2030, the carbon sequestration of 20 Chinese fir stands should meet the annual thinning constraint condition of not less than 50 t. A near-optimal decision of the carbon sequestration management of plantation forests based on GA provides a theoretical basis and technical support for the compilation of a forest management plan at the stand and regional scales in the plantation operation management of carbon sequestration.

1. Introduction

With the increasing intensification of plantation management, the use of stand growth and management models has become an important technical measure to guide forest management decisions [1,2,3]. In the current context of vigorously promoting the carbon peaking and carbon neutrality goals, forest management focuses on carbon balance, while intensive forest management involves silvicultural treatments and their effects on carbon sequestration and emissions [4]. Forests hold immense promise. It is imperative to precisely measure forest carbon storage and integrate carbon sink management into forest management to effectively capture and store carbon that is in the atmosphere [5]. Exploring the research and practical significance of implementing an optimal decision scheme for plantation management based on carbon sequestration technology holds immense value for foresters and plantation management units [6,7,8].
Decisions in forest management can be classified according to three main levels: the tree, the stand, and forest and regional levels [9]. As the smallest operational unit, the stand level is the appropriate level for studying the carbon balance of stand management activities [10]. Forest operation management decisions mainly include tree species selection, rotation length selection, thinning regime selection, and management planning decisions [11,12,13]. Operation thinning regimes and operation management planning decisions are the most frequently implemented stand management activities by forestry managers [14]. The objective of forest operation management under climate change is to change from timber yield to carbon sequestration [15]. Thus, the measures for stand management activities will change accordingly. The main optimization problems associated with stand-level optimization are the rotation length, thinning regime, and stand density management problems [16]. Near-optimal thinning regimes, such as structured forest management and near-nature forest management, play a key role in formulating a forest management strategy for adapting to climate change [17]. Starting from the stand level, we studied operation thinning regimes of single stands and the operation management planning of multiple stands.
Large carbon sequestration in forests can be achieved by increasing the rotation length, applying the appropriate stand density, and other silvicultural treatments [18]. At present, the forest management of carbon sequestration research typically centers on the optimal rotation length problem for economic and commodity production objectives [19,20]. The most frequently set objectives involve maximizing the carbon net present value (NPV) of either a single rotation or a defined period [2,13,21,22,23]. In the estimation of forest carbon storage, remote sensing data are mostly used for large-scale estimation [24]. Due to the challenges in conducting on-site investigations of forest biomass and carbon storage to estimate carbon sequestration, frequent on-site inspections may exacerbate damage to forest ecosystems. Therefore, evaluating forest carbon sequestration potential is complex, as is assessing its spatial and temporal variability [25]. When studying carbon sequestration management, most research in natural science examines the impact of thinning density on carbon sequestration by comparing control and experimental plots [26,27,28,29,30,31,32]. About the stand optimal density management problem, the forest resource planning system developed combines thinning measures with model prediction, in which the multi-functional operation planning model and simulation algorithm have been built to achieve optimal operation goals [33,34,35,36]. However, relatively little research on the compilation of a forest management plan (CFMP) [37] about carbon sequestration exists, especially from the perspective of thinning density.
With respect to the optimization methods applied to both stand and forest management decisions, a wide range of methods have been explored recently, mainly including mixed-integer programming, linear programming, goal programming, heuristics, and dynamic programming [16,38]. Heuristic methods provide assurance that the best result of these is the near-optimal (with high probability). Three main heuristic methods have been explored, as follows: genetic algorithms (GAs) [39,40], simulated annealing [41,42] and particle-swarm optimization [43]. Among these methods, GAs, which have the advantages of modularization and being able to find the global near-optimal solution to the optimization problem, have been widely used in the thinning problem at the stand level and the rotation length problem at the regional level. Nonetheless, robust research on near-optimal thinning regimes combining single stands and multiple stands based on GAs for the forest operation management of carbon sequestration is lacking.
The study aimed to extend the management of forest ecosystems by incorporating carbon assessment techniques into an optimization framework. The objective of this study is to address the deficiencies in carbon sequestration management concepts and methodologies within forest management processes, which result in the challenging and time-intensive task of solving carbon sequestration management models. Genetic algorithms are employed to implement nearly optimal thinning strategies at the stand level and to formulate effective forest management plans at the regional level that align with enhanced carbon sequestration objectives. The result is anticipated to offer theoretical insights and practical tools for CFMP, applicable to both stand and regional scales within the operational management of carbon sequestration plantations.

2. Materials and Methods

2.1. Data Source

Nanping city is in the northwest of Fujian Province, China from 117°00 to 119°25′ east longitude and from 26°30′–28°20′ north latitude (Figure 1). The data are derived from Chinese fir (Cunninghamia lanceolata (Lamb.) Hook.) plantations located in the Dali, Lanxia, and Jiangle forest farms, Nanping city (China). Specifically, subcompartments of the Chinese fir plantations were chosen based on varying age groups (young, middle-age, and near-mature forests (spanning 21–25 years)), density (sparse, medium, and dense), and site conditions (good, medium, and poor). In the selected subcompartments, 84 circular standard plots representing the average growth state of the subcompartments were set, and the radius of the circular standard plots is 5 m. According to the forest resources inventory and planning data of the local forest farm, some stand factors for each subcompartment were recorded, such as elevation (HB), slope (PD), aspect (PX), soil thickness (TRHD), humus thickness (FZZHD), average diameter at breast height (D), average tree height (H), average tree age (A), area (Area), stand volume per hectare (M1) and number of trees per hectare (N). In each circular standard plot, two to five trees with well-balanced canopy growth were selected as the standard trees, and two to three trees with good height and little competition with the surrounding trees were selected as the dominant trees. The diameters at breast height and tree height were measured for standard and dominant trees within the boundary of the sample circular plot. The measurement accuracy of diameter at breast height was 0.1 cm, and that at tree height was 0.1 m.
Each sample plot’s dominant height (HT) was calculated using the average height of the dominant trees in the sample plot. In combination with the biomass regression models in Equations (1)–(5) [44], the biomass of the sample plot was calculated and then multiplied by the carbon content rate of Chinese fir (=0.5201) to obtain the carbon density data of the sample plot. The carbon density of the sample plot is used to represent the carbon sequestration per hectare (C).
W S = 0.073429 D 2 H 0.86262
W P = 0.013775 D 2 H 0.84463
W B = 0.000482 D 2 H 1.23314
W L = 0.019638 ( D 2 H ) 0.78969
W T = W S + W P + W B + W L
where WS is the stem biomass, WP is the bark biomass, WB is the branch biomass, and WL is the aboveground biomass.
All the factors related to carbon density modelling and their descriptions are shown in Table 1. This article utilizes ArcMap 10.8 to generate a thematic map, and the software employed for the density effect model and genetic algorithm optimization planning is Python 3.7.

2.2. Density Effect Model

The density quadratic effect model has good mathematical properties in the optimization process of dynamic programming. It models the relationship between stand density and yield (mainly including the average basal area, the stand volume per hectare, and the carbon sequestration per hectare) and reflects the parabolic trend between the stand yield per hectare and stand density.
On the basis of the density quadratic effect model, the stand density was used as the control variable, and the stand biomass was used as the target variable. The density effect model was constructed as follows (Equation (6)):
C = a 1 H T b 1 N a 2 H T b 2 N 2
where HT is determined by using the site index model (Equation (7)) established by Wu Chengzhen et al. [45].
H T = S I 10 ( 0.1809 3.7654 A 1 + 2.9602 A 2 )
where SI is the height in meters of trees of standard-age dominance in the forest stand. It is used as an indicator to evaluate forest soil productivity.
The density effect model corresponding to the density effect of average carbon sequestration per tree is Equation (8).
V = a 1 H T b 1 a 2 H T b 2 N
The density effect model of Chinese fir was fit using nonlinear least-square estimates through a Gauss–Newton algorithm, which was implemented in PROC MODEL. Considering that the leave-one-out approach effectively showed the independence of the validation data set, the leave-one-out approach was selected for model verification in this experiment.
The production elasticity coefficient plays a pivotal role in economics, serving as a measure of the responsiveness of output to changes in input variables such as labor or capital. Within the scope of this article, we delve into the analysis of the production elasticity coefficient for Chinese fir, specifically within the framework of the density effect model. The examination of this coefficient provides valuable insights into the efficiency of resource allocation and the potential for yield improvement in the context of Chinese fir cultivation. By employing the production elasticity coefficient, we can identify the most influential factors affecting production and make informed decisions to optimize forestry management practices. The relevant calculation formulas are as follows (Equations (9)–(12)).
E P H T ¯ = V / H T V / H T = a 1 b 1 H T b 1 1 a 2 b 2 H T b 2 1 N V / H T
E P N ¯ = V / N V / N = a 2 H T b 2 V / N
According to the multi-factor production elasticity analysis, E P = 2.109 > 1 of Chinese fir indicates that the site condition and the density increased by X% and the carbon sequestration per tree increased by more than X%.
M P P H T = V H T = a 1 b 1 H T b 1 1 a 2 b 2 H T b 2 1 N
M P P N = V N = a 2 H T b 2

2.3. Thinning Regime for Carbon Sequestration Goal

Based on the density effect model, the dynamic programming mathematical model of the continuous state in the discrete stage was established to study the stand density control of the multi-stage decision. Genetic algorithm (GA) was applied to calculate the near-optimal thinning regime.

2.3.1. Dynamic Programming Mathematical Model

According to the established density effect model, stand density is the control variable, and carbon density is the target variable. The thinning of Chinese fir plantations was carried out at multiple time points, and the control of stand density was a multi-step decision-making process. In the process, m decisions were assumed; the first m1 decisions were the thinning decisions, and the mth decision was the final planning time point decision. The state transition equations are Equations (13) and (14).
N i + 1 = N i n i = N i
C i + 1 = C i + v i S g n + Δ C i , i + 1
where N i is the number of trees per hectare before the ith (i = 1, 2) thinning, N i is the number of trees per hectare after the ith thinning, n i is the number of trees of the ith thinning, C i is the carbon sequestration before the ith thinning, v i is the carbon sequestration of the ith thinning, and Δ C i , i + 1 is the net increment of carbon sequestration during the ith thinning and the (i + 1) th thinning. When the D of the harvested wood is less than or equal to 6 cm, the harvested wood is placed in the forest as the residue, which is regarded as carbon emission, and then Sgn is −1; when the variable D of the harvested wood is greater than 6 cm, the harvested wood is used for solid wood or paper products as carbon storage, and then Sgn is 1. D was determined by using the D model (Equation (15)) established by Dong Chen [4].
D = 7.697 S I 0.547 1 e 0.213 N 0.221 A 1.078
The boundary condition represents the initial and terminal states under the action of density control during stand growth. The initial state refers to the number of trees per hectare and stand carbon sequestration before the first thinning (Equation (16)), and the terminal state refers to the number of trees per hectare and stand carbon sequestration after the final planning time point (Equation (17)).
( N 1 , C 1 ) = ( N 0 , C 0 )
( N m + 1 , C m + 1 ) = ( 0,0 )
The optimal stand density control is to find the optimal number of retained trees at each thinning or the final planning time point N i * ( i = 1,2 , 3 , m ) , so that the stand status ( N 1 , C 1 ) is transferred to ( N 2 , C 2 )… until it is transferred to ( N m + 1 , C m + 1 ). The objective function obtains the largest value (Equation (18)).
J m * = m a x N 1 * , N 2 * , , N m * i = 1 m v i S g n

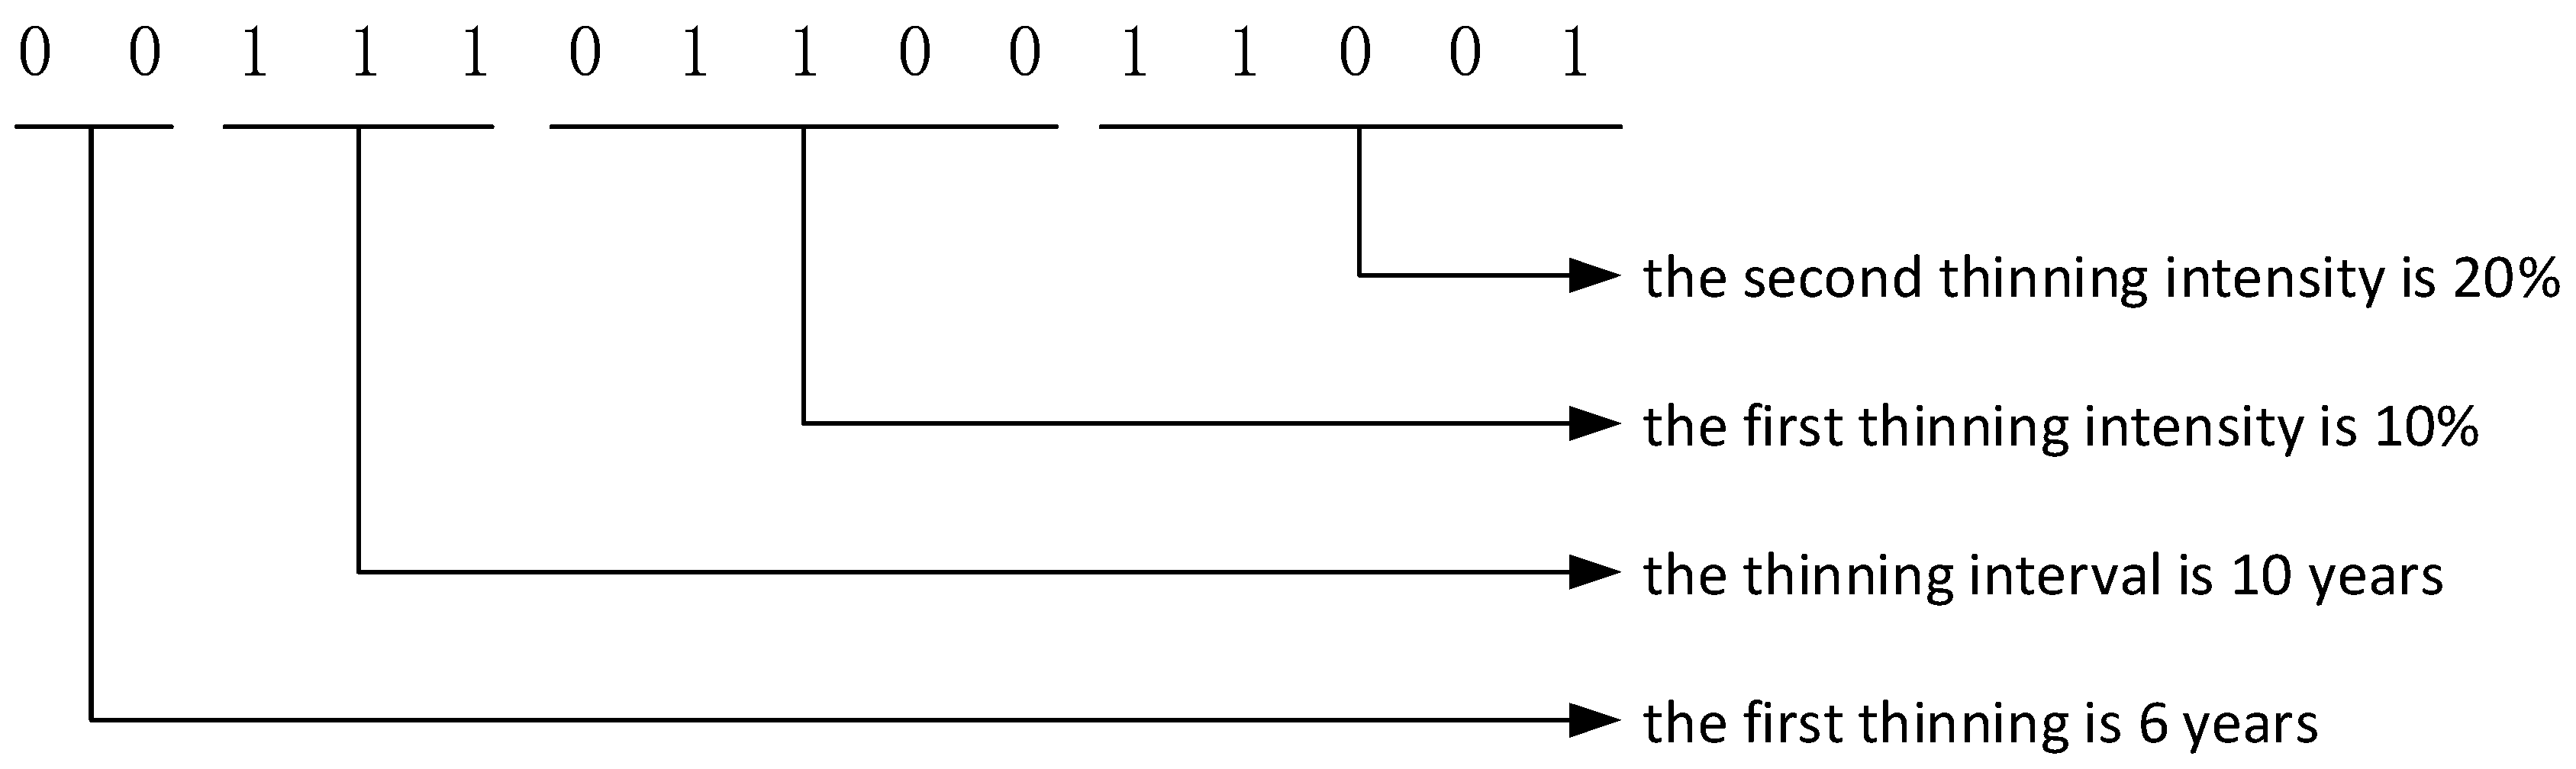
2.3.2. Genetic Algorithm for Near-Optimal Thinning Regime

Assuming that the operation period of Chinese fir is M years and considering the actual forest operation situation in Fujian Province, the first thinning in the plantation operation process occurs in 6–10 years, the number of thinnings in the plantation operation period is 1–2, the thinning interval is 5–10 years, and the range of thinning intensity is 0%–40%. GAs can provide a probabilistic guarantee of the global optimal solution [29,30]. The specific process of the GA is as follows:
Step 1. Plantation parameter chromosome encoding and decoding. The plantation parameters involved in this study are as follows: first thinning time, thinning interval, and thinning intensity. The value range of the first thinning was from 6 years to 10 years, and the binary code length is 2. The thinning interval range is from 5 years to 10 years, and the binary code length is 3. The value range of the thinning intensity is 0%–25%, the binary code length is 5, and the binary code length of thinning twice is 5 × 2 = 10. The binary coding method was used to determine the length of chromosomes L = 2 + 3 + 10 = 15. Each chromosome contained four genes (decision variables), which correspond to a thinning regime.
For example, the first thinning is 6 years, the thinning interval is 10 years, the first thinning intensity is 10%, the second thinning intensity is 20%, and the operation parameter chromosome encoding is as follows (Figure 2).
The chromosomes were decoded according to Equation (19), and the four operating parameters were decoded separately during chromosome decoding. The first two bits are the first thinning, the third to fifth bits are the thinning interval, the sixth to tenth bits are the first thinning intensity, and the last five bits are the second thinning intensity.
x = a + T ( b a ) 2 l 1
where T is the binary code of length l corresponding to a decimal value, and a and b are the respective upper and lower limits of decision variable x.
Step 2. Determination of initial population. Population length POP = 100 (corresponding to 100 thinning regimes); that is, the population is composed of 100 individuals (chromosomes), and each can be generated by the random method.
Step 3. Construction of fitness function. Four operation parameters were obtained after decoding the chromosomes and fed to the Chinese fir growth harvest model and the density effect model to calculate the fitness value of each chromosome. The objective function is the maximum carbon sequestration in the entire stand decision-making period.
Each chromosome was decoded into phenotypes (a, b, c, d), and then the fitness function was introduced. The calculation process is as follows. Given a certain stand, its site condition is SI, the initial stand density is N_0, the first thinning time is a, the first thinning intensity is c%, the thinning interval is b, and the second thinning intensity is d%. The changes in the state variables in the two thinning processes are as follows:
(1) First thinning
Before thinning: Age = a, site index = SI, stand density = N 0 , average diameter at breast height D a = f ( a , S I , N 0 ) , dominant height H T a = f a , S I , stand stock C a = f ( T H a , N 0 ) , average carbon sequestration per tree V a = f ( H T a , N 0 ) .
Number of thinned trees: N 0 c % .
Number of trees after thinning: N 1 = N 0 N 0 c % .
Thinned carbon sequestration: If D a <= 6 cm, then C 1 = V a ( N 0 c ) ; if D a   > 6 cm, then C 1 = V a ( N 0 c ) .
(2) Second thinning
Before thinning: Age = a + b, site index = SI, stand density = N 1 , average diameter at breast height D a + b = f ( a + b , S I , N 1 ) , dominant height H T a + b = f ( a + b , S I ) , stand stock C a + b = C a + C 1 + Δ C a , a + b (where Δ C a , a + b = C a + b H T a + b , N 1 C a H T a , N 1 ), average carbon sequestration per tree V a + b = f ( H T a + b , N 1 ) .
Number of thinned trees: N 1 d % .
Number of trees after thinning: N 2 = N 1 N 1 d % .
Thinned carbon sequestration: if D a + b   <= 6 cm, then C 2 = V a + b ( N 1 d ) ; if D a + b > 6 cm, then C 2 = V a + b ( N 1 d % ) .
The final decision time is set as M (corresponding to forest age is M), and the stand stock C M = C a + b + C 2 + Δ C a + b , M (where Δ C a , a + b = C M H T M , N 2 C a + b H T a + b , N 2 ). The carbon sequestration of the entire stand decision-making period includes the carbon sequestration during the first thinning, the carbon sequestration during the second thinning and the carbon growth increment after two thinnings. Therefore, the fitness function can be calculated as Equation (20).
J X i = C a + C 1 + Δ C a , a + b + C 2 + Δ C a + b , M = C a + C 1 + C a + b H T a + b , N 1 C a H T a , N 1 + C 2 + C M T H M , N 2 C a + b T H a + b , N 2
Similarly, if only one thinning is performed, the fitness function can be calculated as Equation (21).
J X i = C a + C 1 + Δ C a , M = C a + C 1 + C M H T M , N 1 C a H T a , N 1
Step 4. Genetic operator. The basic genetic operators of a GA are mutation, crossover, and selection. In this paper, the selection operation adopted the roulette algorithm, with crossover probability Pc = 0.3 and mutation probability Pm = 0.05. The fitness values of each individual in the new population after crossover and mutation were calculated, and then the selection operation was carried out until MAXGEN = 1000.
Step 5. Acquisition of optimal individuals. To avoid the loss of the optimal individuals of each generation in the evolution, the optimal individuals of each generation were stored in an array. After the iteration, these individuals were compared, and the optimal individuals were output as the result.
The information of the near-optimal thinning regime code was restored, and the thinning regime decision of the Chinese fir stand was obtained.
The pseudocode of GA for optimizing the thinning regime is as follows (Algorithm 1), and the research flowchart is shown in Figure 3.
Algorithm 1: GA for near-optimal thinning regime (GA-OTR)
Input: SI, N, M
Output: Near-optimal thinning regime, maximum carbon sequestration
1. GA parameter setting
2. Initialization of population (according to chromosome code)
3. Iteration through the individuals in the population
 Chromosome decoding
 Calculate individual fitness (based on input parameters)
 Selection operation
 Crossover operation
 Mutation operation
 Calculation of the effect of one iteration and saving the near-optimal result
4. Output of the near-optimal thinning regime and maximum carbon sequestration after all the iterations

2.4. Forest Management Planning for Carbon Sequestration Goal

Assuming that the region has 20 Chinese fir stands (numbered 1–20), their basic situation at the end of 2015 is shown in Table A1. Each stand has three management regimes, namely no thinning, thinning once and thinning twice. The total carbon sequestration of all the stands in the region is required to reach the maximum value at the end of the year 2030, and the carbon sequestration of the annual thinning must be no less than 50 t in the next 15 years.

2.4.1. Forest Management Planning Model

The forest management planning model formulation of this study was conducted according to three guidelines. First, the area control of the thinned forestland in each period is required. Then, the carbon sequestration in the thinning should not be less than 50 t every year. Finally, the aim to maximize carbon sequestration is established, depending on the option of the thinning regimes, including no thinning, thinning once, and thinning twice. The model formulation details are expressed as follows.
Objective equation:
max   Z = i I j J u i j X i j
Constraints:
j J X i j = A i i I j J v i j t X i j 50 X i j 0
Variable u i j is the carbon sequestration per hectare of the i t h stand under the j t h management scheme. Variable v i j t is the carbon sequestration per hectare of the i t h stand in t period under the j t h management scheme. Variable X i j is the area of the i t h stand under the i t h management scheme. Variable A i is total area of the i t h stand.
In this study, stand segmentation is prohibited; that is, a stand can only adopt one of the three thinning regimes. If the i t h stand adopts the i t h management scheme, then X i j = A i , and X i k = 0   ( k = 1 3 , k j ) .

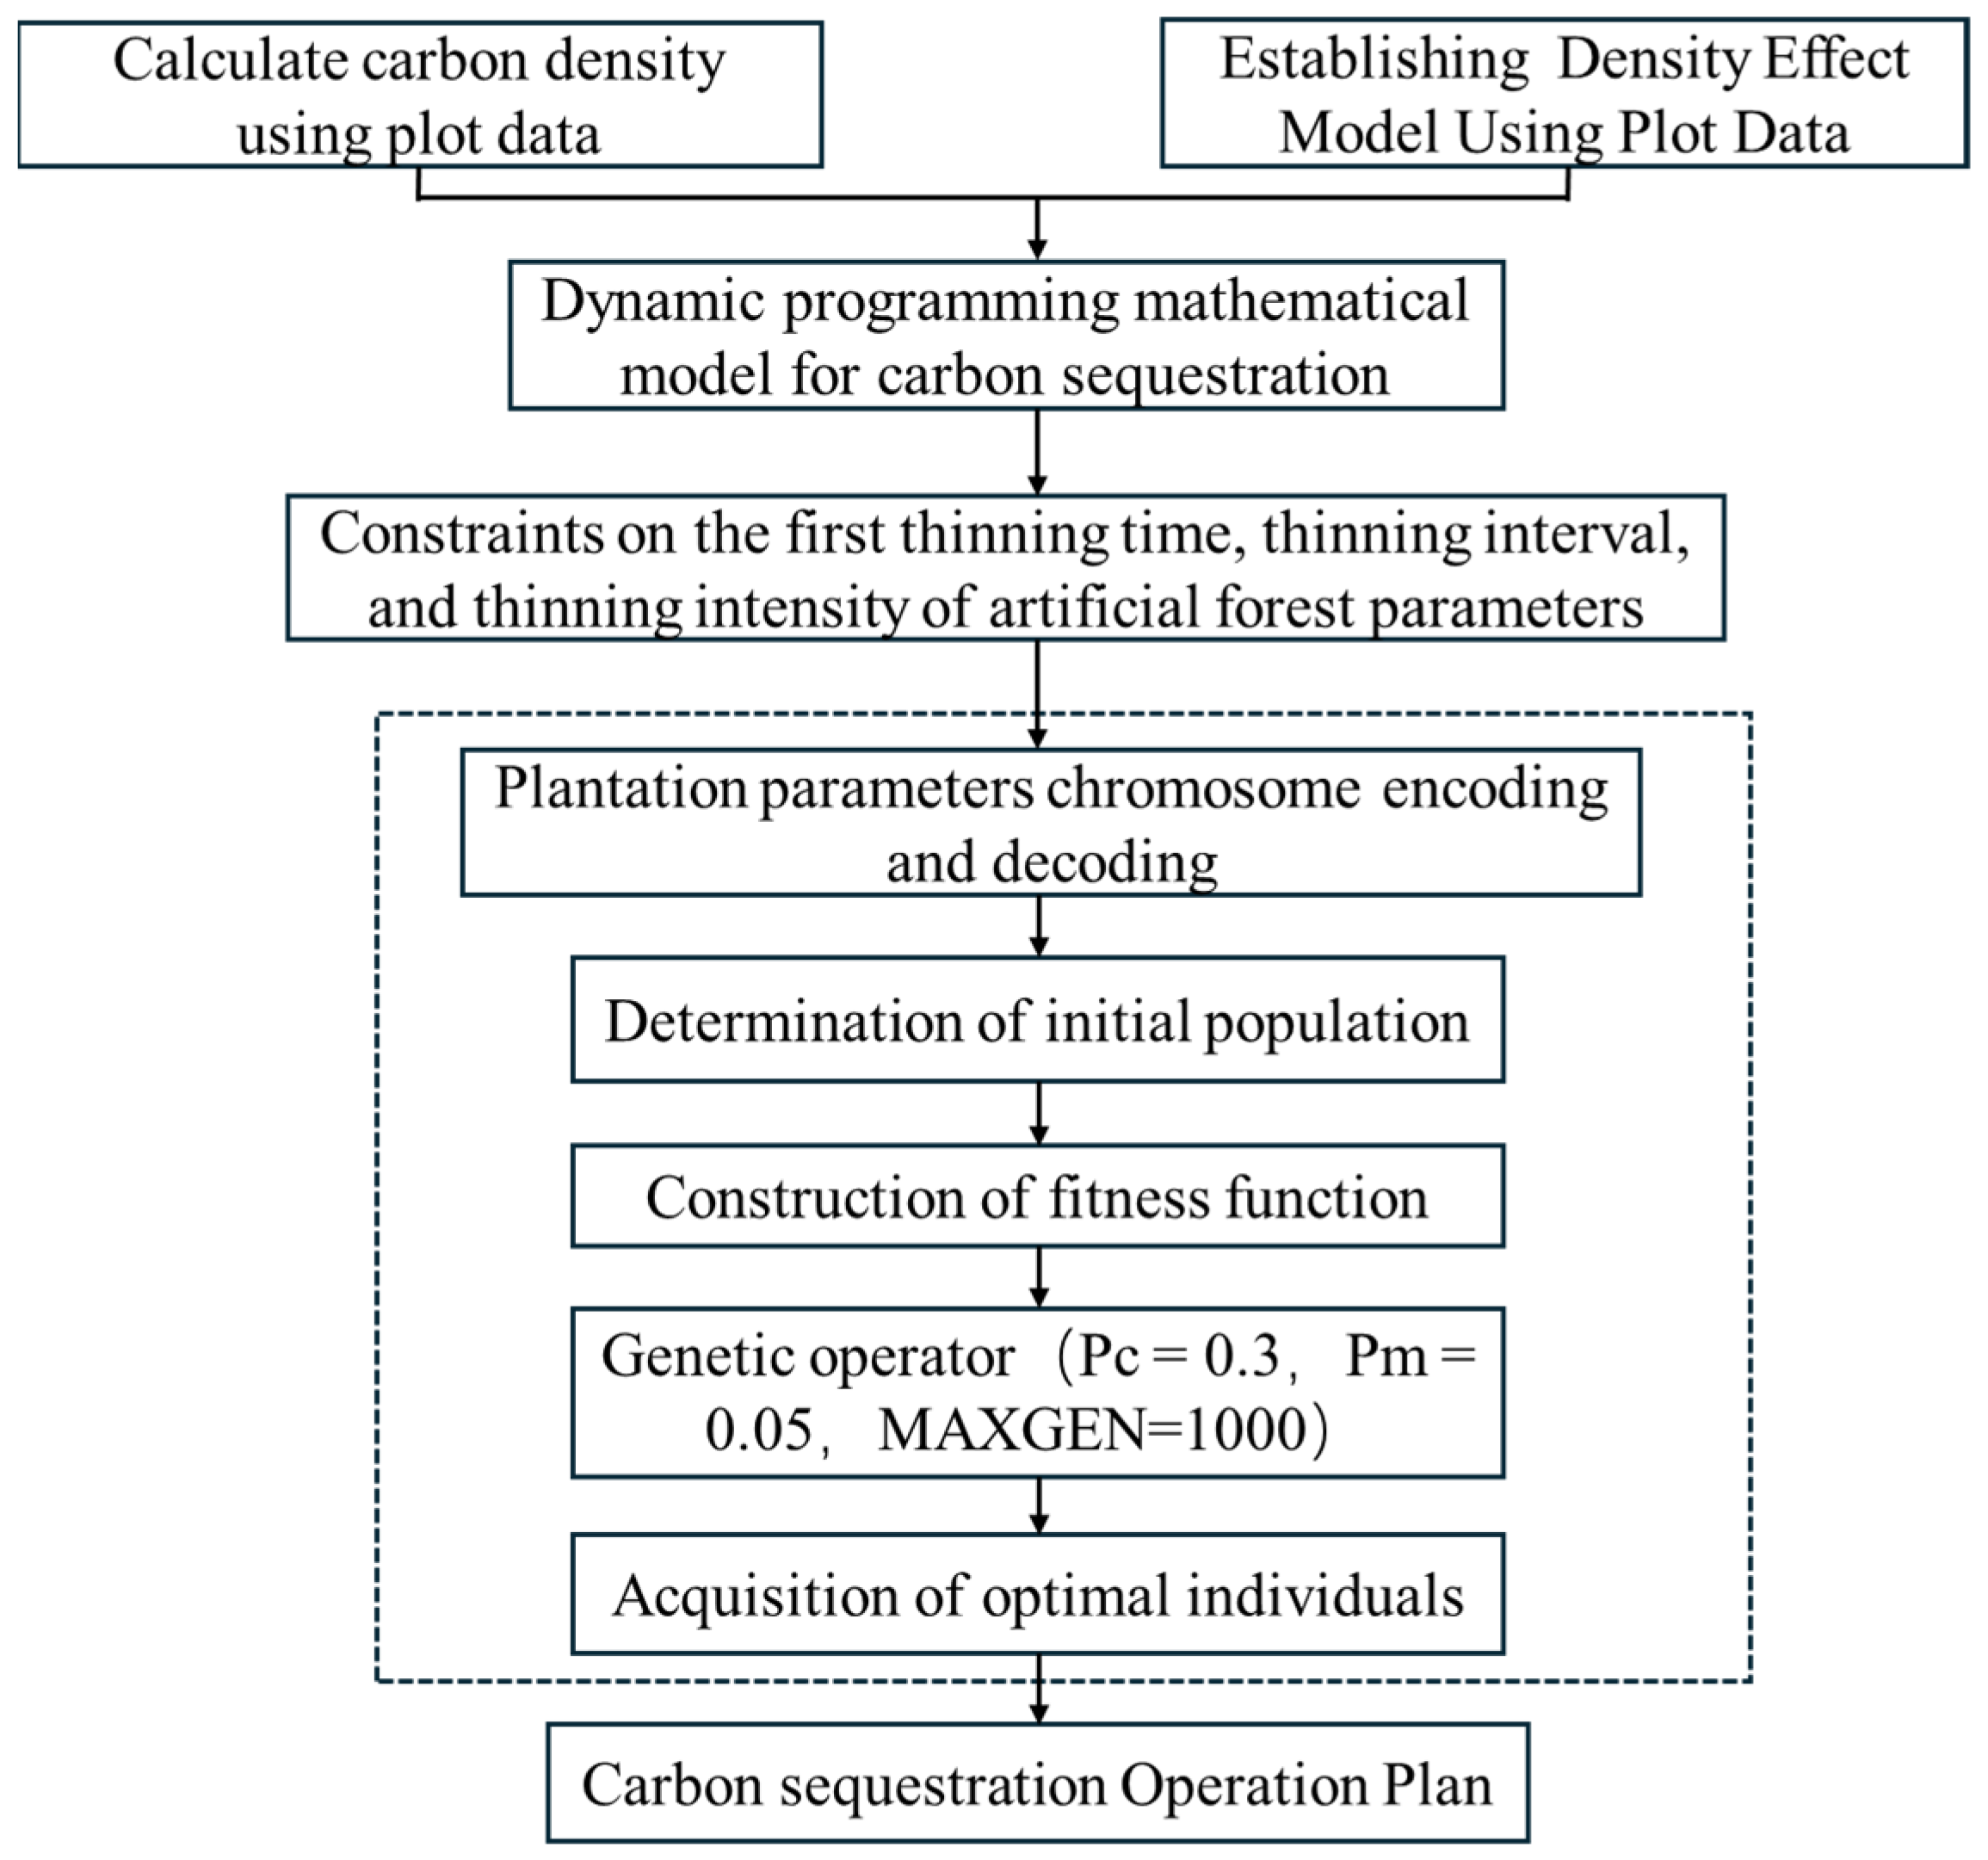
2.4.2. Genetic Algorithm to Solve Operation Management Planning

GA was applied to multi-stand carbon sequestration management planning. Each stand near-optimal thinning regime is regarded as a gene, and the binary code length is 2. Then, the combination of 20 stand management modes uses an individual with a binary length of 2 × 20 = 40 bits. Any individual in the group is a combination of management modes of 20 stands, which corresponds to a management planning scheme for the region.
Initial population number POP is set, and 40-bit binary numbers are randomly generated to represent the genotype of the POP individuals. The fitness function is a key element of a forest management planning model. After decoding the genotypes, the annual carbon sequestration and objective equation values of the POP individuals are calculated. The fitness function should be constructed to maximize the objective equation values under the annual carbon sequestration constraints. The fitness values of each individual in the new population after crossover and mutation are calculated, and then the selection operation is carried out until MAXGEN = 800. After selecting and adjusting the appropriate parameters, the GA can quickly converge the near-optimal solution to a similar degree.

3. Results

3.1. Density Effect Model Results

The statistics in Table 2 indicate that the density effect model exhibits good performance in terms of the fitting ( R 2 = 0.8701, RMSE = 7.548) and test ( R 2 = 0.8291, RMSE = 8.447) results.
In the context of Chinese fir cultivation, the production elasticity coefficients, as derived from the density effect model, are encapsulated within Equations (9) and (10). These coefficients are pivotal for understanding the sensitivity of Chinese fir production to variations in input factors, such as planting density or other cultivation practices. As shown in Table 1, the average dominant height of each stand in this region is 10.5 m, with an average of 2124 trees per hectare. The average EP(TH) is 2.781, while the average EP(N) is −0.672. A higher EP(TH) value indicates that the site condition effect is at an increasing stage, implying that better site conditions lead to improved outcomes. Conversely, a negative EP(N) value suggests that the density effect is also at a negative stage. It is noteworthy that a 1% decrease in density results in a 0.672% increase in carbon sequestration per Chinese fir tree. This indicates that the stand density of Chinese fir plantations in the surveyed area of Fujian Province is relatively high and should be appropriately reduced.
The MPP(TH) = 0.003 (Equation (11)) and MPP(N) = −0.0000035 (Equation (12)) reveal crucial insights from the multi-factor marginal product analysis. These findings demonstrate that, under current conditions, adding one tree per hectare will result in a reduction in carbon sequestration per tree by 0.0000035 tons. Furthermore, the data show that for every 1 m increase in the site index, the carbon sequestration per tree increases by 0.003 tons. This emphasizes the considerable influence of site density on carbon sequestration per tree.

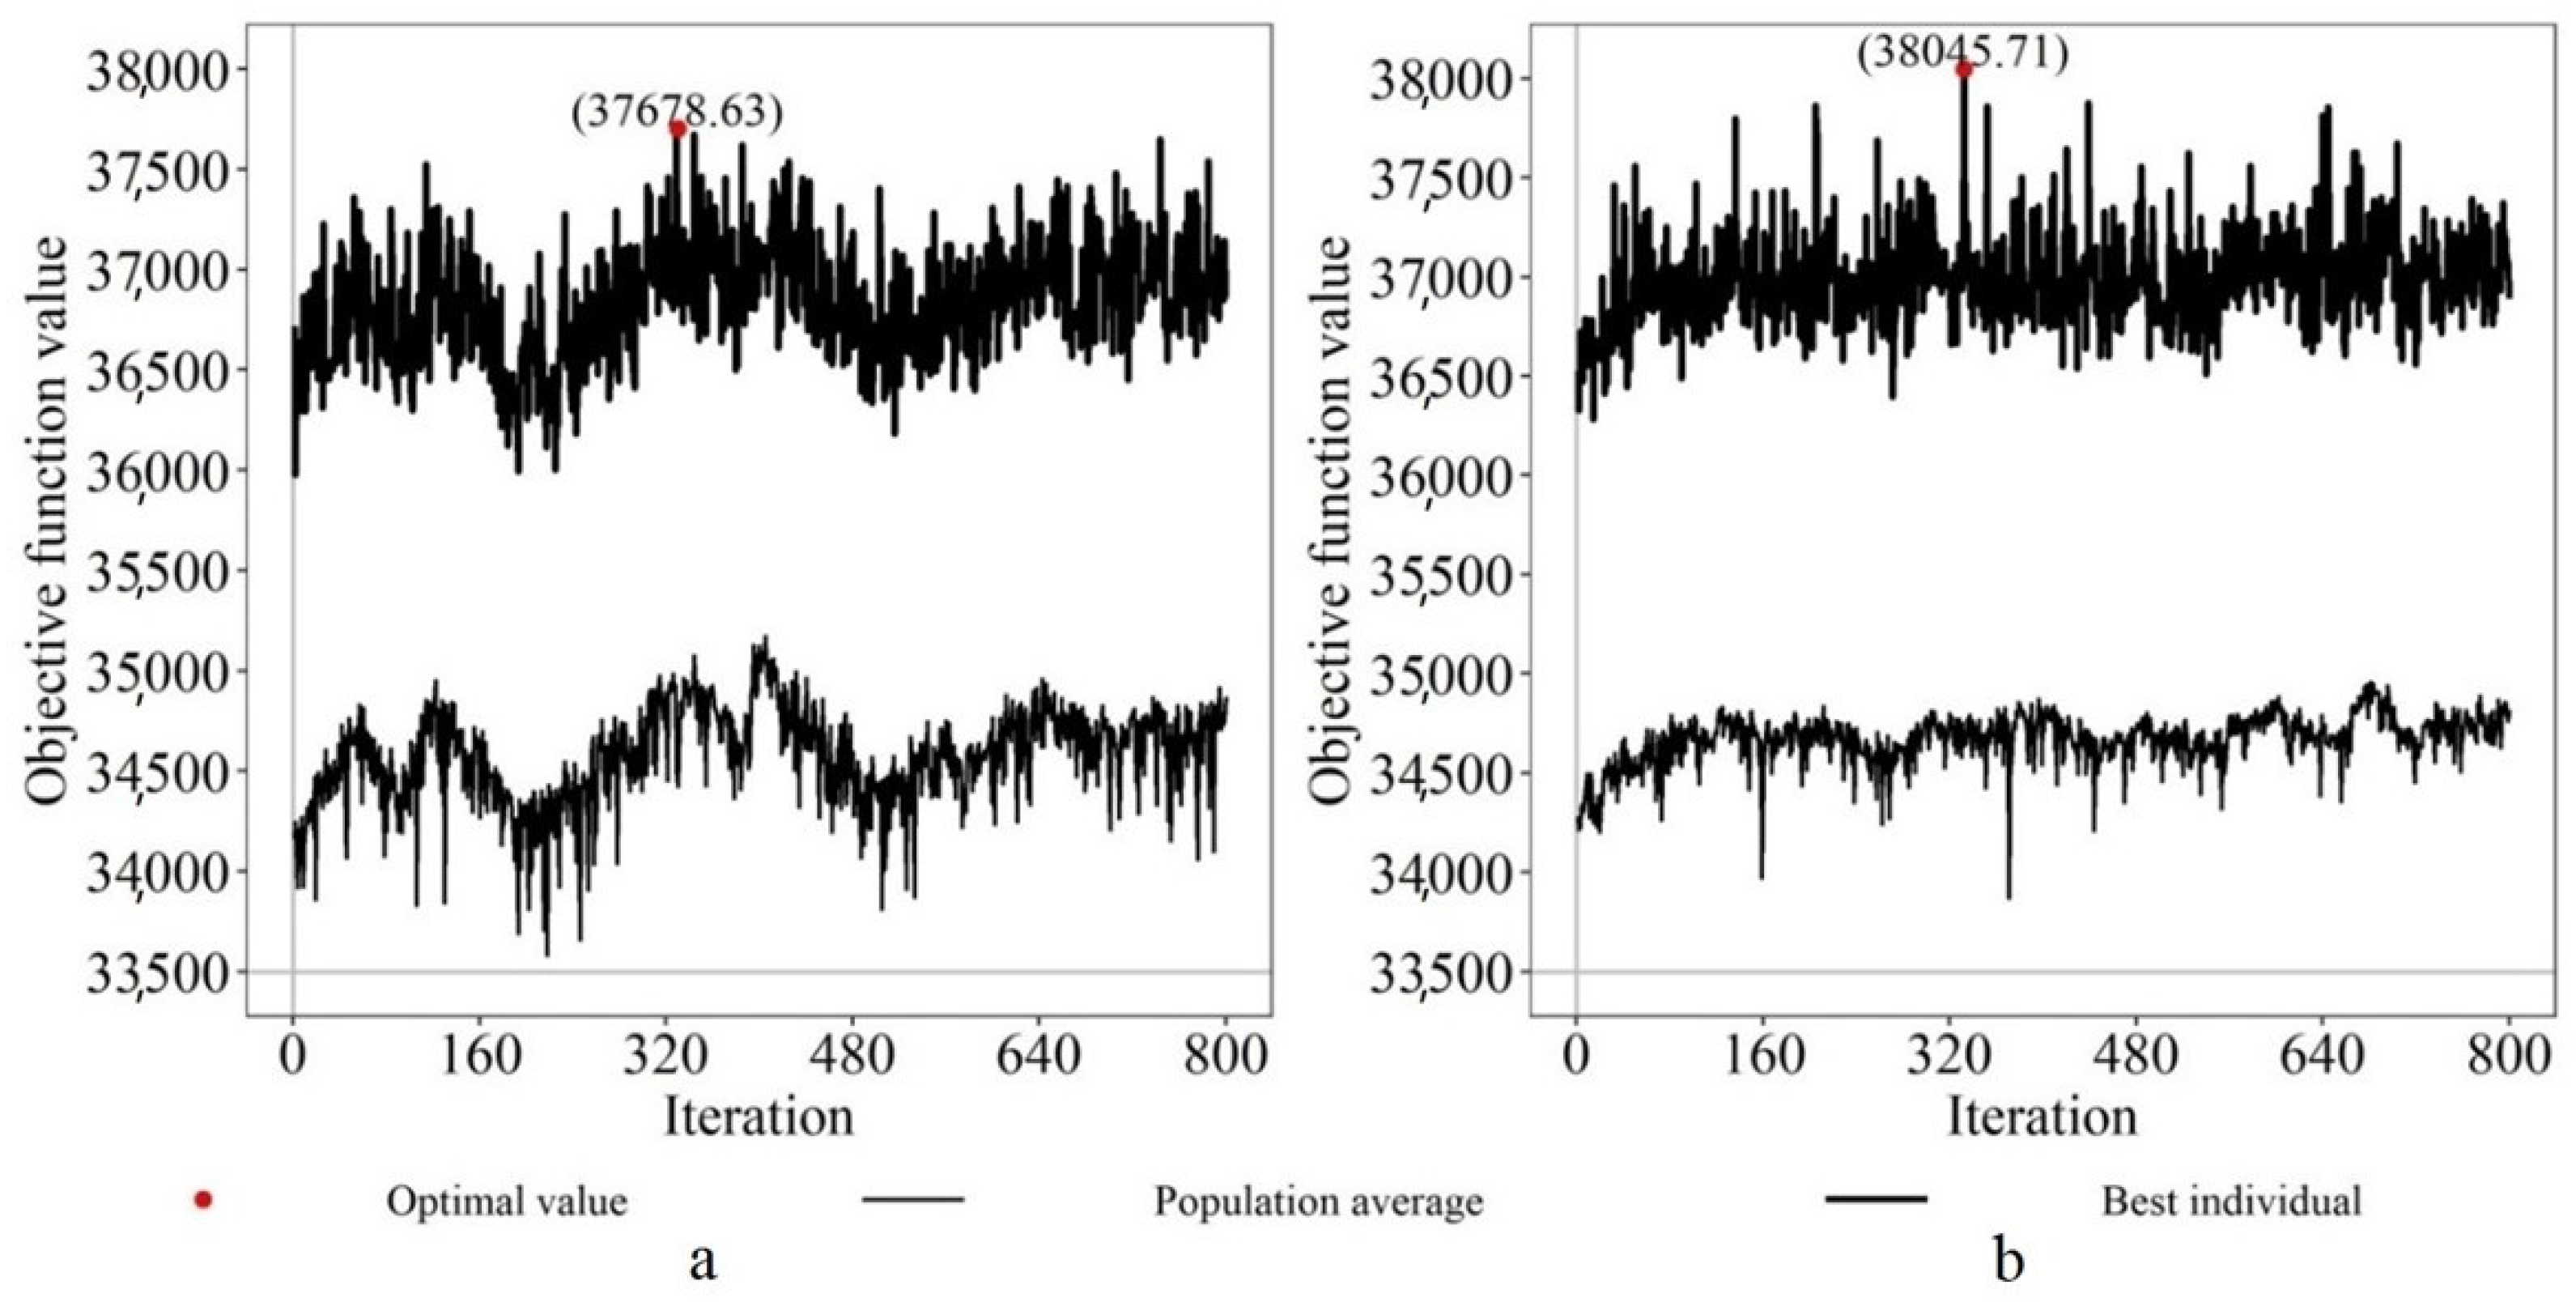
3.2. Near-Optimal Thinning Regime for Carbon Sequestration Goal

Based on the basic situation of 20 stands at the end of 2015 in Table 2, GA was used to calculate the near-optimal thinning regime for thinning once and thinning twice for each stand and carbon sequestration per hectare at 30 years of age (Table A2). Taking stand No. 1 as an example, the near-optimal output of thinning twice is as follows:
Near-optimal thinning regime: (10.0, 10.0, 20.0, 25.0).
Carbon sequestration goal values: 139.573.
It can be interpreted as follows: the first thinning age is 10 years (the first number), the first thinning intensity is 20% (the third number), the second thinning age is 20 years (the first number + the second number), the second thinning intensity is 25% (the fourth number), and the carbon sequestration per hectare is 139.573 t ha−1 when the decision time is 30 years. Figure 4 shows the changes in the stand carbon sequestration and stand density with age during the entire decision-making period, covering an appropriate forest management planning schedule for carbon sequestration goals.
Figure 5 illustrates the convergence process of the genetic algorithm (GA) with initial population sizes of 500 and 1000. Additionally, Table 3 demonstrates that using crossover and mutation probabilities of 0.5 and 0.01, respectively, with an initial population size of 1000 yielded favorable results. It is important to note that different parameter settings can impact the convergence rate, runtime, and the quality of the near-optimal solution. After adjusting and selecting appropriate GA parameters (iteration number = 800, initial population number = 1000, crossover probability = 0.5, mutation probability = 0.01), a forest management plan for achieving the carbon sequestration goal was generated, as shown in Table 4. The near-optimal carbon sequestration amount is 38,045.71 tons. Over the 15-year period from 2016 to 2030, 20 Chinese fir stands are expected to meet the annual thinning constraint condition of not less than 50 tons of carbon sequestration. The corresponding near-optimal scheme is denoted by the sequence (1, 2, 1, 2, 2, 2, 2, 2, 2, 1, 2, 2, 1, 1, 2, 1, 2, 2, 2, 2), where 1 represents the stand choosing a once-thinning regime, 2 represents the stand choosing a twice-thinning regime, and 0 represents the stand choosing no thinning regime.

4. Discussion

4.1. CFMP in Carbon Sequestration Management of Plantation

As forest management objectives shift from timber yield to carbon sequestration under climate change, optimal thinning plays a pivotal role in developing a climate change adaptation strategy for forest management. However, relatively few studies on the CFMP in the carbon sequestration management of plantations have been conducted, especially from the perspective of thinning density. Nutrient removal and reduced organic matter inputs to forest soils through different thinning regime practices may affect the long-term forest soil fertility and stand productivity, affecting the carbon sink capacity of forest ecosystems [46]. Measuring the effectiveness of thinning practices in carbon sequestration is a complex process that involves numerous considerations. This includes estimating forest carbon sequestration potential, simulating forest carbon cycling, optimizing forest management strategies, assessing forest carbon sink functions, and establishing sustainable forestry carbon finance markets. Studying the status, driving factors, and ways to enhance the global forest carbon sink function, as well as the distribution of and changes in forest soil carbon storage, are important aspects for measuring the effectiveness of thinning practices. It is essential to establish a sound carbon finance market, promote the increase in forest carbon sinks through policy guidance and international cooperation, and improve the quality and efficiency of the forestry carbon finance system.
This study explored the application of GAs in near-optimal thinning regimes at the stand level and near-optimal forest management planning at the regional level under the forest management objectives of carbon sequestration. The field of near-optimal carbon sequestration focuses on sequestering 38,045.71 tons of carbon. Over the 15-year period from 2016 to 2030, it is crucial for 20 Chinese fir stands to consistently meet the requirement of sequestering a minimum of 50 tons of carbon annually through thinning. When compared to traditional methods, the GA algorithm not only significantly enhances carbon sequestration but also offers comprehensive guidance for real-world operations. Following the CFMP in the carbon sequestration management of plantations will also help China achieve its carbon neutrality target for 2060, because doing so will effectively improve the forest carbon sinks [46].

4.2. Effect of Thinning on Carbon Sequestration of Chinese Fir

Our results confirm that thinning is better than no thinning when analyzing the near-optimal thinning scheme of each stand, because our tree age is between 5 and 9 years. In the seedling stage, the forest has not formed a stable ecological structure, and thinning at this time reduces the competition between organisms for resources, which not only plays a positive role in promoting the growth of Chinese fir but also lays a good foundation for ecological development. Therefore, after thinning, the forest carbon sequestration shows a rapid growth trend. A previous study demonstrated that thinning a Chinese fir forest in 6–10 years played a fundamental role in the formation of a stand structure in the later period of the forest and significantly increased the biomass in the forest area in Fujian Province [47]. This report is consistent with our finding that thinning at a young age has played a positive role in promoting the carbon sequestration of Chinese fir. Wang Zichun et al. [48] believed that thinning reduces the stand density but can increase the biomass of a single tree, so it does not necessarily reduce the stand biomass, which is related to the growth years after thinning. However, Xu Jinliang et al. [49] found that 15 years of thinning had no significant effect on the carbon sequestration of Chinese fir. Therefore, the effect of thinning on the carbon sequestration of Chinese fir also requires further monitoring.
At both the stand and regional levels of forest optimization, time is an important factor due to the length of the planning horizon [16]. The stand-level near-optimal regime (timing of management activities) can be perceived to change considerably as the final decision time point is varied. These effects, such as site index and stand density, are more closely related to stand optimization problems. At other scales, a limited set of stand-level decisions is typically available for addressing regional level goals. Table 4 shows that the objective equation value of thinning twice is better than that of thinning once. However, the constraint seems to be that after thinning, the amount of carbon remaining (residual) in a stand should be 50; thinning once and the stand area should be considered in the forest management planning. The greater the number of decision variables, the more thinning regimes will be generated for simulation, resulting in additional loads and entailing additional computational resources. GA was studied for optimization, and other heuristic methods, such as simulated annealing and particle swarm optimization or some reinforcement learning algorithms, require further exploration.

4.3. Research Forecast

This study focused on thinning and density control for the carbon sequestration management of plantations, excluding the influence of the optimal rotation length problem for economic and commodity production objectives, fertilization intensity, and other silvicultural treatments on the carbon sequestration management of plantations. Forest ecosystem management and carbon balance take into consideration carbon sequestration and emissions. The comprehensive evaluation of the change mechanism of forest management measures for carbon sequestration and the effect of the carbon sequestration capacity of Chinese fir on offsetting carbon emissions from fossil energy are potential directions of future research on carbon sequestration management.

5. Conclusions

This study analyzed how near-optimal thinning for carbon sequestration goals depends on the carbon assessment method and the optimization technique. Our results indicate that the density effect model is a reliable carbon assessment method, which is crucial for optimizing thinning regimes and generating an appropriate forest management planning schedule. For complicated forest decision-making problems, the heuristic optimization technique GA is a promising alternative. The GA optimization approach, designed in this study for the forest decision problems (thinning and forest management planning) of carbon sequestration management under single stands (stand level) and multiple stands (regional level) is valuable. Implementing the Carbon Forest Management Plan (CFMP) for carbon sequestration in plantations can help China achieve its 2060 carbon neutrality target by enhancing forest carbon sinks.

Author Contributions

Conceptualization, Z.M. and C.D.; methodology, Z.M., C.D. and Y.C.; validation, C.D., Y.C. and Y.T.; formal analysis, Z.M.; data curation, Z.M.; writing—original draft preparation, Y.T. and Y.C.; writing—review and editing, Z.M. and Y.T. All authors have read and agreed to the published version of the manuscript.

Funding

This research was funded by the National Natural Science Foundation of China No 32301585, Zhejiang A&F University Research Development Fund Project No L20210148.

Data Availability Statement

We do not provide the original data used in this paper, but researchers can easily obtain data in a similar format and amount.

Conflicts of Interest

The authors declare no conflicts of interest.

Appendix A

Table A1. Basic status of 20 stands at the end of the year 2015.
Stand No.Area (ha)SI (m)A (Year)N (Trees ha−1)
15.91653000
26.11882700
32.82093000
430.21472500
525.11662700
65.31872550
715.91653750
816.52052250
918.61663330
104.81892500
116.52261667
129.71693333
137.32062850
1411.31472700
1512.41682550
16151282700
1713.41892850
188.52072850
1916.22092700
208.71682700
Table A2. Possible alternative options and their carbon output for each stand during the entire decision-making period.
Stand No.OptionThinning RegimeThinning Time and Carbon DensityC Goal Values
201620172018201920202021202220232024202520262027202820292030
1No thinning/ 120.236
1Thinning once(15.0, 40.0) 22.366 129.916
1Two thinning(10.0, 10.0, 20.0, 25.0) 5.378 24.657139.573
2No thinning/ 165.241
2Thinning once(15.0, 40.0) 31.238 175.561
2Two thinning(10.0, 10.0, 9.0, 25.0) 3.443 30.314 187.473
3No thinning/ 226.818
3Thinning once(15.0, 40.0) 42.512 243.169
3Two thinning(10.0, 10.0, 15.0, 25.0)7.734 44.031 260.200
4No thinning/ 80.169
4Thinning once(15.0, 40.0) 15.174 85.064
4Two thinning(10.0, 10.0, 8.0, 25.0) 1.489 14.586 90.835
5No thinning/ 118.714
5Thinning once(15.0, 40.0) 22.373 126.539
5Thinning twice(10.0, 10.0, 12.0, 25.0) 3.277 22.344 135.183
6No thinning/ 162.604
6Thinning once(15.0, 40.0) 30.901 171.799
6Thinning twice(10.0, 10.0, 5.0, 25.0) 1.903 28.904 183.551
7No thinning/ 113.833
7Thinning once(15.0, 40.0) 20.165 129.008
7Thinning twice(10.0, 10.0, 25.0, 25.0) 5.707 27.173143.760
8No thinning/ 207.108
8Thinning once(15.0, 40.0) 39.79 216.250
8Thinning twice(10.0, 10.0, 2.0, 25.0) 0.992 36.119232.155
9No thinning/ 119.216
9Thinning once(15.0, 40.0) 21.781 131.162
9Thinning twice(10.0, 10.0, 25.0, 25.0) 6.408 26.604 142.718
10No thinning/ 161.555
10Thinning once(15.0, 40.0) 30.752 170.388
10Thinning twice(10.0, 10.0, 3.0, 25.0)1.139 28.318 182.144
11No thinning/ 225.977
11Thinning once(15.0, 40.0) 44.045 232.198
11Thinning twice(10.0, 10.0, 10.0, 25.0) 5.577 40.632 333.476
12No thinning/ 119.193
12Thinning once(15.0, 40.0) 21.773 131.161
12Thinning twice(10.0, 10.0, 25.0, 25.0)6.404 26.61 142.825
13No thinning/ 224.849
13Thinning once(15.0, 40.0) 42.389 239.591
13Thinning twice(10.0, 10.0, 11.0, 25.0) 5.693 41.982 255.939
14No thinning/ 81.471
14Thinning once(15.0, 40.0) 26.572 87.189
14Thinning twice(10.0, 10.0, 14.0, 25.0) 2.602 15.651 93.243
15No thinning/ 117.078
15Thinning once(15.0, 40.0) 22.19 124.050
15Thinning twice(10.0, 10.0, 7.0, 25.0) 1.908 21.13 132.474
16No thinning/ 52.634
16Thinning once(15.0, 40.0) 9.834 56.614
16Thinning twice(10.0, 10.0, 17.0, 25.0) 2.02 10.439 60.674
17No thinning/ 167.108
17Thinning once(15.0, 40.0) 31.411 178.618
17Thinning twice(10.0, 10.0, 13.0, 25.0)4.969 31.799 190.947
18No thinning/ 224.849
18Thinning once(15.0, 40.0) 42.389 239.591
18Thinning twice(10.0, 10.0, 12.0, 25.0) 6.21 42.307 255.939
19No thinning/ 221.893
19Thinning once(15.0, 40.0) 42.055 235.111
19Thinning twice(10.0, 10.0, 7.0, 25.0)3.616 40.048 251.078
20No thinning/ 118.714
20Thinning once(15.0, 40.0) 22.373 126.539
20Thinning twice(10.0, 10.0, 12.0, 25.0) 3.277 22.344 135.183
Notes: Thinning once (15.0, 40.0), thinning age is 15 years, and thinning intensity is 40%.

References

  1. Zhang, H.; Lei, X.; Zhang, C.; Zhao, X.; Hu, X. Research on theory and technology of forest quality evaluation and precision improvement. J. Beijing For. Univ. 2019, 41, 1–18. [Google Scholar] [CrossRef]
  2. Chen, Y. Research on Matching Tree Species with Site and Growth Yield Benefit Assessment of Plantation-in the Case of Cunninghamia lanceolata and Pinus massoniana in Guizhou Provinc. Ph.D. Thesis, Beijing Forestry University, Beijing, China, 2020. (In Chinese). [Google Scholar] [CrossRef]
  3. Chen, Y.; Zheng, C.; Chang, C. Efficiently mapping an appropriate thinning schedule for optimum carbon sequestration: An application of multi-segment goal programming. For. Ecol. Manag. 2011, 262, 1168–1173. [Google Scholar] [CrossRef]
  4. Chen, Y.; Dong, C.; Wu, B. Crown Profile Modeling and Prediction Based on Ensemble Learning. Forests 2022, 13, 410. [Google Scholar] [CrossRef]
  5. Romanov, A.A.; Tamarovskaya, A.N.; Gloor, E.; Brienen, R.; Gusev, B.A.; Leonenko, E.V.; Vasiliev, A.S.; Krikunov, E.E. Reassessment of Carbon Emissions from Fires and a New Estimate of Net Carbon Uptake in Russian Forests in 2001–2021. Sci. Total Environ. 2022, 846, 157322. [Google Scholar] [CrossRef]
  6. Kang, H.; Seely, B.; Wang, G. Evaluating management tradeoffs between economic fiber production and other ecosystem services in a Chinese-fir dominated forest plantation in Fujian Province. Sci. Total Environ. 2016, 557–558, 80–90. [Google Scholar] [CrossRef] [PubMed]
  7. Kucuker, D.M. Analyzing the effects of various forest management strategies and carbon prices on carbon dynamics in western Turkey. J. Environ. Manag. 2019, 249, 109356.1–109356.10. [Google Scholar] [CrossRef]
  8. Schwaiger, F.; Poschenrieder, W.; Biber, P. Ecosystem service trade-offs for adaptive forest management. Ecosyst. Serv. 2019, 39, 100993. [Google Scholar] [CrossRef]
  9. Valsta, L.T. A scenario approach to stochastic anticipatory optimization in stand management. For. Sci. 1992, 38, 430–447. [Google Scholar] [CrossRef]
  10. Cao, T. Silvicultural Decisions Based on Simulation-Optimization Systems; Dissertationes Forestales 103; Finnish Society of Forest Science: Helsinki, Finland, 2010; pp. 9–47. ISBN 978-951-651-295-5. [Google Scholar]
  11. Chen, B.; Hui, G.; Klaus, G. The Application and Comparison of Linear Programming, Simulated Annealing and Genetic Algorithm in the Sustainable Management of Cunninghamia lanceolata Plantations. Sci. Silvae Sin. 2004, 40, 80–87. [Google Scholar] [CrossRef]
  12. Knoke, T.; Paul, C.; Friedrich, S.; Borchert, H.; Haertl, F.; Chang, S.J. The optimal rotation for a fully regulated forest is the same as, or shorter than, the rotation for a single even-aged forest stand: Comments on Helmedag’s (2018) paper. Eur. J. For. Res. 2018, 139, 133–143. [Google Scholar] [CrossRef]
  13. Eyvindson, K.; Kangas, A. Guidelines for risk management in forest planning—What is risk and when is risk management useful? Can. J. For. Res. 2018, 48, 309–316. [Google Scholar] [CrossRef]
  14. Li, Z.C.; Xiao, J.; Lu, G.; Sun, W.N.; Ma, C.G.; Jin, Y.D. Productivity and profitability of Larix principis-rupprechtii and Pinus tabuliformis plantation forests in Northeast China. For. Policy Econ. 2020, 121, 102314. [Google Scholar] [CrossRef]
  15. Liu, F.; Hu, M.X.; Huang, W.B.; Chen, C.X.; Li, J.H. Future Carbon Sequestration and Timber Yields from Chinese Commercial Forests under Shared Socioeconomic Pathways. Forests 2023, 14, 153. [Google Scholar] [CrossRef]
  16. Kaya, A.; Bettinger, P.; Boston, K.; Akbulut, R.; Ucar, Z.; Siry, J.; Merry, K.; Cieszewski, C. Optimisation in Forest Management. Curr. For. Rep. 2016, 2, 1–17. [Google Scholar] [CrossRef]
  17. Hui, G.Y.; Pommerening, A. Analysing tree species and size diversity patterns in multi-species uneven-aged forest of Northern China. For. Ecol. Manag. 2014, 316, 125–138. [Google Scholar] [CrossRef]
  18. Wang, C.; Liu, S.G.; Zhu, Y.; Smith, A.R.; Ning, Y.; Deng, D.M. Aboveground carbon sequestration of Cunninghamia lanceolata forests: Magnitude and drivers. For. Ecosyst. 2024, 11, 100165. [Google Scholar] [CrossRef]
  19. Ramírez-Martínez, A.; González-Guillen, M.D.; de los Santos-Posadas, H.M.D.; Angeles-Pérez, G.; Santiago-García, W. Forest management with carbon scenarios in the central region of Mexico. iForest-BioGeosci. For. 2021, 14, 413–420. [Google Scholar] [CrossRef]
  20. Liu, M.; Hao, R.H.; Han, L.; Zhou, G.X.; Li, L.Z. An integrated economic-ecological index based on satellite-derived carbon sequestration and carbon price: A case study during 2015–2020 in Shaanxi, China. Ecol. Indic. 2023, 153, 110458. [Google Scholar] [CrossRef]
  21. Stainback, G.A.; Alavalapati, J.R.R. Economic analysis of slash pine forest carbon sequestration in the southern US. J. For. Econ. 2002, 8, 105–117. [Google Scholar] [CrossRef]
  22. Zhu, Z.; Xu, Z.; Shen, Y.; Zhan, J.; Li, B.; Chen, M. Effect of off-farm employment on the harvesting decision-making of households with different scales in China’s collective forest area. J. Nat. Resour. 2019, 34, 236–249. [Google Scholar] [CrossRef]
  23. Zhu, W.; Gu, L. Decision Making of Forest Management under Carbon Sink-a Case Study of Chinese Fir Forest in Jiangxi. For. Resour. Manag. 2017, 3, 41–45+55. [Google Scholar] [CrossRef]
  24. Zhang, X.; Jia, W.; Sun, Y.; Wang, F.; Miu, Y. Simulation of Spatial and Temporal Distribution of Forest Carbon Stocks in Long Time Series—Based on Remote Sensing and Deep Learning. Forests 2023, 14, 483. [Google Scholar] [CrossRef]
  25. Xu, C.; Wang, B.; Chen, J. Forest Carbon Sink in China: Linked Drivers and Long Short-Term Memory Network-Based Prediction. J. Clean. Prod. 2022, 359, 132085. [Google Scholar] [CrossRef]
  26. Thornley, J.H.M.; Cannell, M.G.R. Managing forests for wood yield and carbon storage: A theoretical study. Tree Physiol. 2000, 20, 477–484. [Google Scholar] [CrossRef]
  27. Briceño-Elizondo, E.; Garcia-Gonzalo, J.; Peltola, H.; Kellomäki, S. Carbon stocks and timber yield in two boreal forest ecosystems under current and changing climatic conditions subjected to varying management regimes. Environ. Sci. Policy 2006, 9, 237–252. [Google Scholar] [CrossRef]
  28. Guo, W. The Effects of Thinning Intensity on Carbon Sequestration of Pinus tabulaeformis Plantations in Northern Mountain Areas of Beijing. Ph.D. Thesis, Beijing Forestry University, Beijing, China, 2017. (In Chinese). [Google Scholar] [CrossRef]
  29. Han, F.; Tian, X.; Dang, K.; Cao, T. Impact of Thinning on Carbon Storage for Pinus tabulae formis Stands in Shanxi Qiaoshan. J. Northwest For. Univ. 2015, 30, 184–191. [Google Scholar] [CrossRef]
  30. Pan, P.; Sun, Y.J.; Ouyang, X.Z.; Rao, J.F.; Ning, J.K. Factors Affecting Spatial Variation in Vegetation Carbon Density in Pinus massoniana Lamb. Forest in Subtropical China. Forests 2019, 10, 880. [Google Scholar] [CrossRef]
  31. Tahvonen, O.; Suominen, A.; Parkatti, V.P.; Malo, P. Optimizing high-dimensional forestry for wood production and carbon sinks. Can. J. For. Res. 2024, 54, 877–894. [Google Scholar] [CrossRef]
  32. Zhou, Y.; Liu, S.; Yao, S.; Lin, Y. A Meta-analysis of the Response of Forest Carbon Sinks to Forest Management Intensity. For. Econ. 2021, 43, 12–25. [Google Scholar] [CrossRef]
  33. Hoen, H.F.; Solberg, B. Potential and economic efficiency of carbon sequestration in forest biomass through silvicultural management. For. Sci. 1994, 3, 429–451. [Google Scholar] [CrossRef]
  34. Dong, L.B.; Sun, Y.X.; Liu, Z.G. Integrating carbon and timber objective into forest spatial planning management. J. Beijing For. Univ. 2017, 39, 52–61. (In Chinese) [Google Scholar]
  35. Hu, Z.; Liu, R.; Liu, P. Design and application of assistant program for county-level forest management planning. J. Beijing For. Univ. 2020, 42, 24–31. (In Chinese) [Google Scholar]
  36. Long, F.; Shen, Y.; Wu, W.; Zhu, Z.; Zhang, Z. Simulation research on the decision-making mechanism of regional forest carbon sequestration operation based on multi-agent system. J. Syst. Sci. Math. Sci. 2014, 34, 64. [Google Scholar]
  37. Xie, X.; Wang, Q.; Dai, L.; Su, D.; Wang, X.; Qi, G.; Ye, Y. Application of China’s National Forest Continuous Inventory Database. Environ. Manag. 2011, 48, 1095–1106. [Google Scholar] [CrossRef] [PubMed]
  38. Liu, Y. A Study on the Target Planning Model of Forest Management Based on Space Constraints. Master’s Thesis, Beijing Forestry University, Beijing, China, 2018. [Google Scholar] [CrossRef]
  39. Ahtisoski, A.; Salminen, H.; Hökkä, H.; Kojola, S.; Penttilä, T. Optimising stand management on peatlands: The case of northern Finland. Can. J. For. Res. 2012, 42, 247–259. [Google Scholar] [CrossRef]
  40. Ahtisoski, A.; Salminen, H.; Ojansuu, R.; Hynynen, J.; Kärkkäinenen, K.; Haapanen, M. Optimizing stand management involving the effect of genetic gain: Preliminary results for Scots pine in Finland. Can. J. For. Res. 2013, 43, 299–305. [Google Scholar] [CrossRef]
  41. Dong, L.; Bettinger, P.; Liu, Z.; Qin, H. A comparison of a neighborhood search technique for forest spatial harvest scheduling problems: A case study of the simulated annealing algorithm. For. Ecol. Manag. 2015, 356, 124–135. [Google Scholar] [CrossRef]
  42. Liu, W.Y.; Lin, C.C.; Su, K.H. Modelling the spatial forest-thinning planning problem considering carbon sequestration and emissions. For. Policy Econ. 2017, 78, 51–66. [Google Scholar] [CrossRef]
  43. Li, J.; Wang, M. Reforestation planning based on improvement of particle swarm. J. Xiamen Univ. (Nat. Sci.) 2009, 48, 823–826. (In Chinese) [Google Scholar]
  44. Li, H.; Lei, Y.C. Estimation of Forest Vegetation Biomass and Carbon Storage in China; China Forestry Press: Beijing, China, 2010; ISBN 978-7-5038-5809-3. [Google Scholar]
  45. Wu, C.; Hong, W. An optimized method of afforestation planning and design under restricted conditions using the simulated annealing algorithm. J. Nat. Resour. 2000, 1, 86–90. [Google Scholar]
  46. Deng, W.; Xiang, W.; Shuai, Q.; Hu, Y.; Chen, L.; Zeng, Y.; Deng, X.; Zhao, Z.; Forrester, D. Spatially explicit optimization of the forest management tradeoff between timber production and carbon sequestration. Ecol. Indic. 2022, 142, 109193. [Google Scholar] [CrossRef]
  47. Fu, G. Analysis on the Effect of Tending and Thinning of Cunninghamia lanceolata (Lamb.) Hook. Forest on the Biomass of Different Age of Cunninghamia lanceolata (Lamb.) Hook. Forest. For. Investig. Des. 2022, 51, 8–10. (In Chinese) [Google Scholar]
  48. Wang, Z.; Li, Y.; Meng, Y.; Wang, C. Effects of Nurturing Intercalation on Carbon density Allocation and Competition between Spruceand Fir in natural Secondary Forests in the Xiaoxingan Mountains. J. Northwest For. Univ. 2022, 37, 10–16+52. [Google Scholar] [CrossRef]
  49. Xu, J.; Mao, Y.; Cheng, X.; Yu, M. Long-term effects of thinning on carbon storage in Cunninghamia lanceolata plantations. Chin. J. Appl. Ecol. 2014, 25, 1898–1904. [Google Scholar] [CrossRef]
Figure 1. Research area map. The English text on the left image shows the names of provinces in China, while the Chinese and English on the right represent the names of cities in Fujian Province.
Forests 15 01524 g001
Figure 2. Example diagram of the operation parameter chromosome coding.
Forests 15 01524 g002
Figure 3. Research flowchart.
Forests 15 01524 g003
Figure 4. Schematic diagram of stand density and carbon density changing with age under near-optimal thinning regime (stand No. 1).
Forests 15 01524 g004
Figure 5. GA running with the data sets of two examples ((a) population size = 500, (b) population size = 1000).
Forests 15 01524 g005
Table 1. Data characteristics of 84 sample plots for carbon density modeling.
VariableMinMaxMeanStd DevCV
A (years)53013.8 7.7 0.56
D (cm)6.521.710.9 3.2 0.29
H (m)4.316.38.4 2.6 0.31
HT (m)5.518.210.5 2.7 0.26
N (trees ha−1)124549502124.0 949.8 0.45
M1 (m3 ha−1)16.089330.675 84.776 63.597 0.75
C (t ha−1)5.689126.900 24.799 20.558 0.83
Table 2. Parameters and evaluation indicators of carbon density effect model.
ParameterEstimated ValueS.E.Fitting IndicatorsTest Indicators
a10.000040.00002 R 2 = 0.8701
RMSE = 7.548
R 2 = 0.8291
RMSE = 8.447
b12.60960.1942
a21.38 × 10−81.17 × 10⁻⁸
b22.35420.3228
Table 3. Convergence effect of GA with different parameter settings.
PcPmObjective Function ValueCPU Time (Seconds)
0.30.0537,541.21378.0291
0.50.0537,749.59375.9889
0.90.0537,399.01343.8089
0.50.0138,266.94273.5580
0.50.137,439.11274.9308
Table 4. Appropriate forest management planning schedule for the carbon sequestration goal.
Stand
No.
OptionThinning Time and Carbon SequestrationFinal Carbon Sequestration
201620172018201920202021202220232024202520262027202820292030
1Thinning once 131.96 766.50
2Thinning twice 21.00 184.92 1143.59
3Thinning once 119.03 680.87
4Thinning twice 44.97 440.50 2743.22
5Thinning twice 82.25 560.83 3393.09
6Thinning twice 10.09 153.19 972.82
7Thinning twice 90.74 432.052285.78
8Thinning twice 16.37 595.963830.56
9Thinning twice 119.19 494.83 2654.55
10Thinning once 147.61 817.86
11Thinning twice 36.25 264.11 2167.59
12Thinning twice62.12 258.12 1385.40
13Thinning once 309.44 1749.01
14Thinning once 300.26 985.24
15Thinning twice 23.66 262.01 1642.68
16Thinning once 147.51 849.21
17Thinning twice66.58 426.11 2558.69
18Thinning twice 52.79 359.61 2175.48
19Thinning twice58.58 648.78 4067.46
20Thinning twice 28.51 194.39 1176.09
Total: 20 stands187.2873.17107.84237.69107.11266.64147.51300.26309.44131.961333.00641.32953.301319.781028.0138,045.71
Disclaimer/Publisher’s Note: The statements, opinions and data contained in all publications are solely those of the individual author(s) and contributor(s) and not of MDPI and/or the editor(s). MDPI and/or the editor(s) disclaim responsibility for any injury to people or property resulting from any ideas, methods, instructions or products referred to in the content.

