Abstract
The conservation of biodiversity and forest ecosystems from the perspective of increasingly pronounced climate changes represents a priority objective for present and future society. In recent decades, alongside traditional conservation methods, innovative tools such as PES (Payment for Ecosystem Services) have been introduced to support biodiversity conservation. The aim of this study is to analyze the impact of financial mechanisms for forest ecosystem conservation from the perspective of voluntary adoption by forest owners of additional conservation measures beyond those required by national environmental legislation. Through the conceptual literature review, 6069 articles were analyzed, which described the general context of the application of PES, the aims and objectives related to climate and environmental issues, the beneficiaries, as well as the legislative conditions, and the research direction in the last 7 years. The study aims to provide relevant information regarding the viability and potential impact of PES on achieving the goal of forest ecosystem conservation in Romania, during the period 2017–2023. We identified 904 cases involving 887 entities that have committed to the program for the voluntary adoption of additional measures. It has been stated that a PES approach can lead to increased efficiency in conservation actions. Following the temporal analysis of the number of applications, it was observed that in the first sessions there was a low number of applications, which means very high reluctance of the potential beneficiaries of PES, but once the first program was implemented, their interest increased. The study found a strong correlation between payments and the areas and number of plots under commitment, while there was a less strong correlation with the geographical region. Based on the data obtained, the potential impact of PES in Romania was evaluated at the social level, quantified in the number of applications submitted, and at the economic level, with the amount of money paid to applicants. The environmental impact was measured by analyzing the areas included in the subsidy mechanism and identifying the minimum 20% of the eligible areas, totally exempt from forestry interventions, which produce effects on forests, soil, water and environment.
1. Introduction
Since ancient times, forests have been a shelter and a source of indispensable materials for the economic development of the human species [1]. The relationship between forests and humans has undergone continuous evolution, starting from a civilization dominated by forests to a society that views the forest as an ecosystem capable of providing ecosystem services [1,2,3,4]. If an important function of the forest was as a provider of products, such as wood, berries and mushrooms, the concept has evolved today to a functional and organizational unit of the ecosphere.
Recent extreme climatic events have profoundly affected forest ecosystems and ecological stability [5,6,7]; thus, the involved stakeholders (e.g., foresters, environmentalists, policymakers, forests owners, and public) are interested in identifying solutions to these problems [8,9,10]. Forest management is carried out through forest management plans, which are based on principles including “adaptation of forests to climate change” [11]. In Romania, forests are managed in compliance with the forestry regime, which is defined as a “unified system of technical, economic, and legal forestry norms regarding the planning, cultivation, exploitation, protection, and guarding of the forest fund, with the aim of ensuring sustainable management”. In this regard, according to the norms and guidelines, forest owners have several options available for forest management.
Also, forest management must address the challenges related to biodiversity conservation [12]. The implementation of active forest management aims to maintain and increase the forested area, in accordance with Romania’s National Forest Strategy (NSF), which stipulates that the forested area will increase by 5% [13]. As a solution to ensure the future of forest biodiversity in the face of climate change, habitat loss, and fragmentation, protected natural areas are increasingly adopted, especially in Europe but also globally [14,15,16]. Another instrument in achieving biodiversity conservation objectives is PES (Payments for Ecosystem Services). These have the advantage of directly impacting the local economy and can be viewed as a self-financing mechanism for the management of biodiversity and forest ecosystem conservation [17]. In Romania, a PES program has been implemented in the form of state aid under Measure 15—Forest-Environmental Services, Climate Services, and Forest Conservation, managed by the Agency for Payments and Intervention in Agriculture (APIA) [18].
1.1. Purpose of Study, Objectives and Research Niche
The subject of Payment for Ecosystem Services (PES) has not been previously addressed in Romania. Currently, there are nine articles in the Web of Science that present policy design solutions to guide forest management [19,20,21,22,23,24] and issues relating to the payment terms for packages 1 and 2 of agri-environmental measures regarding the pastures [25,26].
The aim of this study was to analyze the impact of financial mechanisms for forest ecosystem conservation from the perspective of voluntary adoption by forest owners of additional conservation measures beyond those required by national environmental legislation. The study aims to provide relevant information regarding the viability and potential impact of PES on achieving the goal of forest ecosystem conservation.
The identified research problem is as follows: What is the viability and impact of Measure 15 in Romania?
The potential impact of PES in Romania refers directly to the social and economic impact in the period 2017–2023, quantified in the number of applications submitted and in the amount of money paid to applicants. The environmental impact is measured by analyzing the areas included in the subsidy mechanism and identifying the minimum 20% of the eligible areas, totally exempt from forestry interventions.
The indirect impact on the environment is translated into the conservation of forests for a period of at least 5 years, in which those 20% of the surfaces are treated as areas similar to those of nature reserves, in which any wood harvesting activities are prohibited, with effects on forests, soil, water and environment.
The objectives of the study are as follows:
Objective 1—Identification of the general context of PES application through conceptual literature review.
Objective 2—Analysis of the areas included in Measure 15 in the period 2017–2023.
Objective 3—Study of the financial results produced by Measure 15 in the period 2017–2023.
Objective 4—Description of the temporal evolution of the impact of Measure 15 at the level of surfaces and financial results.
Objective 5—Statistical correlation of data according to areas and financial results.
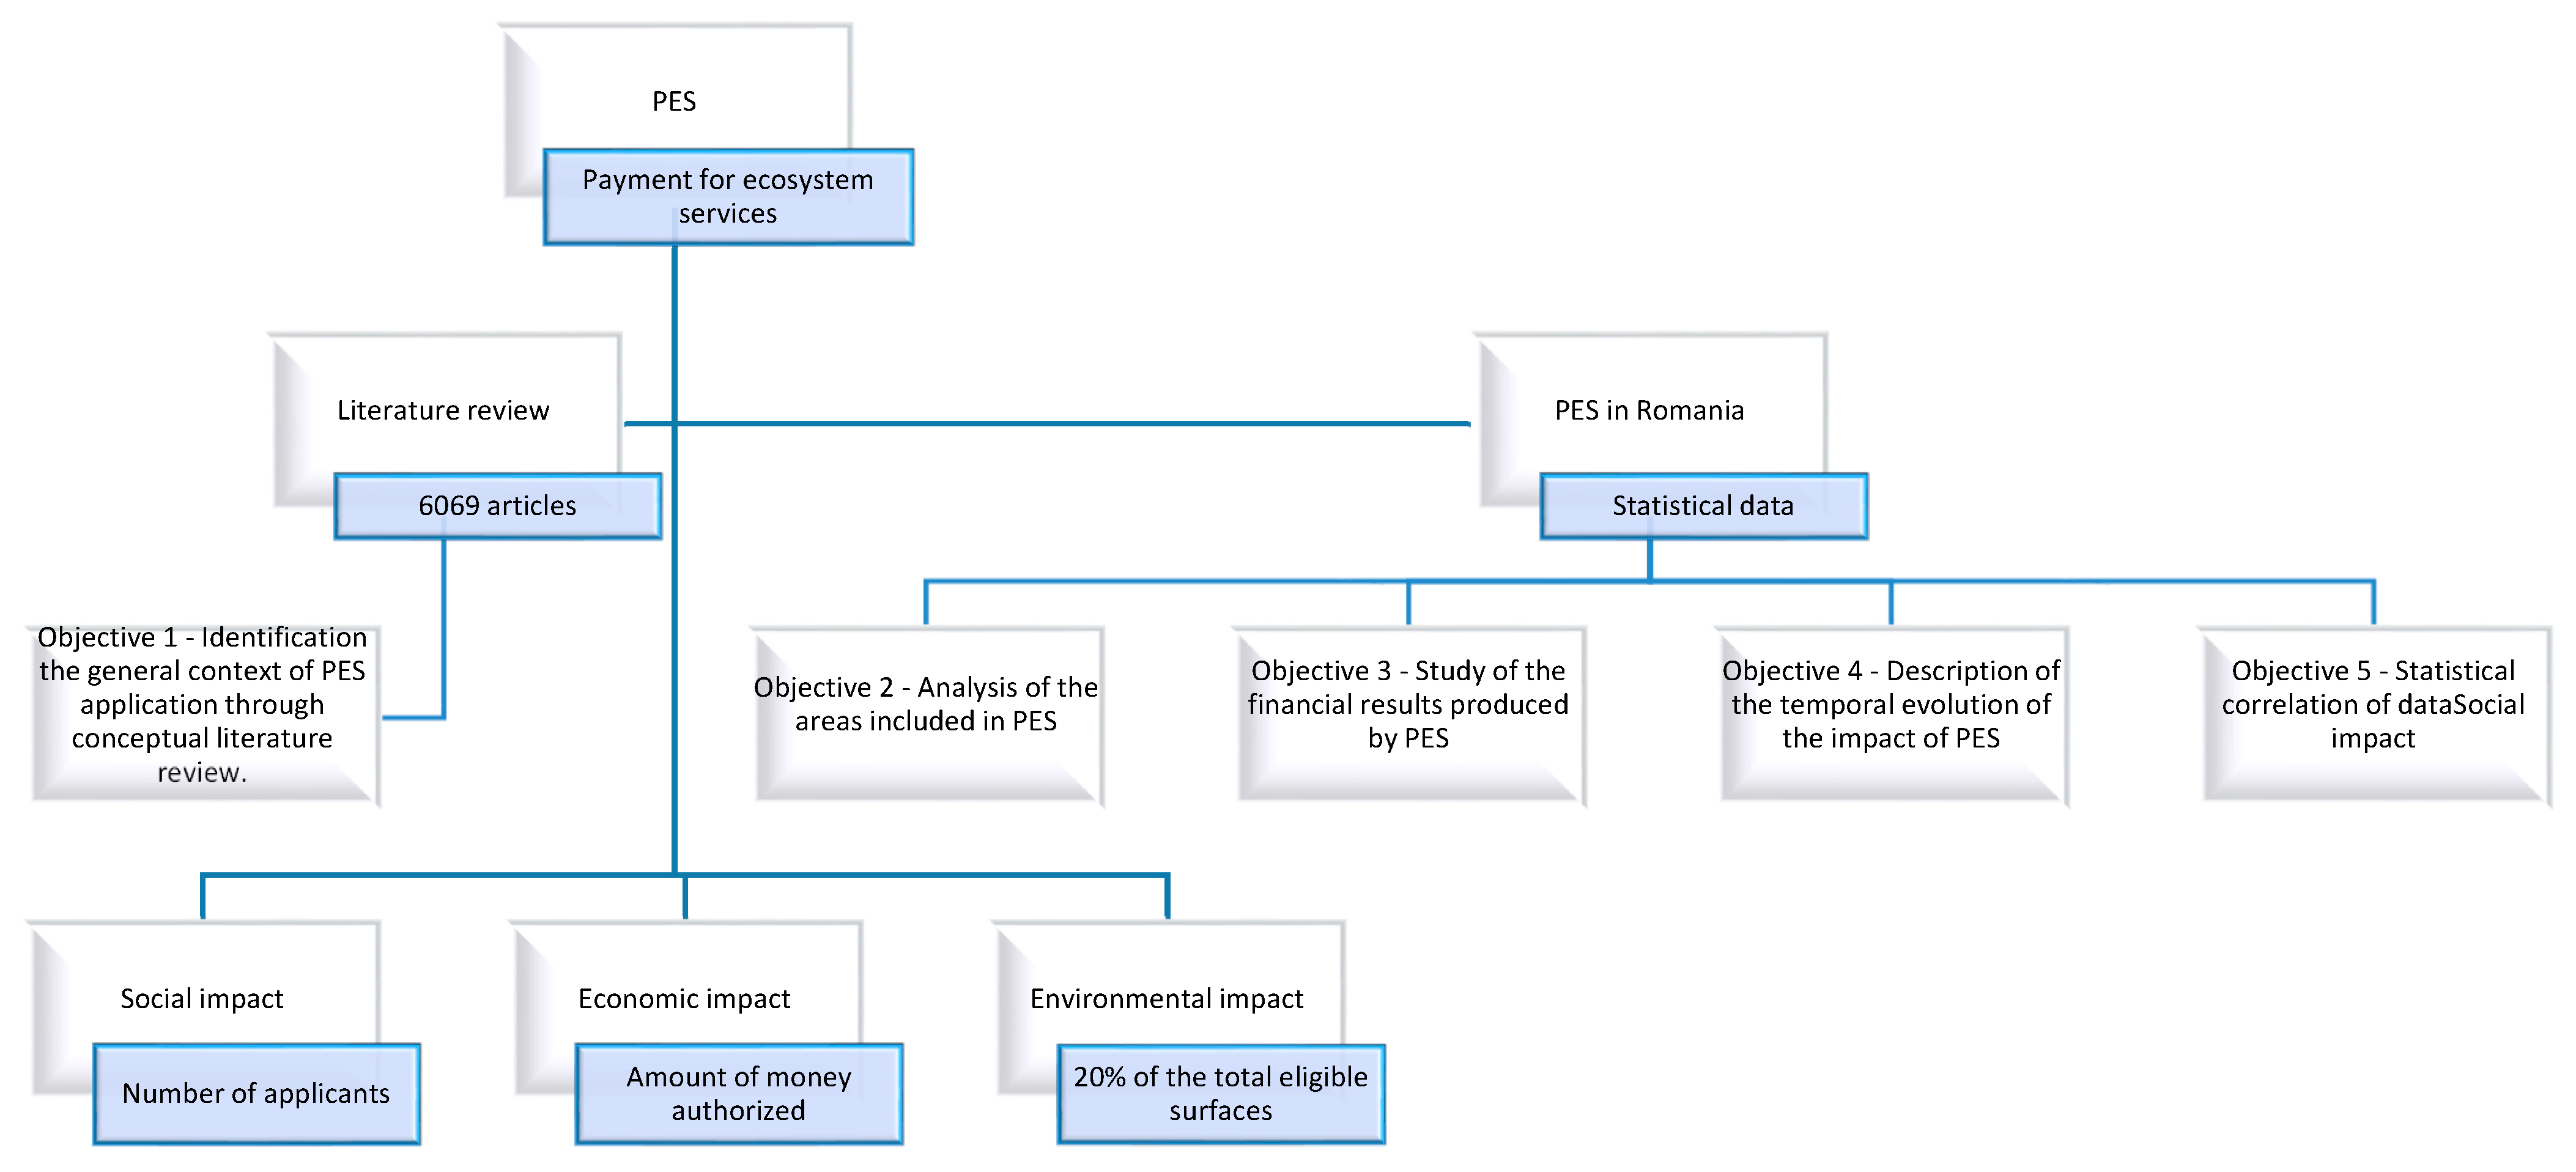
Figure 1 shows the graphic abstract of the paper, as well as the steps taken in the research.
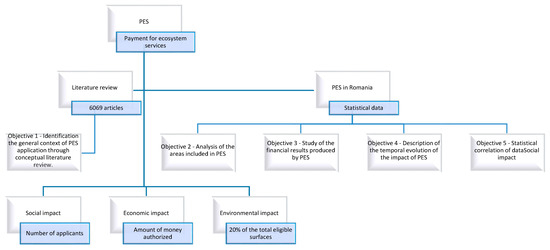
Figure 1.
Graphical abstract of the paper.
1.2. Literature Review
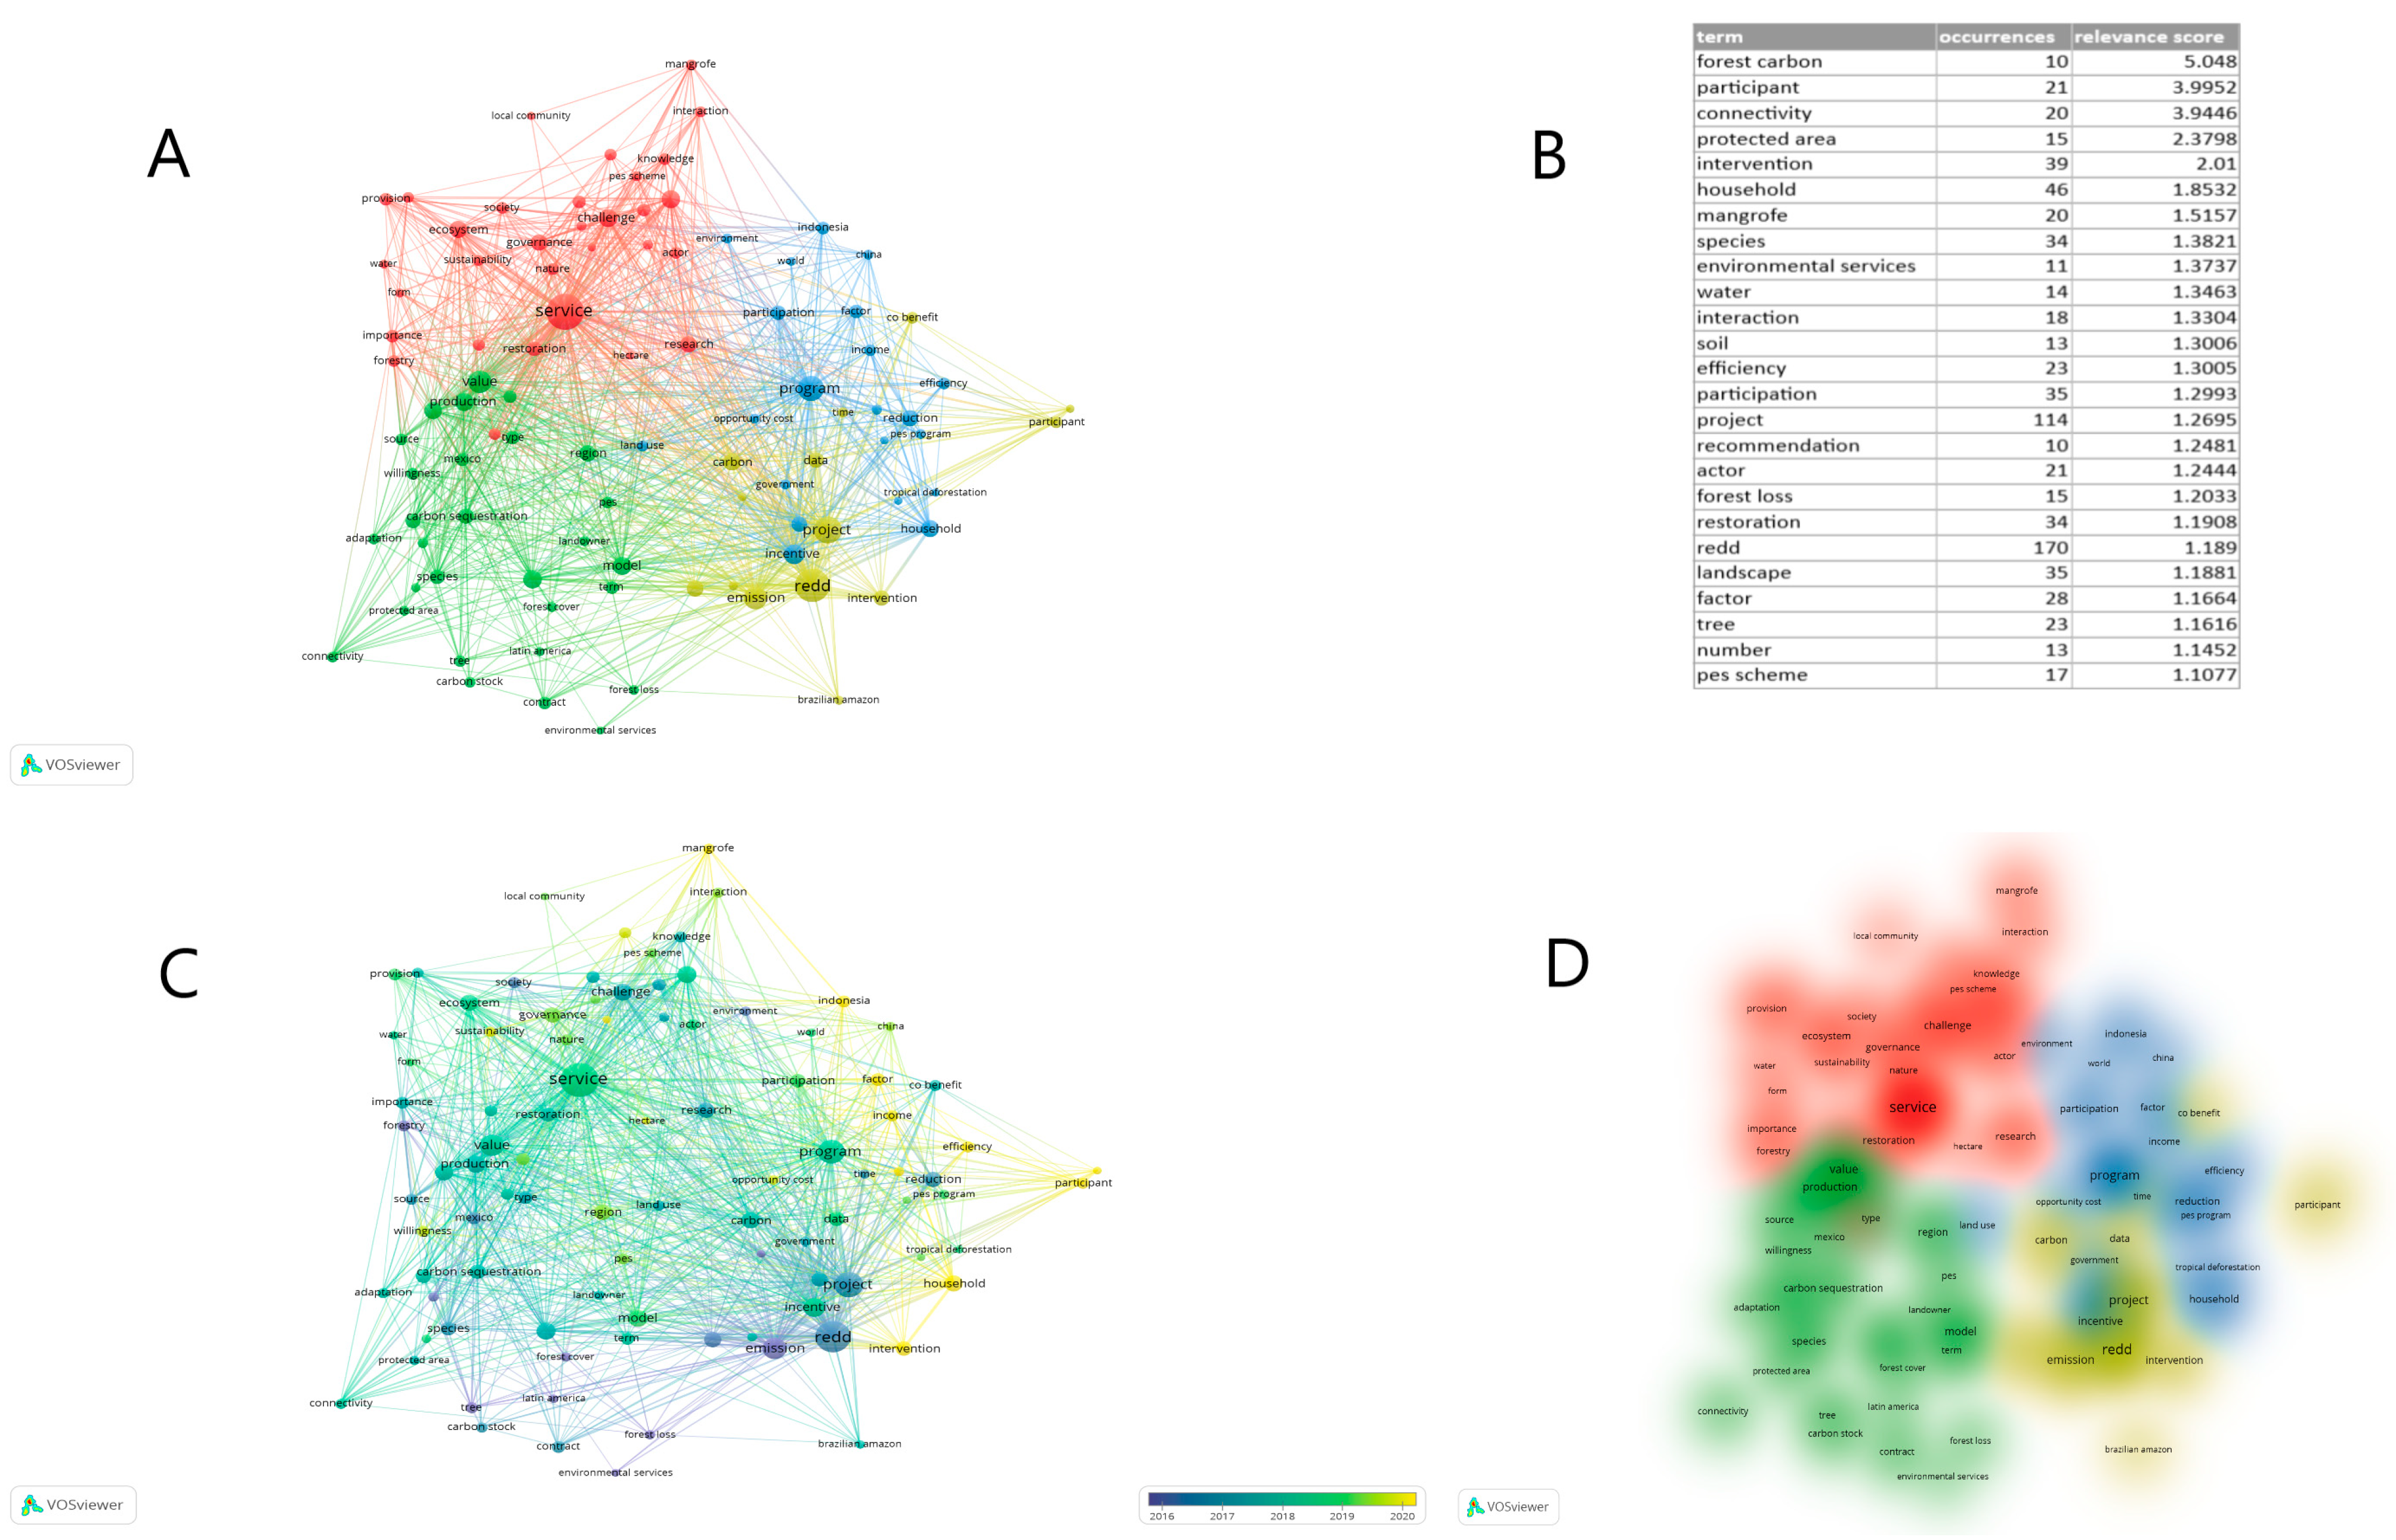
To analyze the topic “Subsidies for silvo-environmental services, climate services, and forest conservation”, a search was conducted in the Web of Science that returned a total of 79 articles. The search for each individual topic—payments for environmental services, payments for climate services, and payments for forest conservation—returned a total of 6069 articles. Both the general topic and the individual subjects were analyzed using VOSviewer, a useful tool for visualizing, organizing and analyzing specialized literature [27,28,29,30,31,32,33]. The latest versions of the tool offer text mining functionalities, allowing for the construction and visualization of networks of co-occurrence of terms or specific themes in the scientific literature of one or more fields [27,32,33]. A bibliometric analysis was conducted using the VOSviewer version 1.6.18 software tool, which is “a freely available computer program developed for constructing and viewing bibliometric maps”. VOSviewer is increasingly being utilized, either independently or in conjunction with other tools, by researchers in the fields of business and management to conduct systematic reviews [28,29,30].
The search for the article subject “Payments for environmental services, climate services and forest conservation” in the WoS returned 190 articles, written between 2000 and 2024, of which 62% were authored in countries that are part of the European Union (92 articles). Analyzing the articles with VOSviewer (Figure 2), four clusters were identified, organized around four key terms: service, program, REDD and value.

Figure 2.
Analysis of the topic “Payments for environmental services, climate services and forest conservation”. (A) VOSviewer visualization map of co-occurrence keywords. (B) Relevance of keywords. (C) Timeline view of clusters of co-cited references. (D) Cluster density visualization.
The four clusters visible in Figure 2A describe four areas of focus for the topic “Payments for environmental services, climate services and forest conservation”: red cluster—service, challenge, ecosystem, forestry, governance, framework, sustainability; green cluster—value, production, environmental service, model, species, carbon sequestration; blue cluster—program, household, incentive, reduction, participation, factor; yellow cluster—REDD, emission, project, carbon. The table in Figure 2B presents the terms with the highest relevance scores: forest carbon, participant, connectivity, protected area, intervention, household, mangrove, species, environmental services, water, interaction. In Figure 2C, it is observed that, on the temporal axis, subsidies began in 2016 with a general theoretical framework—with REDD, emission, forestry, and forest cover—and then continued with the green area in 2018—with services, value, and production—delving deeper into the significance of these services, followed by the establishment of their impact in 2020, as shown in the yellow area, through income, household, efficiency, and factor. Figure 2D illustrates the areas with the highest density of clusters: service, value, production, program, project and REDD.
Following the analysis of scientific articles from Web of Science using two applications, VOSviewer and CiteSpace, it was observed that, alongside the existing legislative framework at both the European Union and national levels [11,13,18,34,35,36,37,38,39]—which outline the goals and objectives related to climate and environmental issues, the beneficiaries, and the legislative context—the research direction over the past 7 years presents a much broader spectrum of the implications of subsidies, encompassing economic, political, social, legislative, and environmental aspects.
At the economic level, the subsidies provided support for the beneficiaries (forest owners and managers); however, the costs associated with forest conservation have a negative impact on the economic agents in those areas [40,41,42], as well as on the labor market [43,44,45]. Some argue that financial transfers supporting “carbon cultivation” neglect social concerns and fail to consider the full spectrum of goods and services provided by forests [46].
There are spatial synergies between existing policies, such as national parks and the payment scheme, and the conservation of ecosystem services [47]; national parks and areas receiving payments offer more services compared to other regions [48]. Accurate cost information is crucial for evaluating trade-offs in land management choices, which is essential for enhancing the effectiveness of forest conservation policies and market mechanisms. The choice of evaluation method can significantly influence the valuation estimates of the costs related to forest conservation, especially for heterogeneous rural households in underdeveloped markets. Empirical evidence indicates a disparity between market prices and contingent valuation estimates concerning the costs of local forest access restrictions. This evidence is derived from household surveys employing quantitative evaluation methods [41,49]. Additionally, it is crucial to anticipate potential changes in ecosystem services and biodiversity that may result from the climate adaptation behaviors of forest owners. Focusing on maximizing carbon sequestration might not always align with the habitat needs of species [41,50], particularly in dominant Douglas-fir forests, and could encourage more hardwood logging on private forest lands [51]. There are complex interactions between factors, such as the rate of disease spread and its impact on the value of both harvested timber and non-timber benefits. The presence of the disease influences the optimal rotation period for a single-age, single-rotation forest. When private forest owners receive payments for timber benefits to partially account for the social values of forest management, the disease affects both the production and growth of the forest [52].
At the social level, empowering farmers to understand environmental strategies is essential. The introduced measures support the beneficiaries’ potential for self-fulfillment by accepting restrictions and receiving financial compensation [53]. Additionally, the migration of populations from rural to urban areas has led to the abandonment of farms and agricultural lands. This phenomenon has resulted in spontaneous forest expansion and an increase in forested areas [54]. Social equity and poverty reduction are additional effects produced by environmental subsidies [50,51,55,56,57]. A vicious cycle exists where poverty leads to increased environmental destruction, which in turn exacerbates poverty. Education is crucial in breaking this cycle, as it helps individuals and communities access funding and resources necessary for sustainable development and environmental conservation. The analysis of influencing factors reveals that attitudes, behavioral control and awareness are significant determinants in the effective acquisition and utilization of environmental subsidies [58]. Perceived knowledge about forests has the most positive and significant impact on individuals’ willingness to apply for subsidies. This indicates that greater awareness and understanding of forest-related issues encourage more people to seek financial support for forest conservation and management activities [59]. While enhancing technical capacities can help overcome some learning limitations, other challenges, particularly those stemming from ideological thinking and institutional imperatives, are more difficult to address. These deeper, more ingrained issues often require substantial cultural or structural changes to overcome [60,61,62].
Payment for Ecosystem Services (PES) programs are often used as a tool to reduce deforestation and forest degradation [63,64,65,66], with major environmental impacts. Subsidies for forest environments and the climate become effective tools for forest protection either directly, by changing forest management, or indirectly, by increasing biodiversity. Action–result hybrids are frequently recommendable. Agri-environmental PES have piloted results-based/hybrid schemes in Europe [67], which have led to an increase in tree species diversity, structural diversity and uneven-aged forestry [68].
PES can help maintain sustainable forest management and simultaneously protect forests. Sustainable forest management means using forests and forest land in a way—and at a rate—that maintains their biodiversity, productivity, regeneration capacity, vitality and their potential to fulfill—now and in the future—relevant ecological, economic and social functions—at local, national, and global levels—and that does not cause damage to other ecosystems [10].
1.3. Definition of Key Concepts
Measure 15—Forest-Environmental Services, Climate Services, and Forest Conservation.
Programs for Payment For Ecosystem Services are being increasingly adopted worldwide to improve sustainability outcomes [69]. Sustainability is a concept applied across various fields, referring to development that meets present needs while ensuring that future generations can also meet their own needs [10,70,71,72].
The management of ecosystem services provided by forests is carried out through functional zoning, which categorizes forests into specific functional groups. As per the Romanian Forestry Code, forests are classified into two functional groups based on their main functions: group I consists of forests with special protection functions, while group II includes forests that have both production and protection functions. Within the total area of the National Forest Fund (FFN), forests with special protection functions constitute 53.3%, whereas those with production and protection functions make up 46.7% [37].
In Romania, the Rural Investment Financing Agency (AFIR) is the public institution under the Ministry of Agriculture and Rural Development, which ensures the technical and financial implementation of the European Agricultural Fund for Rural Development (FEADR), as well as the Special Accession Program for Agriculture and Rural Development (SAPARD). The Agency for Payments and Intervention in Agriculture (APIA) is the governmental agency operating under the Ministry of Agriculture and Rural Development, through which European funds are allocated for implementing support measures financed by the European Agricultural Guarantee Fund (EAGF), as well as specific measures 211, 212, 214, 215 and 611.
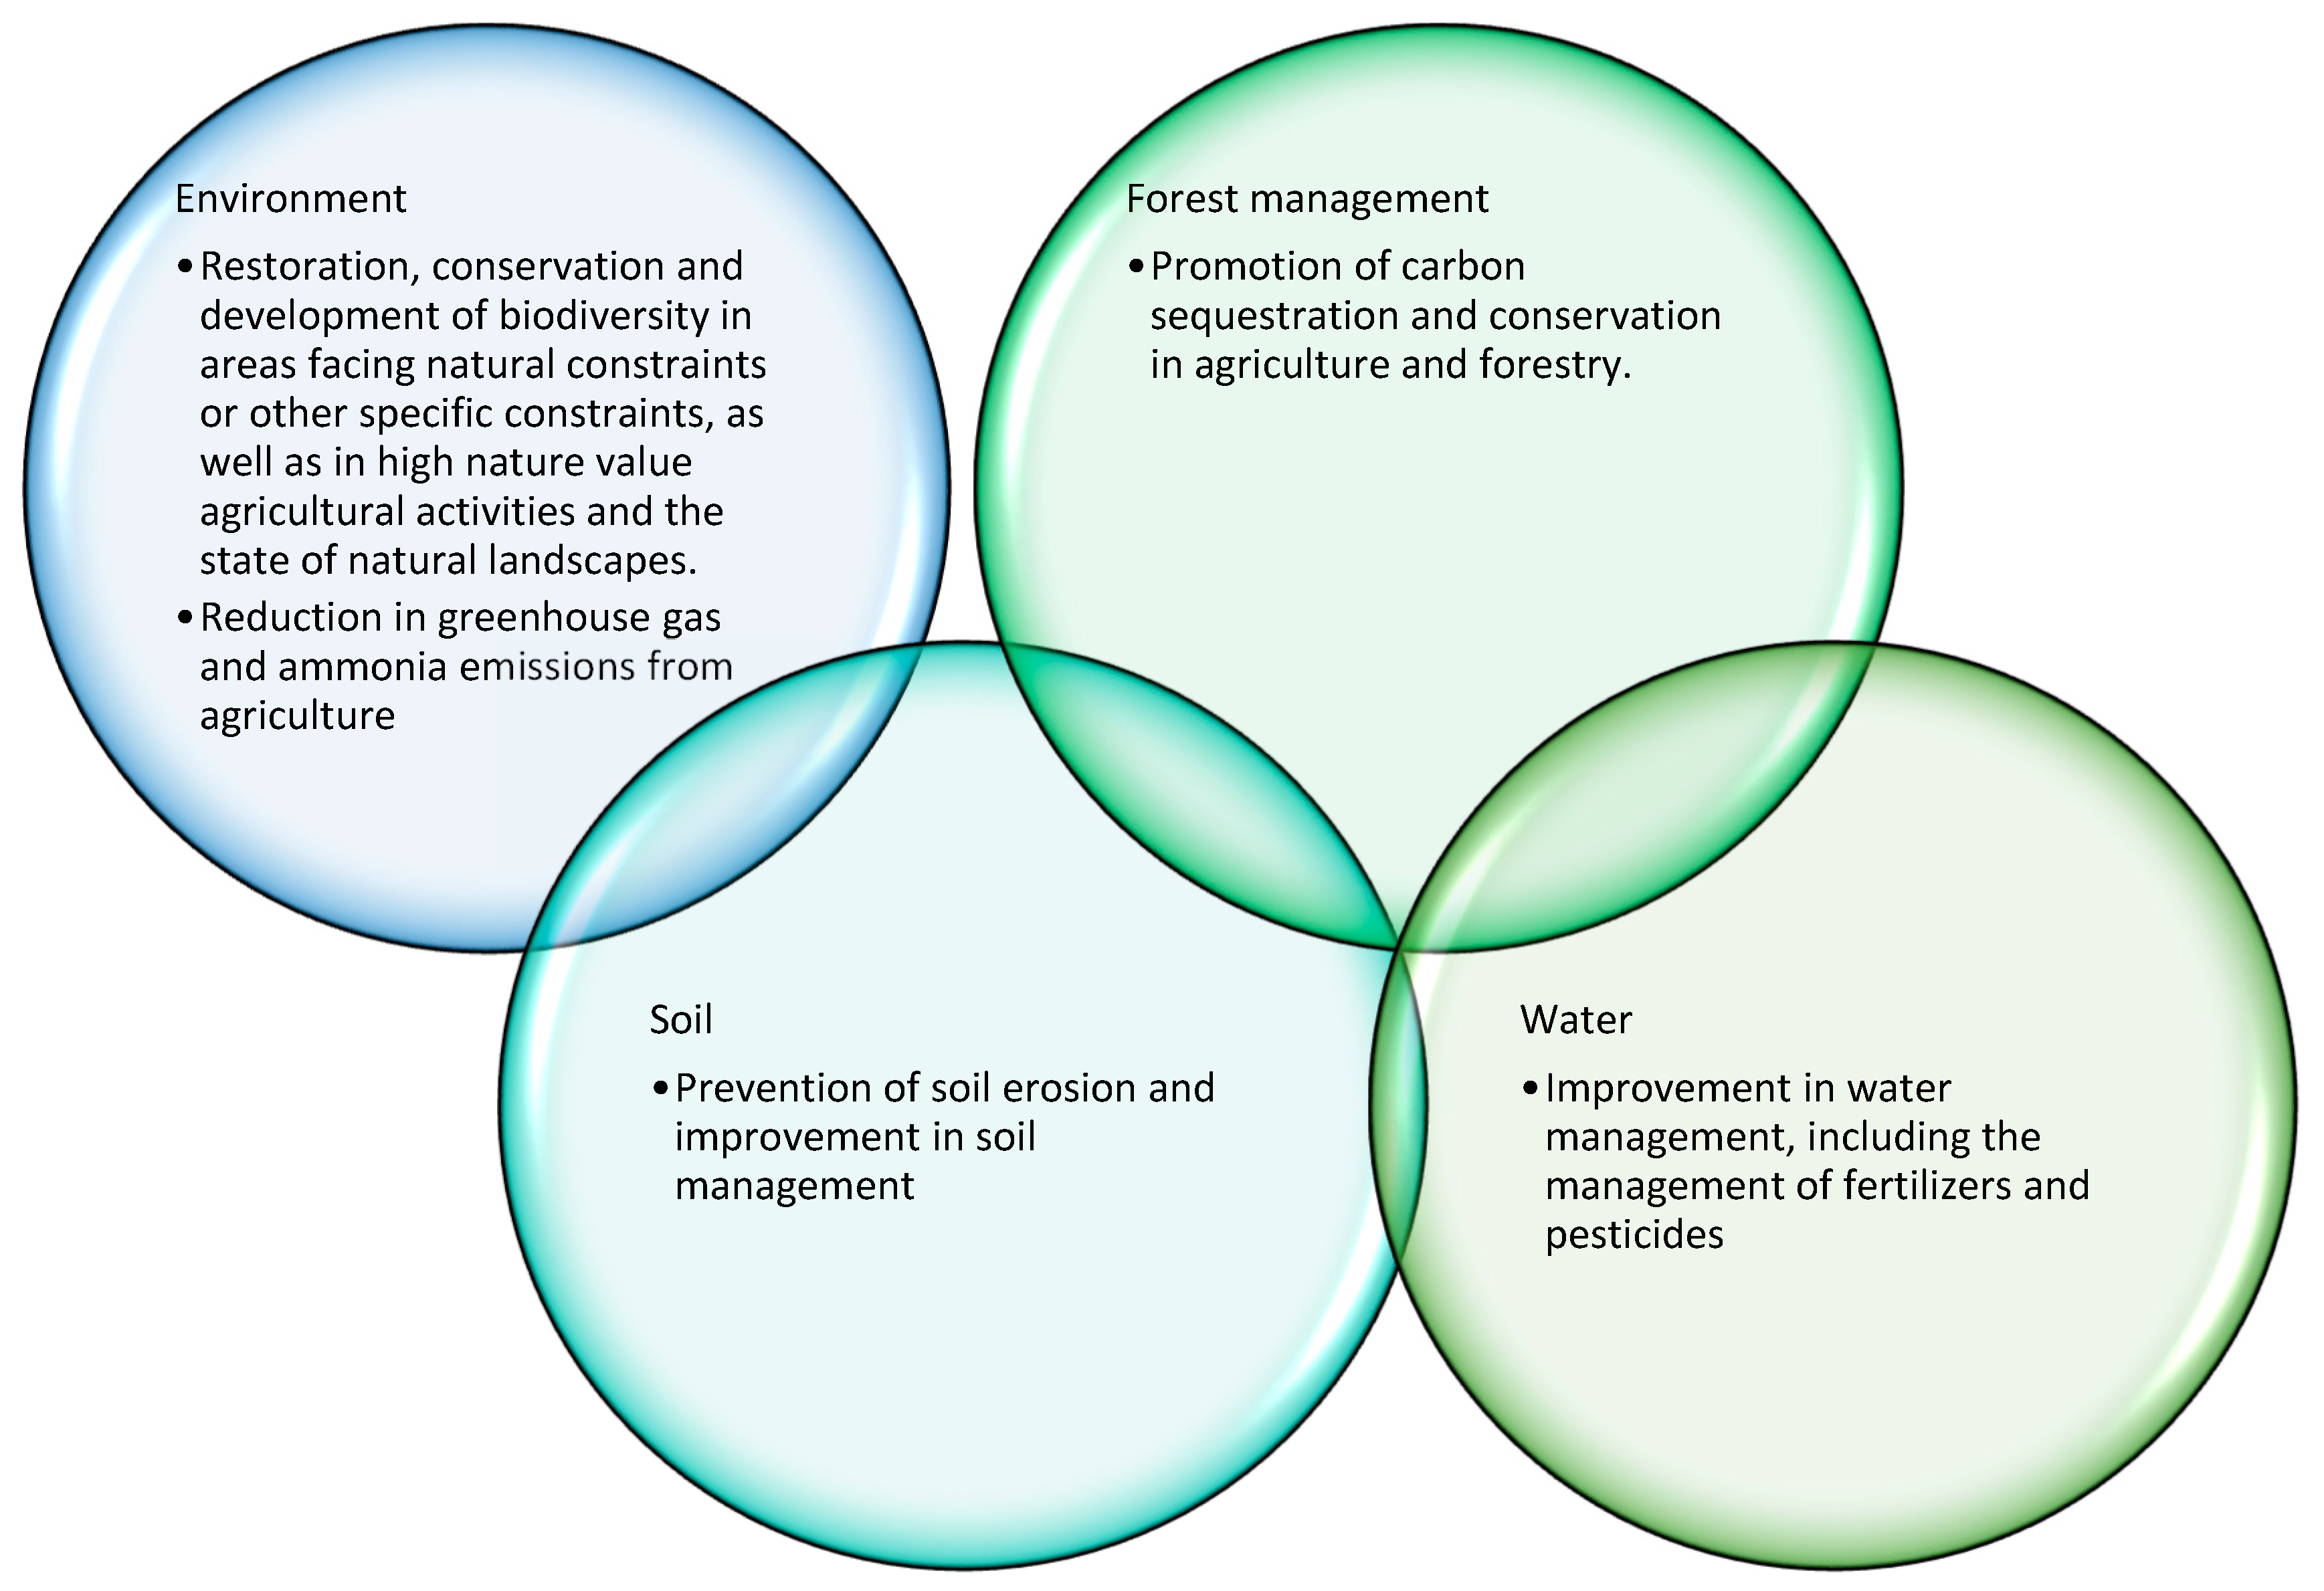
The funding for Measure 15—Forest-Environmental Services, Climate Services, and Forest Conservation—with sub-measure 15.1—Payments for Forest-Environmental Commitments, which is implemented through APIA—was provided by the National Rural Development Program (PNDR) 2014–2020. This program was approved by the European Commission through Decision C (2015) 3508/26.05.2015, intended to promote a balance between economic growth and the sustainable utilization of natural resources. The support provided through the measure for Forest-Environmental Services, Climate Services, and Forest Conservation aims to complement biodiversity conservation efforts and protect soil resources on forest lands within the National Forest Fund (FFN). This is implemented through the existing regulatory framework for forest management in Romania by encouraging voluntary commitments that enhance sustainable forest land management. Additionally, it contributes to biodiversity conservation and enhancement, soil erosion reduction, and climate change mitigation efforts [37]. The principle underlying sub-measure 15.1 “Payments for Forest-Environmental Commitments” is the reduction in the number of silvicultural interventions in forests and the promotion of wood exploitation technologies with reduced impact on the soil (low-impact forestry). This is accomplished by promoting voluntary commitments that exceed the mandatory requirements set by national forestry management legislation [18,35]. Sub-measure 15.1 (Table 1) falls under intervention areas 4A—Restoration, conservation, and development of biodiversity, including in Natura 2000 areas, areas facing natural or other specific constraints, and in high nature value farming activities, as well as the state of European landscapes (DI 4A)—and 4B—Prevention of soil erosion and improvement of soil management (DI 4B). It contributes to achieving the European Union’s rural development objectives related to these intervention areas [39].

Table 1.
The purpose and objectives of sub-measure 15.1 [73].
The support provided under this scheme is compensatory, granted annually as a fixed amount per hectare. It compensates forest landowners for income losses, additional costs and transaction costs incurred when they undertake voluntary commitments for a period of five years.
Under the scheme, two types of commitments are compensated, with their specific requirements categorized into the following two packages: Package 1, Provision of Quiet Zones, and Package 2, Use of Draught Animals for Timber Extraction from Thinnings (Package 2 can only be implemented in conjunction with Package 1). The level of non-repayable public support provided through this scheme is set at 100% [18,35].
The area eligible for the scheme must be included in an active forest management plan. The scheme is applicable to forest lands, except for those classified as functional type I (T I). According to Order 766/2018, Classification of forests into groups, subgroups and functional categories, Group I contains forests with special protection functions, and the functional type T I includes junipers, groves included in natural or scientific reserves, groves declared monuments of nature, groves from virgin and quasi-virgin forests, stands in national and natural parks included—through management plans—in a strictly or fully protected area, and stands in biosphere reserves included in a strictly protected area. Usually, this type of forest is classified as a natural protected area, and forestry works are prohibited [74]. However, areas designated for afforestation or reforestation must not exceed 15% of the total committed area. The minimum area required for making a commitment is 100 hectares [36].
Thus, through Package 1, Provision of Quiet Zones under DI 4A, the primary objective is to create optimal conditions for shelter, nesting and feeding, thereby supporting the growth of unique fauna within forest ecosystems. Additionally, by leaving dead wood (dry but standing trees) in the forest to decompose naturally, rather than utilizing it economically, the aim is to preserve a diverse range of xylophagous insects (wood-feeding insects). This strategy will contribute to maintaining a consistent population of insectivorous birds within the forest. Additionally, by maintaining a higher stand density, the forest’s capacity to reduce greenhouse gas concentrations through carbon sequestration and its ability to adapt to the effects of climate change will be enhanced. This also increases the forest’s capacity to retain surface runoff, particularly in the event of floods.
As a mandatory requirement, each forest owner must have a written forest management plan prepared by a professional forester and must have entered into a management contract with an authorized forestry entity. Additionally, each owner voluntarily commits to include the entire area they own within a production unit. The minimum required area is 100 hectares. Each applicant must then provide a “quiet zone” of at least 20% of the total area they register, within which no silvicultural activities aimed at timber harvesting are permitted. Only afforestation, ecological restoration and the care of young forests, including thinning and cleaning operations, may be carried out in these areas. In accordance with national legislation, it is mandatory to ensure adequate phytosanitary conditions in the “quiet zones,” with trees affected by wind or snow breakage and uprooting, classified as accidental products, being obligatorily extracted. On the remaining areas that are not part of the “quiet zone,” all activities outlined in the forest management plan are permitted, provided that each management unit is only intervened in once.
The intensity of the non-reimbursable public support granted under this scheme is 100%. The compensatory payment values are as follows: EUR 38 per year per hectare for the area committed under Package 1 and EUR 137 per year per hectare for the area annually requesting support under Package 2. For areas ranging between 100 hectares and 500 hectares (inclusive), financial support is provided at 100% of the compensatory payment value. For areas larger than 500 hectares, a degressive financial support scheme applies, with payment levels adjusted as follows: 85% of the compensatory payment value for areas between 500.01 hectares and 1000 hectares; 65% of the compensatory payment value for areas between 1000.01 hectares and 5000 hectares; and 50% of the compensatory payment value for areas exceeding 5000 hectares. Degressively applies to committed areas larger than 500 hectares for both packages [39].
In Package 1, income losses refer to the volume of wood from sanitation products that is not harvested over a period of five years in the quiet zone and four years in the rest of the committed area of management units where thinning and sanitation cutting operations are planned. Additionally, it includes the volume of products from conservation cuts over a five-year period across the entire committed area designated for such operations.
In Package 2, extra costs arising from using draught animals instead of machinery for thinning operations are compensated. Additionally, the biodiversity conservation measures supported through sub-measure 15.1 contribute to the objectives of Natura 2000 areas that overlap with the committed zones. Notably, around 38.6% of the National Forest Fund is part of the Natura 2000 protected areas network [75,76].
In the same state aid measure, through Package 2—Use of Draught Animals for Thinning Operations under DI 4B, the aim is to protect forest soil resources by promoting extensive, low-impact timber extraction technologies, specifically the use of draught animals for thinning operations, as opposed to mechanized methods, which are currently widely applied. The specificity of this requirement is that the collection operations must include at least the gathering operation and either the extraction or forwarding operation, or both. The eligible collection distance for support must be between 100 m and a maximum of 2000 m, as specified in the Timber Harvesting Operation Documents. The collection distance is calculated graphically as the arithmetic mean of the shortest and longest collection distances from a management unit to the primary platform of the harvesting site (the loading ramp for timber). Draught animals will be used on the condition that the average volume of timber collected does not exceed 0.3 cubic meters. An important aspect concerns the eligibility of interested parties. This state aid scheme targets all forest owners other than the state, who have a valid forest management plan, with a minimum area requirement of 100 hectares. This includes local public administration, individuals and legal entities, owner associations, and religious institutions. The total eligible area is approximately 52% of the total forested area, which amounts to 3.436 M hectares.
This measure, which primarily benefits biodiversity and soil components, addresses the need to maintain biological diversity and the environmental value of forested lands. It supports efficient and sustainable forest management while also protecting and enhancing soil resources, as illustrated in Figure 3.
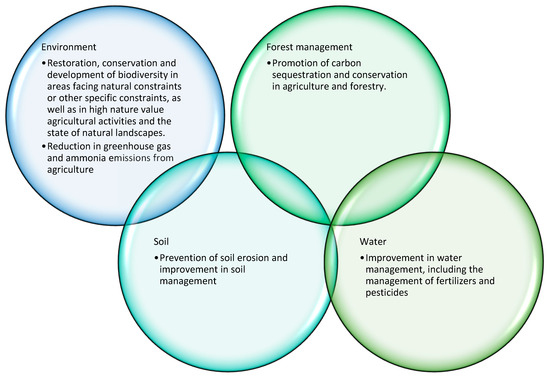
Figure 3.
The effects of sub-measure 15.1 [37].
2. Materials and Methods
2.1. Study Area
This study considered forest areas privately or publicly owned in Romania, a country located in southeast central Europe, situated in the northern part of the Balkan Peninsula, along the lower course of the Danube River, and on the northeastern shore of the Black Sea (Figure 4) [38].
There is an uneven distribution of forested areas relative to the relief conditions. It can be observed that in the mountainous region, forests are most prominently represented, covering 59.1% of the area. In the hilly region, forested areas account for 34.2%, while in the plains, forests represent only 6.7% [74]. The significant differences in the distribution across major landforms are due, on the one hand, to agricultural practices historically requiring large flat areas and, on the other hand, to the road network, which makes access to timber resources in the mountainous region challenging.
Moreover, in terms of ownership, out of the total of 6,613 M hectares of forested area, 48.1% are in the public ownership of the state, 16.1% are public property of local administrations, 1.5% are private property of local administrations, and 34.3% are private properties (including religious institutions, individuals or legal entities, and owner associations) [77].
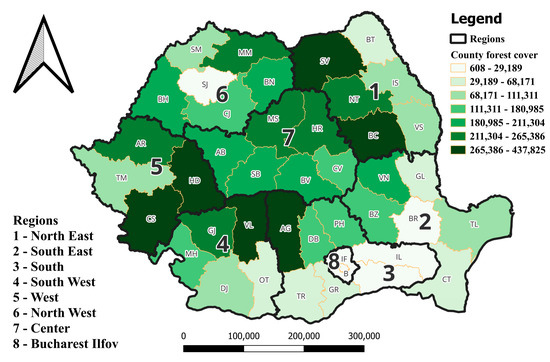
Figure 4.
Study area includes 6,6 M Ha of forest-land [78].
Figure 4.
Study area includes 6,6 M Ha of forest-land [78].

2.2. Survey Design and Data Collection
The study design focused on the data collected by the authority responsible for implementing Measure 15. After submission of applications for voluntary participation in the ongoing program, APIA processed the files and collected the information. In accordance with open access to public data, the authors of the study requested that these data be provided to them in an electronic, editable format.
Data related to the implementation of the state aid scheme were requested, in compliance with GDPR, concerning the region, type of forest ownership, form of organization, application submission session, number of parcels, area, authorized amount and any penalties imposed. This study does not include personal data or any information related to individuals.
The data were received in tabular form and subsequently coded to enable processing with specialized statistical software, adhering to the structure outlined in Table 2. The variables were extracted from the database provided by the public authority managing M15. These variables are either numerical (ID, Session, Year, NoPlots, Area_P1, Area_P2, SA, and AA) or categorical (County, Region, FORG). AA (Authorized_Amount) was chosen as the response variable, while the other variables were considered independent variables.
Table 2.
Program attributes and attribute levels used. Database structure.
2.3. Data Analysis
The data analysis was carried out starting from the review of the conceptual literature of the subject, which indicated three clear directions of approach to PES: the social interpretation of the data, through the number of participants; the economic impact, through the amount of money authorized; and the impact on the environment, through analysis of the surfaces and calculation of the minimum 20% of the areas that will not be subjected to forestry interventions.
The data set analyzed included 2,680 records, of which there were 887 unique applicants. Some applicants submitted applications for additional areas in subsequent sessions (social impact analysis). Initially, the data from the first year of the five-year commitments were examined, as these contain the initial commitment data, unaffected by any subsequent penalties. The analysis primarily investigates the amounts received by each applicant and whether and to what extent these amounts are influenced by other factors.
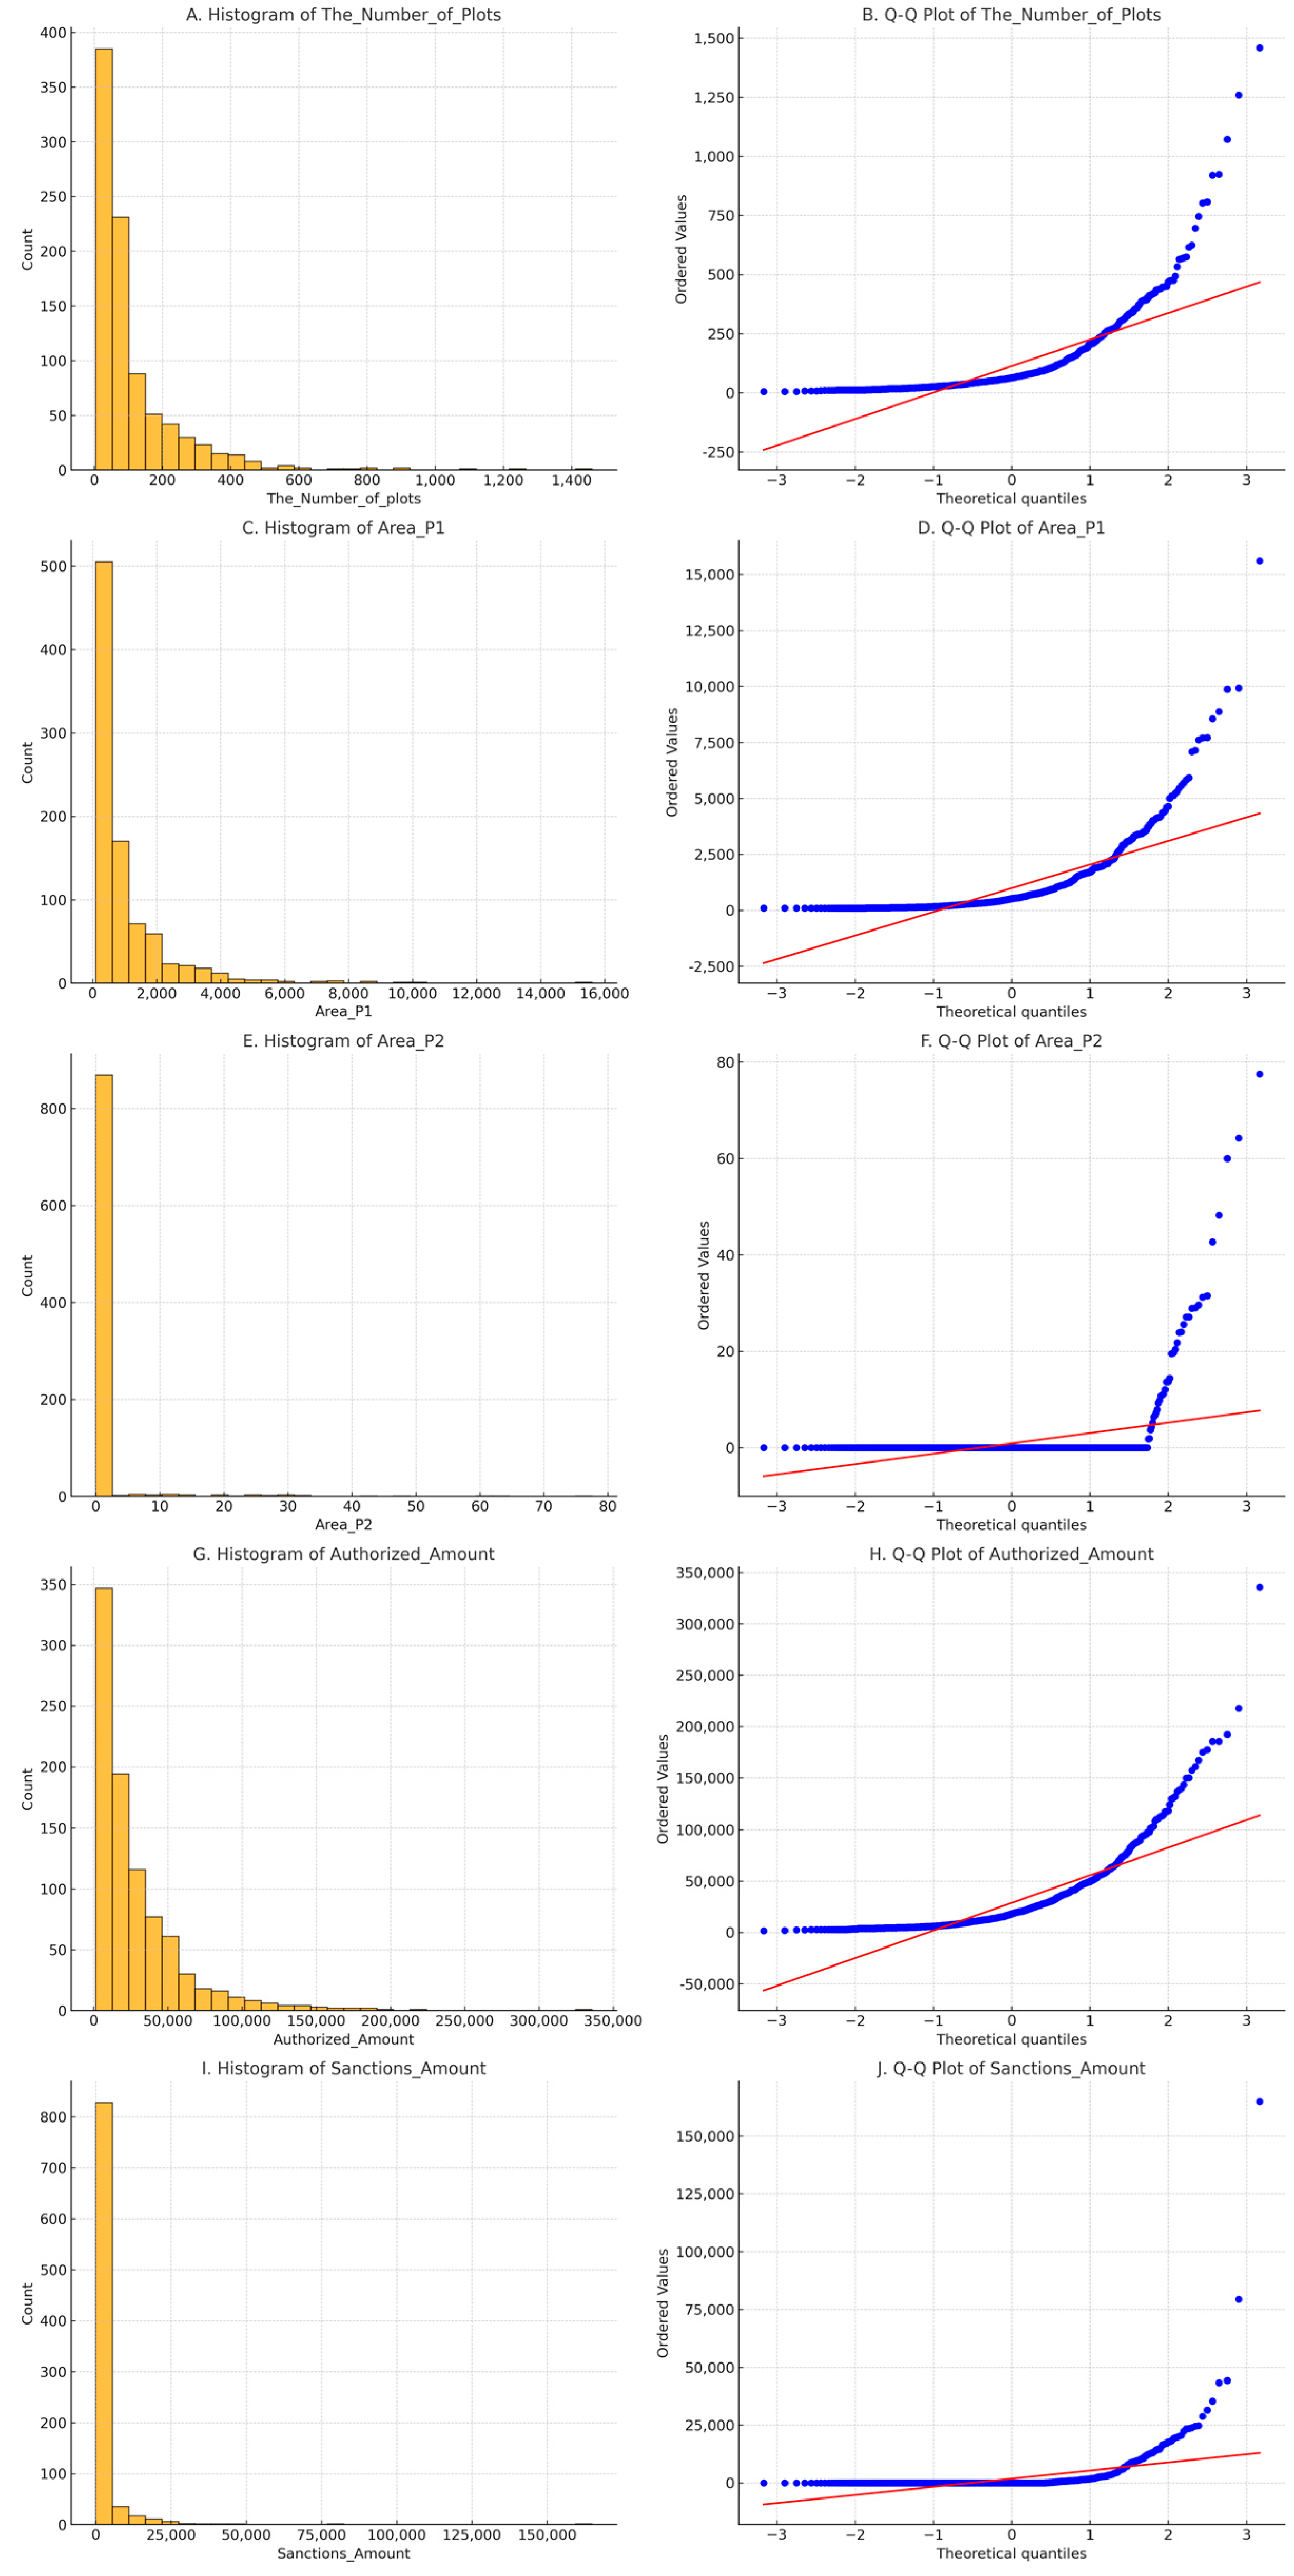
To determine if the payments (Authorized_Amount) followed a normal distribution, the Shapiro–Wilk test was applied (economic impact analysis). The result of the test showed that the p-value is very low (much lower than the common threshold of 0.05), indicating strong evidence against the null hypothesis that the data followed a normal distribution. Graphs were constructed and histograms and Q-Q charts were created for the other data (number of plots, total area, area for parcel 2, authorized amount and penalty amount) (Figure 5).
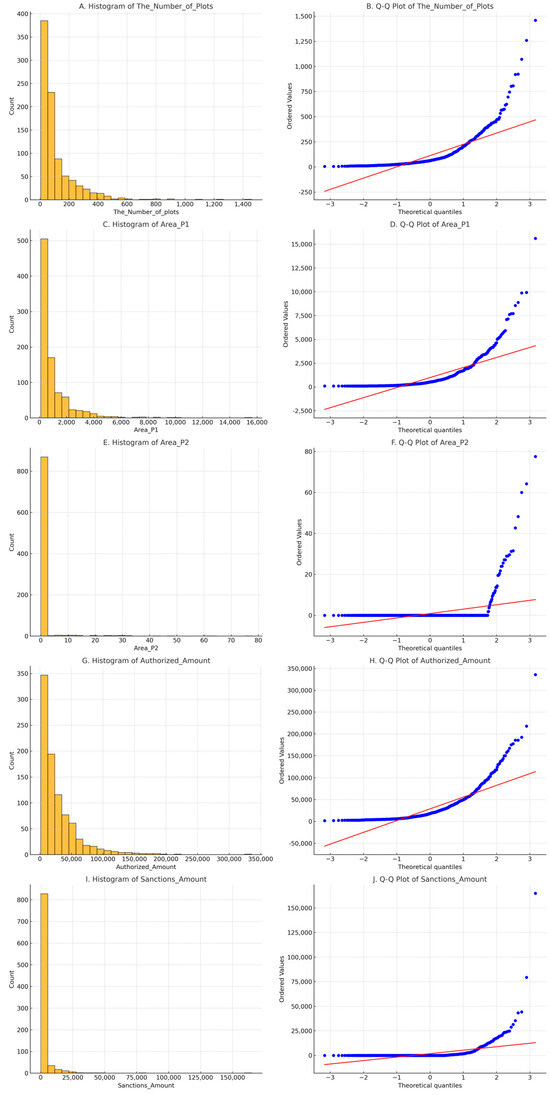
Figure 5.
Histograms and Q-Q plots for all data.
As can be observed, the distribution was strongly skewed; thus, Spearman’s correlation was subsequently applied using IBM SPSS Statistics version 28 [79,80] and RDA (multivariate linear redundancy analysis) was conducted using Canoco 5 software [81]. This statistical method helps in understanding the relationships between multiple response and explanatory variables, often used in ecological and environmental studies [82], in the second stage of the study.
In RDA, the numerical response variable (AA) was influenced by one or more predictors, which can be of various types (explanatory or independent variables) (numerical: Year, Session; numerical/quantitative: total area—Area_P1, Area_P2; or categorical: County, Region, Organization). These predictors were combined into constrained independent ordination axes (orthogonal), typically represented in the first two dimensions of ordination diagrams. These axes explained the greatest variation in the response variable, with their explanatory power decreasing gradually. Within the ordination diagram, the response variable (AA) is shown as an arrow, with the length of the arrow indicating the extent to which the predictor (independent variables) explains the response variable. A longer arrow suggests a stronger explanation. The direction of the arrowhead relative to the axes indicates the degree of dependence of the dependent variable on the constrained axis. In the ordination diagram, categorical predictors are represented by the centroids of their respective data points. The projection of these centroids onto the axes indicates their effect on the response variable. Numerical predictors are depicted as arrows, with their projection onto the axes suggesting their contribution to explaining the response variable. The significance of the ordination axes was assessed using the Monte Carlo permutation test, employing 999 unrestricted permutations per test to ensure robust statistical validation of the results [81]. Regression analysis was used to determine the significance of the responses, allowing for the assessment of relationships between the response variable and the predictors. This analysis helps in identifying significant factors and understanding how they influence the response variable.
In the third stage, a post hoc test was conducted to evaluate the effects of predictors within an RDA, under the same testing conditions.
3. Results
The statistical analysis began with the establishment of statistical indicators for the characteristics of the data set under consideration, based on the premise that AA (authorized amount) represents the dependent variable relative to the other variables.
The statistical indicators (mean, minimum and maximum values, standard deviation, and coefficient of variation) of independent variables that influence the variation in the authorized amount are presented in Table 3.
Table 3.
Statistical indicators of the dependent and independent variables studied.
The existence of a correlation between the authorized payment amount (AA), considered as the dependent variable, and the other variables considered as independent was tested by using Spearman rank correlation (Spearman’s rho), as shown in Table 4.
Table 4.
Coefficient of correlations between AA (authorized amount) and other variables. Only significant (p < 0.05, shown in bold) or marginally significant (0.05 < p < 0.1) results are shown.
By applying multiple regression analysis method with all the EVs as predictors, the results showed a highly significant regression. The test on the first axis results in pseudo-F = 1729, p = 0.001, with the adjusted explained variation being 96.93%.
The tested effects of predictors on the AA (authorize amount) response (dependent) variables are presented in Table 5. The red–orange–gray color code uses a divergent palette. A large number of libraries and tools follow these conventions, including Seaborn and Matplotlib in Python, to create heatmaps.
Table 5.
Test effects (left simple and right conditional effects) of predictors on the AA response (dependent) variables. The color codes are related to the adjusted-p (by FDR—false discovery rate) value significance: red means significant (p < 0.05), orange stands for marginally significant (0.05 < p-adj < 0.1), and black stands for not significant).
Starting with the number of applicants, it is observed that there were 887 applicants. Among them, 871 had concluded a single commitment, 15 had concluded two commitments, and 1 had concluded three commitments.
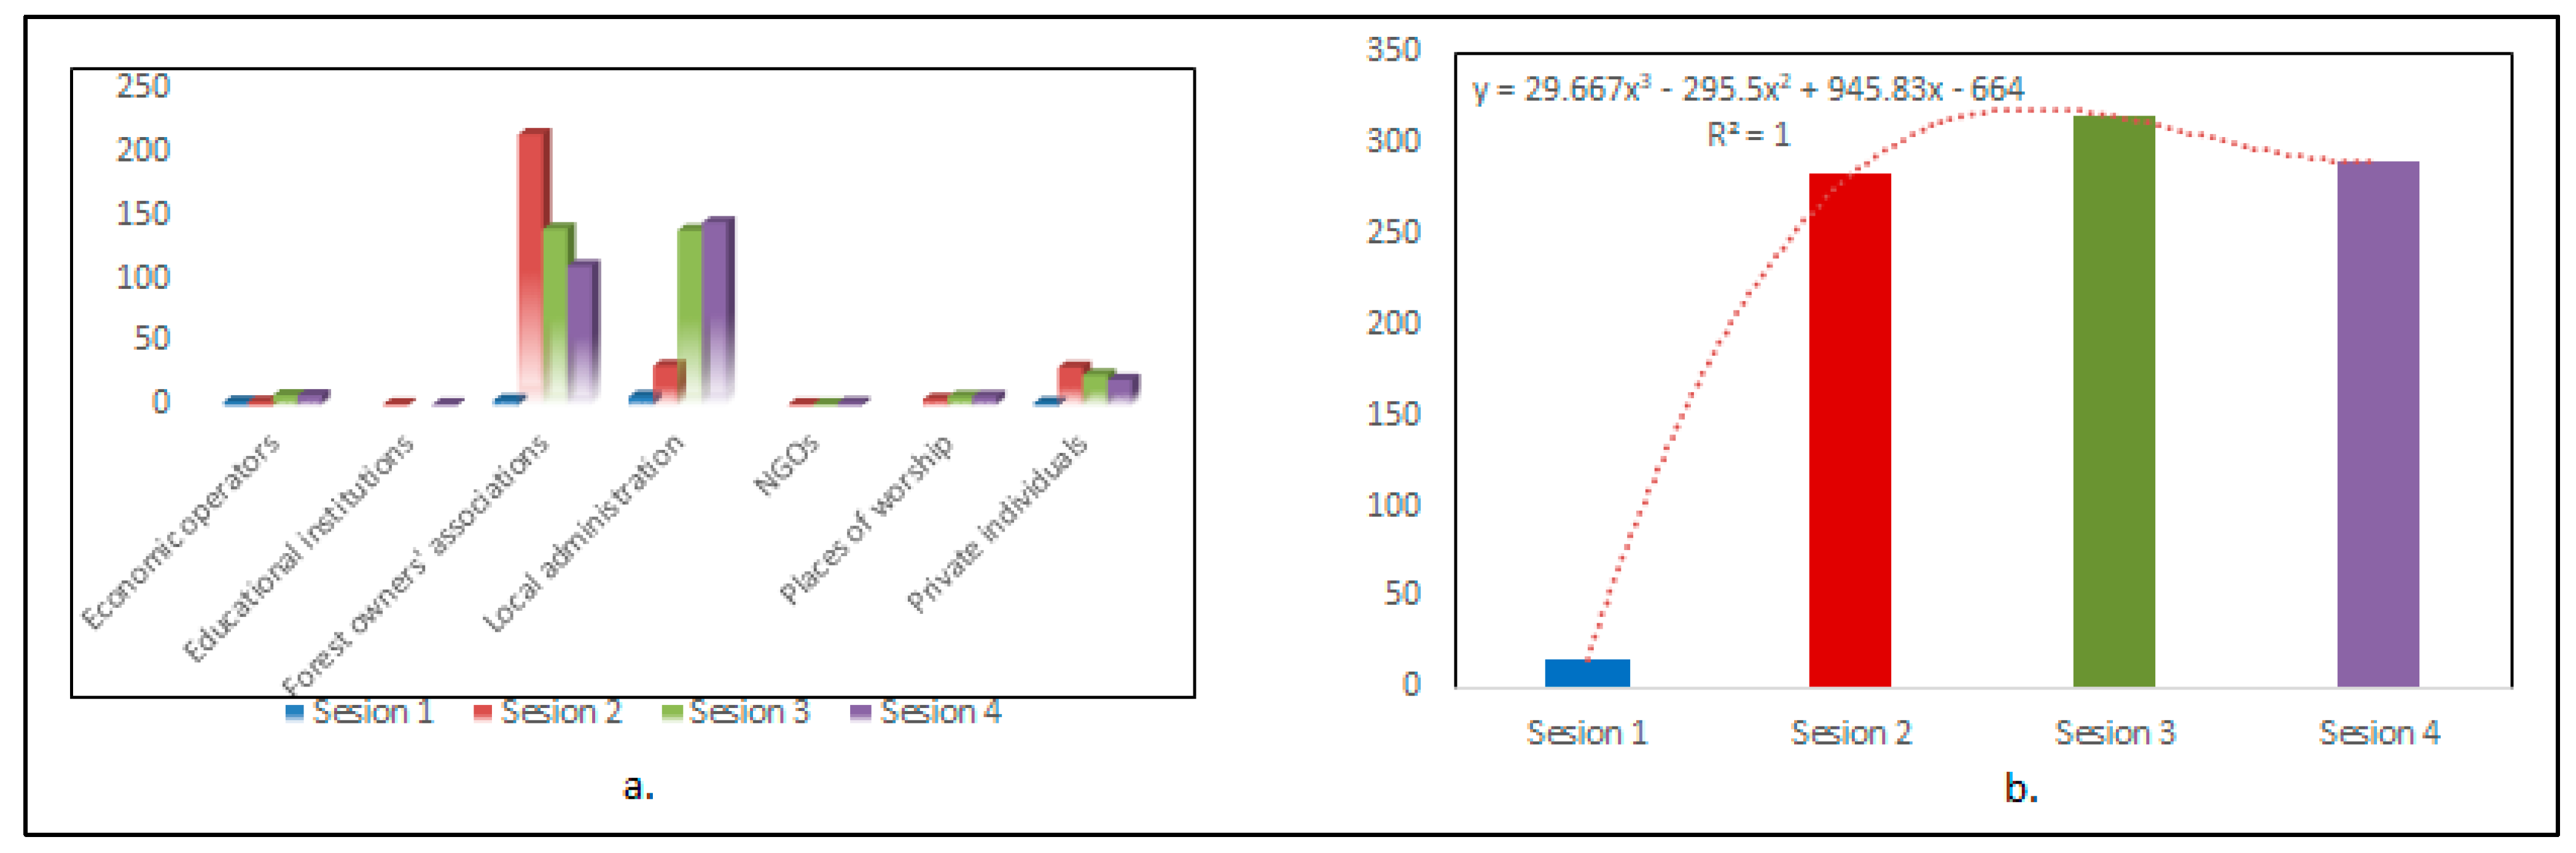
Observing the interest of forest owners in PES, starting with the first application submission session, where there is a strong reluctance towards this type of subsidy, applicants, by forms of organization, have experienced an evolution or regression, as depicted in Figure 6.
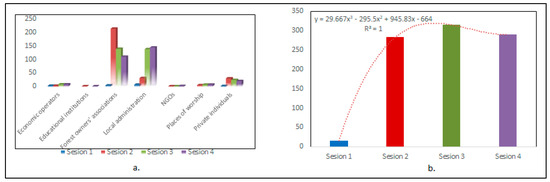
Figure 6.
Time series of applicants: (a) grouped by organizational forms; (b) total applicants.
As observed in Figure 6a, private individuals were very hesitant in session 1, before reaching a peak in session 2, and then the number of applicants began to decline. Church applicants experienced a positive trend, with the number of applicants increasing steadily, while the numbers of NGOs and educational institutions remained consistent. Local administration showed a significant increase in participation, peaking in sessions 3 and 4, respectively. A continuous upward evolution also had economic operators, even if the latter are in very small numbers, while Forest Owners’ Associations had the highest participation, with a peak in session 2 and a subsequent decline in sessions 3 and 4, respectively. It is observed that the largest number of individuals interested in this type of subsidy were the Forest Owners’ Associations, followed by the local administration. Other forms of ownership have shown a lower level of interest. Regarding the applicants’ interest over time (Figure 6b), it can be observed that in the first session, the total number of applicants was extremely low. Subsequently, in the following sessions, interest increased, peaking in session 3. It can be asserted that measures leading to forest conservation and carbon sequestration generate significant interest among forest owners [83,84].
4. Discussion
4.1. The Environmental Impact of PES in Romania
The total area for which voluntary commitments have been made was 0.897 million hectares, representing 26% of the total eligible area. This constitutes a significant portion of the entire eligible area, especially considering that a substantial percentage is located within protected natural areas [17].
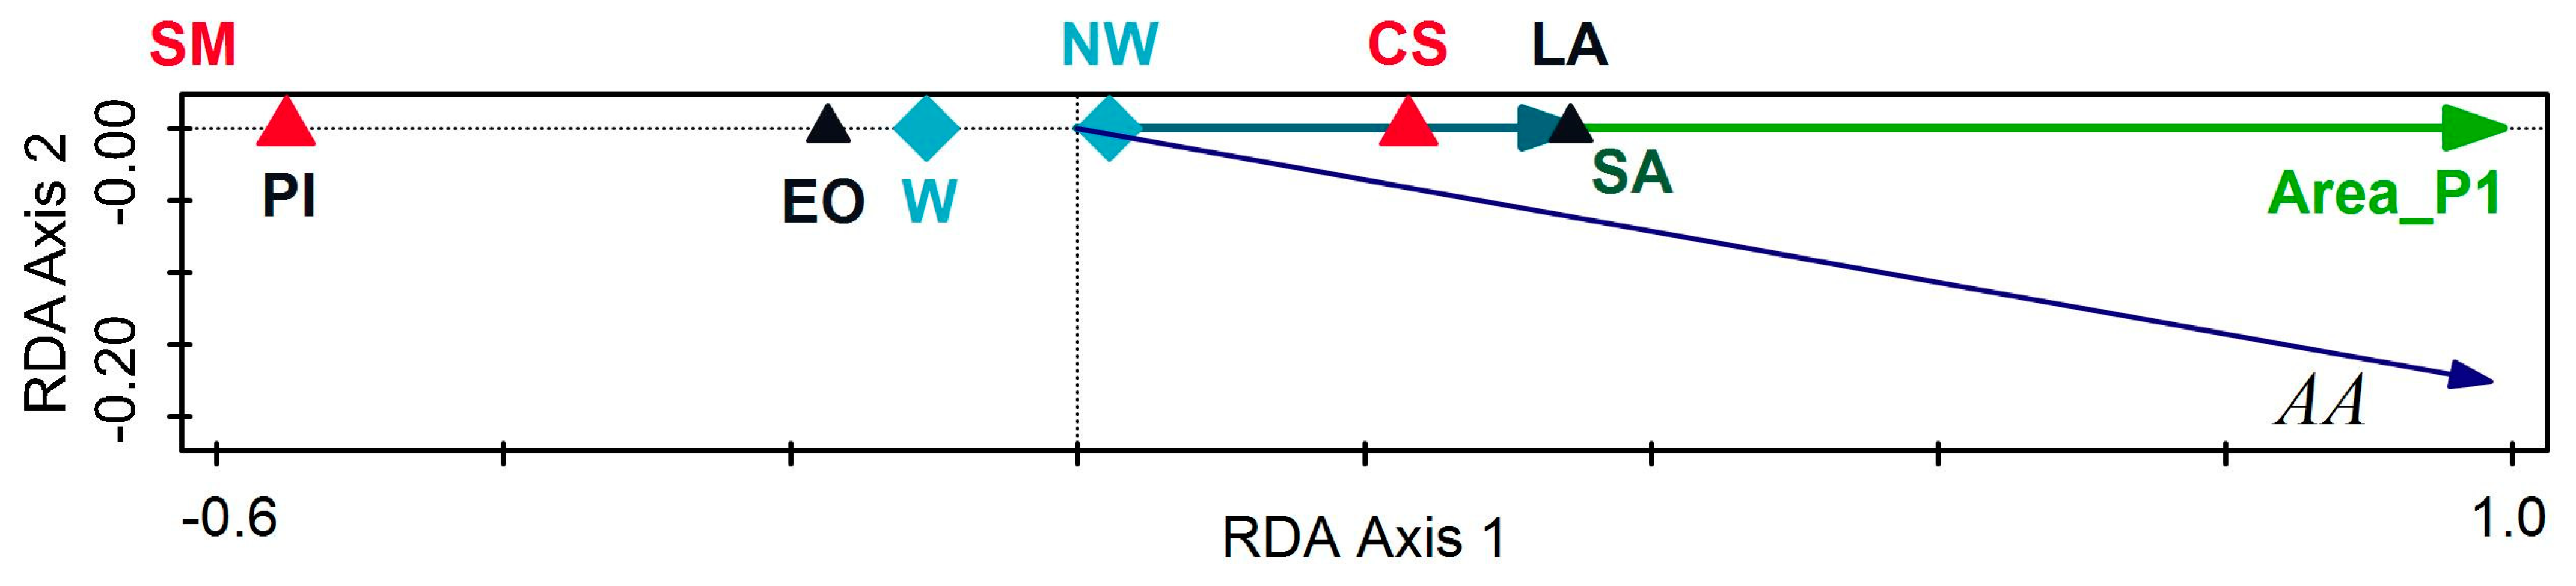
By applying multivariate linear redundancy analysis (RDA) [85], considering the simple term effects (as if each of the predictors acts alone, regardless of all the others), the Area_P1 (total area under commitment) and the number of plots were the most important (explaining 96 and 87% of the variation in AA (authorized amount), followed distantly by SA—sanction amount—(roughly R2 = 12%)), and only some counties and some forms of organization (levels of the corresponding factorial variables) were significant predictors. Among the counties, the most important and significantly linked were Bistrița-Năsăud (BN, coefficient of determination 6%), Sibiu (SB, 4%), and Satu Mare (SM, 1.2%), respectively, while Brașov (BV), Sălaj (SJ), Hunedoara (HD), Arad (AR), Caraș-Severin (CS) and Vâlcea (VL) explained less than 1% (R2), with all the rest being insignificant.
Among the FORG (form of organization), the significant predictors were LA—local administration (explaining 5% in AA variation), PI—private individuals (3%) and FA—forest owner association (0.9%). The predictor Area_P2 (the area covered with thinnings in package 2 of the commitment) is also significant but weakly linked to the dependent variable (R2 = 2.3%). Among the regions, the best predictors, but with low levels of coefficient of determination, were C (1%), followed by W and S (less than 1% variance explained), with all the rest being insignificantly linked to the dependent variable.
The conditional effects showed a parsimonious model, from which the highly correlated predictors have been deleted, since it implies the effect of each new predictor selected after accounting for the effect of the previous predictors. For instance, after selecting and accounting for the effect of Area_P1 (96% variance explained), there was a low level of variation that still might be explained by some unique effects of other predictors.
4.2. The Economicl Impact of PES in Romania
Only a few explanatory variables explained the residual variation, and all had an R2 of less than 1%, namely the SA (sanction amount), some FORG (levels PI, EA, EO), some regions (NW, W) and a few counties (CS, and marginally significant CS). The RDA diagram with selected predictors is given in Figure 7.
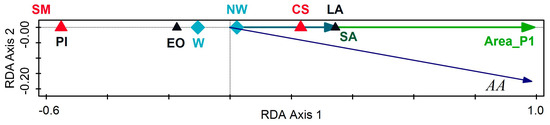
Figure 7.
RDA ordination diagram with AA as response variable and the chosen significant predictors by interactive forward selection procedure. The selected predictors explained 96.91% adjusted variation in AA. The symbols used in the graph are FORG—black triangle, County—red triangle, Region—blue rhomb, Area_P1—green arrow, AA—blue arrow.
In Figure 7, the response variable AA is positively related to the predictors Area_P1 and SA and is also related to increased values of FORG.LA and County.CS, while it is linked at a mean value to Region.NW, followed by Region.W, and to reduced values with the county SM and the FORG.PI and FORG.EO.
Related to the time (both year and, separately, session) as a predictor, there are no significant models, meaning that time is not a significant predictor, or there are no significant differences in time related to the dependent variable.
In other countries, Italy for example, Payment For Ecosystem Services (PES) was implemented in protected natural areas such as Natura 2000 sites [17]. In this case, the contracts have a one-year duration, while in the present case, the duration of the contracts was five years.
In our model of spatiotemporal analysis, the evolution of authorized amount was explained by the area and number of plots. The other variables had a marginal or no impact.
In the countries of the European Union, there are examples of good practices regarding payment schemes for forest ecosystem services. In Finland, forest owners can voluntarily offer their forest sites for protection in the METSO program, and they receive financial compensation equivalent to the full value of timber at the protected site. In Croatia, since 2020, all persons that are engaged in economic activities and that have an income greater than HRK 7.5 million (approximately EUR 1 million) are obliged under the Forest Act to pay a fee for the use of forest ecosystem services that amounts to 0.024% of their total annual revenues. Label Bas Carbone 62 is a French standard that focuses on the certification of carbon offset projects in afforestation, reforestation of destroyed or impacted forests, and conversion of coppices to high stands in forests. Each project type lasts for 30 years, and ex ante credits are generated in either year 0 or year 5. Co-benefits are estimated for the socio-economic, water, soil protection and water dimensions. The scheme is open to all entities that want to offset CO2 emissions, including private firms, public bodies, administrations and citizens. In total, 173 forestry projects had been certified by 2022. The Forest Stewardship Council (FSC) promotes environmentally sustainable, socially responsible and economically viable forest management and has been widely adopted in developed countries, particularly in the EU. The FSC has developed private ecosystem service procedure 63, which is applied globally and implemented in different EU Member States (e.g., Denmark, Estonia, France, Italy, Latvia, Lithuania and the Netherlands) as an add-on to the FSC forest management certification for the quantification of the impact of ecosystem services on land so that positive changes can be quantified, valued and sponsored [69].
5. Conclusions
This study aimed to provide relevant information regarding the viability and potential impact of PES on achieving the goal of forest ecosystem conservation, by analyzing 904 commitment contracts implemented in Romania, totaling 2680 payments. As noted in the case study, Payment For Ecosystem Services (PES) mechanisms offer insight for addressing environmental issues and providing new tools and arguments in favor of biodiversity conservation, particularly within forest ecosystems. These mechanisms incentivize landowners and stakeholders to engage in conservation practices by compensating them for maintaining or enhancing ecosystem services [86,87]. It is thus demonstrated that PES leads to the improvement of ecosystem services through the main objective of conserving forest ecosystems. Through the PES mechanism, a significant percentage of the area (minimum 20%) is designated and treated as an area similar to natural reserves, where activities related to timber harvesting are prohibited. In the remaining areas, the number of forestry interventions should be minimal, with an emphasis on those that have a nature-friendly impact, such as thinning operations conducted with horse-drawn equipment. Under these conditions, the implementation of PES has resulted in the commitment of 0.897 M hectares, which represents 26% of the total eligible forest areas in Romania. Even though forest management plans include conservation measures, the voluntary adoption of additional measures, such as maintaining a timber volume equivalent to half of the volume intended for extraction through specific conservation activities; maintaining at least one-fifth of the area where only planting and care of forest seedlings will be carried out; and adopting a minimum number of interventions on the remaining area, specifically a maximum of one intervention in areas not designated as quiet zones, contribute to achieving the overall objective of forest ecosystem biodiversity conservation.
The study data reflect a growing spatiotemporal trend. While the first session recorded a small number of interested parties applying (less than 2% of the total applicants), in the subsequent three sessions, the number of applicants remained balanced and almost constant (31%, 35%, 32%). This demonstrates that PES presents an interest to forest owners, establishing itself as a viable tool for the conservation of forest ecosystems. Although from a financial perspective PES might seem like an unsustainable cost for society, they are rather an investment in the well-being of both current and future generations. Given the increasingly adverse effects of climate change, and the necessity for forest resilience to be a strategic priority both nationally and Europe-wide, PES could serve as a practical instrument for forest conservation readily available to policymakers.
In conclusion, the results mentioned above indicate the social impact of PES, quantified by the number of applications submitted; the economic impact, by the amount of money authorized; and the impact on the environment, by calculating the minimum area in the quiet zone (minimum 20%), which is exempt of forestry works.
The spatiotemporal multivariate assessment of PES in Romania offers a comprehensive overview of a tool intended to lead to forest conservation. The model proposed is a potential approach to environment and climate programs that can be optimized in the perspective of continuous PES implementation, as is the intervention DR-07 “Silvo-environment and climate” launched in the summer of this year.
A limitation of the study is that it analyzed the period 2017–2023, and at that time, the intention of the authority regarding the initiation of new sessions for submitting voluntary membership applications to the SPO was not clear, as it happened in the second half of the current year.
Future research should focus on new financial mechanisms that lead to achieving the objectives of forest ecosystem conservation. Additionally, studies are needed to document the reasons behind the passivity of potential beneficiaries in adopting PES, so that the voluntary participation rate can approach its optimum.
Author Contributions
Conceptualization, I.A.B., V.R.C., R.B., M.A.S. and C.M.E.; methodology, I.A.B., V.R.C., R.B., M.A.S. and C.M.E.; investigation, I.A.B., V.R.C., R.B., M.A.S. and C.M.E.; resources, I.A.B.; data curation, I.A.B., V.R.C. and C.M.E.; writing—original draft preparation, I.A.B., V.R.C., R.B., M.A.S. and C.M.E.; writing—review and editing, I.A.B. and C.M.E.; supervision, I.A.B.; funding acquisition, I.A.B. All authors have read and agreed to the published version of the manuscript.
Funding
The project was financed by Lucian Blaga University of Sibiu & Hasso Plattner Foundation research grants LBUS-IRG-2021-07.
Data Availability Statement
Restrictions apply to the availability of these data. Data were obtained from the Payments and Interventions Agency for Agriculture.
Acknowledgments
The authors would like to thank the Payments and Interventions Agency for Agriculture for providing data from March 2024. Also, the authors would like to thank Ioan Sîrbu for his help and encouragement.
Conflicts of Interest
The authors declare no conflicts of interest.
References
- Zon, R. Forests and Human Progress. Geogr. Rev. 1920, 10, 139. [Google Scholar] [CrossRef]
- De Groot, R.S.; Alkemade, R.; Braat, L.; Hein, L.; Willemen, L. Challenges in Integrating the Concept of Ecosystem Services and Values in Landscape Planning, Management and Decision Making. Ecol. Complex. 2010, 7, 260–272. [Google Scholar] [CrossRef]
- Berkes, F.; Folke, C.; Colding, J. Linking Social and Ecological Systems: Management Practices and Social Mechanisms for Building Resilience; Cambridge University Press: Cambridge, UK, 2000. [Google Scholar]
- Daily, G.C. Nature’s Services: Societal Dependence on Natural Ecosystems; Island Press: Washington, DC, USA, 1997. [Google Scholar]
- Mazzochini, G.G.; Rowland, L.; Lira-Martins, D.; Barros, F.D.V.; Flores, B.M.; Hirota, M.; Pennington, R.T.; Oliveira, R.S. Spectral Asynchrony as a Measure of Ecosystem Response Diversity. Glob. Chang. Biol. 2024, 30, e17174. [Google Scholar] [CrossRef]
- Barrere, J.; Reineking, B.; Jaunatre, M.; Kunstler, G. Forest Storm Resilience Depends on the Interplay between Functional Composition and Climate—Insights from European-Scale Simulations. Funct. Ecol. 2024, 38, 500–516. [Google Scholar] [CrossRef]
- Klimetzek, D.; Stancioiu, P.T.; Paraschiv, M.; Nita, M.D. Ecological Monitoring with Spy Satellite Images-The Case of Red Wood Ants in Romania. Remote Sens. 2021, 13, 520. [Google Scholar] [CrossRef]
- Spittlehouse, D.L.; Stewart, R.B. Adaptation to Climate Change in Forest Management. J. Ecosyst. Manag. 2003, 8. [Google Scholar] [CrossRef]
- Byg, B.; Shah, A.D. Heating up: Climate Change and the Threat to Human Health. Curr. Opin. Nephrol. Hypertens. 2024, 33, 78–82. [Google Scholar] [CrossRef] [PubMed]
- Combaud, M.; Cordonnier, T.; Dupire, S.; Vallet, P. Climate Change Altered the Dynamics of Stand Dominant Height in Forests during the Past Century—Analysis of 20 European Tree Species. For. Ecol. Manag. 2024, 553, 121601. [Google Scholar] [CrossRef]
- Official Gazette Romanian. Forest Code. Available online: https://legislatie.just.ro/Public/DetaliiDocumentAfis/280837 (accessed on 21 July 2024).
- Joa, B.; Schraml, U. Conservation Practiced by Private Forest Owners in Southwest Germany—The Role of Values, Perceptions and Local Forest Knowledge. For. Policy Econ. 2020, 115, 102141. [Google Scholar] [CrossRef]
- Ministerul Mediului Apelor si Padurilor Strategia Natională Pentru Paduri 2030. Available online: https://www.mmediu.ro/categorie/strategia-nationala-pentru-paduri-2030/430 (accessed on 24 February 2024).
- MacKinnon, K.; Richardson, K.; MacKinnon, J. Protected and Other Conserved Areas: Ensuring the Future of Forest in a Changing Climate. Int. For. Rev. 2020, 22, 93–103. [Google Scholar] [CrossRef]
- Pringle, R.M. Upgrading Protected Areas to Conserve Wild Biodiversity. Nature 2017, 546, 91–99. [Google Scholar] [CrossRef] [PubMed]
- European Parliament Nature Restoration: Parliament Adopts Law to Restore 20% of EU’s Land and Sea. Available online: https://www.europarl.europa.eu/news/en/press-room/20240223IPR18078/nature-restoration-parliament-adopts-law-to-restore-20-of-eu-s-land-and-sea (accessed on 28 February 2024).
- Marino, D.; Pellegrino, D. Can Payments for Ecosystem Services Improve the Management of Natura 2000 Sites? A Contribution to Explore Their Role in Italy. Sustainability 2018, 10, 665. [Google Scholar] [CrossRef]
- Agentia de Plati si Interventie pentru Agricultura (APIA). Ghidul Solicitantului; APIA: București, Romania; Available online: https://apia.org.ro/wp-content/uploads/2021/11/17-04-25-11-40-39Anexa_OMADR_108_24.04.2017_Ghidul_solicitantului.pdf (accessed on 17 April 2024).
- Quiroga, S.; Suarez, C.; Ficko, A.; Feliciano, D.; Bouriaud, L.; Brahic, E.; Deuffic, P.; Dobsinska, Z.; Jarsky, V.; Lawrence, A.; et al. What Influences European Private Forest Owners’ Affinity for Subsidies? For. Policy Econ. 2019, 99, 136–144. [Google Scholar] [CrossRef]
- Ardeleanu, N.-N.; Breaban, I.-G. Biodiversity Policies, Opportunities for Restoring the Economy. Present Environ. Sustain. Dev. 2021, 15, 161–169. [Google Scholar] [CrossRef]
- Ciocirlan, M.; Campu, V.R.; Macinnis-Ng, C.; Palik, B.J. Characteristics of Forest Windthrow Produced in Eastern Carpathians in February 2020. Forests 2024, 15, 176. [Google Scholar] [CrossRef]
- Dinulica, F.; Marcu, V.; Borz, S.A.; Vasilescu, M.M.; Petritan, I.C. Wind Contribution to Yearly Silver Fir (Abies Alba Mill.) Compression Wood Development in the Romanian Carpathians. IForest 2016, 9, 927–936. [Google Scholar] [CrossRef]
- Campu, R.V.; Bratu, M.A.; Ciocirlan, M. The Felling of Hung Up Trees-A Work Safety and Productivity Issue. Forests 2020, 11, 1225. [Google Scholar] [CrossRef]
- Antofie, M.-M.; Sand-Sava, C. Genetically Modified Crops in Romania before and after the Accession of the European Union. Agriculture 2022, 12, 458. [Google Scholar] [CrossRef]
- Nemet, A.; Funar, S.; Man, A.; Pop, B. Agri-Environmental Payment Issues in Romanian Agriculture. Sci. Pap. -Ser. Manag. Econ. Eng. Agric. Rural. Dev. 2011, 11, 153–154. [Google Scholar]
- Kay, S.; Graves, A.; Palma, J.H.N.; Moreno Gerardo and Roces-Diaz, V.J.; Aviron, S.; Chouvardas Dimitrios and Crous-Duran, J.; Ferreiro-Dominguez, N.; de Jalon, S.G.; Macicasan, V.; Rosa Mosquera-Losada, M.; et al. Agroforestry Is Paying off—Economic Evaluation of Ecosystem services in European Landscapes with and without Agroforestry Systems. Ecosyst. Serv. 2019, 36, 100896. [Google Scholar] [CrossRef]
- van Eck, N.J.; Waltman, L. Software Survey: VOSviewer, a Computer Program for Bibliometric Mapping. Scientometrics 2010, 84, 523–538. [Google Scholar] [CrossRef]
- Effendi, D.N.; Irwandani; Anggraini, W.; Jatmiko, A.; Rahmayanti, H.; Ichsan, I.Z.; Rahman, M.M. Bibliometric Analysis of Scientific Literacy Using VOS Viewer: Analysis of Science Education. J. Phys. Conf. Ser. 2021, 1796, 12096. [Google Scholar] [CrossRef]
- Budler, M.; Župič, I.; Trkman, P. The Development of Business Model Research: A Bibliometric Review. J. Bus. Res. 2021, 135, 480–495. [Google Scholar] [CrossRef]
- Ogrean, C.; Herciu, M. Business Models Addressing Sustainability Challenges—Towards a New Research Agenda. Sustainability 2020, 12, 3534. [Google Scholar] [CrossRef]
- Achim, M.V.; Safta, I.L.; Văidean, V.L.; Mureșan, G.M.; Borlea, N.S. The Impact of COVID-19 on Financial Management: Evidence from Romania. Econ. Res. -Ekon. Istraživanja 2022, 35, 1807–1832. [Google Scholar] [CrossRef]
- Bukar, U.A.; Sayeed, M.S.; Razak, S.F.A.; Yogarayan, S.; Amodu, O.A.; Mahmood, R.A.R. A Method for Analyzing Text Using VOSviewer. MethodsX 2023, 11, 102339. [Google Scholar] [CrossRef] [PubMed]
- Bratu, M.L.; Cioca, L.-I.; Nerisanu, R.A.; Rotaru, M.; Plesa, R. The Expectations of Generation Z Regarding the University Educational Act in Romania: Optimizing the Didactic Process by Providing Feedback. Front. Psychol. 2023, 14, 1160046. [Google Scholar] [CrossRef]
- Haines-Young, R.; Potschin, M. Common International Classification of Ecosystem Services (CICES, Version 4.1). Eur. Environ. Agency 2012, 33, 107. [Google Scholar]
- Ministerul Agriculturii și Dezvoltării Rurale Ordin Nr. 495 din 01.10.2019. Available online: https://www.madr.ro/culturi-de-camp/download/3477_a8ad254ac5e990f5b9a8d4227e96a425.html (accessed on 28 February 2024).
- Ministerul Agriculturii si Dezvoltarii Rurale Ordin Nr. 1002/2016 Privind Aprobarea Schemei de Ajutor de Stat “Servicii de Silvomediu, Servicii Climatice Si Conservarea Padurilor“. Available online: https://legislatie.just.ro/public/DetaliiDocument/185569 (accessed on 28 February 2024).
- EC Implementing Regulation (EU) No. 808/2014. Available online: https://eur-lex.europa.eu/legal-content/ro/TXT/?uri=CELEX%3A32014R0808 (accessed on 28 February 2024).
- APIA Ghidul Solicitantului Pentru Accesarea Schemei de Ajutor de Stat “Servicii de Silvomediu, Servicii Climatice Și Conservarea Pădurilor”, Aferentă Măsurii 15 “Servicii de Silvomediu, Servicii Climatice Și Conservarea Pădurilor”, Submăsura 15.1 “Plăți Pentru Angajamente de Silvomediu”. Available online: https://apia.org.ro/wp-content/uploads/2021/11/Ghidul_solicitantului_M_15_Sesiunea_II.pdf (accessed on 28 February 2024).
- Schema de ajutor de stat Hotărârea 447/ 2017. Available online: https://legislatie.just.ro/Public/DetaliiDocument/190864 (accessed on 28 February 2024).
- Ojea, E.; Loureiro, M.L.; Allo, M.; Barrio, M. Ecosystem Services and REDD: Estimating the Benefits of Non-Carbon in Worldwide Forests. World Dev. 2016, 78, 246–261. [Google Scholar] [CrossRef]
- Bush, G.; Taye, F.A.; Fleming, C.; Samndong, R.A. Evaluating the Costs of Primary Forest Conservation in the Democratic of Congo, Implications for Policy and Practice. J. Environ. Manag. 2024, 352, 119975. [Google Scholar] [CrossRef]
- Nguyen, H.; Harper, R.J.; Dell, B. Examining Local Community Understanding of Mangrove Carbon Mitigation: A Study from Ca Mau Province, Mekong River Delta, Vietnam. Mar. Policy 2023, 148, 105398. [Google Scholar] [CrossRef]
- Brancalion, P.H.S.; Schweizer, D.; Gaudare, U.; Mangueira, J.R.; Lamonato, F.; Farah, F.T.; Nave, A.G.; Rodrigues, R.R. Balancing Economic Costs and Ecological Outcomes of Passive and Active in Agricultural Landscapes: The Case of Brazil. Biotropica 2016, 48, 856–867. [Google Scholar] [CrossRef]
- Adams, C.; Rodrigues, S.T.; Calmon, M.; Kumar, C. Impacts of Large-Scale Forest Restoration on Socioeconomic Status and local Livelihoods: What We Know and Do Not Know. Biotropica 2016, 48, 731–744. [Google Scholar] [CrossRef]
- Gastauer, M.; Cavalcante, R.B.L.; Caldeira, C.F.; Nunes, S.D.S. Structural Hurdles to Large-Scale Forest Restoration in the Brazilian. Front. Ecol. Evol. 2020, 8, 593557. [Google Scholar] [CrossRef]
- Smith, J.; Mulongoy, K.; Persson, R.; Sayer, J. Harnessing Carbon Markets for Tropical Forest Conservation: Towards a more Realistic Assessment. Environ. Conserv. 2000, 27, 300–311. [Google Scholar] [CrossRef]
- Garcia, S.; Abildtrup, J.; Stenger, A. How Does Economic Research Contribute to the Management of Forest Services? Ann. For. Sci. 2018, 75, 53. [Google Scholar] [CrossRef]
- Locatelli, B.; Imbach, P.; Wunder, S. Synergies and Trade-Offs between Ecosystem Services in Costa Rica. Environ. Conserv. 2014, 41, 27–36. [Google Scholar] [CrossRef]
- Boerner, J.; Wunder, S.; Wertz-Kanounnikoff, S.; Hyman, G.; Nascimento, N. Forest Law Enforcement in the Brazilian Amazon: Costs and Income Effects. Glob. Environ. Chang. 2014, 29, 294–305. [Google Scholar] [CrossRef]
- Benedek, A.M.; Sirbu, I.; Lazar, A. Responses of Small Mammals to Habitat Characteristics in Southern Forests. Sci. Rep. 2021, 11, 12031. [Google Scholar] [CrossRef]
- Lazar, A.; Benedek, A.M.; Sirbu, I. Small Mammals in Forests of Romania: Habitat Type Use and Additive Partitioning. Forests 2021, 12, 1107. [Google Scholar] [CrossRef]
- Hashida, Y.; Withey, J.; Lewis, D.J.; Newman Tara and Kline, J.D. Anticipating Changes in Wildlife Habitat Induced by Private Forest’ Adaptation to Climate Change and Carbon Policy. PLoS ONE 2020, 15, e0230525. [Google Scholar] [CrossRef] [PubMed]
- Macpherson, M.F.; Kleczkowski, A.; Healey, J.R.; Hanley, N. Payment for Multiple Forest Benefits Alters the Effect of Tree disease on Optimal Forest Rotation Length. Ecol. Econ. 2017, 134, 82–94. [Google Scholar] [CrossRef] [PubMed]
- Khanal, Y.; Devkota, B.P. Farmers’ Responsibilization in Payment for Environmental Services: Lessons from Community Forestry in Nepal. For. Policy Econ. 2020, 118, 102237. [Google Scholar] [CrossRef]
- Varela, E.; Pulido, F.; Moreno, G.; Zavala, M.A. Targeted Policy Proposals for Managing Spontaneous Forest Expansion in the Mediterranean. J. Appl. Ecol. 2020, 57, 2373–2380. [Google Scholar] [CrossRef]
- Matthies, B.D.; Kalliokoski, T.; Eyvindson, K.; Honkela, N.; Hukkinen, J.I.; Kuusinen, N.J.; Raisanen, P.; Valsta, L.T. Nudging Service Providers and Assessing Service Trade-Offs to Reduce the social Inefficiencies of Payments for Ecosystem Services Schemes. Environ. Sci. Policy 2016, 55, 228–237. [Google Scholar] [CrossRef]
- Boerner, J.; Wunder, S.; Giudice, R. Will Up-Scaled Forest Conservation Incentives in the Peruvian Amazon Cost-Effective and Equitable Outcomes? Environ. Conserv. 2016, 43, 407–416. [Google Scholar] [CrossRef]
- Shinbrot, X.A.; Holmes, I.; Gauthier, M.; Tschakert, P.; Wilkins, Z.; Baragon, L.; Opua, B.; Potvin, C. Natural and Financial Impacts of Payments for Forest Carbon Offset: A 14-Long Case Study in an Indigenous Community in Panama. Land Use Policy 2022, 115, 106047. [Google Scholar] [CrossRef]
- Bratu, M.L.; Cioca, L.-I. Modelling Human Behaviour through Game Theory in Order to Increase the Quality of Work and the Quality of Life of Employees through Managerial Appropriate to Individual and Group Personality. Qual. -Access Success 2018, 19, 54–58. [Google Scholar]
- Thuy, P.T.; Hue, N.T.; Dat, L.Q. Households’ Willingness-to-Pay for Mangrove Environmental Services: Evidence from Phu Long, Northeast Vietnam. Trees For. People 2024, 15, 100474. [Google Scholar] [CrossRef]
- Koch, D.-J.; Verholt, M. Limits to Learning: The Struggle to Adapt to Unintended Effects of international Payment for Environmental Services Programmes. Politics Law Econ. 2020, 20, 507–539. [Google Scholar] [CrossRef]
- Saito-Jensen, M.; Rutt, R.L.; Chhetri, B.B.K. Social and Environmental Tensions: Affirmative Measures Under REDD plus Carbon Payment Initiatives in Nepal. Hum. Ecol. 2014, 42, 683–694. [Google Scholar] [CrossRef]
- Bratu, M.L.; Miricescu, D. Study on Heredity Value in Communication Skills, for Improving Performance in the Workplace. MATEC Web Conf. 2017, 121, 07002. [Google Scholar] [CrossRef]
- Naime, J.; Angelsen, A.; Molina-Garzón, A.; Carrilho, C.D.; Selviana, V.; Demarchi, G.; Duchelle, A.E.; Martius, C. Enforcement and Inequality in Collective PES to Reduce Tropical Deforestation: Effectiveness, Efficiency and Equity Implications. Glob. Environ. Chang. 2022, 74, 102520. [Google Scholar] [CrossRef]
- Grilli, G.; Fratini, R.; Marone, E.; Sacchelli, S. A Spatial-Based Tool for the Analysis of Payments for Forest Ecosystem Services Related to Hydrogeological Protection. For. Policy Econ. 2020, 111, 102039. [Google Scholar] [CrossRef]
- Razzaque, J. Payments for Ecosystem Services in Sustainable Mangrove Forest in Bangladesh. Transnatl. Environ. Law 2017, 6, 309–333. [Google Scholar] [CrossRef]
- Wuenscher, T.; Engel, S.; Wunder, S. Spatial Targeting of Payments for Environmental Services: A Tool for boosting Conservation Benefits. Ecol. Econ. 2008, 65, 822–833. [Google Scholar] [CrossRef]
- Wunder, S. When Payments for Environmental Services Will Work for Conservation. Conserv. Lett. 2013, 6, 230–237. [Google Scholar] [CrossRef]
- European Commission. Guidance on the Development of Public and Private Payment Schemes for Forest Ecosystem Services. Available online: https://agriculture.ec.europa.eu/system/files/2023-07/guidance-dev-public-private-payment-schemes-forest_en.pdf (accessed on 28 February 2024).
- Le, T.-A.T.; Vodden, K.; Wu, J.; Bullock, R.; Sabau, G. Payments for Ecosystem Services Programs: A Global Review of Contributions towards Sustainability. Heliyon 2023, 10, e22361. [Google Scholar] [CrossRef]
- Gale, R.P.; Cordray, S.M. Making Sense of Sustainability—Nine Answers To What Should Be Sustained? Rural. Sociol. 1994, 59, 311–332. [Google Scholar] [CrossRef]
- Thompson, P.B. Agricultural sustainability: What it is and what it is not. Int. J. Agric. Sustain. 2007, 5, 5–16. [Google Scholar] [CrossRef]
- Agenția pentru Finanțarea Investițiilor Rurale AFIR Submăsura 15.1—Plăți Pentru Angajamente de Silvomediu. Available online: https://www.afir.info/ (accessed on 28 February 2024).
- Ministerul Apelor şi Pădurilor Ordinul Nr. 766/2018 Pentru Aprobarea Normelor Tehnice Privind Elaborarea Amenajamentelor Silvice, Modificarea Prevederilor Acestora Şi Schimbarea Categoriei de Folosinţă a Terenurilor Din Fondul Forestier Şi a Metodologiei Privind Aprobarea Depăşirii Posibilităţii/Posibilităţii Anuale În Vederea Recoltării Produselor Accidentale I. Monitorul Oficial. 2018. Available online: https://legislatie.just.ro/Public/DetaliiDocument/204225 (accessed on 5 June 2024).
- Cioca, L.-I.; Bratu, M.L. Sustainability of Youth Careers in Romania-Study on the Correlation of Students’ Personal Interests with the Selected University Field of Study. Sustainability 2021, 13, 229. [Google Scholar] [CrossRef]
- Bratu, M.L.; Cioca, L.-I. Impact of Engineer Personality on Sustainable Environment. In Proceedings of the 2019 International Conference on ENERGY and ENVIRONMENT (CIEM), Timisoara, Romania, 17–18 October 2019; p. 16+. [Google Scholar]
- EC Uniunea Europeană Și Pădurile. Available online: https://www.europarl.europa.eu/factsheets/ro/sheet/105/uniunea-europeana-si-padurile (accessed on 5 July 2024).
- Institutul National de Statistica Statistica Activitatilor Din Silvicultura, in Anul 2022. Available online: https://insse.ro/cms/ro/content/statistica-activit%C4%83%C5%A3ilor-din-silvicultur%C4%83-%C3%AEn-anul-2022 (accessed on 13 May 2024).
- Wagner, W.E., III. Using IBM® SPSS® Statistics for Research Methods and Social Science Statistics; Sage Publications: Thousand Oaks, CA, USA, 2019. [Google Scholar]
- Field, A. Discovering Statistics Using IBM SPSS Statistics; Sage Publications Limited: Thousand Oaks, CA, USA, 2024. [Google Scholar]
- Ter Braak, C.J.F.; Šmilauer, P. Canoco Reference Manual and User’s Guide: Software for Ordination (Version 5.10); Wageningen University & Research: Wageningen, The Netherlands, 2018. [Google Scholar]
- Smilauer, P.; Leps, J. Multivariate Analysis of Ecological Data Using CANOCO 5; Cambridge University Press: Cambridge, UK, 2014; pp. 1–362. [Google Scholar] [CrossRef]
- Graves, R.A.; Nielsen-Pincus, M.; Haugo, R.D.; Holz, A. Forest Carbon Incentive Programs for Non-Industrial Private Forests in Oregon (USA): Impacts of Program Design on Willingness to Enroll and Landscape-Scale Program Outcomes. For. Policy Econ. 2022, 141, 102778. [Google Scholar] [CrossRef]
- Ureta, J.C.; Motallebi, M.; Vassalos, M.; Seagle, S.; Baldwin, R. Estimating Residents’ WTP for Ecosystem Services Improvement in a Payments for Ecosystem Services (PES) Program: A Choice Experiment Approach. Ecol. Econ. 2022, 201, 107561. [Google Scholar] [CrossRef]
- Tăban, C.I.; Benedek, A.M.; Stoia, M.; Cocîrlea, M.D.; Oancea, S. A Multivariate Model of Drinking Water Quality Based on Regular Monitoring of Radioactivity and Chemical Composition. Appl. Sci. 2023, 13, 10544. [Google Scholar] [CrossRef]
- Mayrand, K.; Paquin, M. Payments for Environmental Services: A Survey and Assessment of Current Schemes. 2004. Available online: http://hdl.handle.net/10919/66935 (accessed on 11 April 2024).
- Wunder, S. Payments for Environmental Services: Some Nuts and Bolts; Cifor Bogor, 2005; Volume 42, Available online: https://www.cifor-icraf.org/publications/pdf_files/OccPapers/OP-42.pdf (accessed on 5 July 2024).
Disclaimer/Publisher’s Note: The statements, opinions and data contained in all publications are solely those of the individual author(s) and contributor(s) and not of MDPI and/or the editor(s). MDPI and/or the editor(s) disclaim responsibility for any injury to people or property resulting from any ideas, methods, instructions or products referred to in the content. |
© 2024 by the authors. Licensee MDPI, Basel, Switzerland. This article is an open access article distributed under the terms and conditions of the Creative Commons Attribution (CC BY) license (https://creativecommons.org/licenses/by/4.0/).