Article

Can Investment in Forestry Resource Management Reduce Haze Pollution and Carbon Emissions? Evidence from China

1
Forestry Survey, Planning and Design Institute, Anhui Normal University, Wuhu 241000, China
2
College of Life Sciences, Anhui Normal University, Wuhu 241000, China
3
School of Geography and Tourism, Anhui Normal University, Wuhu 241002, China
4
Research and Innovation Division of the Banjar Municipality Regional Development Planning Agency, West Java 46311, Indonesia
5
School of Geography, Nanjing Normal University, Nanjing 210023, China
*
Authors to whom correspondence should be addressed.
Forests 2024, 15(9), 1534; https://doi.org/10.3390/f15091534
Submission received: 23 June 2024 / Revised: 22 August 2024 / Accepted: 28 August 2024 / Published: 30 August 2024
(This article belongs to the Special Issue Economy and Sustainability of Forest Natural Resources)

Abstract

:
In the context of green development, it is very important to explore the impact of investment in forestry resource management (IFRM) on atmospheric haze pollution and carbon emissions. Based on long time series data of 30 provincial administrative regions in China from 2008 to 2019, this study used ArcGIS spatial analysis and spatial econometric models to investigate the impact of IFRM on haze pollution and carbon emissions and its potential spatial spillover effects. The results show that areas with higher haze pollution concentrations in China were mainly distributed in the Sichuan Basin and the North China Plain; areas with high carbon emission intensity were mainly distributed in Beijing, Shanghai, Tianjin, Shandong, Hebei, etc. For every 1% increase in IFRM, haze pollution and carbon emissions decreased by 0.0655% and 0.1169%, respectively, indicating that IFRM has significantly improved the ecological environment. In addition, IFRM not only significantly reduced haze pollution and carbon emissions in local areas, but also had a strong negative effect on haze pollution in neighboring areas. This study provides important strategies for promoting forestry resource management and regional green development.

1. Introduction

Since the industrial revolution, the extensive use of fossil fuels such as oil and coal and the sharp decline in forest resources have led to a continuous increase in atmospheric carbon dioxide concentrations and serious haze pollution [1,2]. In particular, with global warming and the deteriorating ecological environment, promoting sustainable economic, social and environmental development has become a focus of widespread concern in the international community. Scholars from all over the world have realized that the problem of ecological environment degradation is not just a scientific issue, but has risen to a global political, economic and social issue [3]. Similar to other developing countries, China is also facing serious problems of haze pollution and carbon emissions [4]. According to data from the International Energy Agency, China’s carbon emissions exceeded 13 billion tons in 2020, making it the world’s largest carbon emitter (https://www.iea.org/, accessed on 12 February 2024). In addition, relevant research shows that 7 of the world’s 10 cities with the most serious air pollution are in China [5]. Severe haze pollution affects residents’ transportation, threatens their health and lives, and causes extreme concern about the surrounding environment. Obviously, the above phenomenon has also attracted great attention from Chinese government departments.
In the context of green transformation and development, scholars have conducted extensive research on the spatiotemporal patterns and influencing factors of carbon emissions and haze pollution [6]. Based on the quadrant diagram method and the Theil index, Zhang et al. found that China’s rural carbon emissions have strong temporal and spatial heterogeneity, and the rural carbon emission intensity in central China is the highest [7]. Ye et al. combined air monitoring data with ArcGIS spatial analysis and found that China’s air pollution pattern has strong temporal and spatial differences [8]. With the application of multivariate data and econometric models, the formation mechanism and governance approaches of carbon emissions and haze pollution have received widespread attention from scholars [9,10,11]. Raihan and Tuspekova found that for every 1% increase in forest area, carbon emissions decreased by 3.17% [12]. Lin et al. combined a mixed regression panel model and found that for every 1% increase in China’s forest area, the average PM2.5 concentration decreased by 2.53%, and advocated improving the ecological environment through sustainable forest management [13].
China has large reserves of forest resources, ranking among the largest in the world, but the per capita possession is small, and the quality of forest resources is relatively poor. With the continuous development of urbanization and industrialization, forestry resources are decreasing, posing a serious threat to the ecological environment and the stability of forest ecosystems [14,15]. Forestry resources are regulators of carbon emissions, and they play the role of carbon sinks and storage through photosynthesis, biomass accumulation and forest product processing; local governments should accelerate the development of forestry to help alleviate global climate change [16,17]. China launched the Global Carbon Sink Project in 2001, aiming to foster a forest carbon sink market and maximize the ecological value of forests. However, due to the complex ownership of forest assets and difficulties in forest land management, the marketization of forest carbon sinks in China is still in its infancy.
Currently, relevant scholars have explored the impact of investment in forestry resource management (IFRM) on net carbon emissions from many aspects [18,19,20]. Specifically, forestry resources have strong carbon absorption and storage functions, which convert carbon dioxide into organic matter through photosynthesis. In the process, forests absorb large amounts of carbon dioxide and convert it into organic matter, which gradually decomposes in the soil, thereby increasing the soil’s carbon storage [21]. It can be seen that forests have obvious advantages over other ecosystems and play a vital role in addressing climate change. In addition, China will consolidate the carbon sequestration function of existing forests, continuously increase forest area and stock, and enhance the incremental carbon sink capacity of ecosystems as one of the important development paths to achieve carbon neutrality [22]. Especially with the rise of international carbon markets, it has become possible to realize the value of forest ecological benefits through market mechanisms [23,24].
Forestry resources are the “green purifier” of air pollution and play a key role in controlling haze pollution [25]. On one hand, forest resources can absorb and retain dust and particulate matter from the air, reducing the diffusion range and concentration of PM2.5 [26,27]. On the other hand, forests release negative ions as they grow, which can combine with pollutants in the air and improve air quality [28,29]. The water vapor released by forests can absorb dust from the air, allowing it to fall to the ground under the action of gravity, thereby removing microparticles in the air [30]. In recent years, local governments have vigorously promoted policies such as natural forest protection, returning farmland to forests, afforestation, and mountain closure and reforestation to improve the quality of forest development and enhance the stability and sustainability of such ecosystems.
In summary, although existing research has achieved fruitful results, it still faces some challenges. Most previous studies have only used forest area to evaluate the level of forestry resource development, which makes it difficult to comprehensively reflect the quality of forestry resource development. In addition, existing research mainly focuses on the spatiotemporal distribution and influencing factors of IFRM, but what is its impact on haze pollution and carbon emissions? Will the IFRM in local areas have an impact on haze pollution and net carbon emissions in neighboring areas? What are the details and characteristics of this potential spatial spillover effect? To explore this, this study first used ArcGIS spatial analysis and kernel density analysis to explore the spatiotemporal evolution of China’s haze pollution and carbon emissions. Secondly, this study constructs a forestry resource evaluation index system from three levels: forestry economy, forestry status and forestry governance, and constructs an appropriate spatial econometric model to explore the impact of IFRM on haze pollution and carbon emissions. Finally, we further examined the spatial spillover effects of IFRM on haze pollution and net regional carbon emissions through partial differential equations.

2. Materials and Methods

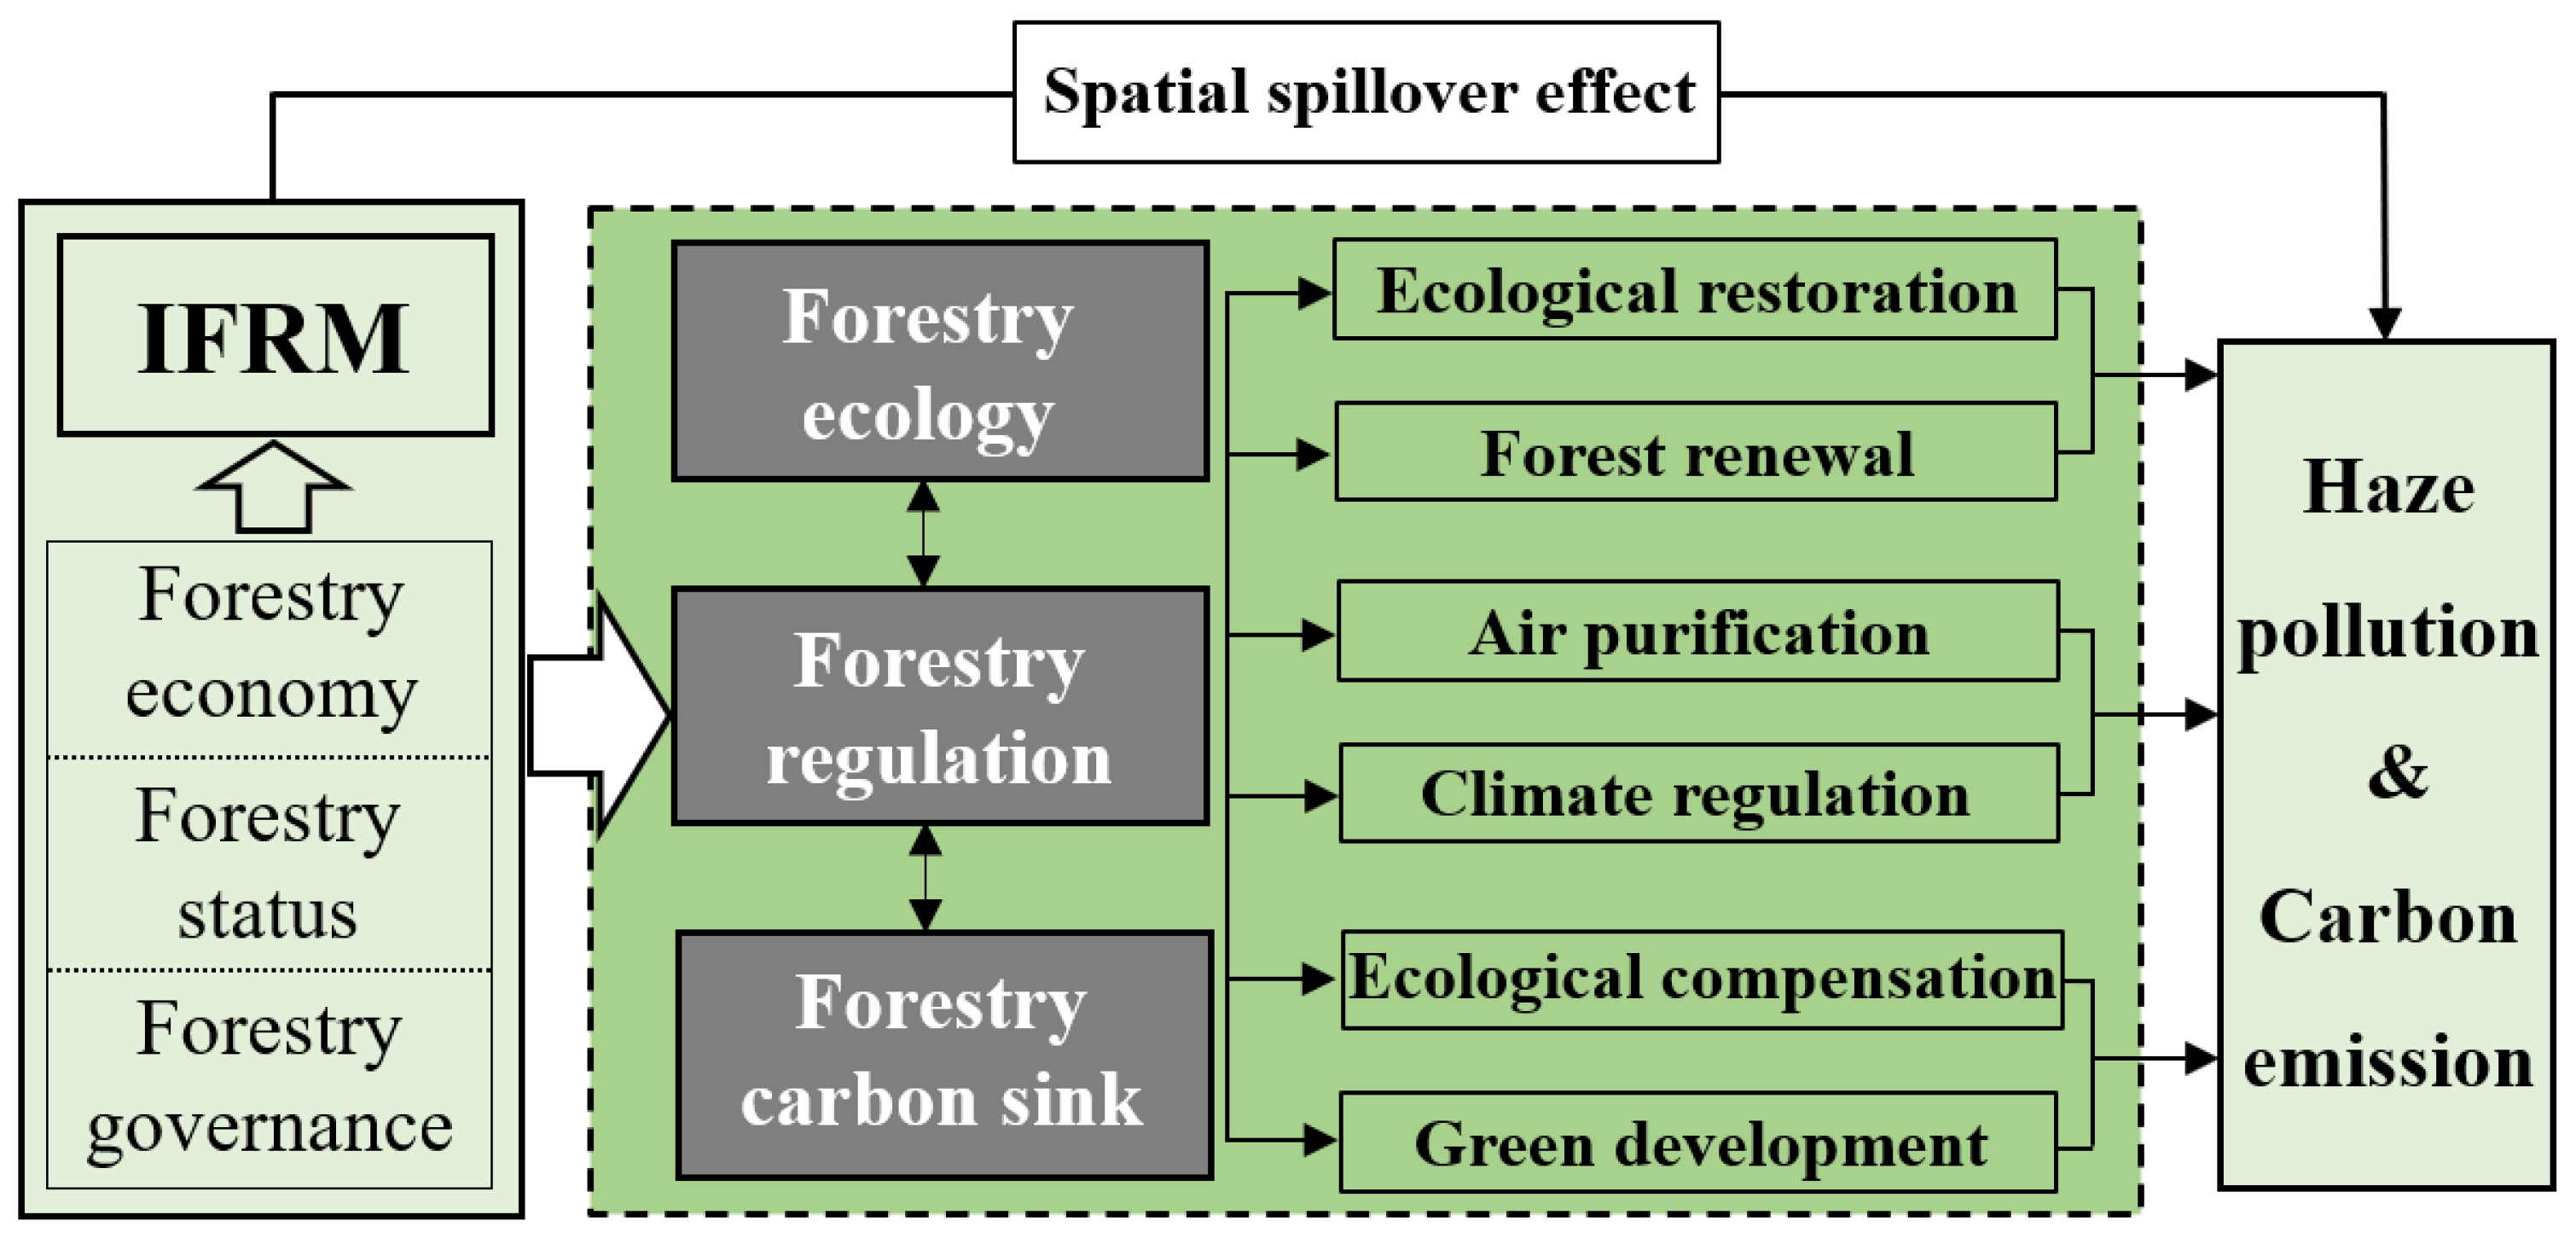
2.1. Theoretical Mechanism Analysis

Based on the above analysis, this study further constructed an analytical framework for the impact of IFRM on haze pollution and carbon emissions (Figure 1). First, IFRM can exert strong forestry ecological effects and have a strong positive effect on ecological environment restoration and forest renewal. Second, IFRM can promote the development of forestry resources and absorb harmful substances such as sulfur dioxide, nitrogen oxides, and particulate matter in the air [31]. Finally, IFRM also have a strong forestry carbon sink function. Specifically, forestry carbon sinks can enhance the enthusiasm of relevant stakeholders to participate in forest ecological protection and restoration and achieve sustainable utilization of forest resources. In addition, as the forestry carbon sink trading market gradually improves, it has promoted the development of related industries such as forest tourism, forest economy, and biomass energy, and enhanced the forest ecological benefits and regional green development [32]. Furthermore, we also explored the spillover effects of IFRM on haze pollution and carbon emissions.

2.2. Dependent Variable

(1) Haze pollution (Haze): Haze is a common state of air pollution, and PM2.5 is the “culprit” causing haze pollution [33,34]. Because PM2.5 has a small particle diameter, it is more harmful to human health and can easily induce respiratory diseases such as lung cancer and cardiovascular disease and has attracted widespread attention from all walks of life. Referring to the relevant literature [35], we use PM2.5 concentration to represent haze pollution. The accuracy of PM2.5 concentration raster data is 0.01° × 0.01° spatial resolution. We use ArcGIS 10.3 software to interpret it into provincial PM2.5 concentration to characterize haze pollution.
(2) Carbon emission (Carbon): The main source of carbon emissions is fossil fuels, which mainly include coal, oil, natural gas, etc. Fossil fuels are converted into carbon dioxide during the combustion process and enter the atmosphere, posing a serious threat to global climate change. We measure carbon intensity in the following way. Firstly, referring to the relevant literature [36,37], the carbon emission Cp of each province was calculated according to the carbon emission coefficient (Km) of eight energy sources (Table 1). Secondly, based on administrative region data, we used carbon emissions per unit area of each province/municipality to represent carbon emission intensity.
C P = m = 1 M = 8 E p m × K m A P
where Cp represents carbon emissions; Epm was the consumption of the mth energy in province/municipality p; K represents the carbon dioxide emission coefficient; Ap represents the land area of province/municipality p.

2.3. Independent Variable

Investment in forestry resource management (IFRM): forestry resources in the traditional sense refers to forests, trees and woodlands growing on forest land, as well as plants that depend on forests, trees and woodlands for survival [38]. These resources together constitute the forest ecosystem, which provides rich material and non-material support for human production and life. However, the traditional forestry resource evaluation indicators are difficult to reflect the quality of forestry resource development from multiple levels. The connotation of IFRM in this study is mainly that the development of forestry resources not only depends on the existing status of forestry resources (forest coverage rate, forest land area, forest area, etc.), but is also closely related to forestry economy and forestry governance. Therefore, this study mainly constructs the IFRM evaluation index system from three aspects: forestry economic, forestry status and forestry governance, and then comprehensively measures the development level of forest resources. Compared with the traditional indicators of forestry resources, the IFRM in this study is more comprehensive and can reflect the development quality of IFRM from multiple dimensions and levels. With reference to the relevant literature and combined with the connotation of forestry resource development, a forestry resource evaluation index system is constructed from three aspects: forestry economic, forestry status and forestry governance [39,40]. Meanwhile, the entropy method is used to assign weights to each indicator to comprehensively measure the level of China’s forestry resource development. Five indicators are used to describe the forestry economy, namely, annual growth rate of total forestry output value (%), proportion of forestry output value in GDP (%), forest land value per unit area (104 m2), per capita forestry output value (104 m2), and proportion of forestry investment in GDP (%). Forestry status includes five indicators, namely, forest coverage rate (%), per capita afforestation area (104 m2), volume per unit area (104 m2), forestry land area (104 m2), and forest area (104 m2). Forestry governance includes five indicators, namely, forestry pest control rate (%), forest fire area (104 m2), total standing stock of living trees (104 m2), forest pest area (104 m2), and disaster-affected forest area (104 m2). The components of the IFRM evaluation index system are defined in Table 2.
Referring to the relevant literature, we selected industrial structure (IS), urbanization rate (UR), foreign direct investment (FDI), economic development (ECO), population density (POP) and environmental regulation (ER) from 2008 to 2019 as control variables for this study [41,42]. (1) Industrial structure (IS): This study uses the ratio of the output value of the tertiary industry to the secondary industry to characterize the industrial structure; (2) Urbanization rate (UR): This study uses the proportion of urban permanent population to the total population to represent the urbanization rate; (3) Foreign direct investment (FDI): Referring to relevant studies, the proportion of foreign direct investment to GDP is used to represent FDI [43]; (4) Economic development (ECO): This study uses GDP per capita to represent the level of economic development; (5) Population density (POP): This study uses the ratio of resident population to administrative area to characterize population density; (6) Environmental regulation (ER): With reference to the relevant literature, the proportion of industrial pollution control investment to industrial added value (industrial enterprises have the remaining value after deducting the material products consumed or transferred in the production process) is used to represent environmental regulation [44].
Finally, we used R 4.4.0 language software to draw the correlation matrix between variables (Figure 2). We found that the distribution of Haze, Carbon, and ER variables was relatively even, while most of the other variables were skewed. In addition, there is a certain correlation between each variable and the explained variable, which also shows to a certain extent that the spatial econometric model selected in this study is more reasonable.

2.4. Data Source

This study takes China’s 30 provincial-level administrative regions as the research objects. The main data sources for this study are China Statistical Yearbook (https://data.cnki.net/yearBook/single?id=N2023110024, accessed on 10 January 2024), China Forestry Statistical Yearbook (https://www.forestry.gov.cn/c/www/tjnj.jhtml, accessed on 10 January 2024), China Energy Statistical Yearbook (https://data.cnki.net/yearBook/single?id=N2024050932, accessed on 10 January 2024), China Environment Statistical Yearbook (https://data.cnki.net/yearBook/single?id=N2024050561, accessed on 10 January 2024) and Forest Resources Inventory Bulletin (https://www.forestry.gov.cn/, accessed on 10 January 2024). Some missing data were supplemented by interpolation. PM2.5 concentration raster data from the Atmospheric Composition Analysis Group website (https://sites.wustl.edu/acag/, accessed on 10 January 2024).

2.5. Methods

2.5.1. Global Spatial Autocorrelation

Global spatial autocorrelation models are usually used to explore the spatial dependence and discrete trends of research objects. The basic idea of this model is that geographically adjacent objects may have certain spatial correlations, which weaken or disappear as the distance increases [45]. In this study, a global spatial autocorrelation model was used to examine the spatial autocorrelation characteristics of haze pollution and carbon emissions.
M o r a n s   I = n i w i j × i w i j ( x i x ¯ ) ( x j x ¯ ) i ( x i x ¯ ) 2
where xi and xj are the haze pollution concentration or carbon emission intensity of city i and j respectively; n is the number of cities; wij is the spatial weight matrix. The global Moran’s I value range is [−1, 1]. If Moran’s I is closer to 1, it means that the spatial autocorrelation of haze pollution or carbon emissions is stronger; if it is closer to −1, it indicates a higher degree of spatial dispersion; if it is equal to 0, it means there is no spatial correlation.

2.5.2. Spatial Econometric Model

Incorporating spatial elements into existing econometric models is both a continuation and a challenge to traditional econometrics. There are three main types of spatial econometric models. When the spatial dependence between the explanatory variables has a significant impact on the model, the spatial lag model (SLM) is used. When the error terms of the model are spatially correlated, the spatial error model (SEM) is used [46]. However, the spatial Durbin model (SDM) is an extension of SLM and SEM and can effectively solve the problem of spatial autocorrelation [47,48]. After a series of tests (Table 3), this study used SDM to capture the spatial effects of IFRM on haze pollution and carbon emissions.
H a z e i t = δ j = 1 n w i j H a z e i t + β 1 I F R M i t + β 2 I S i t + β 3 U R i t + β 4 F D I i t + β 5 E C O i t + β 6 P O P i t + β 7 E R i t + θ 1 j = 1 n w i j I F R M i t       + θ 2 j = 1 n w i j I S i t 2 + θ 3 j = 1 n w i j U R i t + θ 4 j = 1 n w i j F D I i t + θ 5 j = 1 n w i j E C O i t + θ 6 j = 1 n w i j P O P i t + θ 7 j = 1 n w i j E R i t + μ i t + ε i t
C a r b o n i t = δ j = 1 n w i j C a r b o n i t + β 1 I F R M i t + β 2 I S i t + β 3 U R i t + β 4 F D I i t + β 5 E C O i t + β 6 P O P i t + β 7 E R i t + θ 1 j = 1 n w i j I F R M i t       + θ 2 j = 1 n w i j I S i t 2 + θ 3 j = 1 n w i j U R i t + θ 4 j = 1 n w i j F D I i t + θ 5 j = 1 n w i j E C O i t + θ 6 j = 1 n w i j P O P i t + θ 7 j = 1 n w i j E R i t + μ i t + ε i t
where Hazeit and Carbonit represent the haze pollution concentration and carbon emission intensity of province i at time t, respectively; β1β7 represent the coefficients of explanatory variables; θ1θ7 represent the spatial autoregression coefficients of the exogenous variables; δ is the spatial autoregression coefficient; uit and εit represent the individual fixed effects and random error terms, respectively.

2.5.3. Spatial Weight Matrix

We first need to construct a spatial weight matrix before we can import the matrix into the spatial econometric model to measure the spatial spillover effects. The first law of geography states that geographically adjacent things affect each other [49,50]. The spatial weight matrix embeds geographical and economic factors into the econometric model, which can fully reflect the spatial correlation between economy and distance. This study comprehensively considers geographical and economic factors as well as the asymmetric relationship of economic distance between cities to construct an economic distance matrix (W1) and an asymmetric economic distance matrix (W2). The economic distance matrix not only considers the straight-line distance in geographical space, but also incorporates economic factors (GDP between regions) to more comprehensively measure the connection between spatial elements. The basic idea of the asymmetric economic distance matrix is to assume that regions with stronger economic strength will have a stronger impact on surrounding regions, while regions with weaker economic strength will have a weaker impact on surrounding regions.
W 1 = G D P i × G D P j d i j 2 , ( i j ) 0 , ( i = j )
W 2 = 1 / d i j × d i a g G D P i G D P j , ( i j ) 0 , ( i = j )
where GDPi and GDPj represent the actual GDP of city i and j, respectively; dij is the distance between administrative centers. diag is a diagonal matrix, a special matrix in which all elements outside the main diagonal are 0.

3. Results

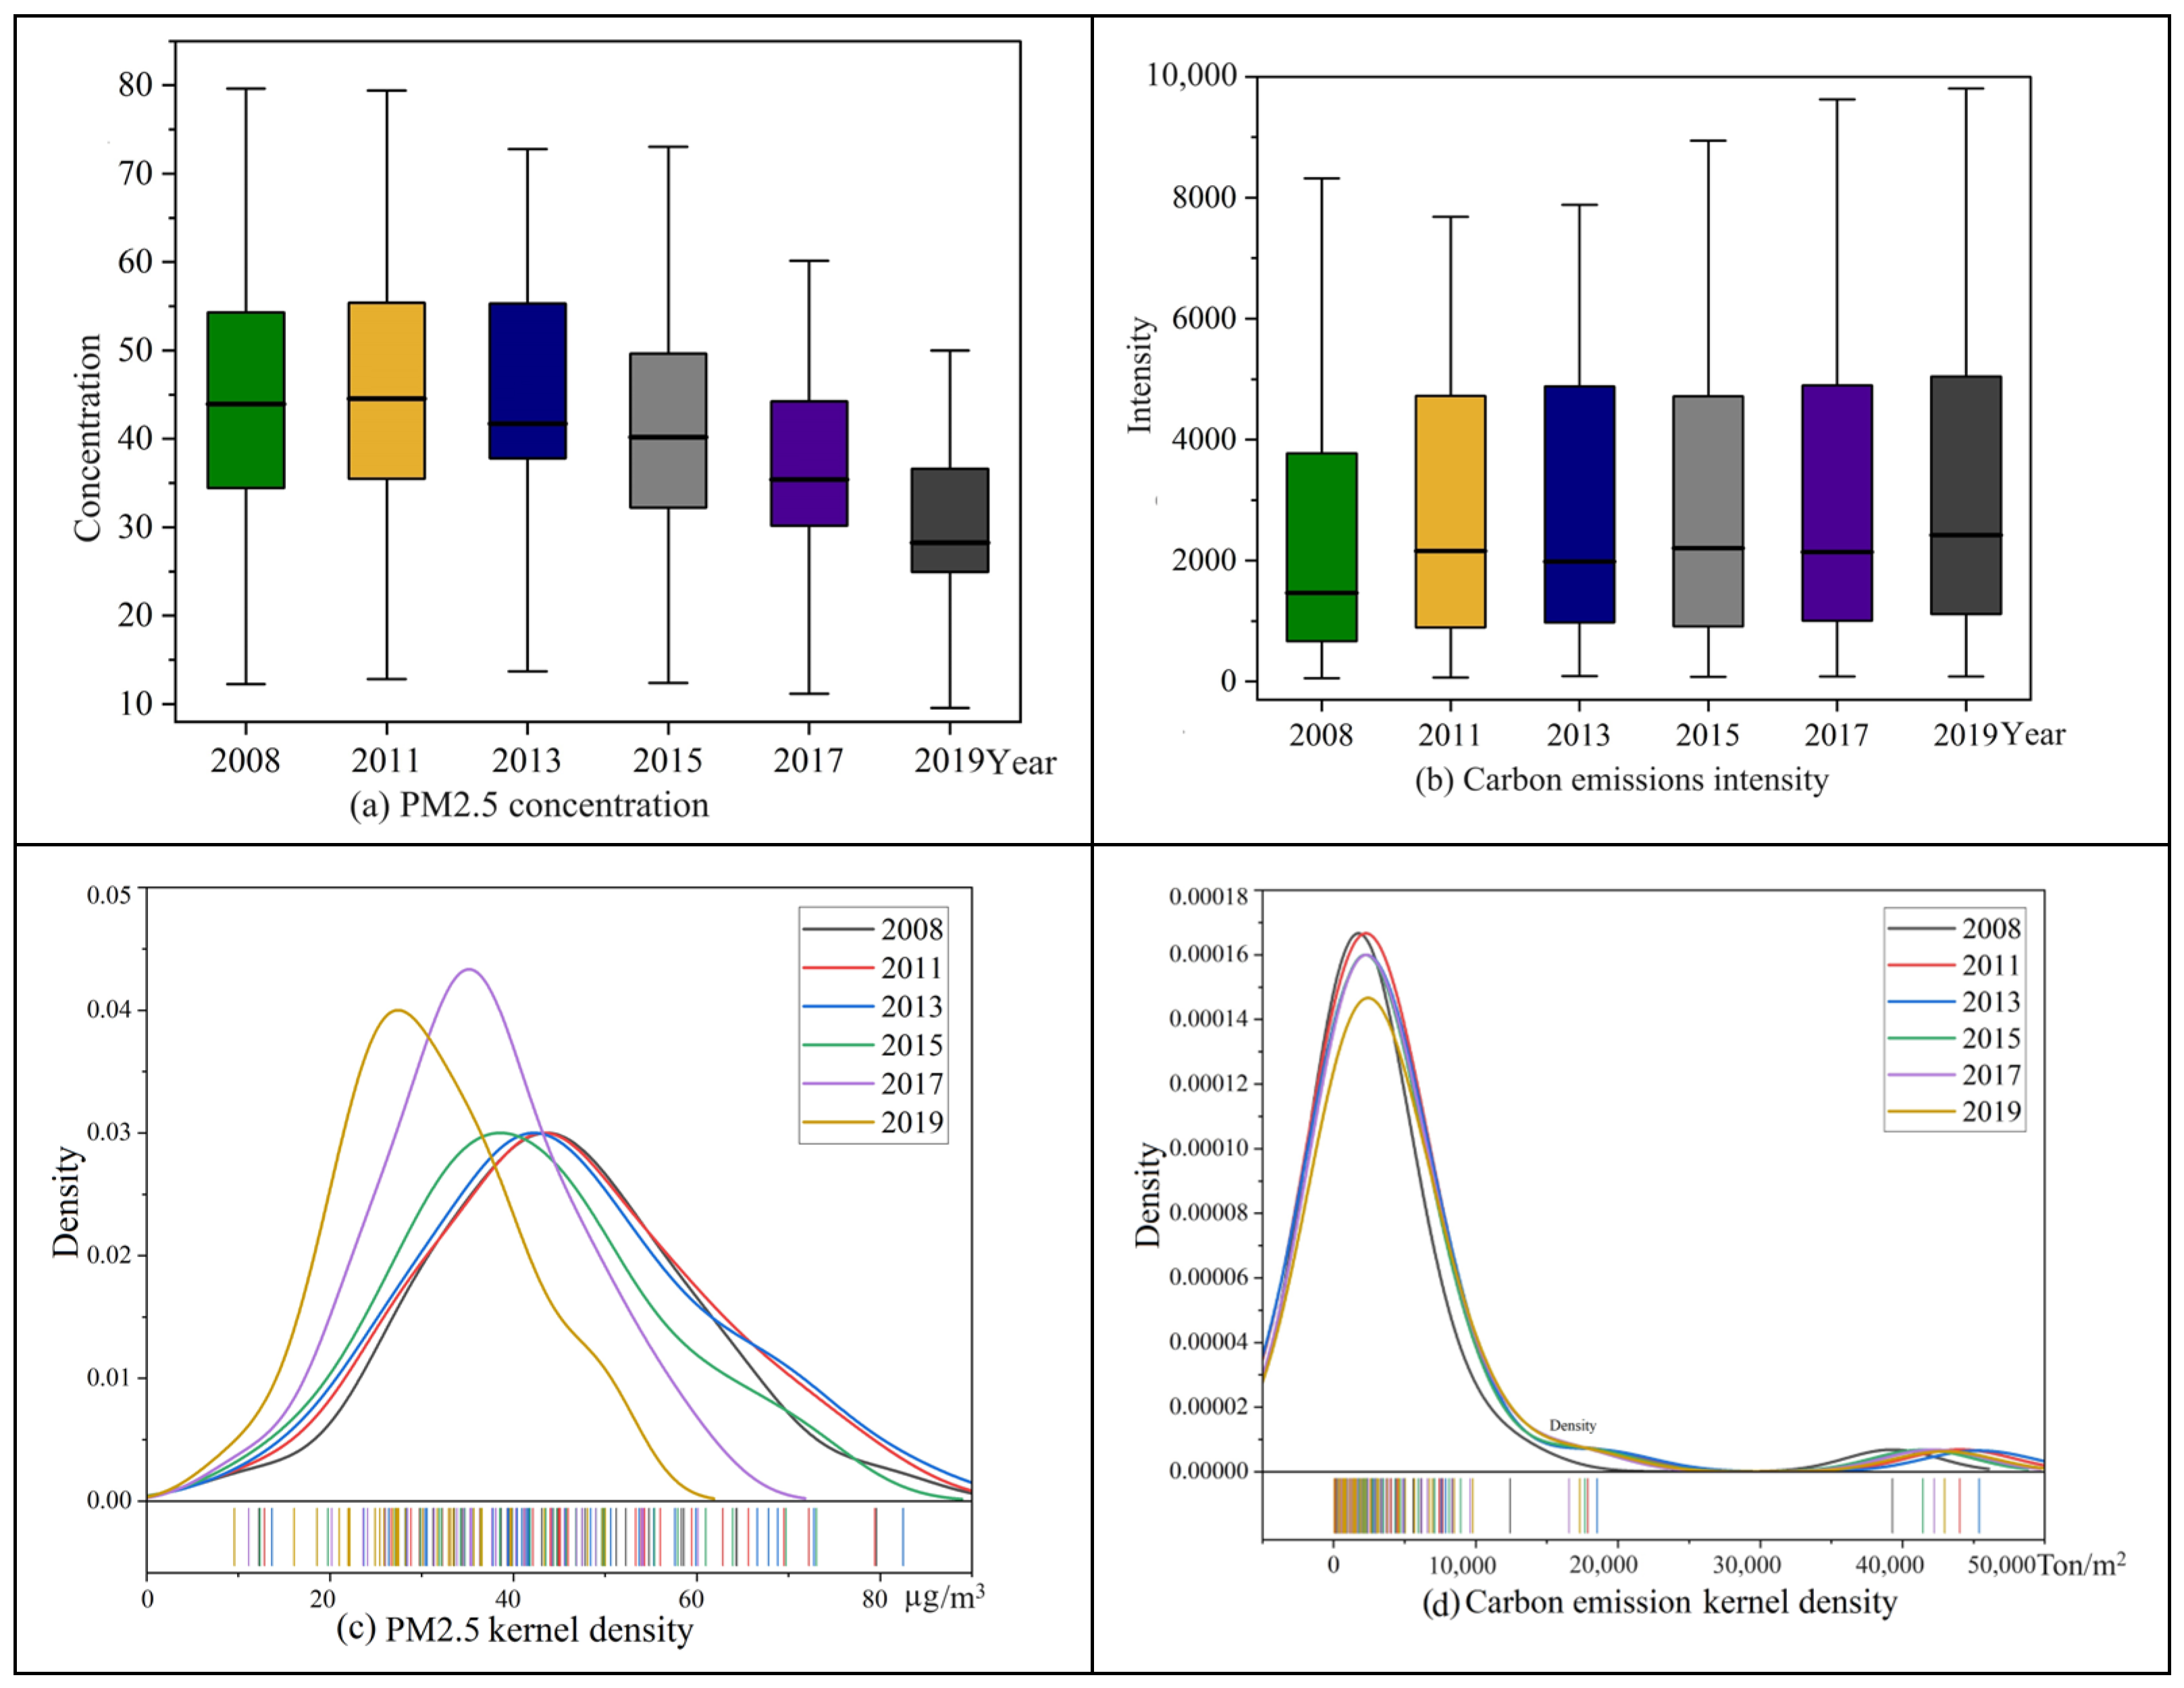
3.1. Temporal Evolution Characteristics

Overall, China’s average PM2.5 concentration dropped from 44.9 μg/m3 in 2008 to 30.8 μg/m3 in 2019 (Figure 3). Specifically, the average PM2.5 concentration in China showed an upward trend from 2008 to 2011, indicating that since the 2008 financial crisis, the extensive economic growth model has accelerated the development of high-energy-consuming and high-pollution industries. From 2015 to 2019, the average annual PM2.5 concentration decreased by about 12.11%, and the environmental quality in most regions of China improved significantly. In recent years, the Chinese government has advocated afforestation, reduced fossil fuel use, developed green energy and green transportation, and strengthened the control of various smoke and dust pollutants. In addition, in 2018, China promulgated the most stringent “Ambient Air Quality Standards”, added PM2.5 average concentration emission standards, and established an air pollution early warning system. China’s carbon emission intensity increased from 3729.6 Ton/m2 in 2008 to 4548.2 Ton/m2 in 2011, with an average annual increase of 7.31%. However, the growth rate of carbon emission intensity from 2011 to 2019 was relatively slow, indicating that the Chinese government has accelerated the green and low-carbon transformation through measures such as improving energy utilization efficiency and developing forestry carbon sinks.
Judging from the position of the kernel density of haze pollution, its kernel density peak showed an obvious left shift trend from 2008 to 2019, indicating that China’s haze pollution is on a downward trend. Judging from the peak degree of haze pollution, peaks were formed between 20 and 40 in 2017 and 2019, indicating that haze pollution was relatively low in most areas. Judging from the core density position of carbon emissions, its core density peak slowly shifted to the right from 2008 to 2019, indicating that the average carbon emission intensity in some regions has increased. In addition, the absolute difference in carbon emission intensity continues to expand, indicating that carbon emissions have strong temporal and spatial non-equilibrium distribution characteristics.

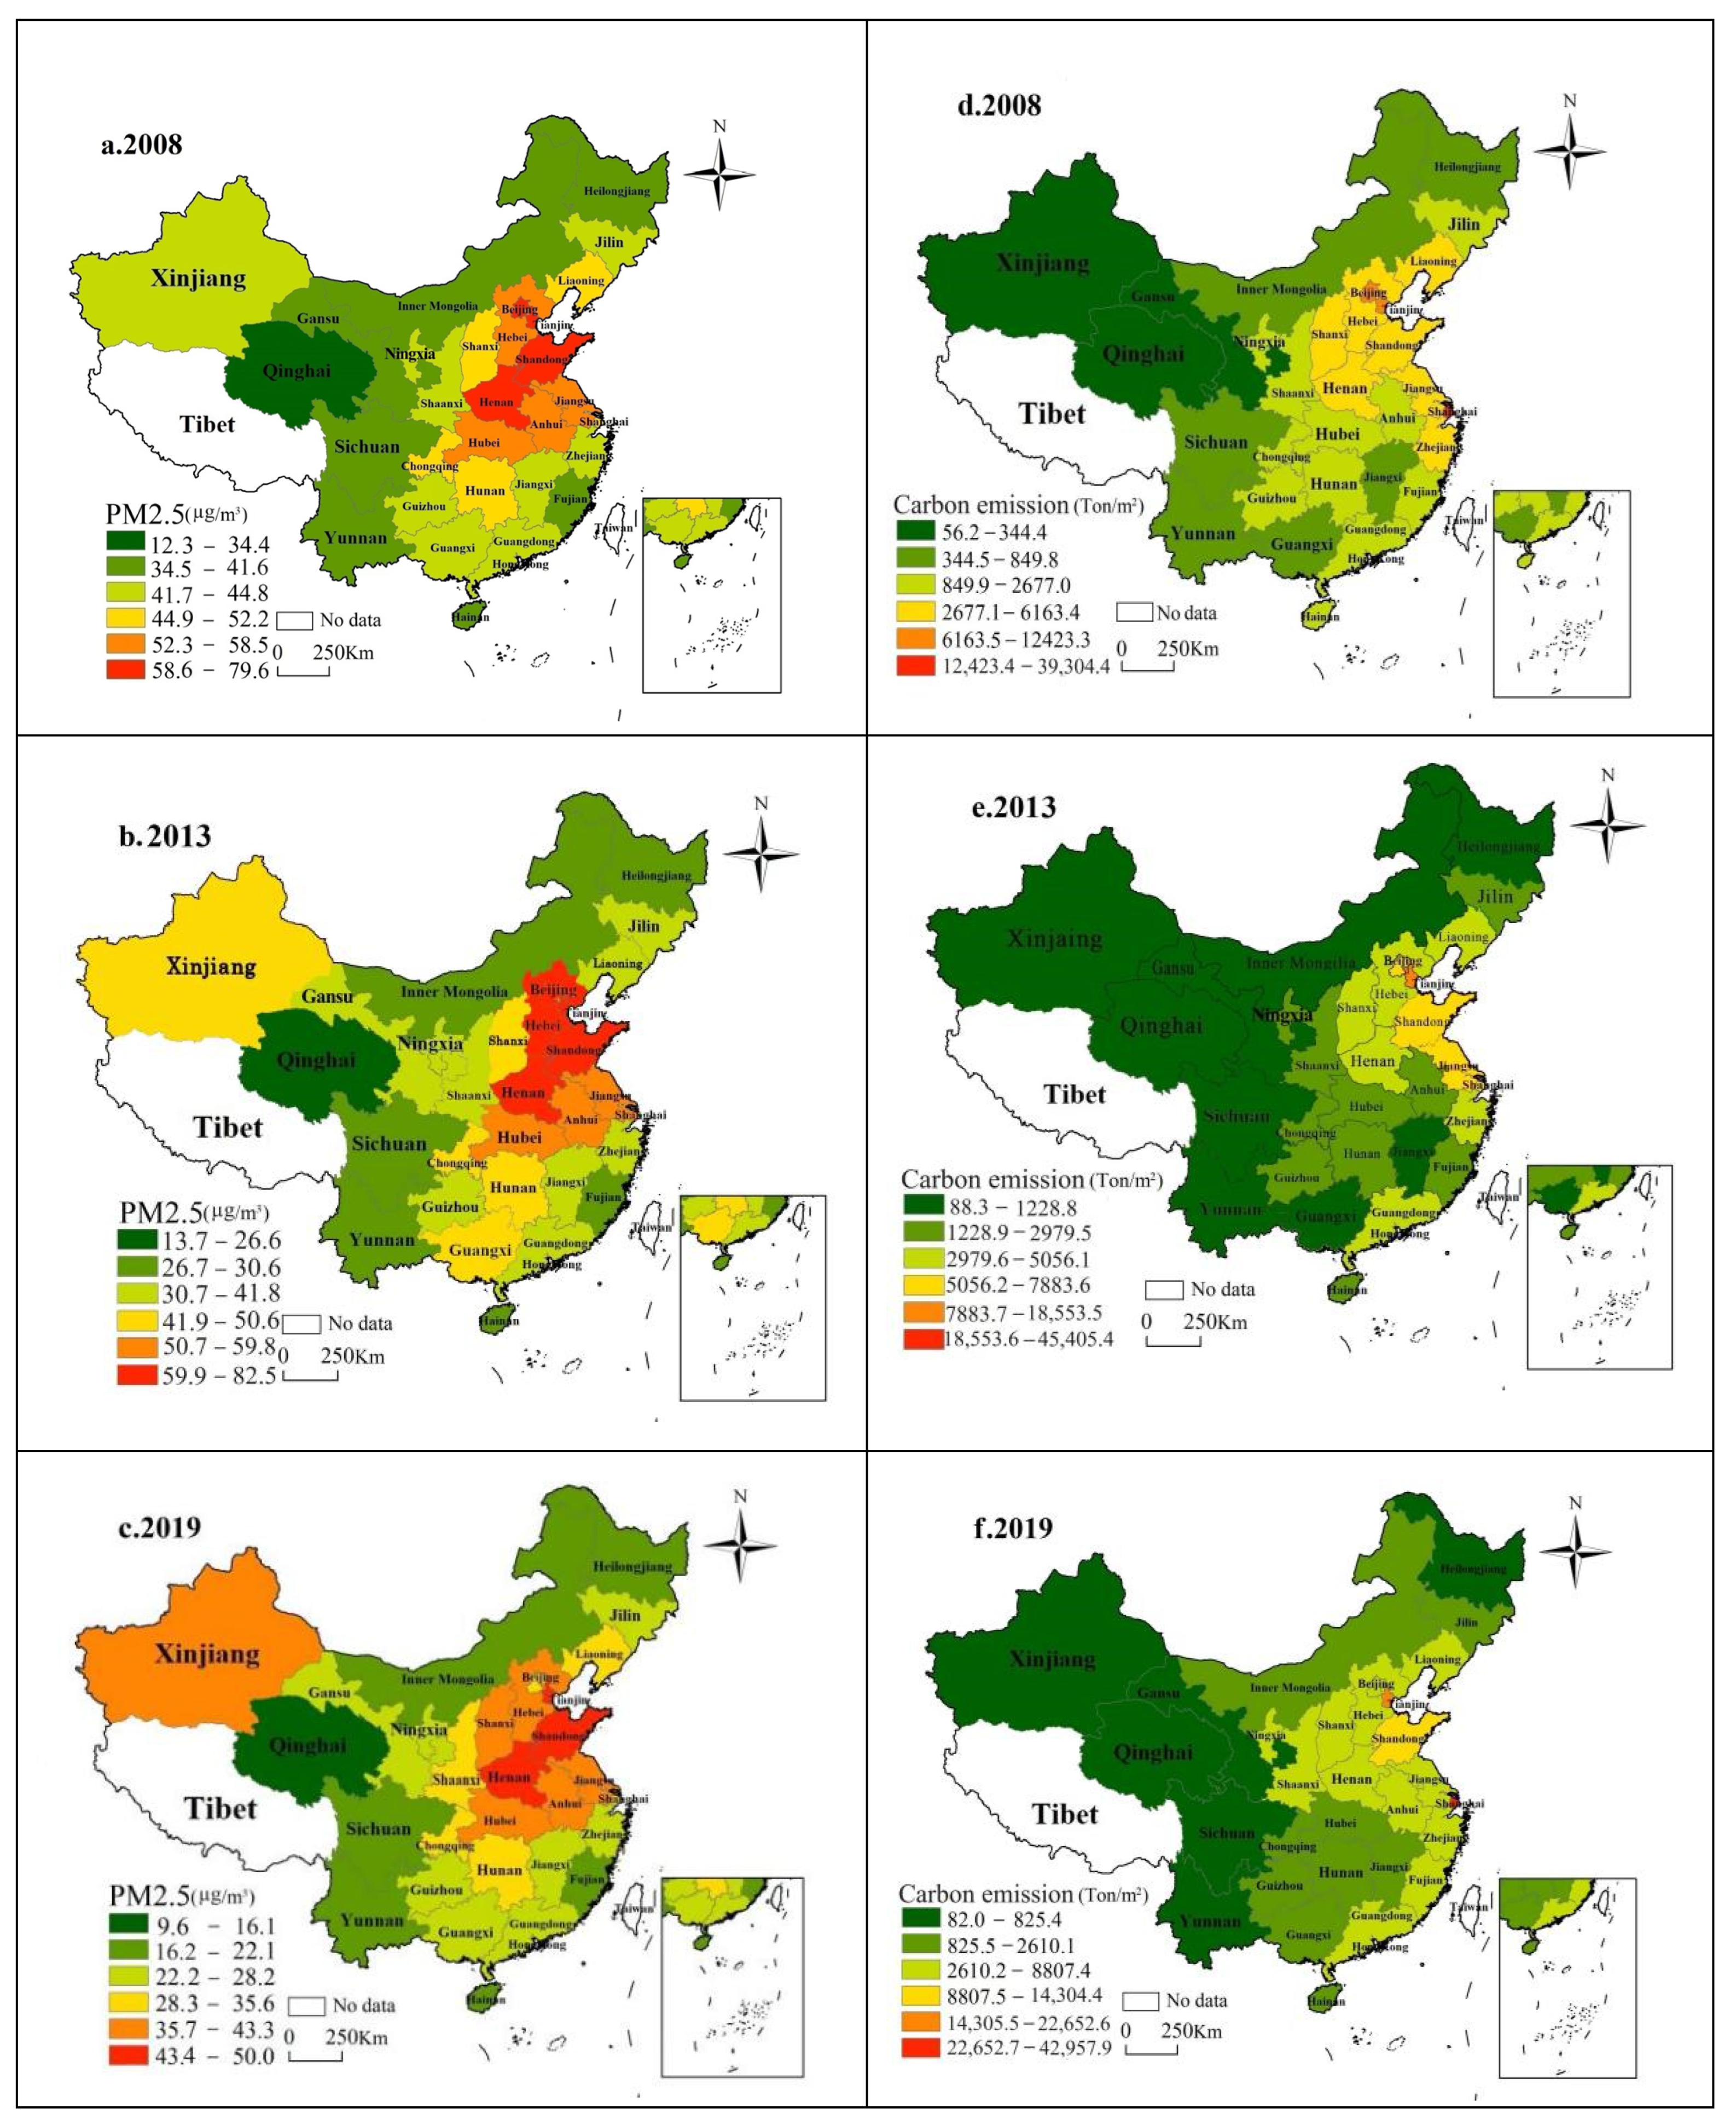
3.2. Spatial Evolution Characteristics

During the study period, the haze pollution in China showed obvious spatial aggregation effects (Figure 4). The areas with high haze concentration were mainly distributed in the Sichuan Basin, North China Plain and the middle and lower reaches of the Yangtze River Plain, while the areas with low haze concentration were mainly distributed in the northwest, southwest and northeast regions. On one hand, basins were prone to haze deposition due to their low-lying terrain, while plains lack forests and mountains to block haze, causing it to spread over a wider area; on the other hand, regions that are relatively rich in coal and mineral resources will find it difficult to escape the trap of the “resource curse” in the short term, exacerbating haze pollution. In addition, haze pollution showed a spatial pattern of spreading from provinces with higher haze pollution to surrounding provinces. However, the distribution range of China’s haze pollution continued to shrink over time, and the average concentration dropped from 44.9 µg/m3 in 2008 to 30.8 µg/m3 in 2019.
China’s carbon emission intensity showed a decreasing trend from the east to the west. In 2008, the carbon emission intensity in most areas along the eastern coast was relatively high, while the low-value areas were mainly concentrated in western regions such as Xinjiang, Gansu and Qinghai. From 2013 to 2019, the spatial scope of areas with high carbon emission intensity has significantly shrunk, and are mainly concentrated in Beijing, Tianjin, Shanghai and Shandong Province. This is mainly because Beijing, Shanghai and Tianjin have high population density and large energy consumption, which in turn produces more carbon emissions. In addition, the urbanization rate in some areas is high, the urban built-up area is large, while the proportion of green spaces such as forests and wetlands is relatively small, which is not conducive to carbon absorption and storage.

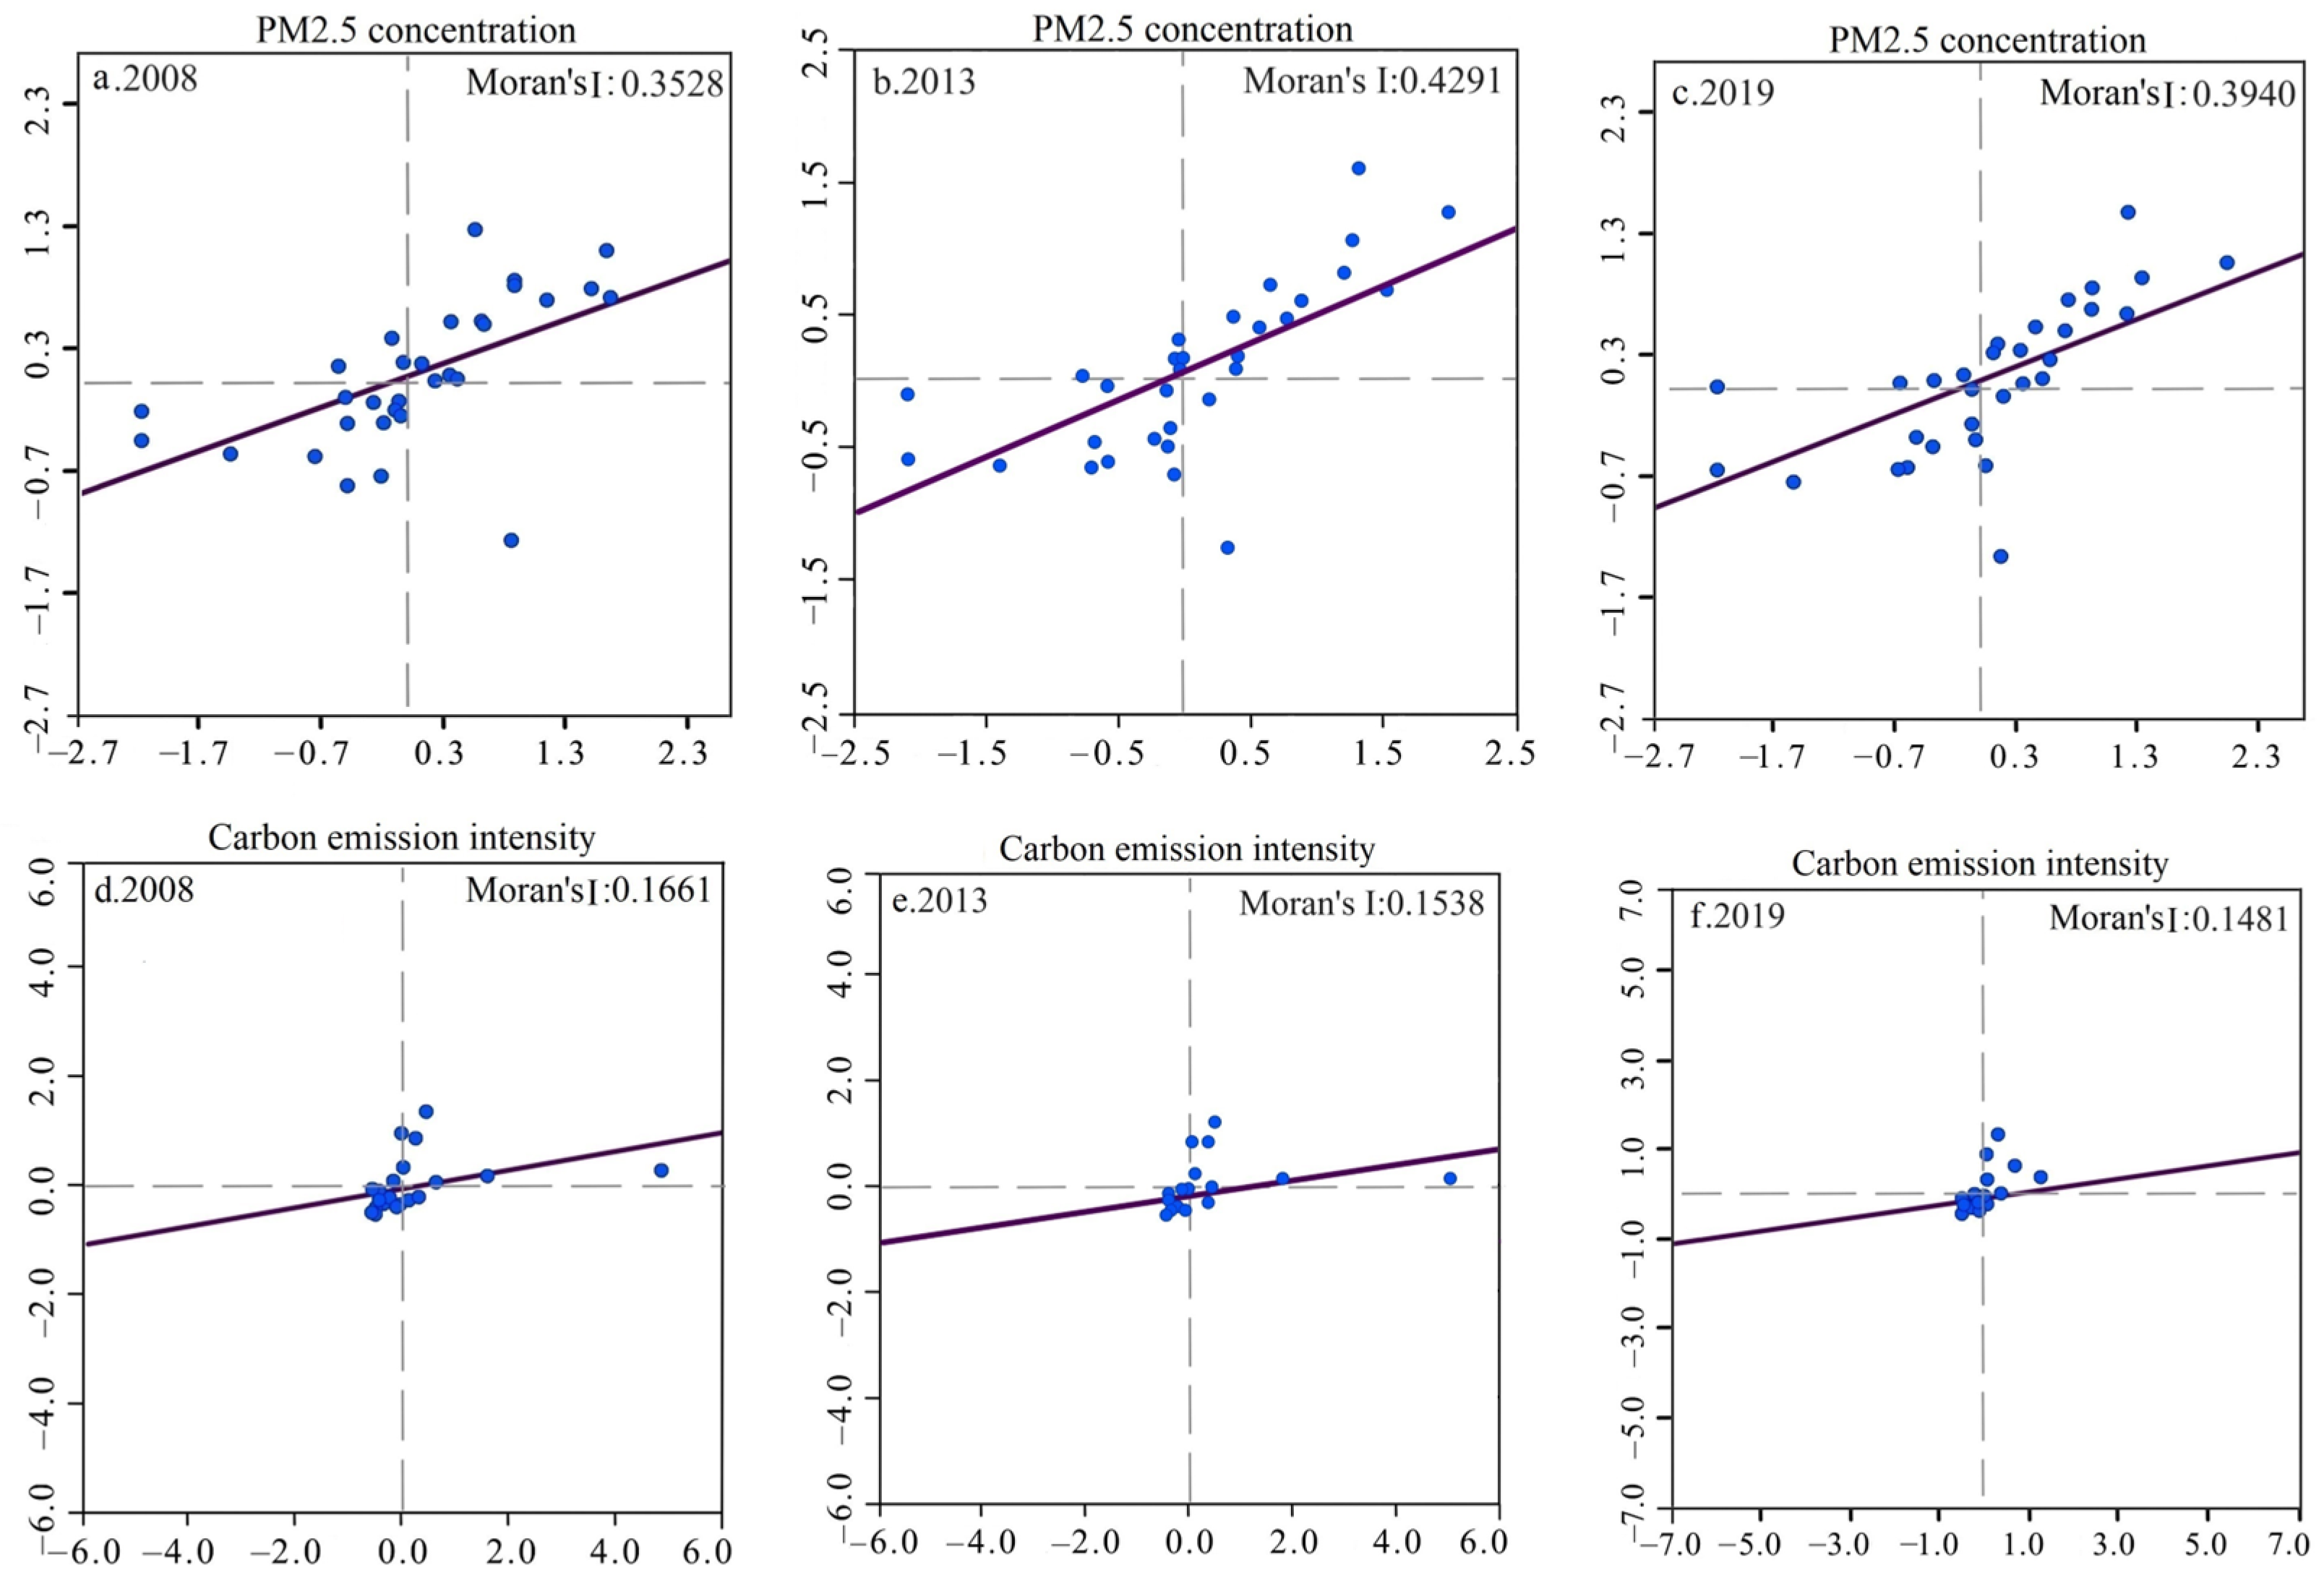
3.3. Spatial Correlation Characteristics

During the study period, the global Moran’s I index of China’s haze pollution and carbon emissions was significantly positive (p < 0.001), with strong spatial agglomeration and cross-regional spread characteristics (Figure 5). Among them, the global Moran’s I index of haze pollution and carbon emissions increased from 0.3528 and 0.148 in 2008 to 0.394 and 0.1661 in 2019, respectively. This phenomenon showed that haze pollution and carbon emissions have a wide diffusion range, strong mobility, and strong spatial spillover and correlation. It is difficult to fundamentally solve regional environmental pollution problems by relying solely on unilateral governance. Therefore, local governments need to improve their air pollution control capabilities, build a cross-regional collaborative governance mechanism, and effectively control pollution and reduce environmental governance costs. It is worth noting that the Moran’s I index of haze pollution rose from 0.3528 in 2008 to 0.4291 in 2013, and then fell to 0.3940 in 2019. This is mainly because with the implementation of energy-saving and emission-reduction policies, the spatial concentration of China’s carbon emission intensity has decreased, resulting in a decline in the global Moran’s I index in 2019.

3.4. Model Verification and Identification

Haze pollution and carbon emissions have a strong spatial correlation, and it is difficult to objectively evaluate the regression results of the traditional model. The spatial econometric model fully considers the spatial correlation between geographic spatial data and can effectively solve the “spatial missing” problem [46]. Before selecting a spatial econometric model, LM, Robust LM, Wald and LR tests should be performed. The results show that both LM and Robust LM tests significantly indicate that the spatial econometric model is suitable for this study. However, there are three types of spatial econometric models (spatial lag model, spatial error model, and spatial Durbin model). Therefore, Wald and LR tests are also used to determine which type of spatial econometric model is better. We found that Wald and LR rejected the null hypothesis that the spatial Durbin model can be transformed into a spatial lag model and a spatial error model at the 1% significance level, so SDM is more suitable for this study (Table 3).

3.5. Benchmark Regression Analysis

The results show that IFRM has a significant inhibitory effect on haze pollution and carbon emissions; that is, for every 1% increase in IFRM, haze pollution and carbon emissions decrease by 0.0655% and 0.1169%, respectively (Table 4). First of all, IFRM can effectively reduce particulate matter in the atmosphere and play a positive role in improving air quality and reducing haze pollution. Secondly, as a major component of the terrestrial ecosystem, forest is the largest carbon reservoir, which absorbs atmospheric carbon dioxide through photosynthesis, and has strong carbon fixation and carbon storage functions. Finally, forest carbon sequestration is mainly based on natural processes, which means it is low-cost and easy to implement compared to industrial carbon capture.
As for control variables, industrial structure reduces haze pollution and carbon emissions, but both failed to pass the significance test. This finding shows that China’s industry is currently in a stage of transformation and upgrading, and some regions are still mainly resource and labor intensive and have not formed a strong negative spatial effect on haze pollution and carbon emissions. Urbanization has significantly increased carbon emissions, but its impact on haze pollution is relatively weak. Urbanization has accelerated economic and social development, but it has also brought serious negative impacts, such as accelerated climate change, environmental pollution, and ecological damage. For every 1% increase in foreign direct investment, haze pollution and carbon emissions decreased significantly by 0.0267% and 0.0231%, respectively, indicating that foreign-invested enterprises have brought advanced production technology, environmental protection equipment and management experience, and improved total factor productivity. Population density significantly increases carbon emissions but reduces haze pollution. This is mainly because human activities have increased energy consumption, leading to increased carbon emissions, but population agglomeration has promoted the development of the sharing economy, thereby reducing pollution control costs and improving control efficiency. Environmental regulations have significantly reduced haze pollution and carbon emissions, indicating that appropriate environmental regulations are conducive to technological innovation, forcing companies to seek more efficient and environmentally friendly production methods and reduce pollutant emissions.

3.6. Spatial Spillover Effect

The results showed that for every 1% increase in IFRM, haze pollution in the local and neighboring areas decreased by 0.0826% and 0.5767%, respectively, both passing the significance test (Table 5). The finding provides sufficient evidence that forests block and absorb haze. In addition, for every 1% increase in IFRM, the carbon emission of local area decreases by 0.1133%, and that of neighboring areas increases by 0.0748%, but the latter fails the significance test. This finding suggests that the impact of IFRM on carbon emissions has a certain distance attenuation effect, which significantly reduces carbon emissions in local areas but has relatively little impact on neighboring areas.

3.7. Robustness Test

Generally, if the empirical results of a model remain stable under parameter changes, it indicates good robustness. With reference to the relevant literature [51], this study conducted robustness tests using three methods (Table 6). (1) Columns 1 and 4 in Table 6 are the regression results of replacing the economic distance matrix in the original model with the asymmetric economic distance matrix. (2) We use the explained variable lagged by one period (2008–2018) as the explanatory variable of the model to eliminate the influence of the current period. Columns 2 and 5 of Table 6 are the regression results using the lagged terms of the explained variables as the SDM explanatory variables. (3) We use principal component analysis to replace the entropy method to remeasure the level of forestry resource development, which can not only reduce the number of indicators but also reflect the main information of the original indicators. The results show that the negative effects of forest resources on haze pollution and carbon emissions are still significant after replacing the spatial weight matrix. In addition, the lag term of the explained variable is significantly positive. Finally, the remeasured forest resource index coefficients and significance levels were basically consistent with the benchmark regression model, further verifying the reliability of the main conclusions of this study.

4. Discussion

As an important ecological barrier, exploring the impact of IFRM on haze pollution and carbon emissions not only provides a scientific basis for strengthening forestry resource management, but also has important significance for pollution prevention and control. First, we found that China’s haze pollution and carbon emissions have strong spatiotemporal heterogeneity and spatial dependence. This finding is similar to that of Hao et al., who found that China’s haze pollution has a strong non-balanced distribution characteristic based on a long-term remote sensing dataset [52]. In addition, we measured China’s carbon emission intensity based on carbon emission data from eight types of energy and found that carbon emission intensity shows a decreasing trend from the east to the central and western regions. During the study period, the Moran’s I index of haze pollution and carbon emissions was significantly positive, indicating that haze pollution and carbon emissions have strong spatial correlation characteristics, which brings some new insights to environmental governance. Local governments should adopt a regional joint prevention and control strategy and establish a cross-regional pollution control mechanism based on the spatial diffusion characteristics of haze pollution and carbon emissions. It is worth noting that haze concentrations in most regions decreased significantly during the study period, while carbon emission intensity continued to fluctuate. For a long time, haze pollution has led to deterioration of air quality, water quality and soil pollution, posing a serious threat to the survival and health of residents. The Chinese government has repeatedly promulgated laws and regulations emphasizing the comprehensive prevention and control of air pollution from coal burning, industry, motor vehicles and ships, dust, agriculture, etc., striving to strengthen pollution control from the policy level. As for carbon emissions, with the rapid increase in China’s energy demand and the continuous development of industrialization and urbanization, carbon emission intensity will remain at a relatively high level in the future.
Secondly, we used the SDM model to find that IFRM significantly reduced haze pollution and carbon emissions, which is consistent with existing research. Waheed et al. used time series data from 1990 to 2014 and an autoregressive distributed lag model to demonstrate that Pakistan’s forestry resources have a strong negative impact on carbon emissions and advocated reducing carbon emissions by expanding forest area [53]. Rahman et al. used time series data and econometric models to find that in the long run, for every 1% increase in forest resources, India’s carbon footprint was significantly reduced by 1.84% [54]. Nowak et al. used 86 Canadian cities in 2010 as case studies to demonstrate that urban trees can remove air pollution, sequester carbon, and reduce temperatures [55]. However, most previous studies only used forest area to evaluate the level of forestry resource development, which is difficult to comprehensively reflect the quality of forestry resource development. This study constructed a forestry resource evaluation index system from three levels: forestry economy, forestry status and forestry governance, and combined the spatial Durbin model to examine the impact of IFRM on haze pollution and carbon emissions, which improved the accuracy of the estimation results.
Third, we further explored the impact of the remaining control variables in this study on haze pollution and carbon emissions. Specifically, the industrial structure has not significantly reduced haze pollution and carbon emissions, which shows that China’s current industrial structure is still relatively low, and most regions are mainly concentrated with energy- and pollution-intensive enterprises. For every 1% increase in urbanization level, carbon emission intensity increases by 0.8419%, indicating that a large amount of energy is consumed in the urbanization process, thereby increasing carbon emissions. Similarly, Sun et al. also believed that China’s early urbanization increased carbon emission intensity [56]. Foreign direct investment has significantly reduced haze pollution and carbon emissions, indicating that foreign-invested enterprises have brought advanced technology and experience to reduce environmental pollution in the production process. Population density is significantly positively correlated with carbon emissions, indicating that large population concentration increases energy consumption and dependence on private transportation. For every 1% increase in environmental regulation, haze pollution and carbon emissions decreased by 0.0129% and 0.022%, respectively, indicating that environmental regulation has prompted some high-pollution and high-energy-consuming enterprises to transform and upgrade, thereby reducing haze pollution and carbon emissions. Similarly, Wu et al. demonstrated that environmental regulation effectively curbed the growth of carbon emissions in eastern and central China [57]. It is worth mentioning that we found that annual growth rate of total forestry output value, volume per unit area and forest pest area have large weights in the IFRM evaluation index system, which indicates that local governments should promote the development of forestry resources by implementing measures such as cultivating forestry resources, developing forestry industries, and strengthening forestry pest and disease control.
Finally, we found that IFRM significantly reduced haze pollution in neighboring areas, but had a relatively weak impact on carbon emissions, which is different from existing studies. Previous studies have mainly explored the impact of IFRM on haze pollution and carbon emissions, but often ignored the spatial spillover effects [58,59]. However, since haze pollution and carbon emissions have the characteristics of cross-regional diffusion, IFRM not only has a strong negative effect on haze pollution and carbon emissions in local areas, but also have a certain impact on neighboring areas. This study incorporates IFRM, haze pollution and carbon emissions into a unified analytical framework, and comprehensively explores the spatial spillover effects of IFRM on haze pollution and carbon emissions, which is more in line with reality.
The research results show that forest resources can effectively restrain haze pollution and carbon emissions, which is of great significance to the management of forest resources and environmental changes in China and the world. In terms of policy implications, our research results show that forestry resources play an important role in coping with climate change and improving air quality. First of all, the international community should strengthen cooperation and jointly promote the development of forestry carbon sequestration projects. Developed countries should help developing countries to carry out afforestation, forest restoration and other projects by providing financial and technical support. In addition, governments should strengthen policy coordination and jointly formulate and implement environmental protection laws and regulations to ensure the sustainable utilization and protection of forestry resources. Finally, exploring the spatial effects of forestry resources on carbon emissions and haze pollution in China will also help to promote green economy and sustainable development. Governments around the world can develop policies to encourage and support the development of green industries, such as biomass energy and forestry carbon sink trading.
In terms of practical application, the role of forestry resources as one of the largest carbon sinks on the earth is self-evident. Exploring the spatial effects of forestry resources on carbon emissions and haze pollution in China not only provides reference for ecological environment protection in China, but also provides reference for forestry resources management and ecological environment protection in other countries. For example, developing countries such as India and Pakistan have caused great damage to forestry resources while developing urbanization, and this study can provide important reference for scientific management of forestry resources.
The limitations of this study are that haze pollution and carbon emissions are the result of the interaction between human activities and other natural factors. The formation and dissipation of haze pollution and carbon emissions are not only related to IFRM, but are also difficult to separate from factors such as automobile exhaust, energy structure, and waste incineration. In the future, we should combine ground-based meteorological observation data, high-altitude detection data and environmental-pollutant observation data to further explore the impact of natural and climate factors such as precipitation, evaporation, wind direction and speed, temperature, air pressure, and relative humidity on haze pollution and carbon emissions. In addition, how to build a reasonable forestry resource development evaluation index system and accurately measure the dynamic evolution of IFRM requires further study.
The above research conclusions provide important support for policy makers and forestry resource management.
(1)
Strengthen the supervision and management of IFRM and promote the sustainable development of forestry. For a long time, due to the extensive and loose forestry development mode and the lack of awareness of forest resources protection, forest resources in some areas of China are in crisis, and ecological problems occur frequently in forestry. Local governments should formulate relevant laws and regulations, strengthen publicity on forest resource protection, prevent deforestation and illegal logging, and increase the cost for those who destroy forest resources. In addition, it is necessary to establish a forestry ecological evaluation and management mechanism, make timely and scientific judgments on the forestry ecological status, and improve the forest resource protection system.
(2)
Introduce market mechanisms to accelerate the development of forestry carbon sinks. The Chinese government has proposed that the national forest coverage rate will reach 24.1% in 2025 and about 25% in 2030, indicating that China has a huge forest carbon sink market. The key to constructing a forestry carbon sink market is to cultivate market demand and to encourage and guide multiple entities to participate in market supply. On the one hand, conduct forest ecosystem carbon sink surveys and carbon stock assessments, and establish an ecosystem carbon sink monitoring and accounting system. On the other hand, local governments should guide multiple entities to actively participate in forestry carbon sink projects and continuously improve the forestry carbon sink trading laws and regulations.
(3)
Establish a joint prevention and control mechanism and social participation mechanism for haze pollution and carbon emissions. Our research shows that haze pollution and carbon emissions have strong spatial autocorrelation and cross-regional diffusion characteristics. Therefore, it is necessary to break through administrative divisions, abandon the concept of “local protectionism” and form a joint force of pollution control. In addition, a diversified ecological compensation system should be established to coordinate the imbalance of interests among relevant stakeholders. Finally, through tax breaks and financial subsidies, enterprises and individuals are encouraged to participate in environmental protection to raise public awareness of environmental protection.

5. Conclusions

During the study period, haze pollution in China has strong regional heterogeneity and spatial agglomeration effect. Areas with higher haze pollution concentrations are mainly distributed in the Sichuan Basin and the North China Plain, while low-value areas are mainly distributed in the northwest, southwest and northeast regions. However, haze concentrations in most areas have shown a clear downward trend over time, indicating that China’s air quality is continuing to improve. China’s carbon emission intensity shows a decreasing trend from the east to the central and western regions and has a certain core-periphery spatial structure.
In addition, we found that IFRM significantly reduced haze pollution and carbon emissions, which provides an important reference for formulating reasonable forestry resource management policies. It is worth mentioning that we found that IFRM not only significantly reduced the haze pollution in the local area, but also had a strong negative effect on the haze pollution in the neighboring areas. Finally, we prove the robustness of the above main conclusions by replacing the spatial weight matrix and setting variable lag terms.

Author Contributions

Conceptualization, Z.D. and Y.Z.; methodology, L.W. and Y.Z.; formal analysis, Z.D. and Y.Z.; writing—review and editing, Z.D. and A.S.; visualization, Z.D.; supervision, F.Z. All authors have read and agreed to the published version of the manuscript.

Funding

This study was funded by the National Natural Science Foundation of China (31872230) and the Anhui Normal University Research Fund (762370).

Data Availability Statement

The original contributions presented in the study are included in the article, further inquiries can be directed to the corresponding author.

Conflicts of Interest

The authors declare no conflicts of interest.

References

  1. Rehman, A.; Ulucak, R.; Murshed, M.; Ma, H.; Işık, C. Carbonization and atmospheric pollution in China: The asymmetric impacts of forests, livestock production, and economic progress on CO2 emissions. J. Environ. Manag. 2021, 294, 113059. [Google Scholar] [CrossRef] [PubMed]
  2. Rehman, A.; Ma, H.; Ahmad, M.; Irfan, M.; Traore, O.; Chandio, A.A. Towards environmental Sustainability: Devolving the influence of carbon dioxide emission to population growth, climate change, Forestry, livestock and crops production in Pakistan. Ecol. Indic. 2021, 125, 107460. [Google Scholar] [CrossRef]
  3. Yang, H.; Gan, T.; Liang, W.; Liao, X. Can policies aimed at reducing carbon dioxide emissions help mitigate haze pollution? An empirical analysis of the emissions trading system. Environ. Dev. Sustain. 2022, 24, 1959–1980. [Google Scholar] [CrossRef]
  4. Chen, L.; Li, K.; Chen, S.; Wang, X.; Tang, L. Industrial activity, energy structure, and environmental pollution in China. Energy Econ. 2021, 104, 105633. [Google Scholar] [CrossRef]
  5. Zhang, Y.; Wang, L.; Tang, Z.; Zhang, K.; Wang, T. Spatial effects of urban expansion on air pollution and eco-efficiency: Evidence from multisource remote sensing and statistical data in China. J. Clean. Prod. 2022, 367, 132973. [Google Scholar] [CrossRef]
  6. Chien, F.; Sadiq, M.; Nawaz, M.A.; Hussain, M.S.; Tran, T.D.; Le Thanh, T. A step toward reducing air pollution in top Asian economies: The role of green energy, eco-innovation, and environmental taxes. J. Environ. Manag. 2021, 297, 113420. [Google Scholar] [CrossRef]
  7. Zhang, H.; Li, S. Carbon emissions’ spatial-temporal heterogeneity and identification from rural energy consumption in China. J. Environ. Manag. 2022, 304, 114286. [Google Scholar] [CrossRef]
  8. Ye, W.F.; Ma, Z.Y.; Ha, X.Z. Spatial-temporal patterns of PM2.5 concentrations for 338 Chinese cities. Sci. Total Environ. 2018, 631, 524–533. [Google Scholar] [CrossRef]
  9. Mishra, A.; Humpenöder, F.; Churkina, G.; Reyer, C.P.; Beier, F.; Bodirsky, B.L.; Schellnhuber, H.J.; Lotze-Campen, H.; Popp, A. Land use change and carbon emissions of a transformation to timber cities. Nat. Commun. 2021, 13, 4889. [Google Scholar] [CrossRef]
  10. Tubiello, F.N.; Conchedda, G.; Wanner, N.; Federici, S.; Rossi, S.; Grassi, G. Carbon emissions and removals from forests: New estimates, 1990–2020. Earth Syst. Sci. Data 2021, 13, 1681–1691. [Google Scholar] [CrossRef]
  11. Ouyang, X.; Shao, Q.; Zhu, X.; He, Q.; Xiang, C.; Wei, G. Environmental regulation, economic growth and air pollution: Panel threshold analysis for OECD countries. Sci. Total Environ. 2019, 657, 234–241. [Google Scholar] [CrossRef] [PubMed]
  12. Raihan, A.; Muhtasim, D.A.; Pavel, M.I.; Faruk, O.; Rahman, M. Dynamic impacts of economic growth, renewable energy use, urbanization, and tourism on carbon dioxide emissions in Argentina. Environ. Process. 2022, 9, 38. [Google Scholar] [CrossRef]
  13. Lin, Y.; Yang, X.; Li, Y.; Yao, S. The effect of forest on PM2.5 concentrations: A spatial panel approach. For. Policy Econ. 2020, 118, 102261. [Google Scholar] [CrossRef]
  14. Liu, J.; Coomes, D.A.; Gibson, L.; Hu, G.; Liu, J.; Luo, Y.; Wu, C.; Yu, M. Forest fragmentation in China and its effect on biodiversity. Biol. Rev. 2019, 94, 1636–1657. [Google Scholar] [CrossRef]
  15. Liu, S.; Ding, Z.; Lin, Y.; Yao, S. The efficiency of forest management investment in key state-owned forest regions under the carbon neutral target: A case study of Heilongjiang Province, China. Forests 2022, 13, 609. [Google Scholar] [CrossRef]
  16. Nolander, C.; Lundmark, R. A Review of Forest Ecosystem Services and Their Spatial Value Characteristics. Forests 2024, 15, 919. [Google Scholar] [CrossRef]
  17. Ameray, A.; Bergeron, Y.; Valeria, O.; Montoro Girona, M.; Cavard, X. Forest carbon management: A review of silvicultural practices and management strategies across boreal, temperate and tropical forests. Curr. For. Rep. 2021, 7, 245–266. [Google Scholar] [CrossRef]
  18. Lewis, S.L.; Wheeler, C.E.; Mitchard, E.T.; Koch, A. Regenerate natural forests to store carbon. Nature 2019, 568, 25–28. [Google Scholar] [CrossRef]
  19. Chandio, A.A.; Akram, W.; Ahmad, F.; Ahmad, M. Dynamic relationship among agriculture-energy-forestry and carbon dioxide (CO2) emissions: Empirical evidence from China. Environ. Sci. Pollut. Res. 2020, 27, 34078–34089. [Google Scholar] [CrossRef]
  20. Lee, A.; Jeong, S.; Joo, J.; Park, C.R.; Kim, J.; Kim, S. Potential role of urban forest in removing PM2.5: A case study in Seoul by deep learning with satellite data. Urban Clim. 2021, 36, 100795. [Google Scholar] [CrossRef]
  21. Verkerk, P.J.; Costanza, R.; Hetemäki, L.; Kubiszewski, I.; Leskinen, P.; Nabuurs, G.J.; Potočnik, J.; Palahí, M. Climate-smart forestry: The missing link. For. Policy Econ. 2020, 115, 102164. [Google Scholar] [CrossRef]
  22. Liu, Z.; He, N.; Wang, C.; Qu, C. Analysis of the Cutting Strategy of Five Different Tree Species Targeting Carbon Sequestration. Forests 2023, 14, 238. [Google Scholar] [CrossRef]
  23. Chen, Z.; Dayananda, B.; Du, H.; Zhou, G.; Wang, G. Assessing Carbon Sequestration Potential in State-Owned Plantation Forests in China and Exploring Feasibility for Carbon Offset Projects. Forests 2024, 15, 886. [Google Scholar] [CrossRef]
  24. Zhao, S.; Shi, W.; Qiao, F.; Wang, C.; An, Y.; Zhang, L. Temporal and Spatial Changes and Trend Predictions of Forest Carbon Sequestration Efficiency in China Based on the Carbon Neutrality Goal. Forests 2023, 14, 2387. [Google Scholar] [CrossRef]
  25. Zhu, C.; Przybysz, A.; Chen, Y.; Guo, H.; Chen, Y.; Zeng, Y. Effect of spatial heterogeneity of plant communities on air PM10 and PM2. 5 in an urban forest park in Wuhan, China. Urban For. Urban Green 2019, 46, 126487. [Google Scholar] [CrossRef]
  26. Zheng, Y.; Li, S.; Zou, C.; Ma, X.; Zhang, G. Analysis of PM2.5 concentrations in Heilongjiang Province associated with forest cover and other factors. J. For. Res. 2019, 30, 269–276. [Google Scholar] [CrossRef]
  27. Parsa, V.A.; Salehi, E.; Yavari, A.R.; van Bodegom, P.M. Analyzing temporal changes in urban forest structure and the effect on air quality improvement. Sustain. Cities Soc. 2019, 48, 101548. [Google Scholar] [CrossRef]
  28. Xing, Y.; Brimblecombe, P. Trees and parks as “the lungs of cities”. Urban For. Urban Green 2020, 48, 126552. [Google Scholar] [CrossRef]
  29. Grammatikopoulou, I.; Vačkářová, D. The value of forest ecosystem services: A meta-analysis at the European scale and application to national ecosystem accounting. Ecosyst. Serv. 2021, 48, 101262. [Google Scholar] [CrossRef]
  30. Arantes, B.L.D.; Mauad, T. Urban forests, air quality and health: A systematic review. Int. For. Rev. 2019, 21, 167–181. [Google Scholar] [CrossRef]
  31. Mbeche, R.; Ateka, J.; Herrmann, R.; Grote, U. Understanding forest users’ participation in participatory forest management (PFM): Insights from Mt. Elgon forest ecosystem, Kenya. For. Policy Econ. 2021, 129, 102507. [Google Scholar] [CrossRef]
  32. Chang, L.; Wu, Z.; Xu, J. A comparison of haze pollution variability in China using haze indices based on observations. Sci. Total Environ. 2020, 715, 136929. [Google Scholar] [CrossRef] [PubMed]
  33. Hu, C.; Chen, J.; Dong, J. Impact of City Forests on Haze Reduction—Implementation of the National Forest City Policy in China. Forests 2023, 14, 703. [Google Scholar] [CrossRef]
  34. Gan, T.; Yang, H.; Liang, W. How do urban haze pollution and economic development affect each other? Empirical evidence from 287 Chinese cities during 2000–2016. Sustain. Cities Soc. 2021, 65, 102642. [Google Scholar] [CrossRef]
  35. Sheng, Q.; Ji, Y.; Zhou, C.; Zhang, H.; Zhu, Z. Spatiotemporal Variation and Pattern Analysis of Air Pollution and Its Correlation with NDVI in Nanjing City, China: A Landsat-Based Study. Forests 2023, 14, 2106. [Google Scholar] [CrossRef]
  36. Wang, Y.Q.; Tan, D.M.; Zhang, J.T.; Meng, N.; Han, B.L.; Ouyang, Z.Y. The impact of urbanization on carbon emissions: Analysis of panel data from 158 cities in China. Acta Ecol. Sin. 2020, 40, 7897–7907. [Google Scholar]
  37. Li, J.; Li, S. Energy investment, economic growth and carbon emissions in China—Empirical analysis based on spatial Durbin model. Energy Policy 2020, 140, 111425. [Google Scholar] [CrossRef]
  38. Okumu, B.; Muchapondwa, E. Determinants of successful collective management of forest resources: Evidence from Kenyan Community Forest Associations. For. Policy Econ. 2020, 113, 102122. [Google Scholar] [CrossRef]
  39. Zhang, Y.; Shen, W.; Li, M.; Lv, Y. Assessing spatio-temporal changes in forest cover and fragmentation under urban expansion in Nanjing, eastern China, from long-term Landsat observations (1987–2017). Appl. Geogr. 2020, 117, 102190. [Google Scholar] [CrossRef]
  40. Marchi, E.; Chung, W.; Visser, R.; Abbas, D.; Nordfjell, T.; Mederski, P.S.; McEwani, A.; Brink, M.; Laschi, A. Sustainable Forest Operations (SFO): A new paradigm in a changing world and climate. Sci. Total Environ. 2018, 634, 1385–1397. [Google Scholar] [CrossRef]
  41. Ma, X.; Wang, C.; Dong, B.; Gu, G.; Chen, R.; Li, Y.; Zou, H.; Zhang, W.; Li, Q. Carbon emissions from energy consumption in China: Its measurement and driving factors. Sci. Total Environ. 2019, 648, 1411–1420. [Google Scholar] [CrossRef] [PubMed]
  42. Xu, G.; Ren, X.; Xiong, K.; Li, L.; Bi, X.; Wu, Q. Analysis of the driving factors of PM2.5 concentration in the air: A case study of the Yangtze River Delta, China. Ecol. Indic. 2020, 110, 105889. [Google Scholar] [CrossRef]
  43. An, T.; Xu, C.; Liao, X. The impact of FDI on environmental pollution in China: Evidence from spatial panel data. Environ. Sci. Pollut. Res. 2021, 28, 44085–44097. [Google Scholar] [CrossRef] [PubMed]
  44. Zhang, Y.; Zhang, H.; Fu, Y.; Wang, L.; Wang, T. Effects of industrial agglomeration and environmental regulation on urban ecological efficiency: Evidence from 269 cities in China. Environ. Sci. Pollut. Res. 2021, 28, 66389–66408. [Google Scholar] [CrossRef]
  45. Ver Hoef, J.M.; Peterson, E.E.; Hooten, M.B.; Hanks, E.M.; Fortin, M.J. Spatial autoregressive models for statistical inference from ecological data. Ecol. Monogr. 2018, 88, 36–59. [Google Scholar] [CrossRef]
  46. Zhao, C.; Wang, B. How does new-type urbanization affect air pollution? Empirical evidence based on spatial spillover effect and spatial Durbin model. Environ. Int. 2022, 165, 107304. [Google Scholar] [CrossRef]
  47. Wang, H.; Cui, H.; Zhao, Q. Effect of green technology innovation on green total factor productivity in China: Evidence from spatial Durbin model analysis. J. Clean. Prod. 2021, 288, 125624. [Google Scholar] [CrossRef]
  48. Zhang, Y.; Wang, T.; Ren, C.; Wang, L.; Zhang, K.; Song, R. Heterogeneous impacts and spillover effects of green innovation network and environmental regulation on water use efficiency: A spatiotemporal perspective from 269 cities in China. Sustain. Cities Soc. 2023, 90, 104361. [Google Scholar] [CrossRef]
  49. Peng, W.; Yin, Y.; Wen, Z.; Kuang, J. Spatial spillover effect of green innovation on economic development quality in China: Evidence from a panel data of 270 prefecture-level and above cities. Sustain. Cities Soc. 2021, 69, 102863. [Google Scholar] [CrossRef]
  50. Li, B.; Griffith, D.A. The Moran Spectrum as a Geoinformatic Tupu: Implications for the First Law of Geography. Ann. Gis 2022, 28, 69–83. [Google Scholar] [CrossRef]
  51. Polloni-Silva, E.; Silveira, N.; Ferraz, D.; de Mello, D.S.; Moralles, H.F. The drivers of energy-related CO2 emissions in Brazil: A regional application of the STIRPAT model. Environ. Sci. Pollut. Res. 2021, 28, 51745–51762. [Google Scholar] [CrossRef]
  52. Hao, Y.; Niu, X.; Wang, J. Impacts of haze pollution on China’s tourism industry: A system of economic loss analysis. J. Environ. Manag. 2021, 295, 113051. [Google Scholar] [CrossRef] [PubMed]
  53. Waheed, R.; Chang, D.; Sarwar, S.; Chen, W. orest, agriculture, renewable energy, and CO2 emission. J. Clean. Prod. 2018, 172, 4231–4238. [Google Scholar] [CrossRef]
  54. Rahman, M.M.; Mohanty, A.K.; Rahman, M.H. Renewable energy, forestry, economic growth, and demographic impact on carbon footprint in India: Does forestry and renewable energy matter to reduce emission? J. Environ. Stud. Sci. 2024, 14, 415–427. [Google Scholar] [CrossRef]
  55. Nowak, D.J.; Hirabayashi, S.; Doyle, M.; McGovern, M.; Pasher, J. Air pollution removal by urban forests in Canada and its effect on air quality and human health. Urban For. Urban Green 2022, 29, 40–48. [Google Scholar] [CrossRef]
  56. Sun, W.; Huang, C. How does urbanization affect carbon emission efficiency? Evidence from China. J. Clean. Prod. 2020, 272, 122828. [Google Scholar] [CrossRef]
  57. Wu, H.; Xu, L.; Ren, S.; Hao, Y.; Yan, G. How do energy consumption and environmental regulation affect carbon emissions in China? New evidence from a dynamic threshold panel model. Resour. Policy 2020, 67, 101678. [Google Scholar] [CrossRef]
  58. Zhai, C.; Bao, G.; Zhang, D.; Sha, Y. Urban Forest Locations and Patch Characteristics Regulate PM2.5 Mitigation Capacity. Forests 2022, 13, 1408. [Google Scholar] [CrossRef]
  59. Cheng, J.; Huang, C.; Gan, X.; Peng, C.; Deng, L. Can forest carbon sequestration offset industrial CO2 emissions? A case study of Hubei Province, China. J. Clean. Prod. 2023, 426, 139147. [Google Scholar] [CrossRef]
Figure 1. The impact mechanism of IFRM on haze pollution and carbon emissions.
Forests 15 01534 g001
Figure 2. The distribution form of each variable and its correlation with the explained variable. Note: * indicates p < 0.1, *** indicates p < 0.001. The red line in Figure 2 indicates the data fitting trend line.
Forests 15 01534 g002
Figure 3. Box plot and kernel density plot. (a) PM2.5 box plot; (b) Carbon emission box plot; (c) PM2.5 kernel density plot; (d) Carbon emission kernel density plot.
Forests 15 01534 g003
Figure 4. Spatial distribution characteristics of haze pollution and carbon emission. (a) PM2.5 concentration in 2008; (b) PM2.5 concentration in 2013; (c) PM2.5 concentration in 2019; (d) Carbon emission intensity in 2008; (e) Carbon emission intensity in 2013; (f) Carbon emission intensity in 2019.
Forests 15 01534 g004
Figure 5. Global Moran’s I index of haze pollution and carbon emissions. (a) 2008 PM2.5 global Moran’s index; (b) 2013 PM2.5 global Moran’s index; (c) 2019 PM2.5 global Moran’s index; (d) 2008 carbon emissions global Moran’s index; (e) 2013 carbon emissions global Moran’s index; (f) 2019 carbon emissions global Moran’s index.
Forests 15 01534 g005
Table 1. Average low heat, folding standard coal coefficient and CO2 emission coefficient of eight energy sources.
Energy TypeAverage
Low Heat
Folding Standard
Coal Coefficient
CO2 Emission
Coefficient
Coal20,908 kJ/kg0.7143 kgce/kg1.9003 kg-CO2/kg
Coke28,435 kJ/kg0.9714 kgce/kg2.8604 kg-CO2/kg
Crude oil41,816 kJ/kg1.4286 kgce/kg3.0202 kg-CO2/kg
Gasoline43,070 kJ/kg1.4714 kgce/kg2.9251 kg-CO2/kg
Kerosene43,070 kJ/kg1.4714 kgce/kg3.0719 kg-CO2/kg
Diesel42,652 kJ/kg1.4571 kgce/kg3.0959 kg-CO2/kg
Fuel oil41,816 kJ/kg1.4286 kgce/kg3.1705 kg-CO2/kg
Natural gas38,931 kJ/m31.3300 kgce/m32.1622 kg-CO2/m3
Table 2. IFRM evaluation index system.
Primary IndicatorPrimary SymbolSecondary IndicatorSecondary SymbolIndicator Type
Forestry economyX1annual growth rate of total forestry output value (%)X11+
proportion of forestry output value in GDP (%)X12+
forest land value
per unit area (104 m2)
X13+
per capita forestry
output value (104 m2)
X14+
proportion of forestry investment in GDP (%)X15+
Forestry
status
X2forest coverage rate (%)X21+
per capita afforestation
area (104 m2)
X22+
volume per unit area (104 m2)X23+
forestry land area (104 m2)X24+
forest area (104 m2)X25+
Forestry governanceX3forestry pest control rate (%)X31+
forest fire area (104 m2)X32
total standing stock of living trees (104 m2)X33+
forest pest area (104 m2)X34
disaster-affected
forest area (104 m2)
X35
Note: Forest coverage rate (%): forest coverage rate refers to the ratio of forest area to total land area. It is an important indicator reflecting the actual level of forest resources and forest land occupation in a country (or region) and is generally expressed as a percentage. Forestry land area (104 m2): forestry land area refers to the land area where trees, bamboos, shrubs, coastal mangroves and other tree species grow. Forest area (104 m2): forest area mainly refers to the land area covered by tree forests, bamboo forests and special shrub forests.
Table 3. Spatial econometric model test.
TestHaze PollutionCarbon Emission
LM-spatial lag623.2468 ***2311.2233 ***
Robust LM-spatial lag421.1659 ***261.6899 ***
LM-spatial error269.6642 ***2057.6678 ***
Robust LM-spatial error67.5833 ***8.1345 ***
Wald-spatial lag69.4150 ***34.8682 ***
LR-spatial lag69.9755 ***35.0248 ***
Wald-spatial error74.5058 ***37.7588 ***
LR-spatial error75.2563 ***38.4978 ***
Hausman247.4248 ***195.1548 ***
Note: *** indicates p < 0.001.
Table 4. Regression analysis of IFRM’s impact on haze pollution and carbon emissions.
EVsHaze PollutionCarbon Emissions
OLSSDMOLSSDM
Investment in forestry resource management−0.1514 ***
(−3.0260)
−0.0655 *
(1.7335)
−0.1179 **
(−2.0348)
−0.1169 **
(−2.1956)
Industrial structure 0.0005
(0.0132)
−0.0555
(−1.3951)
−0.0364
(−0.9053)
−0.0408
(−0.7277)
Urbanization−1.0124 ***
(−6.5343)
0.0545
(0.3599)
0.2807 *
(1.7172)
0.8419 ***
(3.9438)
Foreign direct investment0.0045
(0.3584)
−0.0267 **
(−2.9271)
−0.0189
(−1.4144)
−0.0231 *
(−1.7916)
Economic development0.1171 **
(2.1315)
−0.0163
(−0.3042)
0.2310 ***
(3.9873)
−0.0087
(−0.1149)
Population density−0.9975 ***
(−6.3982)
−0.4136 **
(−3.0146)
0.0880
(0.5351)
0.3577 *
(1.8479)
Environmental regulation−0.0599 ***
(−5.4668)
−0.0129 *
(−1.7546)
−0.0155
(−1.3371)
−0.0220 *
(−1.8642)
WXYESYESYESYES
ρ 0.6300 ***
(9.6907)
0.2579 ***
(2.5925)
R20.52680.96830.51830.9940
Log-L 446.6510 328.9292
Note: * indicates p < 0.1, ** indicates p < 0.05, *** indicates p < 0.001. The significance of all the tables below is consistent with this. WX represents the spatial lag of the control variables.
Table 5. Spatial spillover effects of IFRM on haze pollution and carbon emissions.
EvsHaze PollutionCarbon Emissions
Direct EffectSpillover EffectDirect EffectSpillover Effect
Investment in forestry resource management−0.0826 **
(−2.1359)
−0.5767 **
(−2.1099)
−0.1133 **
(−2.1059)
0.0748
(0.3946)
Industrial structure−0.0504
(−1.2491)
0.1773
(0.7700)
−0.0381
(−0.6849)
0.1237
(0.7462)
Urbanization−0.0332
(−0.2268)
−1.4033 ***
(−3.4604)
0.8192 ***
(3.8273)
−1.0580 *
(−1.7938)
Foreign direct investment−0.0305 ***
(−2.8065)
−0.1382
(−0.8718)
−0.0193
(−1.5464)
0.2089 *
(1.9730)
Economic development0.0121
(0.2266)
1.0474 ***
(2.7626)
−0.0019
(−0.0258)
0.3483*
(1.6858)
Population density−0.4443 ***
(−3.4665)
−0.8881
(−0.5885)
0.3451 *
(1.8652)
−0.6067
(−0.5727)
Environmental regulation−0.0186 **
(−2.1575)
−0.1943 ***
(−3.2154)
−0.0209 *
(−1.7746)
0.0606
(1.4675)
Note: * indicates p < 0.1, ** indicates p < 0.05, *** indicates p < 0.001.
Table 6. Robust regression analysis of IFRM’s impact on haze pollution and carbon emissions.
EVsHaze PollutionCarbon Emissions
(1)(2)(3)(4)(5)(6)
Investment in forestry resource management−0.0854 **
(−2.4543)
−0.0654 *
(−1.7335)
−0.0824 **
(−2.0047)
−0.1216 **
(−2.3512)
−0.1131 **
(−2.0836)
−0.1629 ***
(−3.0501)
Industrial structure −0.0575
(−1.5964)
−0.0555
(−1.3950)
−0.0347
(−0.8215)
−0.0597
(−1.1149)
−0.0251
(−0.4381)
−0.0035
(−0.0647)
Urbanization0.0761
(0.5784)
0.0544
(0.3599)
0.1753
(0.9827)
0.8909 ***
(4.5601)
0.9940 ***
(4.5667)
0.5671 ***
(2.4489)
Foreign direct investment−0.0292 ***
(−3.3013)
−0.0266 ***
(−2.9270)
−0.0290 ***
(−2.9737)
−0.0257 *
(−1.9554)
−0.0253 *
(−1.9335)
−0.0202 *
(−1.7413)
Economic development−0.0136
(−0.2651)
−0.0162
(−0.3042)
−0.0400
(−0.6790)
−0.0129
(−0.1699)
−0.0731
(−0.9505)
0.0267
(0.3522)
Population density−0.3187 **
(−2.3182)
−0.4136 ***
(−3.0145)
−0.5816 ***
(−3.7540)
0.5177 **
(2.5371)
0.4609 **
(2.3357)
0.4351 **
(2.1802)
Environmental regulation−0.0120
(−1.5386)
−0.0129
(−0.0129)
−0.0150 *
(−1.6860)
−0.0206 *
(−1.7758)
−0.0205 *
(−1.7026)
−0.0217 *
(−1.9512)
Lag(-1)0.8422 *
(18.4534)
0.7349 ***
(22.5381)
0.7552 ***
(24.6435)
0.4659 ***
(28.5287)
0.5387 ***
(17.6547)
0.8854 ***
(26.4657)
WXYESYESYESYESYESYES
ρ0.5564 ***
(8.5343)
0.6450 ***
(5.3437)
0.6869 ***
(7.6759)
0.3469 ***
(5.5634)
0.4536 ***
(3.6745)
0.5541 ***
(5.5645)
R20.98450.98330.96540.98660.98560.9827
Log-L433.5778364.45405643.3496367.2478676.4358535.4269
Note: * indicates p < 0.1, ** indicates p < 0.05, *** indicates p < 0.001. WX represents the spatial lag of the control variables.
Disclaimer/Publisher’s Note: The statements, opinions and data contained in all publications are solely those of the individual author(s) and contributor(s) and not of MDPI and/or the editor(s). MDPI and/or the editor(s) disclaim responsibility for any injury to people or property resulting from any ideas, methods, instructions or products referred to in the content.

