Article

Effect of Stand Age on Soil CO2 Emissions in Pedunculate Oak (Quercus robur L.) Forests

Institute of Lowland Forestry and Environment, University of Novi Sad, Antona Čehova 13d, 21 000 Novi Sad, Serbia
*
Author to whom correspondence should be addressed.
Forests 2024, 15(9), 1574; https://doi.org/10.3390/f15091574 (registering DOI)
Submission received: 22 July 2024 / Revised: 28 August 2024 / Accepted: 4 September 2024 / Published: 7 September 2024
(This article belongs to the Special Issue Soil Organic Carbon and Nutrient Cycling in the Forest Ecosystems)

Abstract

:
The emission of CO2 from soil represents one of the most significant fluxes between terrestrial ecosystems and the atmosphere. It is crucial to investigate the impact of stand age on soil CO2 emissions in order to evaluate the possibility of carbon sequestration through the establishment of new forests. In this study, soil CO2 emissions and microclimate variables (soil temperature and moisture) were investigated in the chronosequence of three differently aged stands (4-, 14-, and 70-year-old stands) in floodplain pedunculate oak (Quercus robur L.) forests in Serbia. This study highlights how the artificial regeneration of pedunculate oak forests (establishment of new stands) can affect CO2 emissions from soils. Seasonal fluctuations in soil CO2 emissions were observed in all of the monitored stands, along with variations in the influence of soil temperature and moisture. Multiple linear regression, incorporating soil temperature, soil moisture, and their interaction, offered the most comprehensive explanation for the variation observed in soil CO2 emissions. The seasons had statistically significant effects (p < 0.001) on CO2 emission from the soil in the examined stands during 2022. The youngest stand (4-year-old) had significantly higher soil CO2 emissions (p < 0.05) compared to the older stands over the entire study period (2021–2022). These results showed that the 70-year-old stand (natural high stand) had significantly lower soil CO2 emissions compared to the 4-year-old stand (artificially regenerated stand).

1. Introduction

Carbon dioxide (CO2) plays a pivotal role as a greenhouse gas, constituting approximately 60% of the total greenhouse effect. The increased concentration of CO2 in the atmosphere is a result of anthropogenic activities, such as intensive agriculture, land-use change, burning fossil fuels, deforestation, forest fires, etc. [1]. Forests are one of the most sensitive ecosystems to climate change [2,3]. Forest ecosystems play a key role in the global carbon cycle and the mitigation of climate change through sequestration, i.e., the capturing, removal, and storage of CO2 from the Earth’s atmosphere. In addition, forests are very important because of the multiple functions that they provide to society [4,5,6,7].
Within terrestrial ecosystems, the largest carbon stocks are stored in soils [8]. The variation in carbon stock assessments from 504 to 3000 Pg in soil depends on the database of soil properties used and the lack of information on carbon at depths that are greater than 1 m. Carbon storage in the world’s forests is estimated to be 861 Gt, out of which 44% is in soil (up to 1 m depth), 42% in live biomass (above- and below-ground), 8% in deadwood, and 5% in litter [5]. Forest soil organic carbon content at a depth of 1 m varies from 20 to over 300 tons per hectare depending on the forest type and climate conditions [9]. Land-use change can induce alterations in soil organic matter content. Afforestation generally leads to an increase in soil organic matter, while deforestation can cause its decomposition [10]. The conversion of forest ecosystems to croplands leads to soil structure disturbance, and it causes the mineralization of organic matter as well as a loss of soil carbon content and increased CO2 emissions from soil [11].
Soils are a source of the three main greenhouse gases (CO2, CH4, and N2O). The production of CO2 from soil is the result of soil respiration [12]. Soil respiration is defined as the emission of CO2 from soil produced by the biological activity of heterotrophic and autotrophic organisms in the soil (soil microorganisms (fungi, actinomycetes, bacteria and protozoans), soil macrofauna, plant roots, algae and chemolithotrophs) [13,14]. Soil respiration (Rs) is generally expressed as CO2 flux from the soil surface [13]. Based on the soil organisms causing CO2 emissions, Rs is divided into autotrophic and heterotrophic components [14,15]. The total ecosystem respiration (Reco) includes the above-ground respiration of plants (Rag) and soil respiration (Rs). Hence, Rs as part of Reco theoretically must be lower than Reco at daily, monthly, and annual scales [16]. The most important microsite drivers affecting CO2 emission from soil are soil temperature and soil moisture, where one of these drivers can be more influential than another [17,18,19,20,21]. Soil warming and higher amounts of precipitation significantly increase the emission of carbon dioxide from the soil. This is mainly due to the increased temperature and humidity of the soil, which stimulate the activity of microorganisms and accelerate the carbon cycle [22]. Furthermore, soil properties, land-use, land-cover, vegetation (species and age), climate characteristics and hydrology have large direct and indirect influences on soil CO2 emissions [17].
Forests store enormous amounts of carbon, and little changes in the balance between photosynthesis and ecosystem respiration can lead to large changes in the sequestration or emission of CO2 from forests to the atmosphere [23]. Above-ground vegetation plays a crucial role in ecosystem carbon sequestration, and it is closely linked to leaf litterfall and below-ground root production [24]. After photosynthesis, CO2 emissions from the soil are the second largest flux between terrestrial ecosystems and the atmosphere, which is estimated to be 68 ± 4 Pg C year−1 [25]. The amount of emitted CO2 from the soil is significantly higher than the CO2 emissions released from burning fossil fuels [26]. Soil CO2 emissions are controlled by soil temperature, soil moisture, soil microbial activity and soil properties, where thinning in stands causes changes in soil temperature and moisture, root density, and root activity, which are related to changes in soil CO2 emissions [27].
In Serbia, research on soil CO2 emissions has mostly been carried out in forest ecosystems [28,29,30,31,32]. This study aims to enhance our understanding of the effect of stand age on soil CO2 emissions within the same soil type in three differently aged Quercus robur L. forest stands (4-, 14-, and 70-year-old stands). The main goal of this study was to predict the carbon sequestration potential of young stands (4- and 14-year-old stands) that were artificially established compared to the older stand (70-year-old). Taking into account the dissimilar structure of the examined stands, which is explained by stand structural attributes, such as mean diameter, its standard deviation, and number of trees per unit area, it can be expected that the main drivers of emissions (soil temperature and moisture) will have different effects on soil CO2 flux. The objectives of this study were to (1) determine the seasonal dynamics of soil CO2 emissions under different aged stands throughout various seasons, (2) compare the difference in soil CO2 emissions between differently aged stands, and (3) explore the main drivers of emissions (soil temperature and moisture) and their contributions to variations in soil CO2 emissions.

2. Materials and Methods

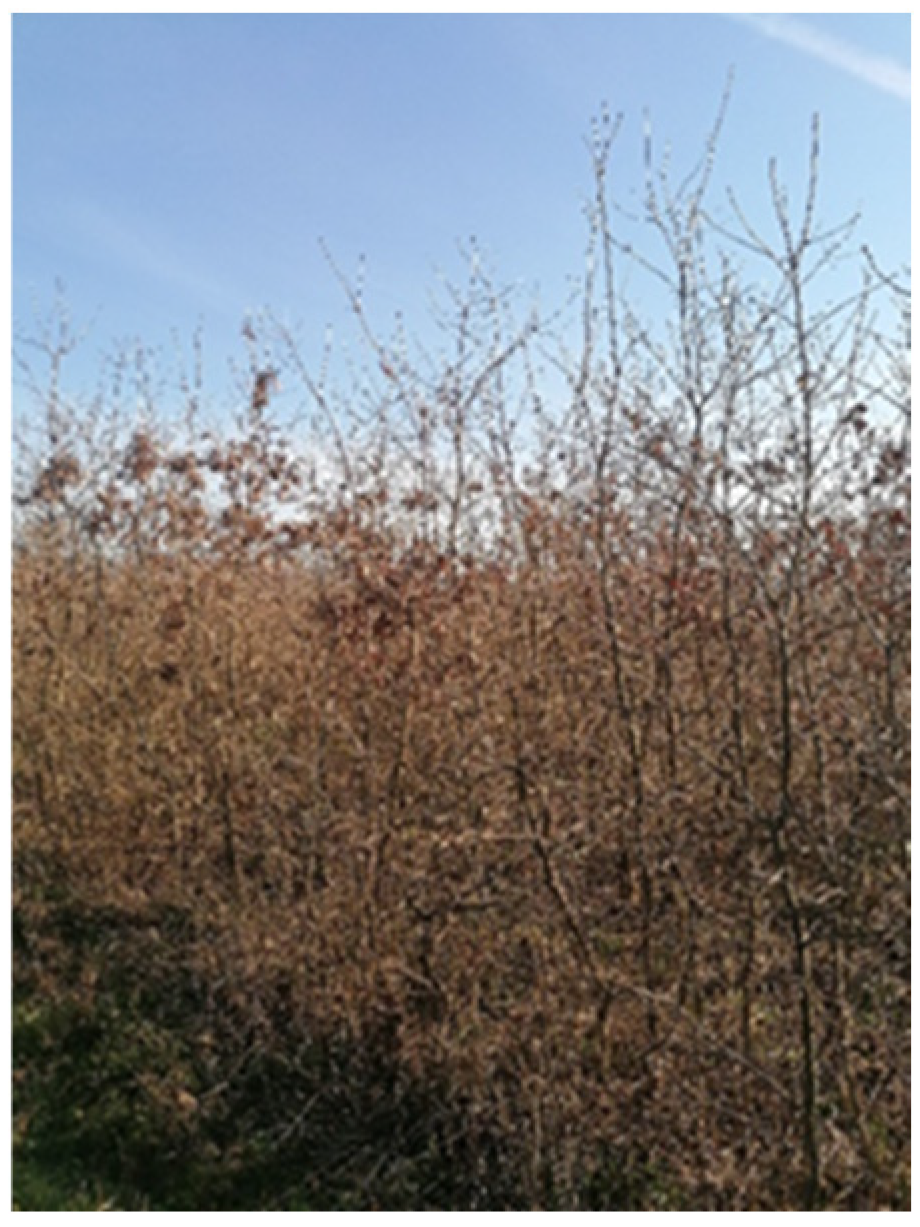
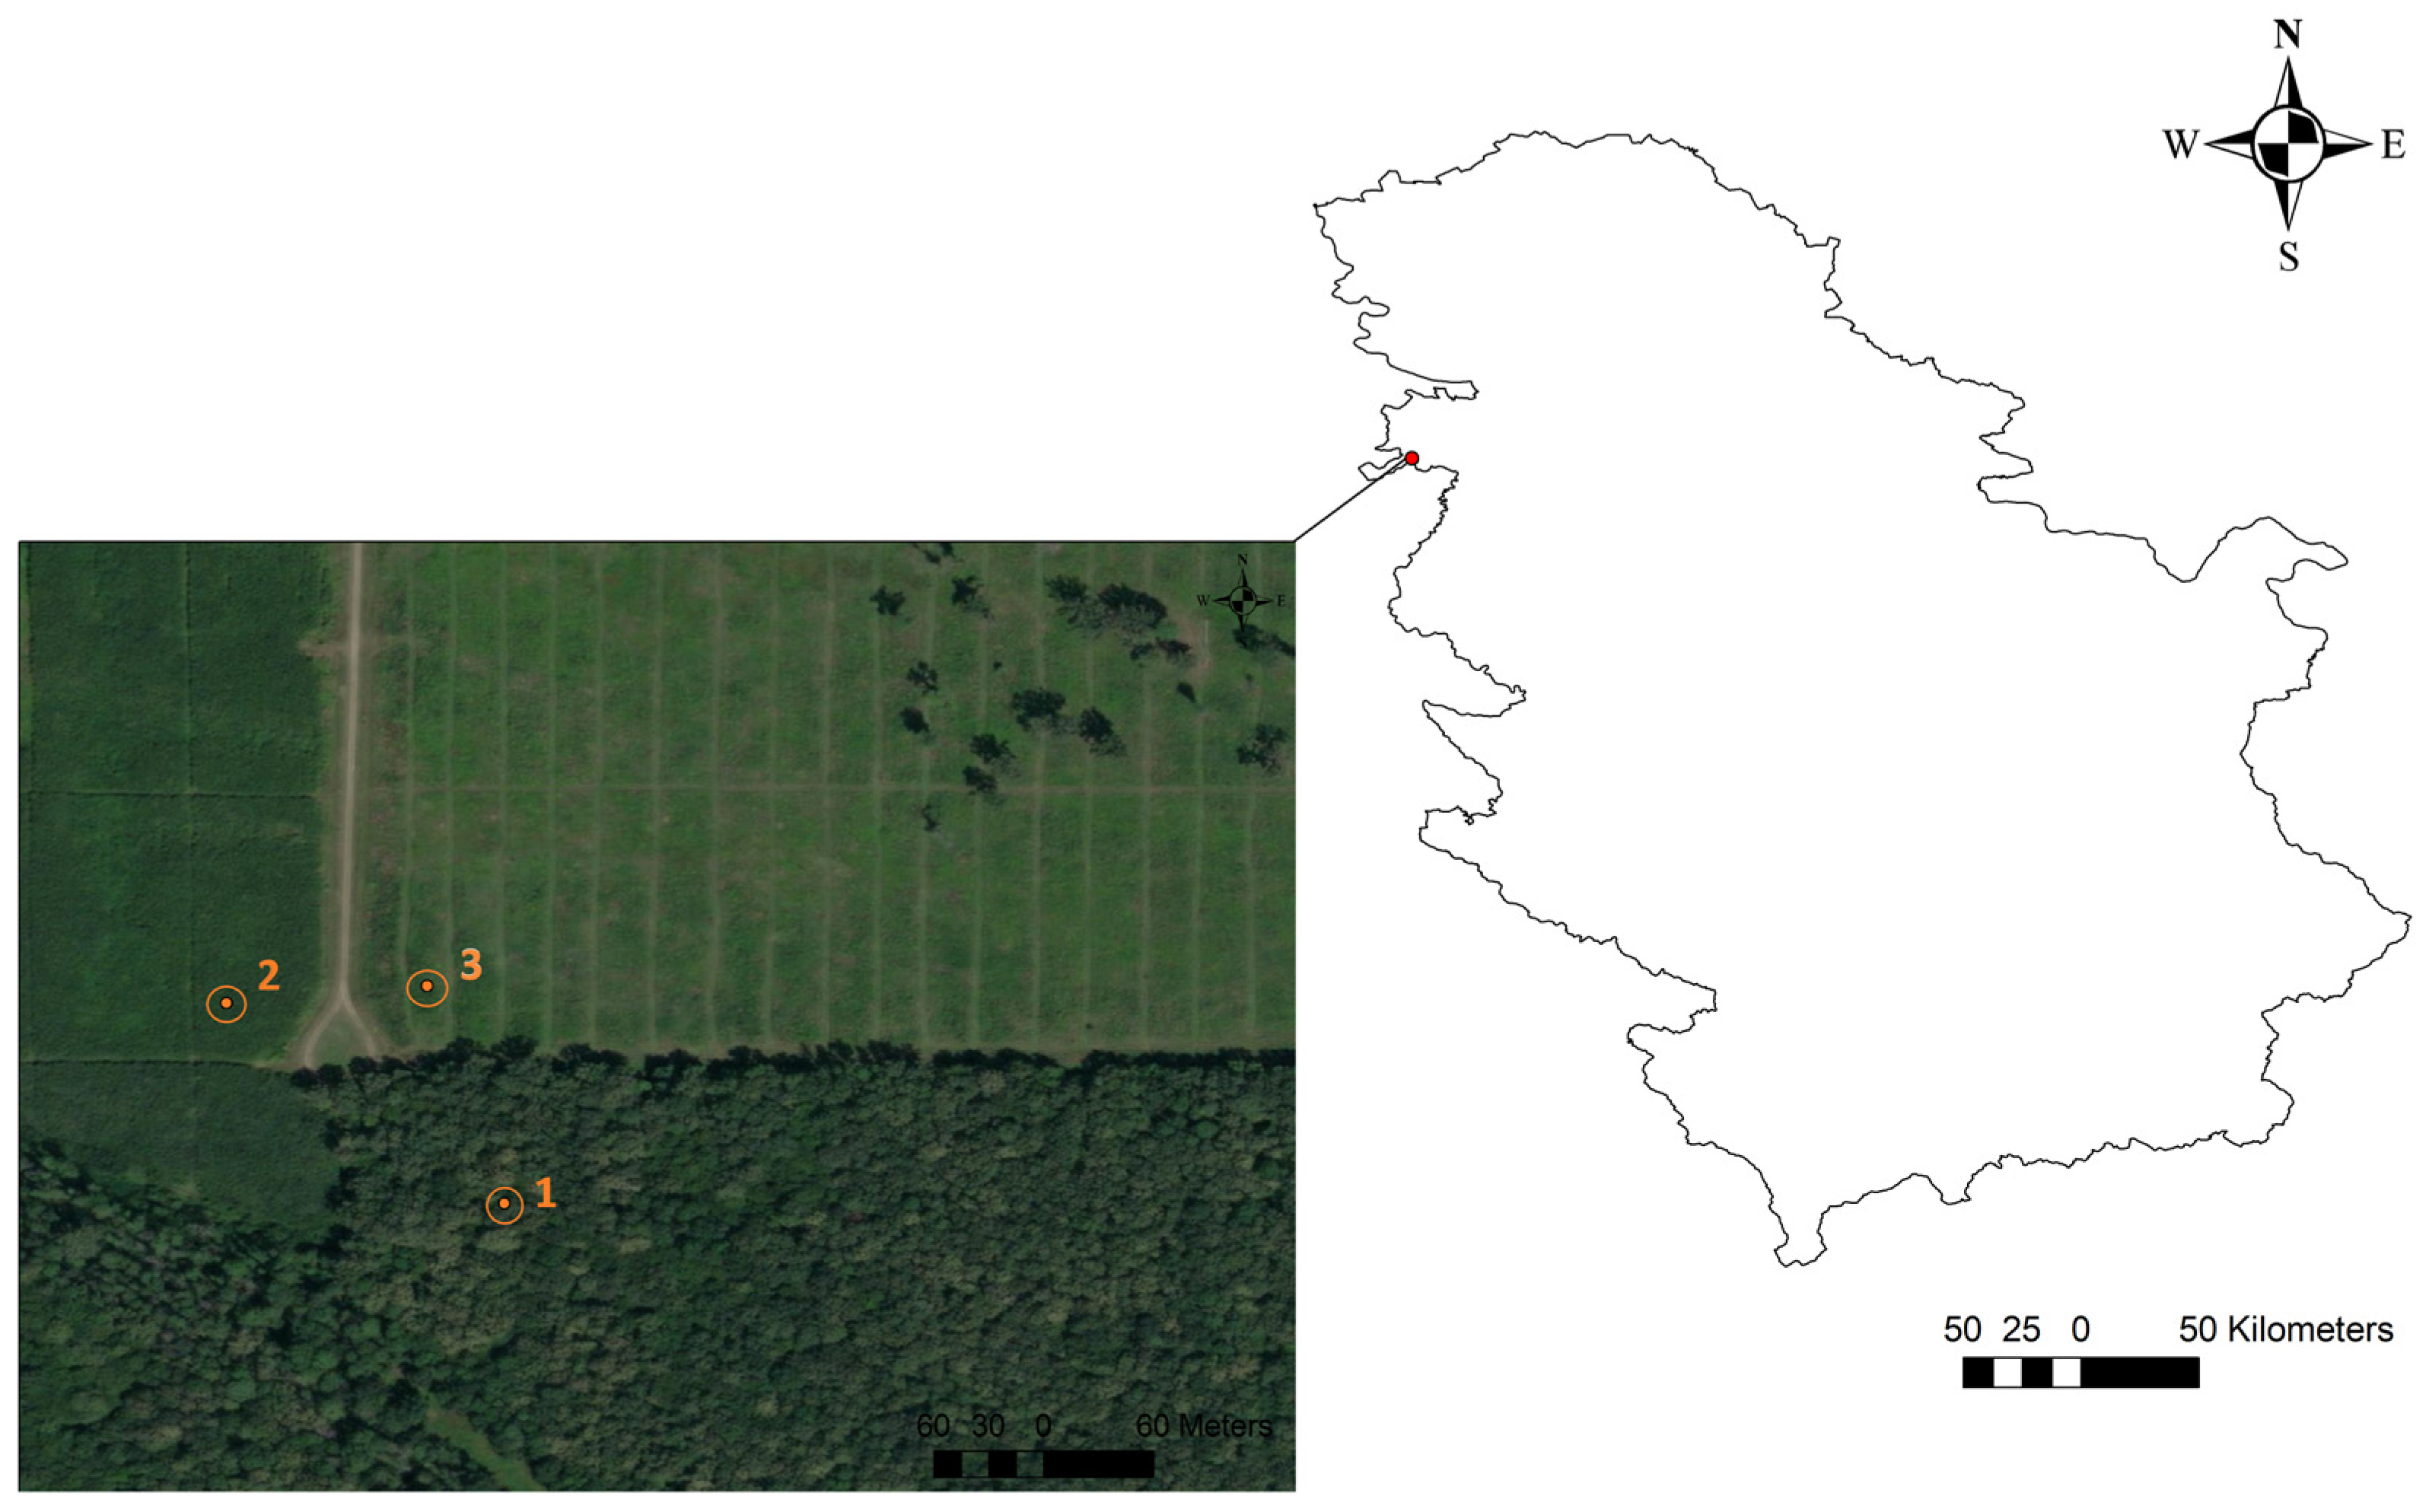
2.1. Site Description

In the Republic of Serbia, the biggest complexes of pedunculate oak (Quercus robur L.) forests are situated on the left bank of the Sava River within the Srem region [33]. The Srem forest area occupies a total of 49,731.07 ha of land within the Srem region. The largest part of these forests (42,491.43 ha) is managed by the public forestry enterprise “Vojvodinašume”. The Srem forest area is divided into flooded and non-flooded zones [34]. The western part of the Srem forest area is protected from flooding by the embankment built around 1930, whereas the eastern part continues to be flooded by the Sava River [35].
In this forest area, pure and mixed floodplain pedunculate oak forests are formed [33]. These forests are characterized by a high floristic diversity of ground vegetation [36]. Pedunclate oak (Quercus robur L.) mostly forms mixed forests with narrow-leaved ash (Fraxinus angustifolia Vahl.), hornbeam (Carpinus betulus L.), and different species of elm (Ulmus leavis Pall. and Ulmus minor Mill.) [33,37]. The share of Quercus robur L. in the total volume of the Srem forest area is 6,599,740.1 m3 (50%). The narrow-leaved ash (21.7%) and hornbeam (7.3%) have a significant share in the total volume of this forest region [34]. The planned rotation length of pedunculate oak (Quercus robur L.) in the Srem forest area ranges from 160 to 200 years, depending on the characteristics of the stands [38]. In this forest area, there are dominantly even-aged pedunculate oak stands in different developmental stages [33]. The shelterwood system is implemented as a silvicultural practice in this forest area [34].
The climate of the Srem forest area can be described as moderate–continental [39]. In this forest area, the average annual precipitation was 617.1 mm, while the value of average annual temperature amounted to 11.8 °C for the observation period from 1991 to 2020 [39].

2.2. The Study Design

The aim of the study was to compare soil CO2 emissions within the same soil type between younger stands that were artificially established and an older stand (a natural high stand). To assess the effects of stand age on soil CO2 emissions, we selected three stand age classes, namely, 4-, 14-, and 70-year-old Quercus robur stands (hereafter called QR4, QR14, and QR70, respectively). The stands selected for research were situated in a non-flooded zone (Figure 1). All of the investigated stands are located on flat terrain.

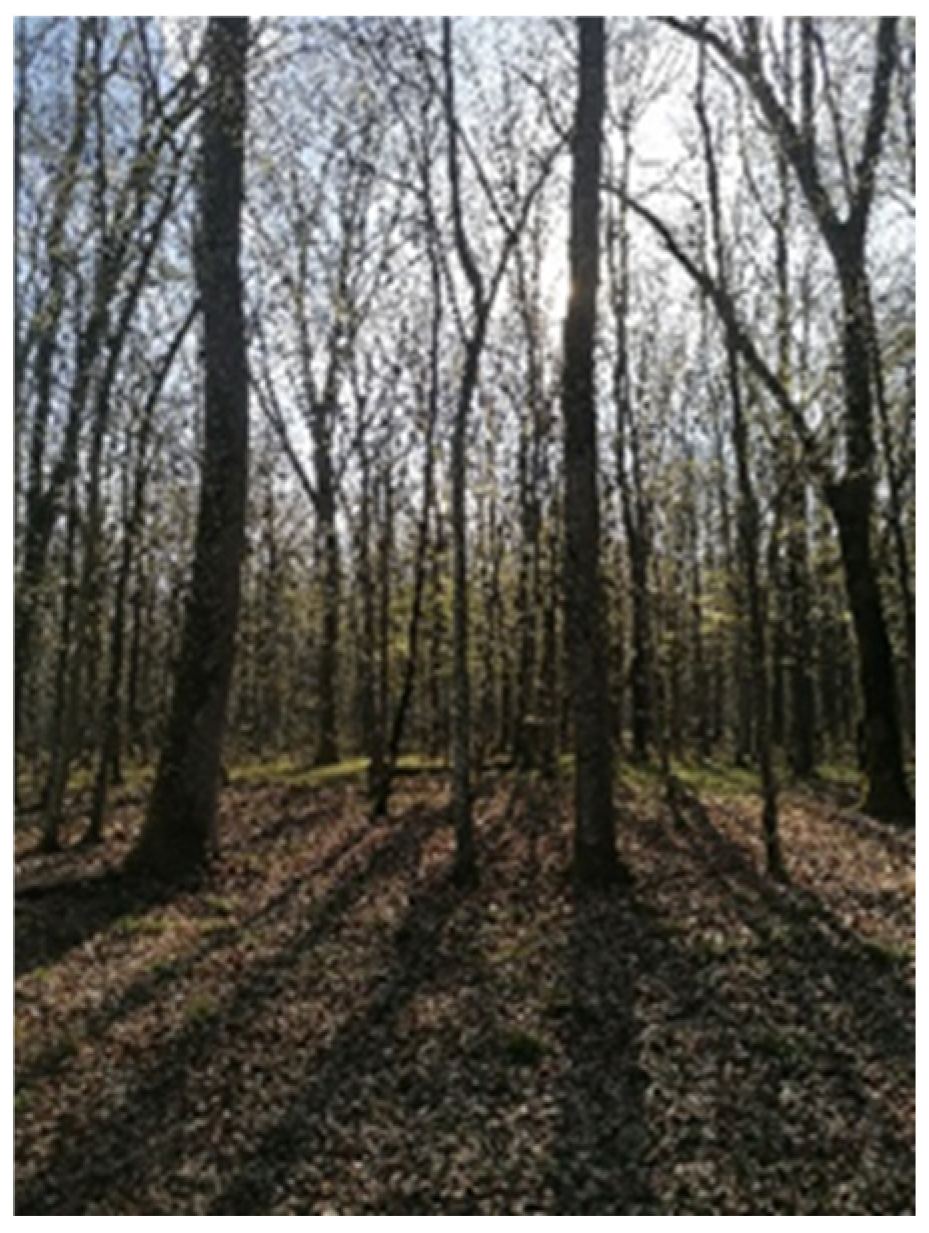
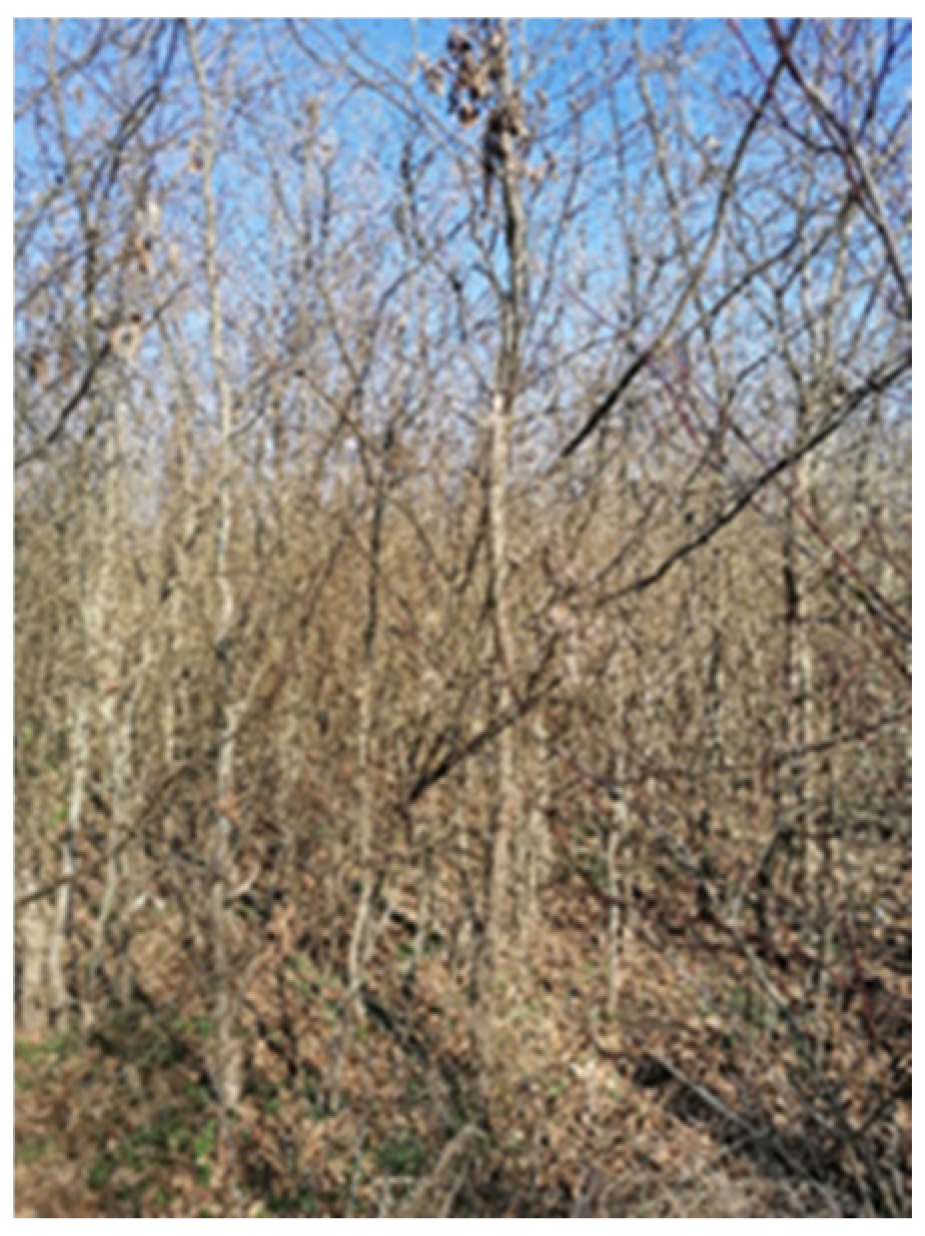
2.2.1. The Description of Forest Stands within the Study Location

The first examined stand (44°56′28.20″ N; 19°11′41.87″ E) was a 70-year-old stand (middle-aged stand) (Figure A1). This stand belongs to the association of pedunculate oak, narrow-leaved ash, and hornbeam with remote sedge (Carpino-Fraxino-Quercetum roboris Miš. et Broz 1962. subass. caricetosum remotae) [40]. This is a high and mixed forest, where pedunculate oak is the most dominant species in terms of total stand volume. Additionally, this stand contains approximately 270 trees per hectare. Remote sedge (Carex remota) is the dominant and evenly distributed species within the ground vegetation of this stand. Both young stands (4-, and 14- year-old stands) were artificially regenerated within the habitat type of Carpino-Fraxino-Quercetum roboris Miš. et Broz 1962. subass. caricetosum remotae [40]. Artificial regeneration included direct acorn sowing. Moroever, these are monoculture stands characterized by a dense canopy. The early developmental stage of even-aged pedunculate oak stands, known as the sapling stage, is characterized by a small mean diameter of trees and a large number of trees per hectare (approximately 10,000). These stands are characterized by scarce ground vegetation.

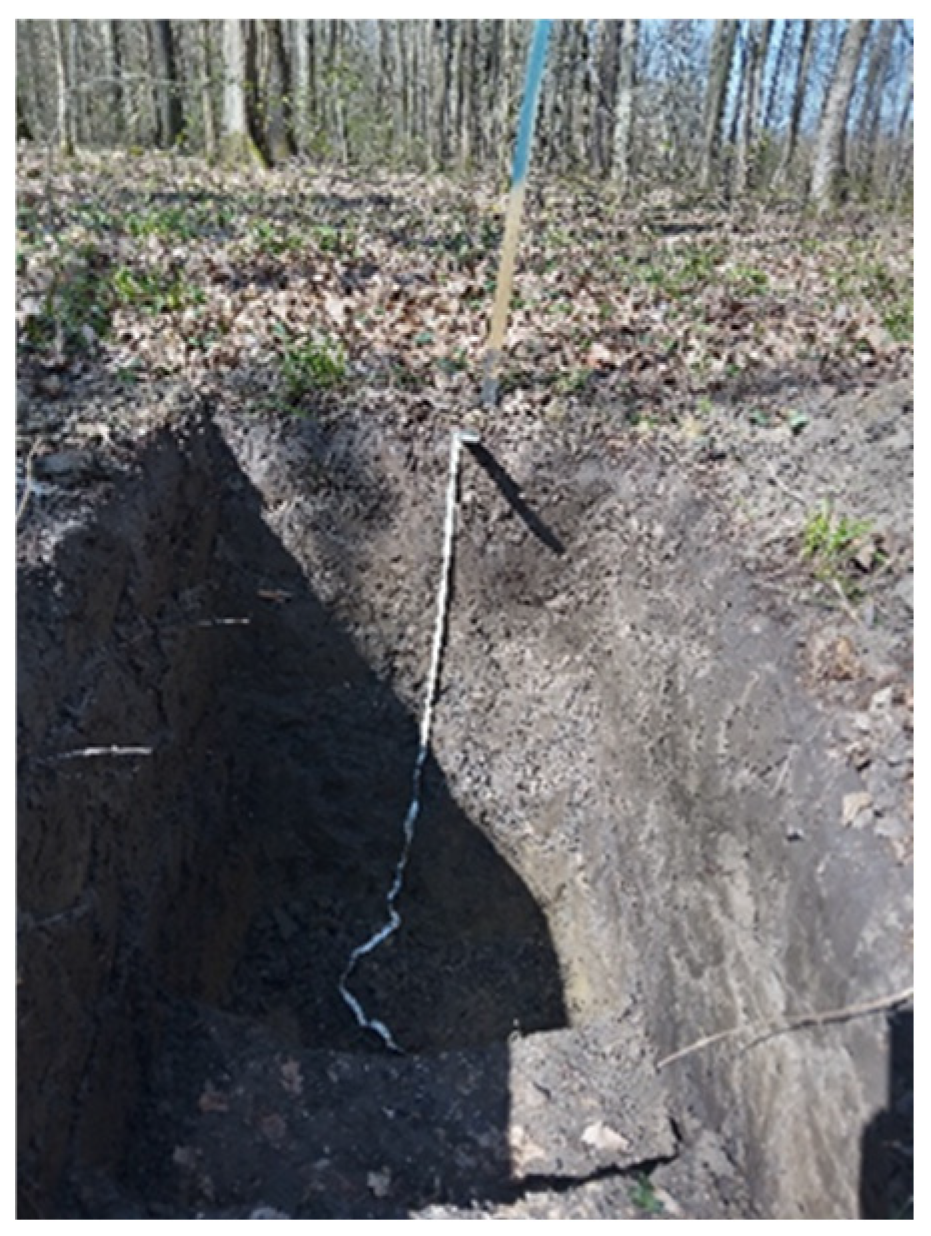
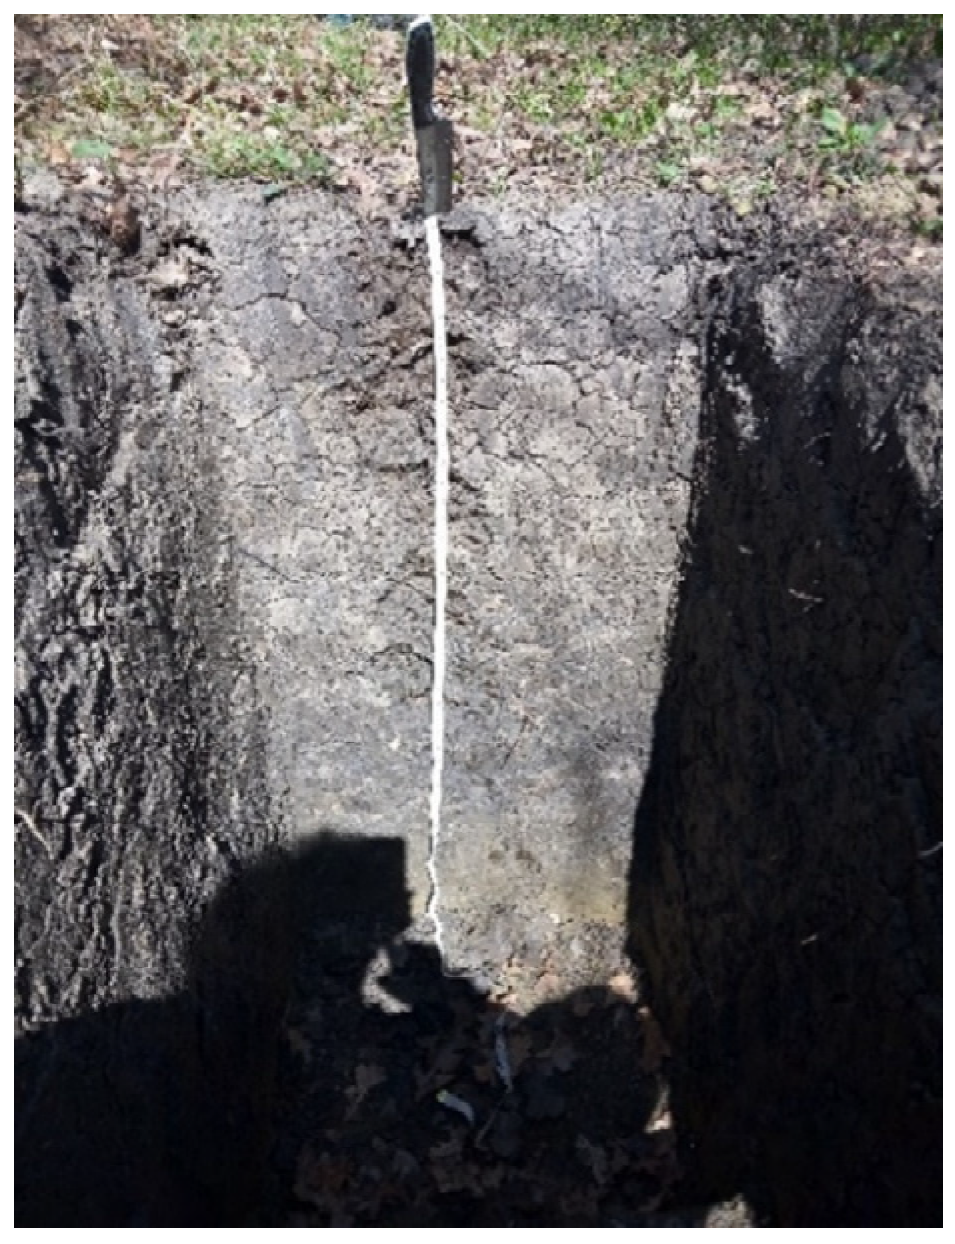
2.2.2. The Description of Forest Soil in the Examined Stands

The soil profiles were excavated in each examined stand (A2; A4; A6) and soil samples were taken from each horizon to determine physical and chemical properties of the soil. According to WRB classification [41], Chernozem was identified within all three examined stands. Particle size distribution (%) was determined using the international B-pipette method with preparation in sodium pyrophosphate. Soil textural classes were determined using the USDA soil texture triangle. The calcium carbonate (CaCO3) content was determined volumetrically using a Scheibler calcimeter. The nitrogen and carbon contents were determined via CHNS elemental analysis using VarioEL III analyser (Elementar, Langenselbold, Germany). The physical and chemical properties of the soil are shown in Table 1 for each examined stand.
The average depth of the soils in the examined stands was approximately 110 cm. The average litter depth in QR70 was 2.5 cm, while litter depth in the young stands (QR14 and QR4) was about 0.5 cm. The most dominant textural classes of soils in the examined stands were clay loam and clay. The soil organic carbon content in the topsoil (0–30 cm depth) within QR70, QR14, and QR4 ranged from 0.89%, 2.54%, and 5.30%, respectively. Similar values of nitrogen content were obtained for all three soils, while soil pH was slightly alkaline for each soil.

2.3. Data Collection and Analysis

The closed chambers method was used for the air sampling with the aim of measuring the CO2 emissions from the soil within the observed stands. The device used to measure the emissions of CO2 from the soil consisted of a removeable PVC chamber and a PVC base (collar). The chamber and base have an equal diameter, which is 20 cm [42]. Five representative places were selected for each stand.
All five collars were permanently placed in the soil at a depth of 10 cm within each research stand during the study period (2021–2022). The five chambers positioned on the representative places in each stand were used for air sampling. All chambers in each examined stand were installed under approximately uniform conditions, including microclimatic conditions and topography (flat slope).
The insertion of collars was performed two weeks before the first sampling due to the stabilization of CO2 flux after soil disturbance and fine root severing [43,44]. The detailed protocol used for air sampling was described by Karaklić et al. (2023) [32]. Before sampling, green plants occurring inside some collars were cut close to the soil surface using scissors [45]. From June 2021 to November 2022, air sampling was performed from 9:00 a.m. to 11:00 a.m. The measured values were used to calculate the average daily flux of soil CO2 [46]. Air sampling was conducted 2 to 3 times per month in each stand. The winter season was excluded from the air sampling because of snow cover and frozen topsoil [47].
The collected samples were analyzed using a gas chromatograph (Agilent 8890, Agilent Technologies, Santa Clara, CA, USA) with FID and µECD detectors, where the CO2 concentration was measured. A total of 1215 samples were collected and analyzed. The values of CO2 flux were calculated using the equation presented in Ming et al. (2018) [46] based on a linear increase in the gas concentration inside closed chambers during the sampling time and the characteristics of the chamber (the volume and bottom area of the chamber). The values of CO2 flux are expressed in g CO2 m−2 per day [48,49].
During the sampling time, soil temperature was measured using a soil thermometer at a depth of 5 cm, while the soil moisture (soil water content) was determined using the gravimetric method [32].

2.4. Statistical Analyses

The relationship between CO2 emissions, soil temperature, and soil water content was analyzed through the use of multiple linear regressions [49,50,51]. Multiple linear regression analyses were performed as follows:
y = a + bT + cW
y = a + bT + cW + dTW
where y is the CO2 emissions from soil (g CO2 m−2 per day), T is the soil temperature at a depth of 5 cm (°C), W is soil moisture (soil water content (%)) and a, b, c, d are the regression coefficients.
A one-way analysis of variance (ANOVA) with Tukey’s honestly significant difference (HSD) post hoc test (p < 0.05) was used to test for significant differences in soil CO2 emissions between stands of different ages over the entire study period (2021–2022). Additionally, a two-way ANOVA was conducted to determine the effects of stand age, season, and their interaction on soil CO2 emissions using data obtained in 2022. All of the statistical analyses were carried out using R statistical software (Version 4.0.2). “ggplot2” (Version 3.3.2) [52] and “scatterplot3d” (Version 0.3-41) [53] packages in the R environment were used for the graphic design.

3. Results

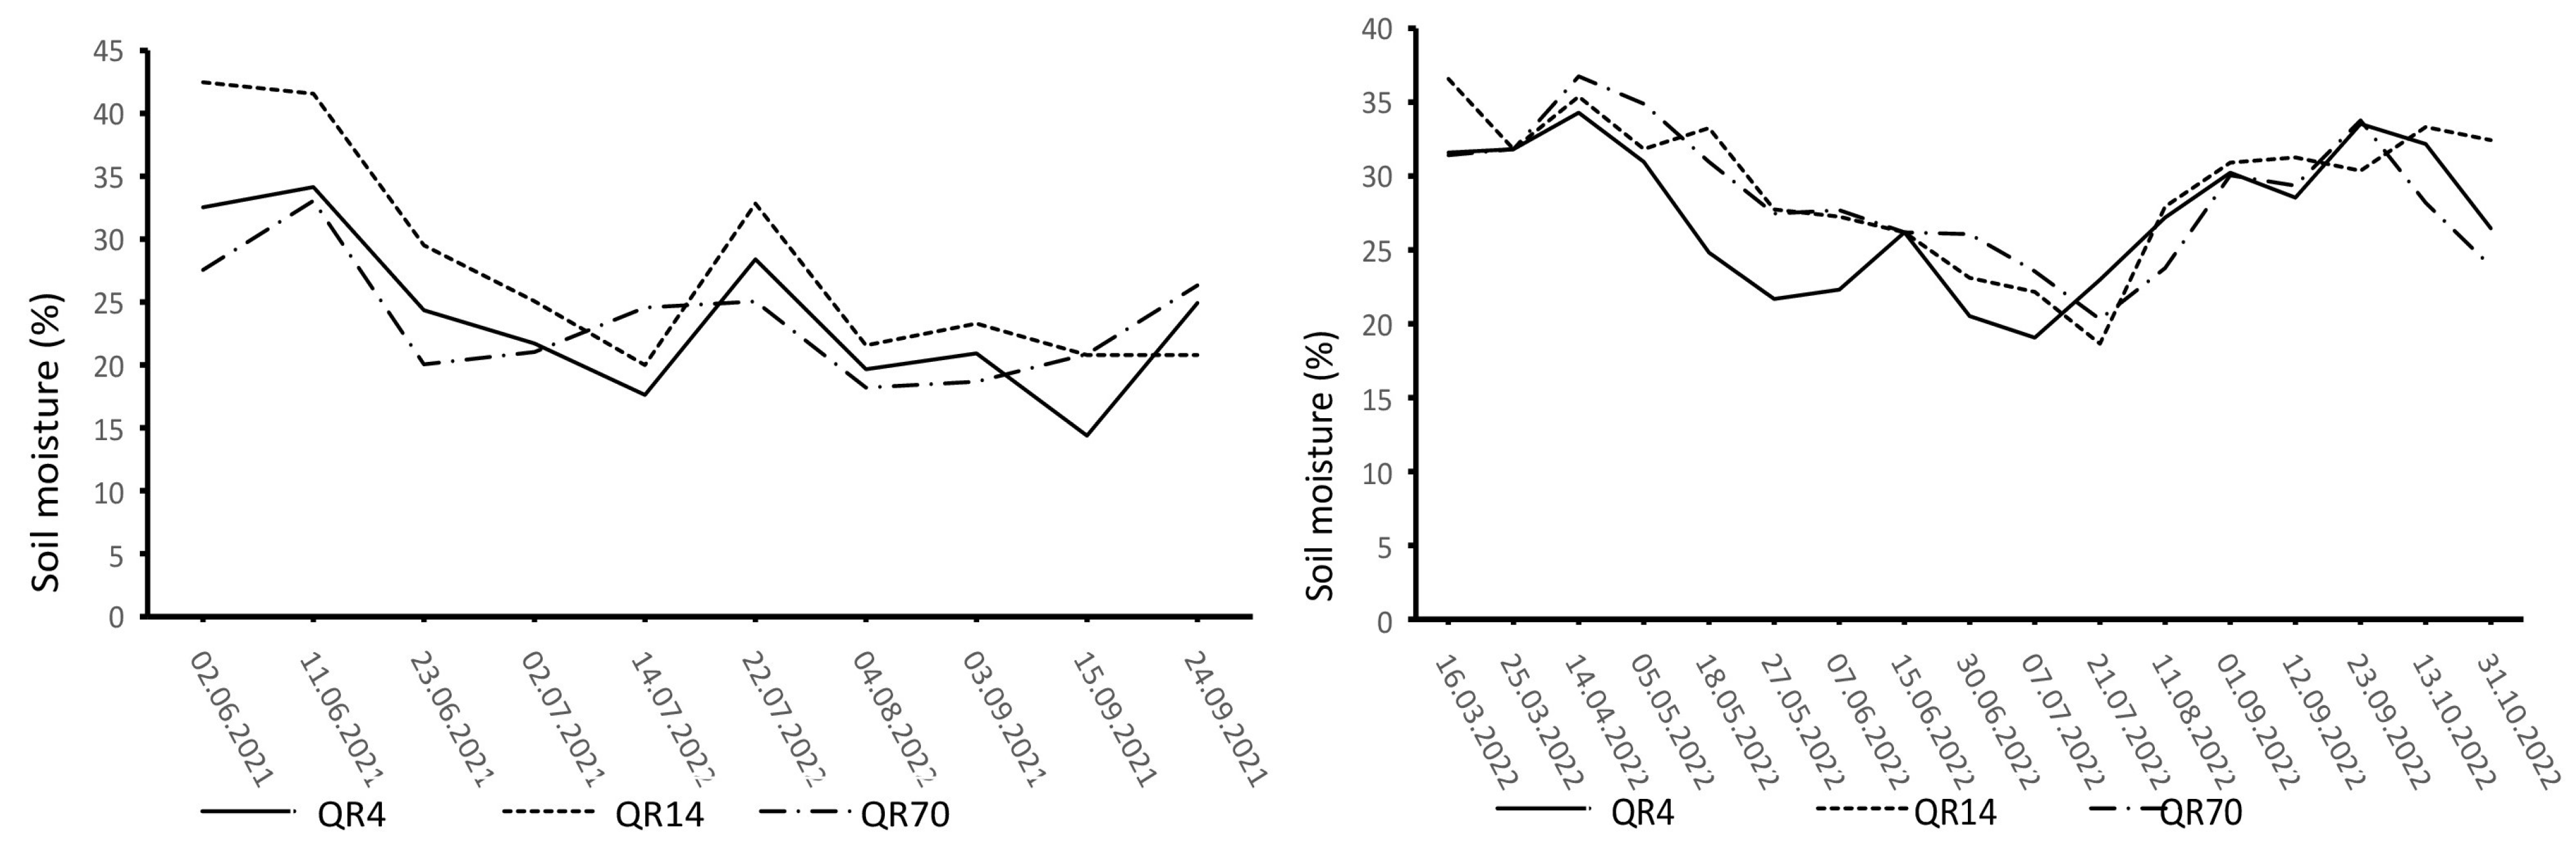
3.1. Dynamics of Soil Temperature and Moisture

The dynamics of soil temperature and moisture varied distinctly during the study period (Figure 2 and Figure 3). The highest soil temperature values were observed in the summer months (June, July, and August). Similar soil temperature dynamics were recorded in all three examined stands. In 2021, the highest soil moisture values were recorded at the beginning of the study period, with another peak recorded on 22 July after heavy rainfall. In 2022, high soil moisture values were observed in the summer and autumn seasons.

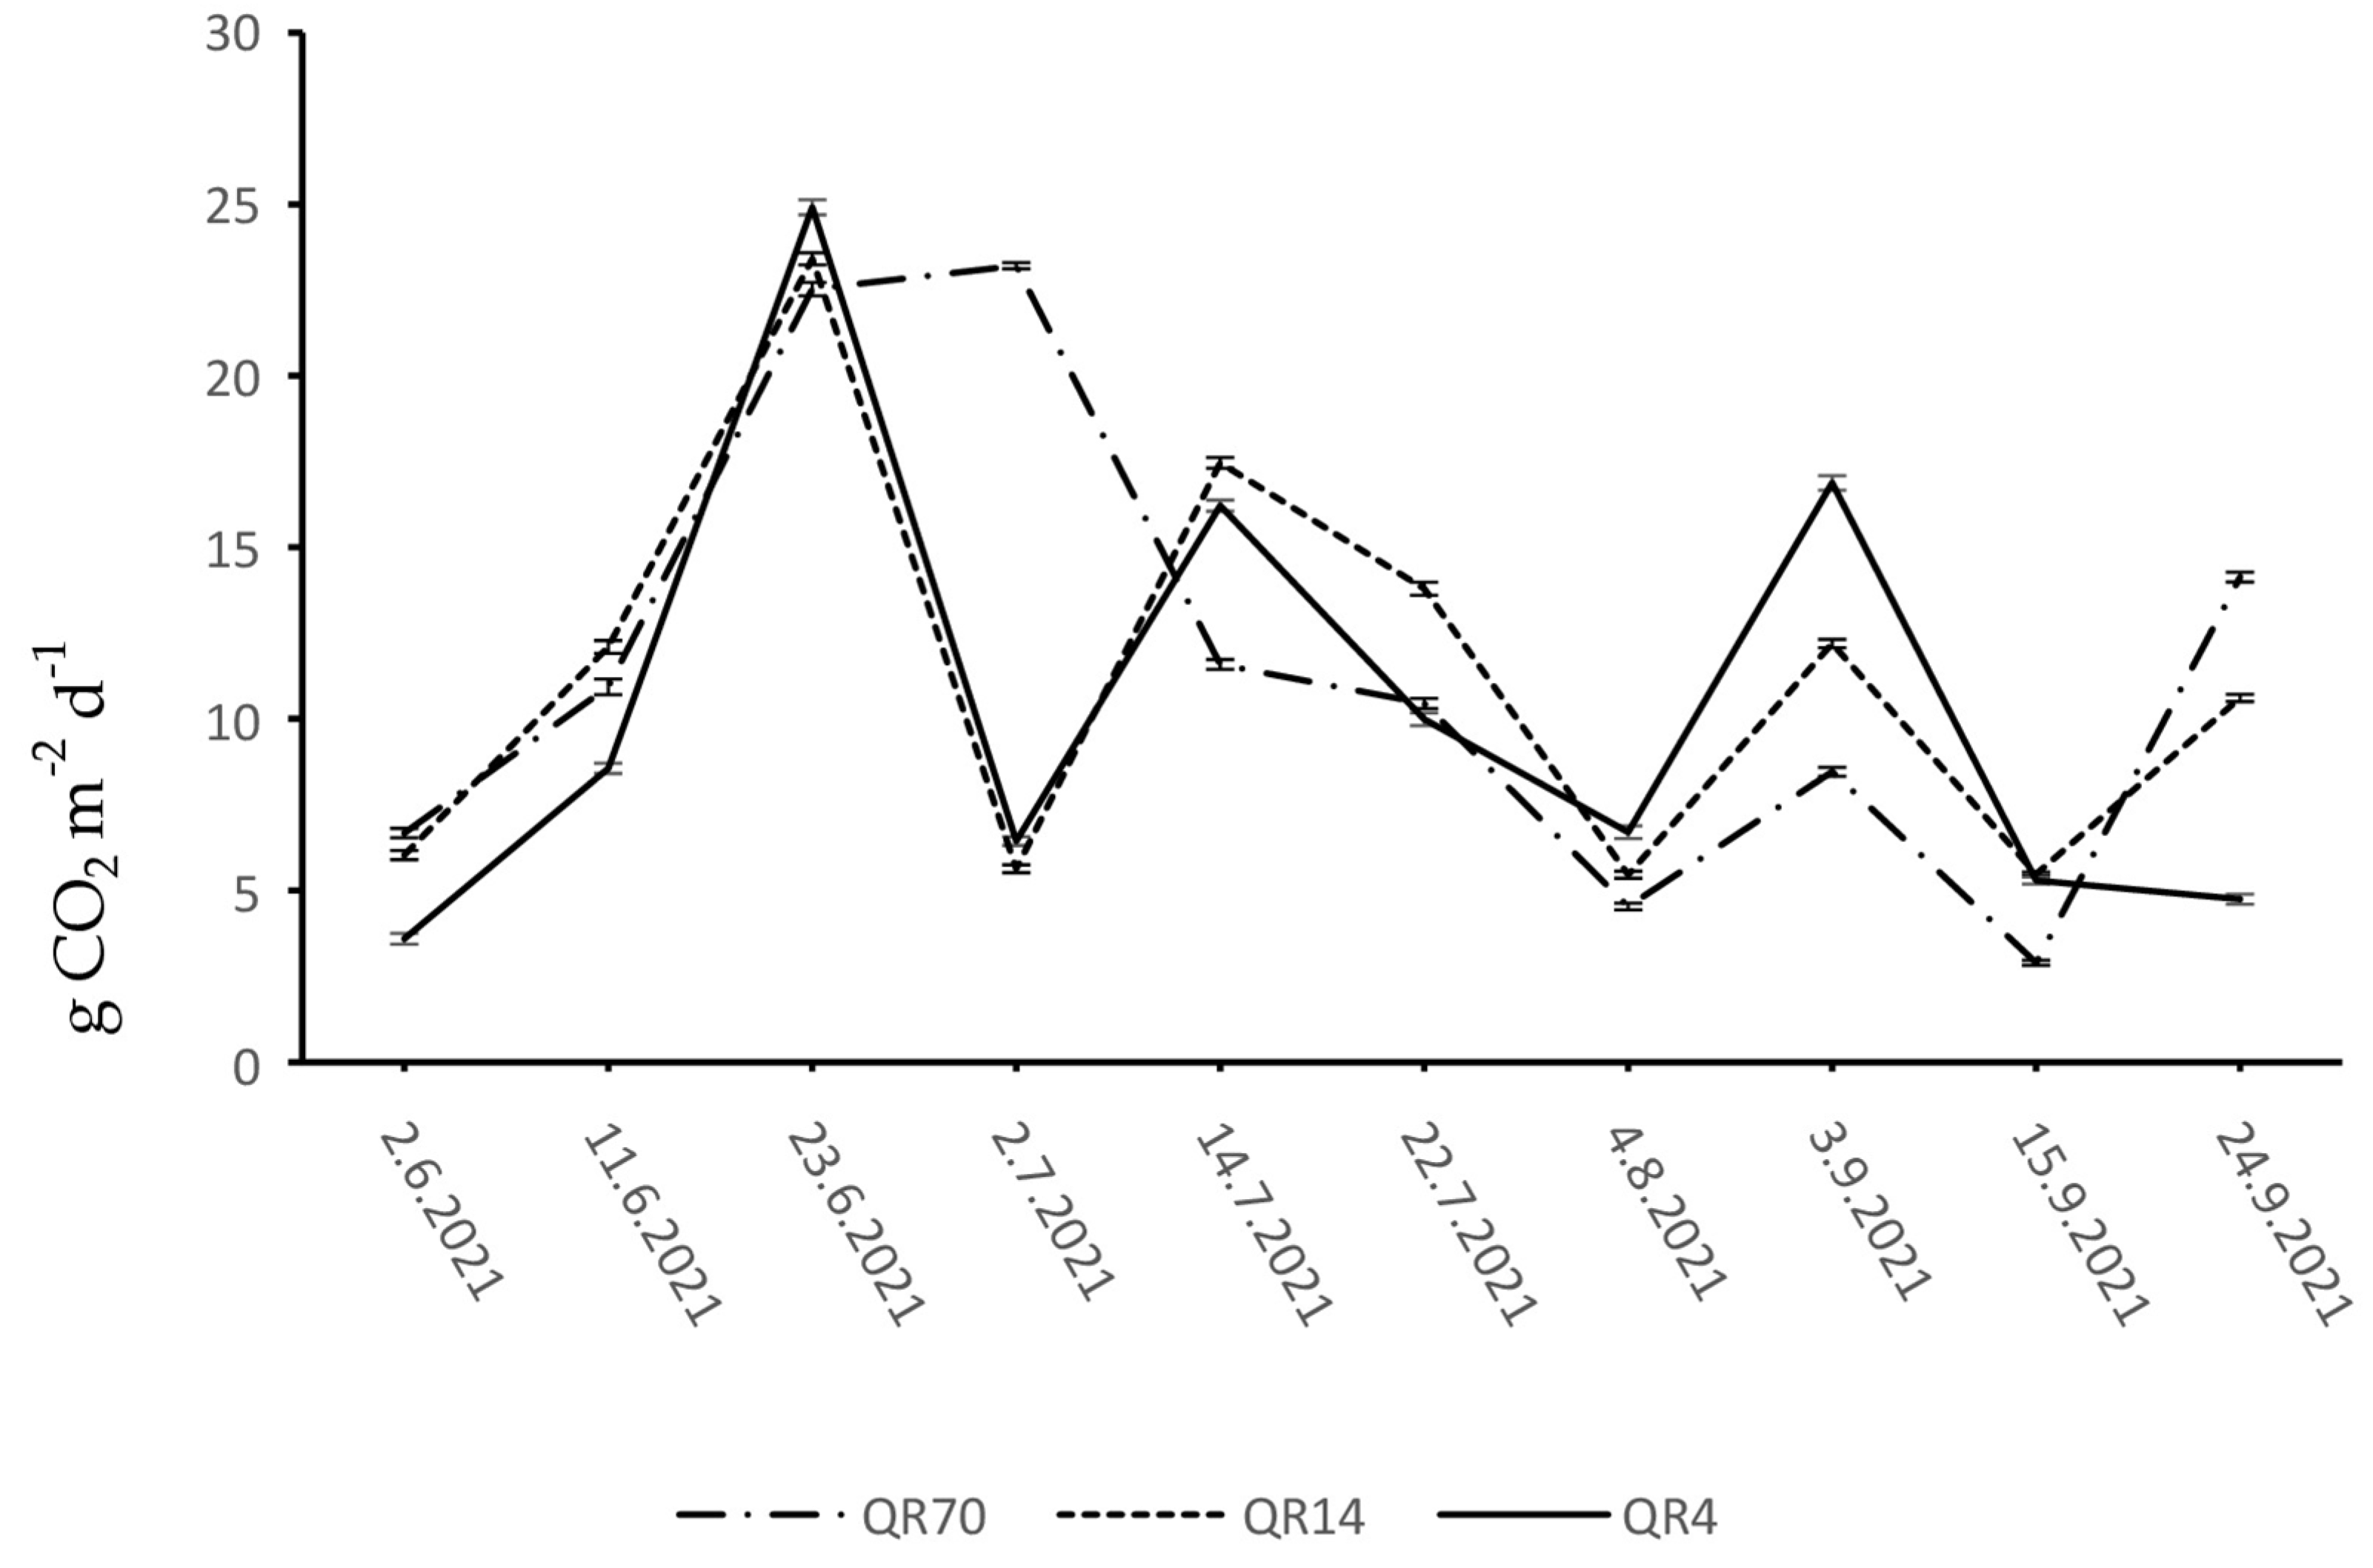
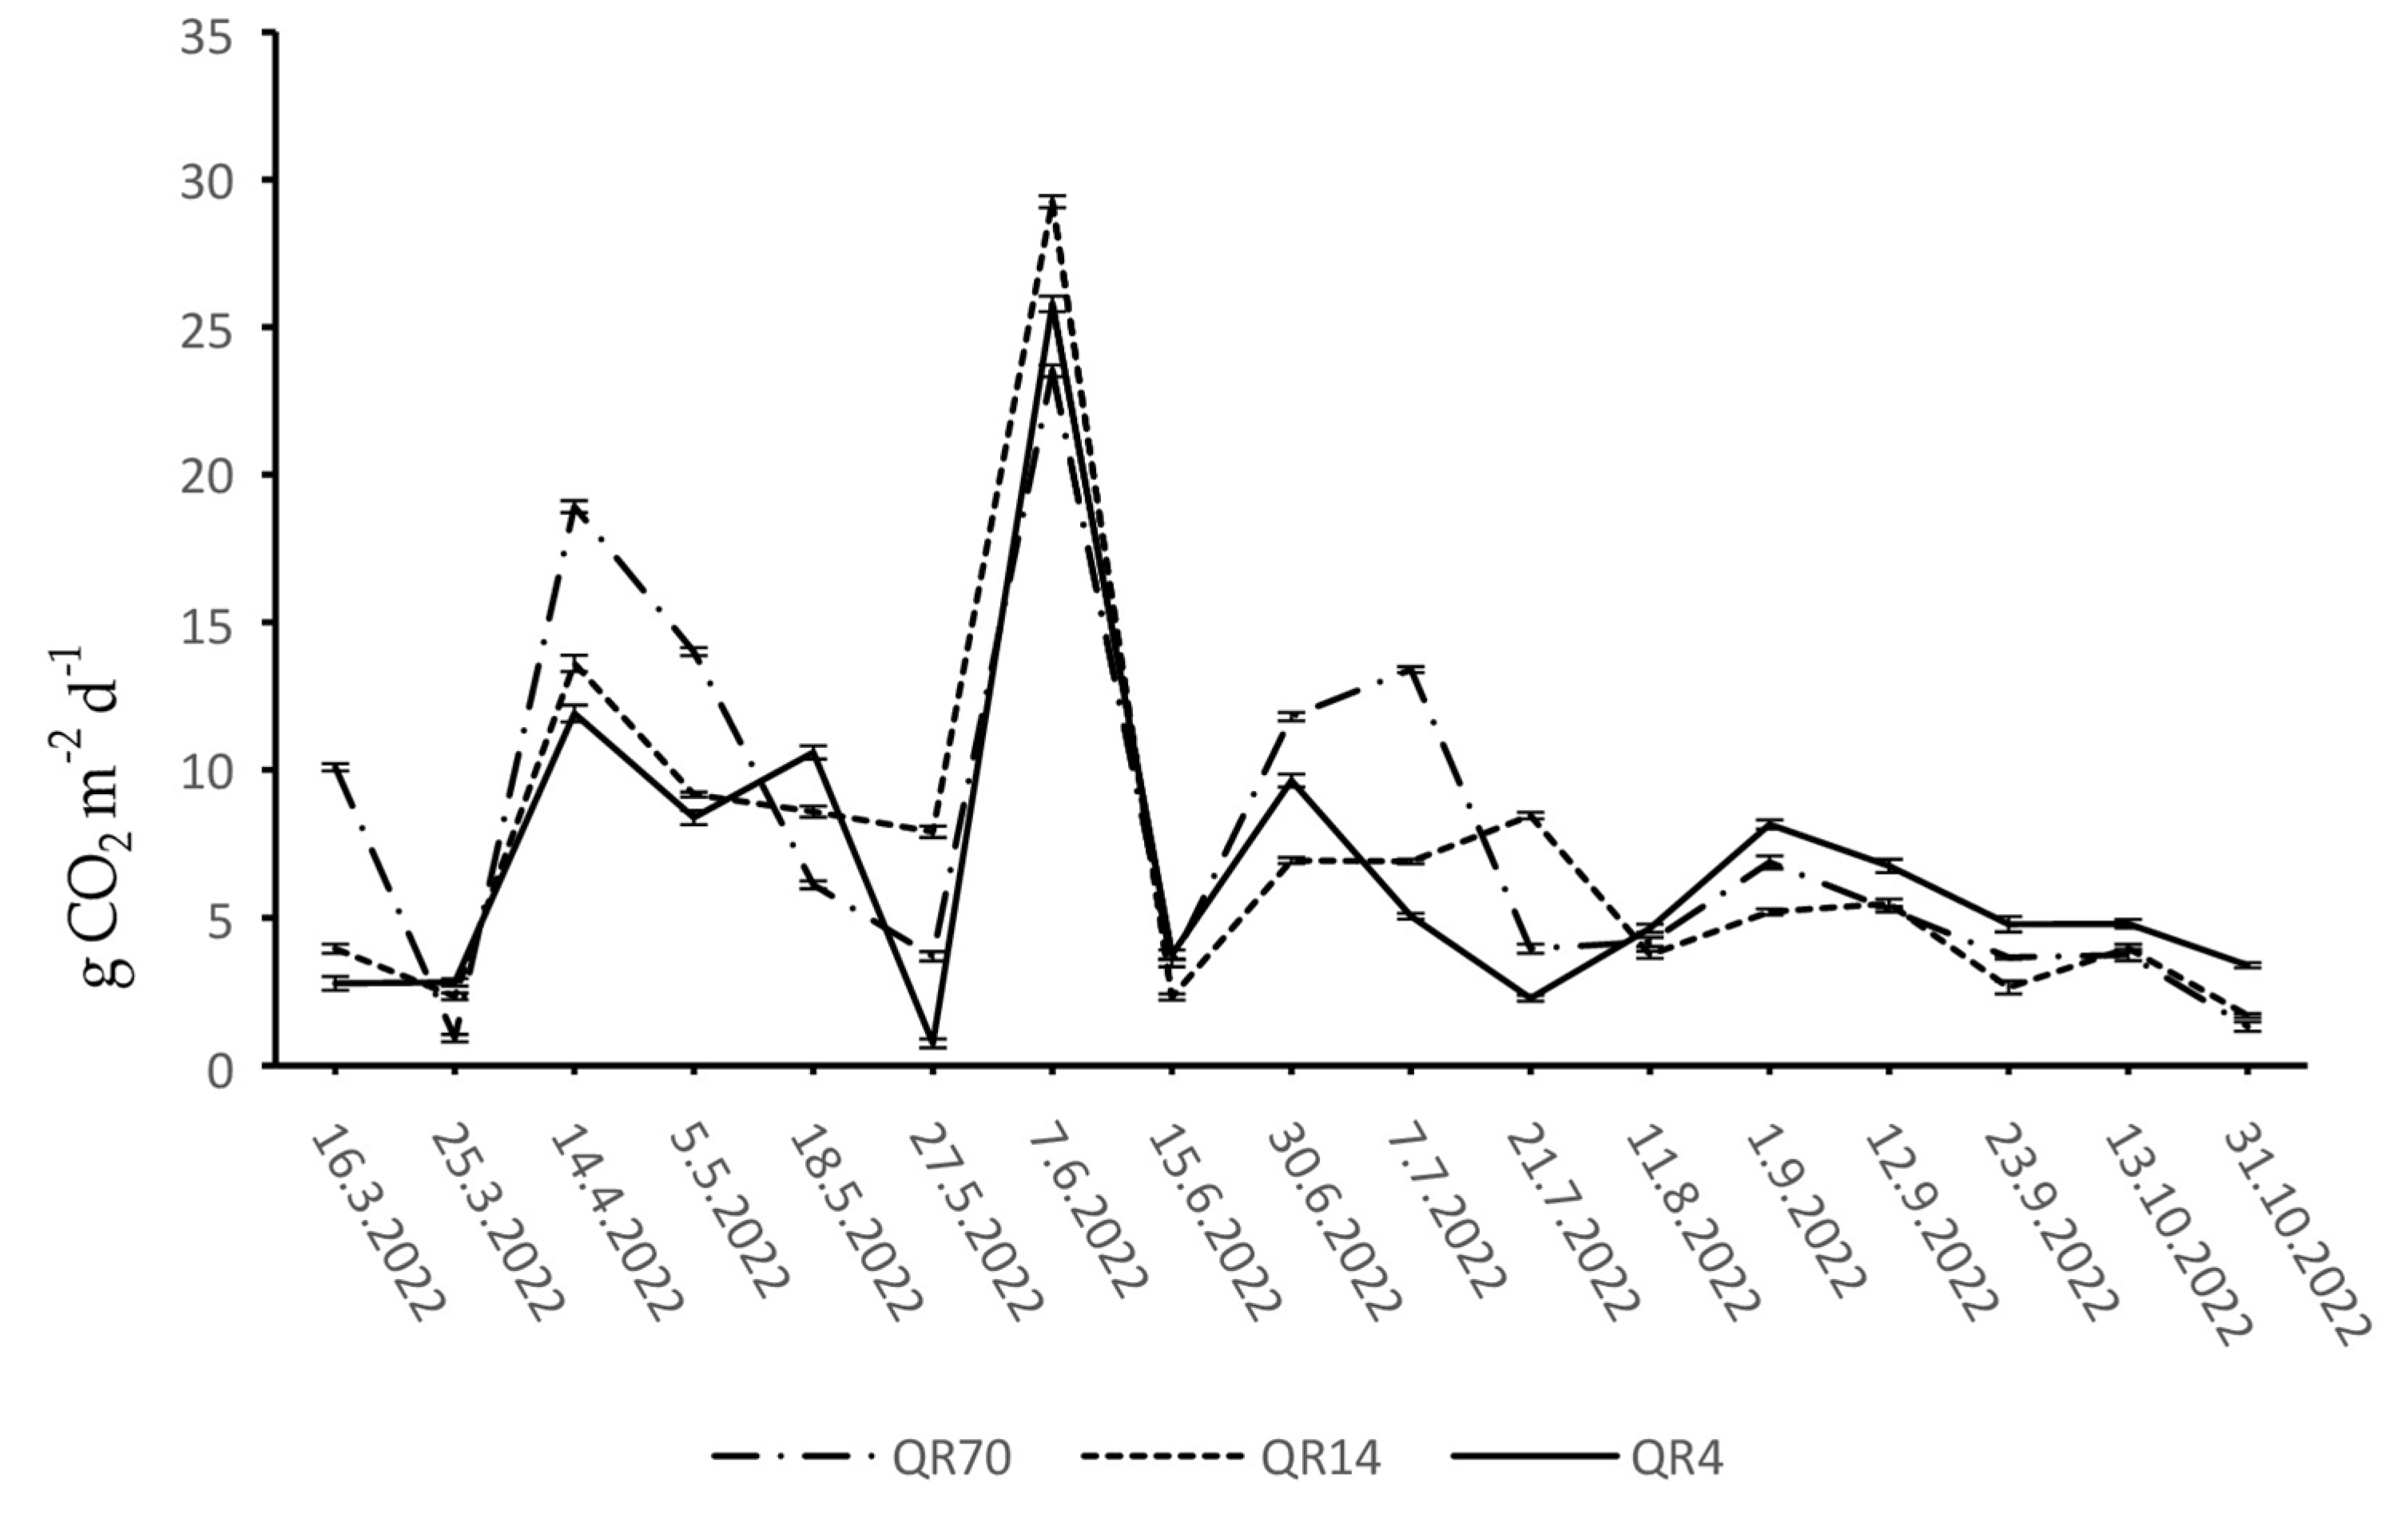
3.2. Dynamics of Soil CO2 Emissions

During 2021, the CO2 emissions from the soil of the study locations within QR70, QR14, and QR4 ranged from 2.89 to 23.21 g CO2 m−2 d−1, 5.46 to 23.41 g CO2 m−2 d−1, and 3.59 to 24.91 g CO2 m−2 d−1, respectively (Figure 4). Similar CO2 emission dynamics were observed in QR14 and QR4 during the months of June, July, and August. Soil CO2 emissions increased in both stands and reached their maximum on the 23 June. At the beginning of July, a sharp drop in emissions was recorded in both stands, while the emissions rose again in the middle of July. The decline in emissions was observed from the middle of July to the first week of August in QR14 and QR4. At the beginning of September, CO2 emissions increased in both stands, while the emission in QR4 decreased gradually until the end of the observation period of 2021. At the end of the observation period in 2021, a slight increase was recorded after the decrease in emissions within QR14. In QR70, the emission values showed an increasing trend during the month of June. A slight increase in emissions was recorded within QR70 at the beginning of July, where the emissions reached their maximum during the observation period of 2021. Afterwards, the emissions decreased until the first week of August. From the last week of July to the end of the observation period of 2021, the CO2 emission dynamics in QR70 showed a similar trend to the emission dynamics in QR14. From the middle of June to the middle of September, the emission trend was generally lower within QR70 compared to the other two stands.
During 2022, soil CO2 emissions within QR70, QR14, and QR4 ranged from 0.93 to 23.52 g CO2 m−2 d−1, 1.69 to 29.25 g CO2 m−2 d−1, and 0.75 to 25.79 g CO2 m−2 d−1, respectively (Figure 5). During the spring period, the emissions reached their maximum on the 14 April within QR70. After this peak, a sharp decline in emissions was recorded until the end of spring. Moreover, the maximum emission values were recorded within QR14 and QR4 during the spring season in the middle of April. The emission trend within QR14 declined slightly until the end of May. After reaching the maximum in QR4, there were alternating decreases and increases in emissions until the end of the spring season.
At the beginning of June, the maximum emission values were measured within all three stands, marking the highest levels recorded during the entire study period. After the peak, a sharp decline was recorded in the middle of June within all three stands. Furthermore, within QR4, the emissions continued to increase until the end of June, followed by a decrease recorded until the third week of July. After the initial decrease, the emissions began to increase again in this stand. Starting from the middle of June to the third week of July, the emissions increased in QR14; afterward, a decrease in emissions was recorded. The emissions increased from the middle of June to the first week of July within QR70. A sharp decline was observed on the 21 July, after which the emissions increased slightly.
Similar soil CO2 emission dynamics were recorded within all three stands during the autumn season in 2022.

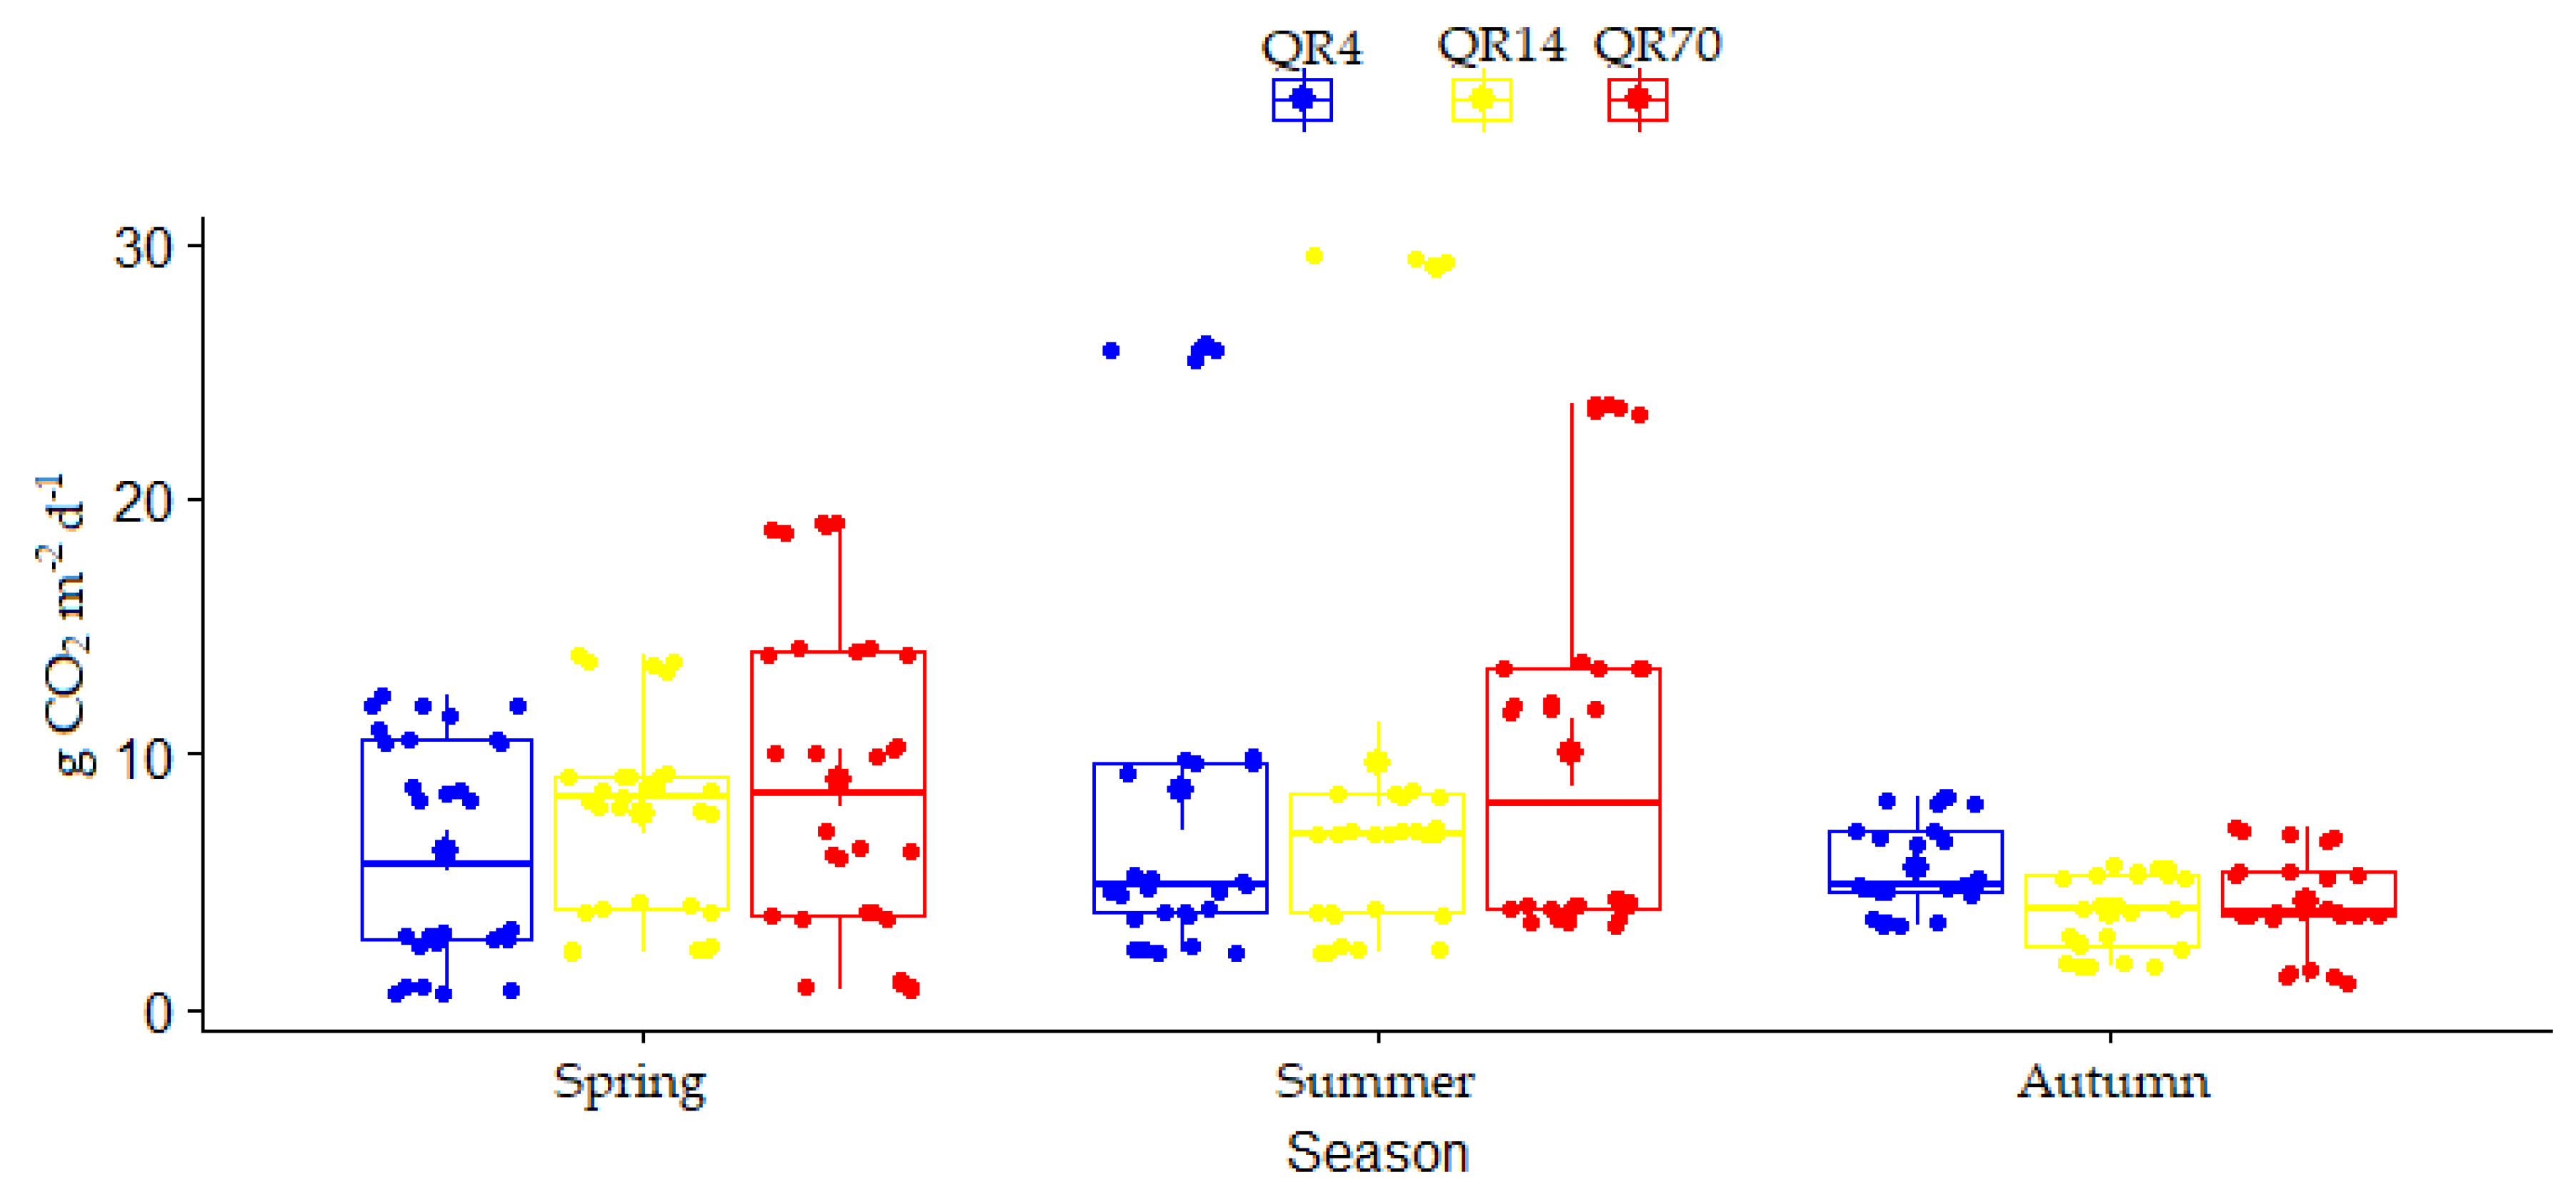
3.3. The Effects of Stand Age and Season on Soil CO2 Emissions

3.3.1. The Effects of Stand Age and Season on Soil CO2 Emission during 2022

The seasonal variation in soil CO2 emission during 2022 for three seasons (spring, summer, and autumn) is shown in Figure 6. During 2022, the season had a significant effect (p < 0.001) on soil CO2 emissions, while the effect of stand age was insignificant (Table 2). Additionally, the interaction between stand age and season had an insignificant effect on emissions during this year (Table 2).

3.3.2. The Effects of Stand Age on Soil CO2 Emission over the Entire Study Period (2021–2022)

During the entire study period (2021–2022), the average CO2 emissions from soil within QR4, QR14, and QR70 were 11.36 g CO2 m−2 d−1, 9.00 g CO2 m−2 d−1, and 9.28 g CO2 m−2 d−1, respectively (Figure 7). The highest average soil CO2 emission was in the youngest stand (QR4). It was estimated that QR4 had significantly higher soil CO2 emissions (p < 0.05) compared to the older stands (QR14 and QR70) over the entire study period (2021–2022) (Figure 7). The greatest value of the coefficient of variation (CV) was obtained within QR4 (71.25%), while CV amounted to 70.94% for QR70. The lowest value of CV was 68.73% within QR14.

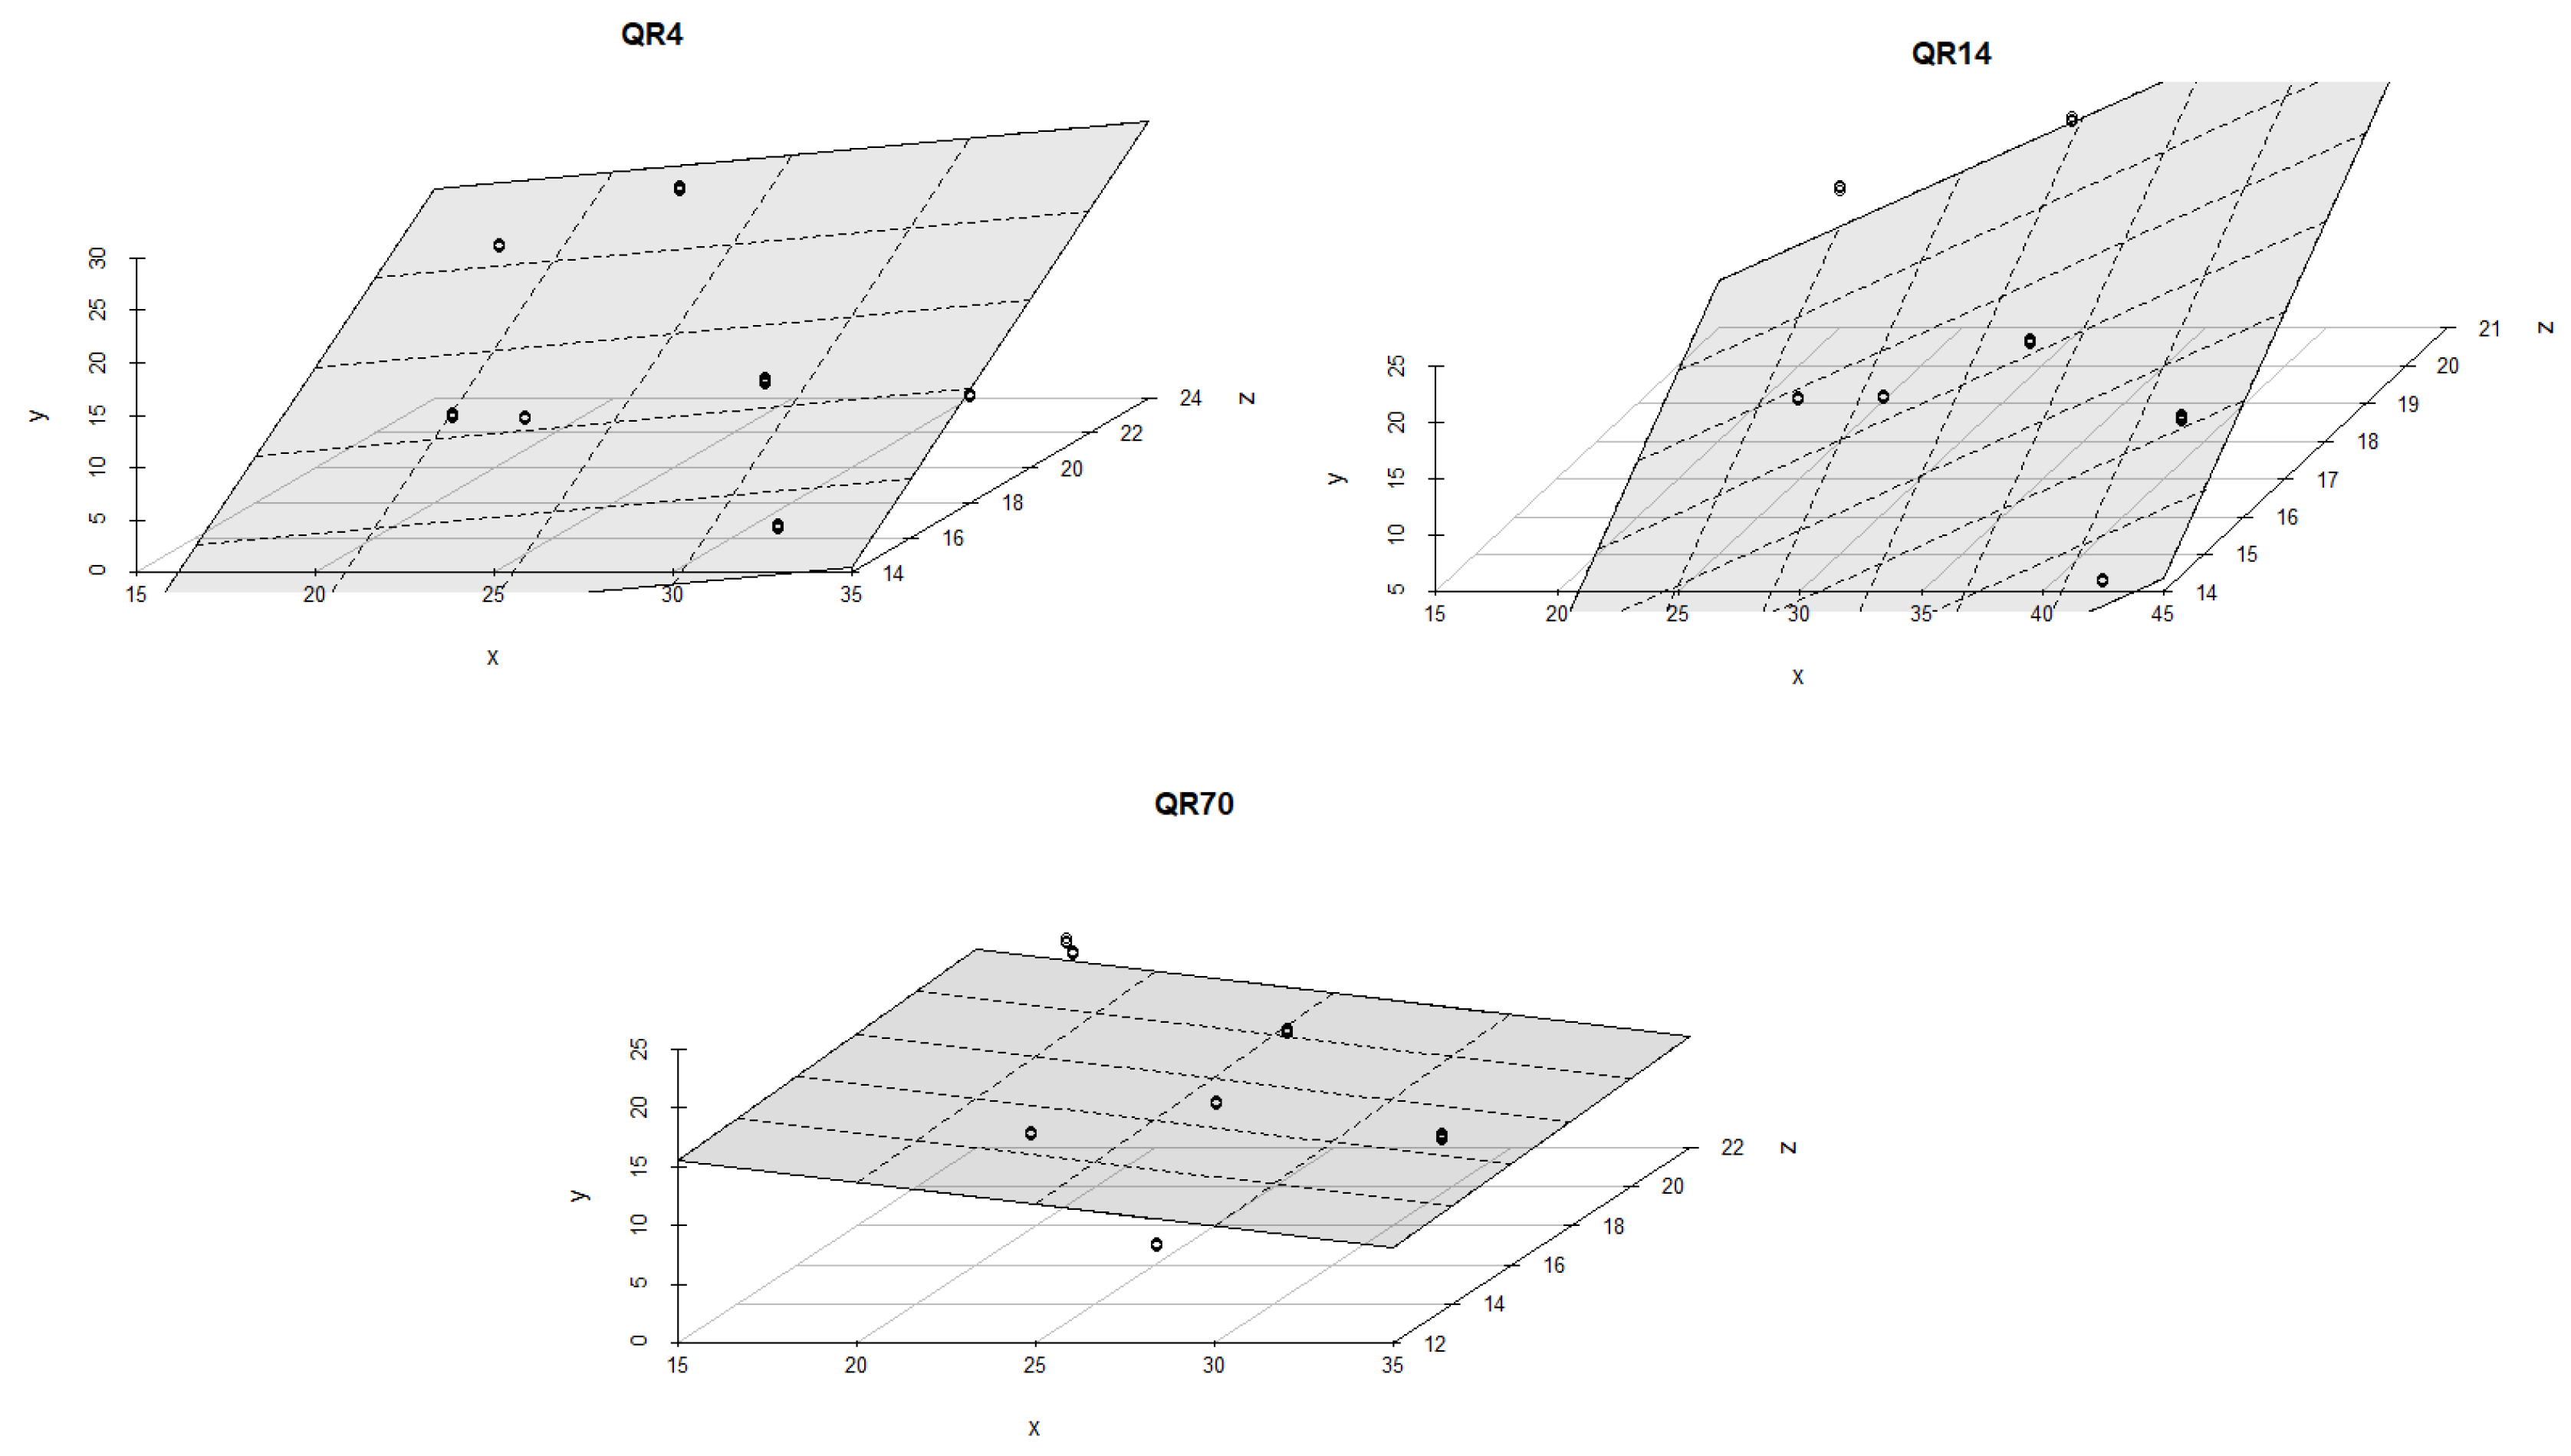
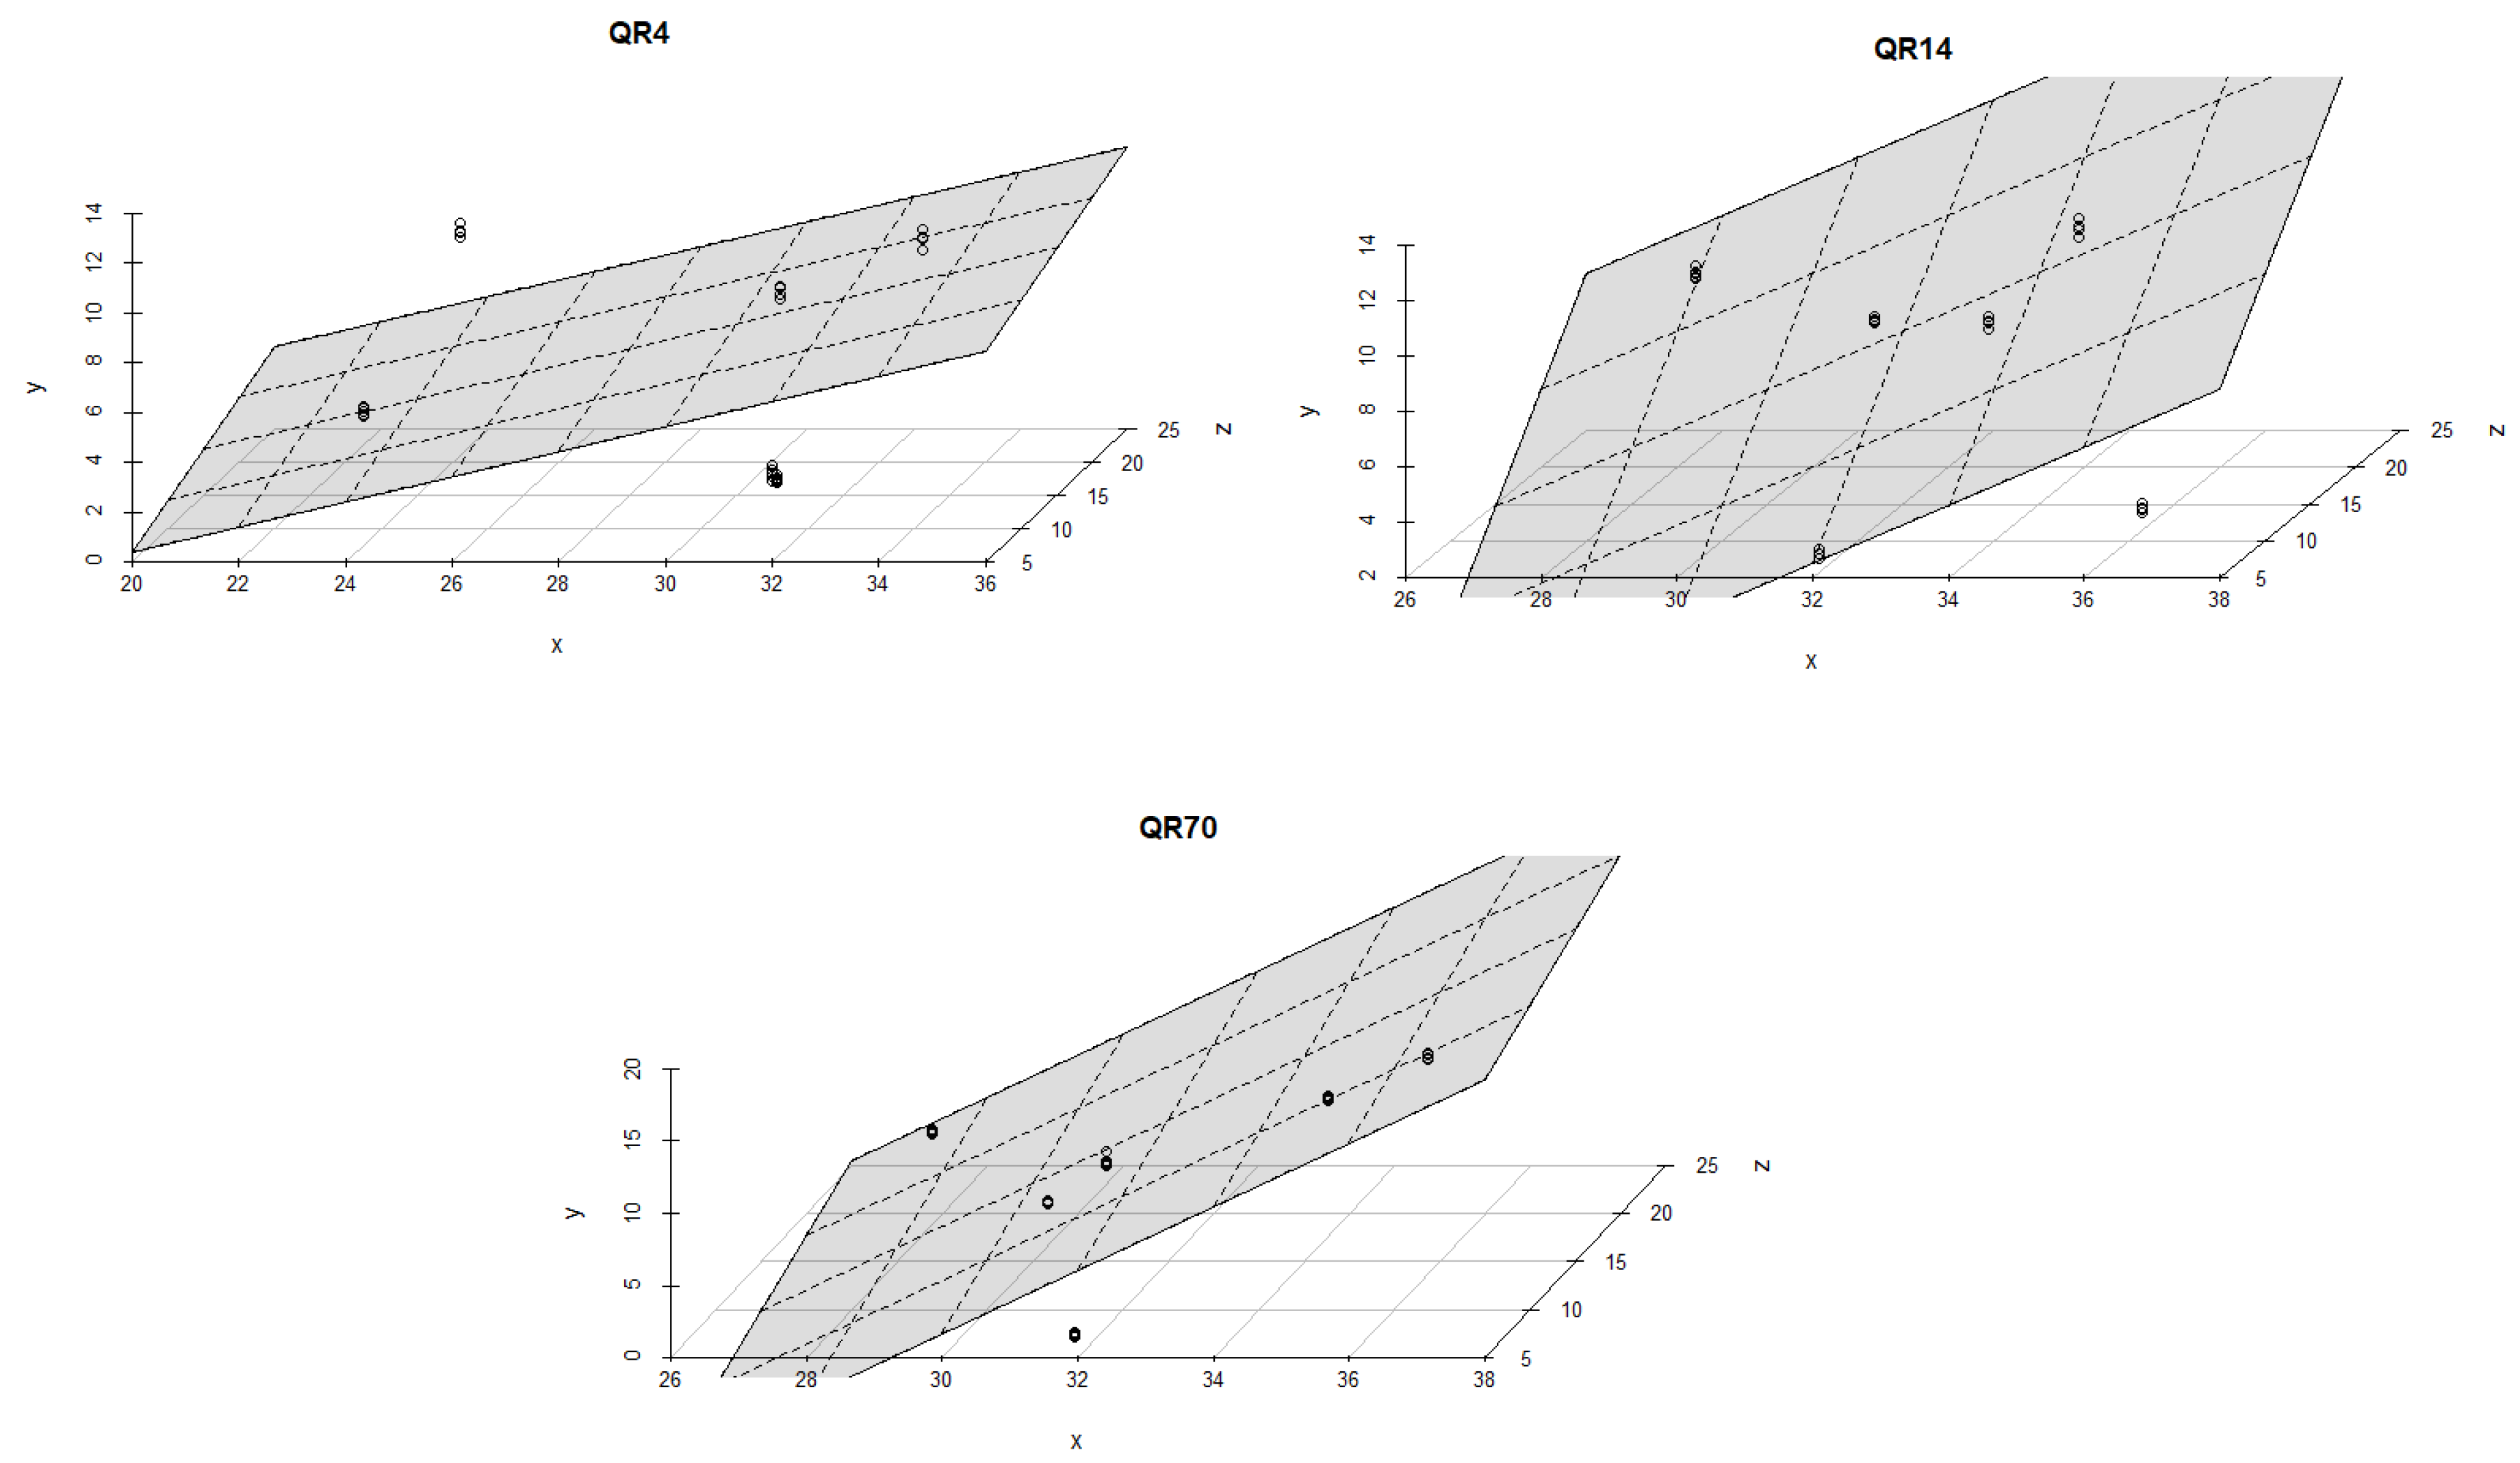
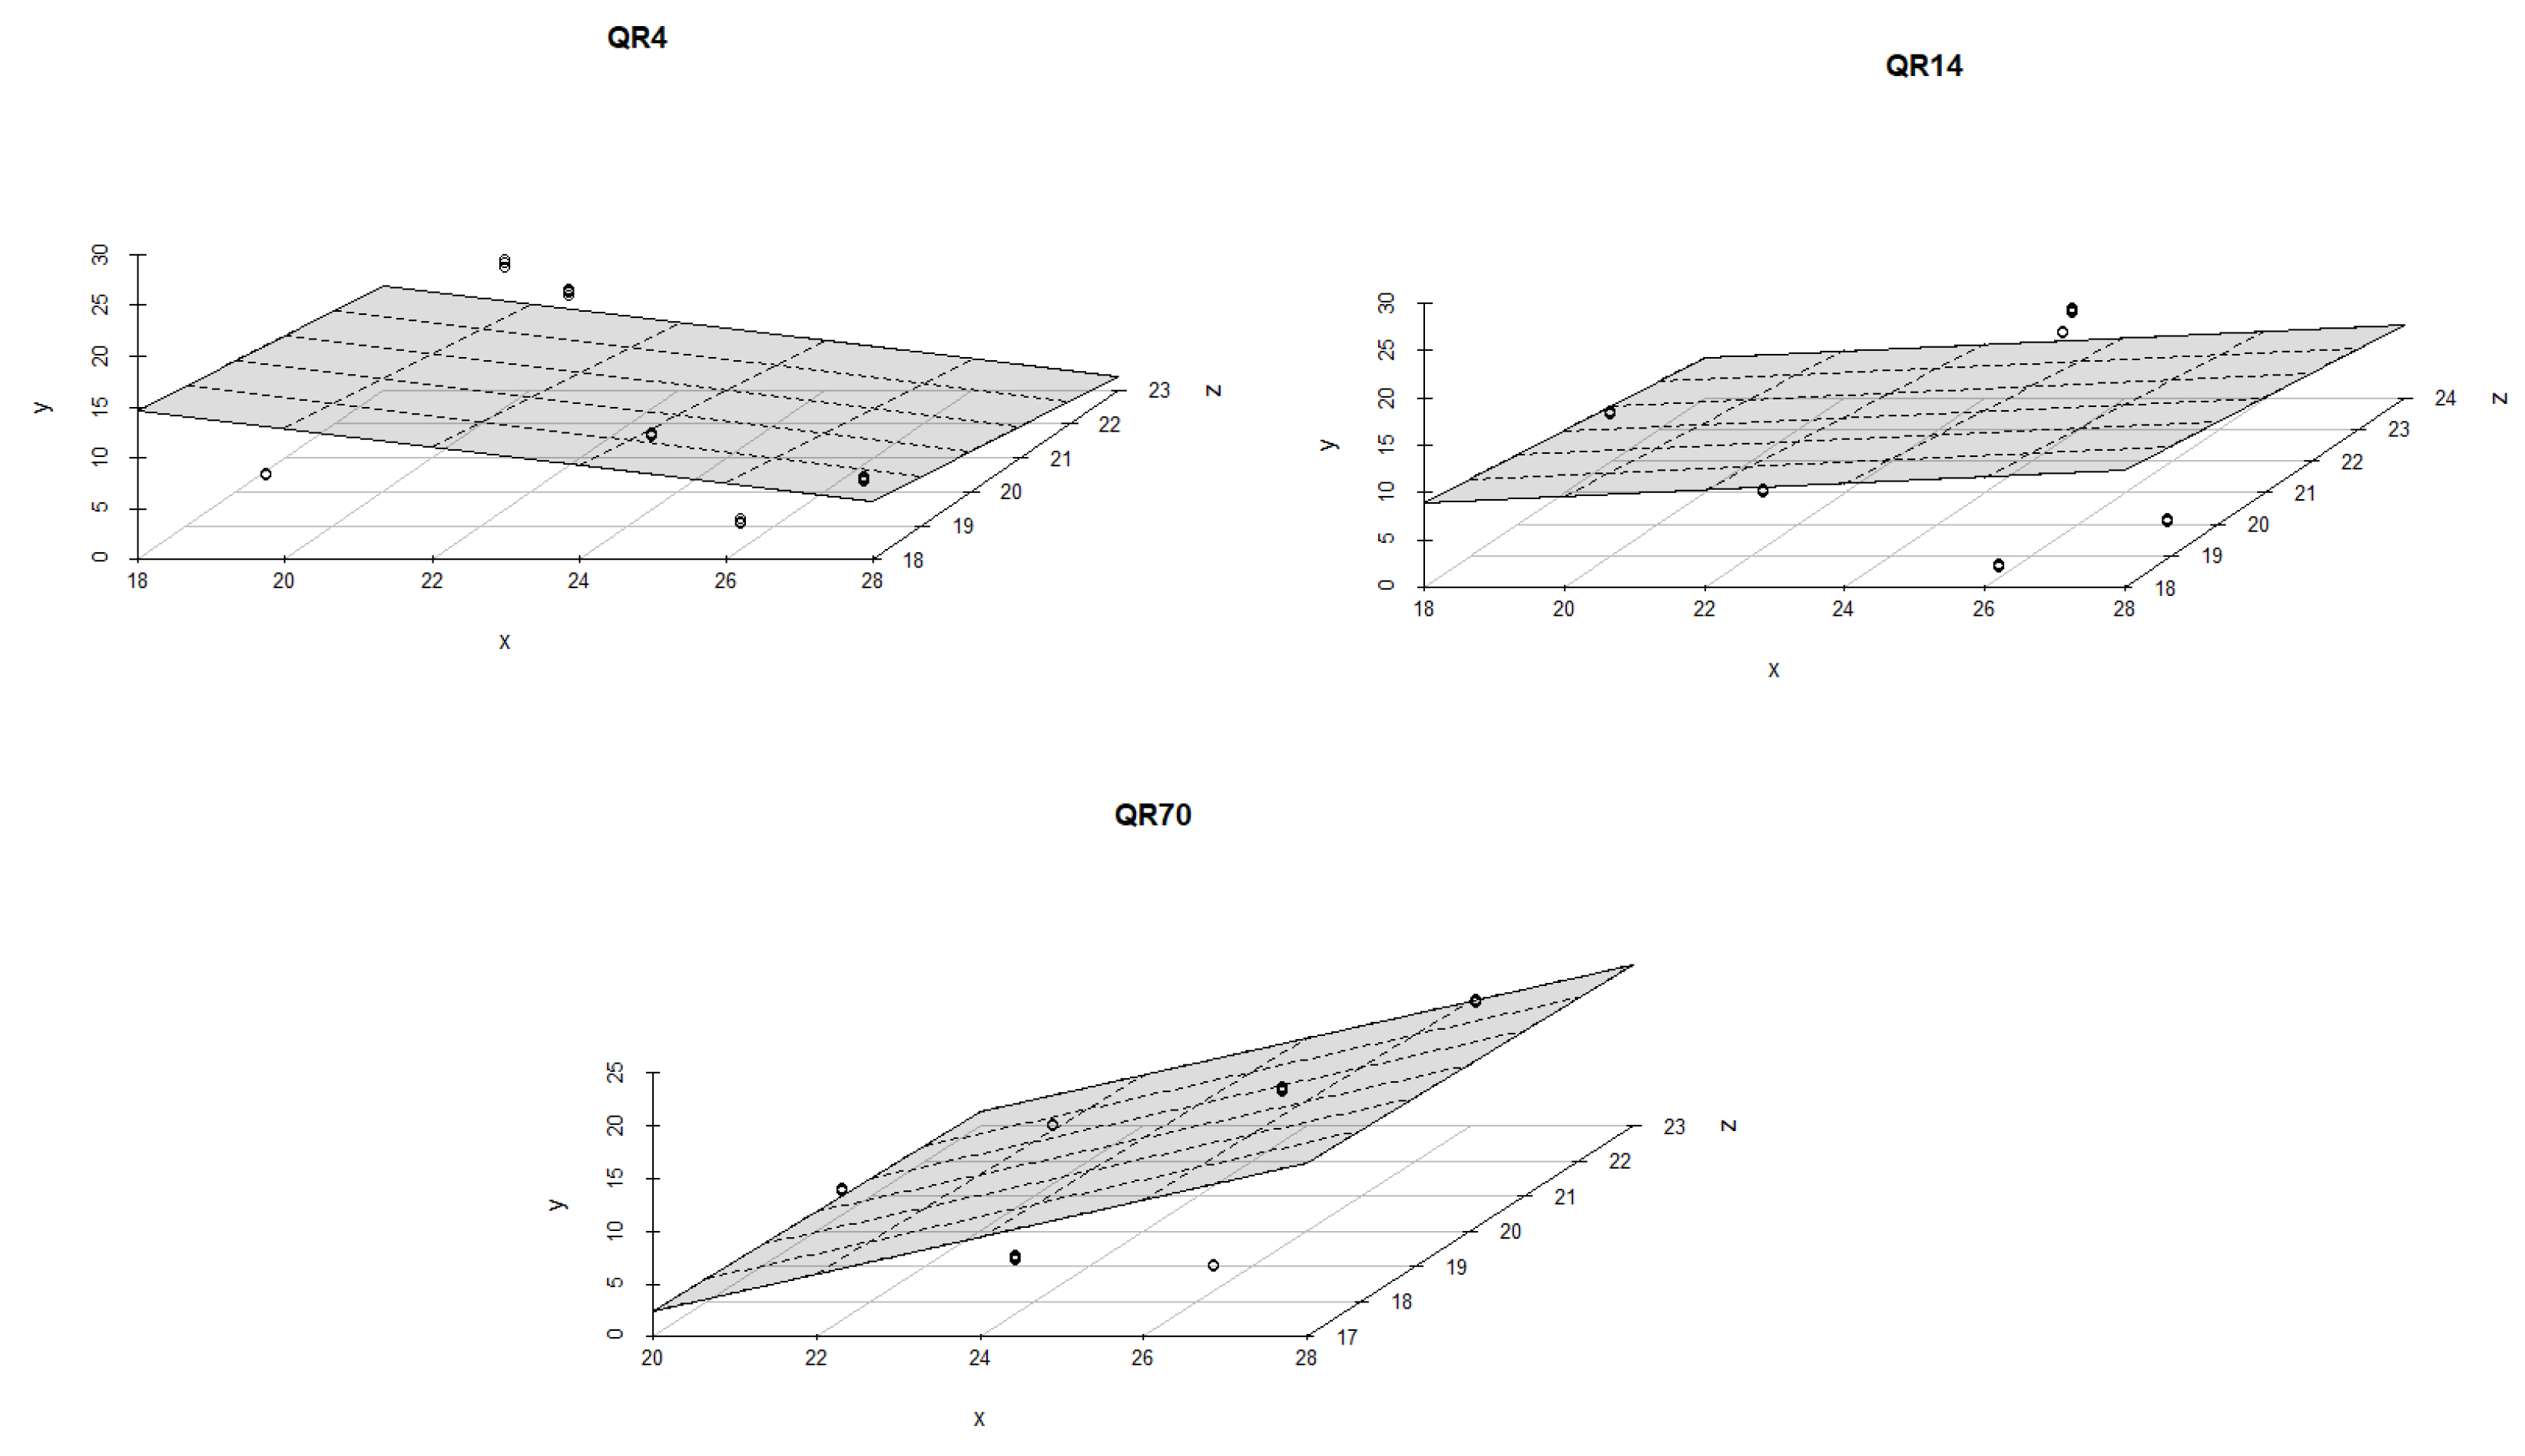
3.4. Influence of Soil Temperature and Soil Moisture on Soil CO2 Emission through Seasons

The regression coefficients, values of coefficient of determination (R2) and p-values for each stand are summarized in Table A1 of Appendix A. The soil temperature was the dominant driver controlling CO2 emissions from the soil within QR14 and QR4 during the summer period of 2021 (Figure 8). With the increment in soil temperature, a significant rise in CO2 emissions was recorded in QR4 compared to the observed values in QR14. The combined effect of soil temperature and moisture on CO2 emissions within QR14 was statistically stronger (R2 = 0.84, p < 0.001 and R2 = 0.92, p < 0.001) than within QR4 (R2 = 0.57, p < 0.001 and R2 = 0.57, p < 0.001 for both models). Soil temperature and moisture had a statistically weak influence on CO2 emissions (R2 =0.08, p = 0.25) within QR70 during this season.
Soil moisture had a statistically stronger effect on the emissions within QR70 and QR4 in comparison with QR14 during the spring season of 2022 (Figure 9). The best multiple regression models were found for QR70 (R2 = 0,75, p < 0.001 and R2 = 0,77, p < 0.001). The lowest value of R2 amounted to 0.12 (p = 0.18) and was obtained for the first regression model within QR4.
A weak relationship was found between CO2 emissions, soil temperature, and soil moisture (p > 0.05) within QR14 and QR4 during the summer of 2022. The values of R2 ranged from 0.07 to 0.25 (p > 0.05) for these two stands. The largest influence of soil moisture and temperature on emissions was in QR70, where soil moisture was the dominant driver in this season (Figure 10). The values of R2 amounted to 0.35 (p < 0.05) and 0.52 (p < 0.001) for both regression models.
During the autumn season, high coefficient of determination values were determined for all three stands. The R2 values ranged from 0.89 to 0.99 (p < 0.001). Soil temperature and moisture had similar effects on soil CO2 emissions within all three stands; more precisely, soil temperature was the dominant factor affecting CO2 emissions (Figure 11).

4. Discussion

This study investigated the impact of stand age on soil CO2 emissions, the seasonal fluctuations of soil CO2 emissions, and the impact of soil temperature and moisture on soil CO2 emissions.

4.1. Seasonal Dynamics of Soil CO2 Emission

The emission of CO2 from soil varies during different seasons in various ecosystems, while key drivers affecting the variation in emissions are soil temperature and soil water content [54]. The results of this study showed that soil temperature and moisture during a two-year observation period had various influences on soil CO2 emissions, which primarily depended on site conditions and the characteristics of the stands. Topography and vegetation type can notably affect CO2 emissions from the soil since they have a very important impact on microsite factors, such as soil temperature and moisture [55]. In forest ecosystems, microclimatic factors are dynamic and different in terms of space and time. The influence of various silvicultural treatments can change microsite conditions in stands; more precisely, forest management at the stand level can affect vegetation cover and microclimatic conditions [56].
In deciduous and coniferous forests, the share of CO2 emission from the soil in terms of total ecosystem respiration varied during different seasons, where the lowest share was in summer, while the greatest share was recorded in the winter season [57]. The variation in CO2 emissions from the soil was pronounced throughout different seasons in successional forests, where the rates of soil CO2 emissions were higher during the hot, humid season than in the cool, dry season [58]. Our study showed that seasons had a statistically significant impact on soil CO2 emissions. During the two-year study period, the emissions of CO2 from soil within all examined stands varied during different seasons. These variations in emissions can be explained by dynamic changes in microclimatic drivers (soil temperature and soil moisture) through seasons, which had the greatest impact on the dynamics of CO2 emissions. Furthermore, the influence of vegetation had great importance, especially in the growing season, when the biggest contribution of autotrophic soil respiration to the total emission of CO2 from soil was found.
The maximum CO2 emissions from the soil were recorded during the rainy season in various forests in India due to higher microbial activity during monsoons, while the lowest emissions were observed during the winter season [59]. The water availability in soil has a strong influence on plant roots and the microbial respiration of soil (heterotrophic component of soil respiration). Differences in the correlation between soil CO2 emission, soil temperature, and soil moisture on wet and dry plots can be explained by the seasonal activity of plants [60]. In a 70-year-old deciduous forest, the emissions increased from May to August, with decreased emissions being observed in autumn [61]. The dynamics of CO2 emissions from soil in various functional zones (residential, industrial, and recreational zones) in the area of Kursk (Russia) showed that emission peaks were recorded during May and June, while the minimum was observed in late autumn [49]. Moreover, in the area of Kursk within different types of soil, emission peaks were recorded during May, July, August, and September [62]. Different emission dynamics were recorded in some semiarid ecosystems throughout various seasons [63]. In 2022, our study showed that peaks in all three stands were recorded in April and June.
Root respiration (autotrophic soil respiration) contributes between 10% and 90% to total soil CO2 emissions, depending on vegetation type and season. The average contribution of the autotrophic component ranged from 45% to 60% [64]. Soil CO2 emissions can vary significantly under different vegetation types because vegetation can affect microclimate and soil properties [65]. Root respiration was higher in the hornbeam (Carpinus betulus L.) plantation during the summer period than in a spruce (Picea obovata Ledeb.) plantation, while root respiration in a spruce plantation was greater during autumn. These differences in emissions can be explained by the different physiological activities of forest species [66]. Root respiration is controlled by abiotic factors and plant phenological changes [61]. The average contribution of autotrophic soil respiration in the total soil CO2 emission amounted to 25% in Austrian mountain forests [67], while root respiration of oak in a savanna was about 40% (Quercus douglasii Hook. & Arn) of total soil respiration [68]. The increase in soil CO2 emissions during the summer period is related to the increment in root biomass and greater activity of soil fauna, which is included in organic matter decomposition and the mineralization of hummus [62]. In our study, we found that the highest values of soil CO2 emissions (peaks) were recorded in spring and summer. This is likely due to the increased physiological activity of trees and the greater activity of soil fauna during these seasons compared to autumn.

4.2. The Influence of Soil Temperature and Moisture on Soil CO2 Emission through Seasons

The influence of limitation factors on CO2 emissions from different soils varied across seasons in the area of Kursk (Russia). During spring and autumn, the most dominant driver of emissions was soil temperature, while soil moisture had the dominant effect during summer [49]. In northeast China, soil moisture had the dominant influence on CO2 emissions from black soils in the initial 27 days after heavy rainfall events, while the main driver of emissions in the last 20 days was soil temperature [69]. Soil CO2 emissions were dominantly controlled by soil temperature in one of the largest parks in Asia (Beijing), but soil moisture had the dominant effect on emissions during the summer season [70]. Furthermore, variations in soil CO2 were mainly controlled by soil temperature in a Chinese mountain area, except for at the beginning of summer [55]. Within the study location, soil temperature was the more dominant driver of emissions in younger stands (QR14 and QR4) during the summer of 2021, whereas soil temperature had a weak effect on emissions in the summer of 2022. However, soil temperature ranged from 14 to 23 °C in both stands during the summer of 2021, while a narrower range of soil temperature (18–24 °C) was measured throughout the summer of 2022. Soil temperature had a weak influence on emission in the middle-aged stand (QR70) during the summers of 2021 and 2022. However, a narrow range of soil temperature (17–23 °C) was measured during the summer of 2022; therefore, the increase in soil moisture had an influence on emissions. Additionally, the rise in soil moisture was followed by increased emissions in the middle-aged stand (QR70) in the spring of 2022. In the autumn of 2022, soil temperature was the dominant factor affecting emissions in all three stands; however, the values of soil moisture remained mostly constant (around 30%) during this period.
The results of the study focusing on agricultural ecosystems in Finland showed that no correlation was found between soil CO2 emissions and soil temperature for sandy soil compared to heavy clay soil [71]. In tropical ecosystems, no correlation was found between soil CO2 emissions and soil temperature because soil temperatures in these ecosystems are relatively constant. Soil moisture, more precisely rainfall, has the highest influence on CO2 emissions in tropical ecosystems [54]. In our study, the impact of soil temperature and moisture on CO2 emissions was different across various seasons due to climate characteristics (the range of main drivers of emission) and their constancy during seasons.

4.3. The Influence of Stand Age on Soil CO2 Emission

In pine stands (Pinus taeda L.) of different ages, the average soil CO2 emissions were higher in older stands, which can be partially ascribed to the increase in root biomass (the greater biomass that respires) [72]. However, it is difficult to assume whether microbial activity increases or decreases with increasing stand age; however, microbial activity mostly depends on disturbances to forest soil, cutting intensity, microclimate changes, and the input of organic matter [72]. Autotrophic soil respiration (root respiration) is generally controlled by the net primary production (NPP) of forests [73]. The higher CO2 emissions from the soil in older forest stands can be explained by the larger biomass of roots, greater amount of litterfall and more numerous microorganisms in comparison to younger stands [74].
In pine stands (Pinus massoniana Lamb.), the increment in tree crowns was followed by root growth and the increment in carbon input to the soil, which resulted in higher soil respiration [75,76]. Moreover, soil CO2 emissions increased with stand age within stands of various species, where the highest value of the heterotrophic component of soil respiration was measured in the oldest stands [77,78]. Within Sitka spruce (Picea sitchensis (Bong.) Carr.) plantations, heterotrophic soil respiration decreased with stand age; however, it increased slightly in the oldest stand [79].
However, some studies showed that soil CO2 emissions decreased with stand age within different forest species and plantations [79,80,81,82,83,84,85]. The higher soil CO2 emissions in younger stands are explained as result of a high bacteria/fungi ratio, the physiological activity of fine roots, and higher soil temperatures, which leads to the loss of soil carbon and higher CO2 emissions from the soil [84]. In addition, there was no significant effect of stand age on soil respiration within Larix principis-rupprechtii plantations [86]. Within the same soil type (Chernozem), soil CO2 emissions in the youngest stand (QR4) were statistically higher compared to the other two stands (Q14 and Q70) for the entire study period (2021–2022). However, there were no statistically significant differences in emissions between stands in 2022. Although the same soil type was detected within all tree stands, soil carbon content was different in the topsoil. The highest content of soil carbon was found in QR4 (the youngest stand), where the rise in soil temperature can accelerate the mineralization of hummus.

5. Conclusions

Soil temperature and soil moisture, as the most important drivers of soil CO2 emissions, had diverse influences on soil CO2 emissions, depending on stand age, i.e., stand structure, site conditions, and seasons. Seasons had statistically significant effects on soil CO2 emissions during 2022. The soil CO2 emission dynamics varied during the different seasons due to changes in microsite factors as well as the influence of vegetation, especially in the growing season, when there is the highest contribution of autotrophic soil respiration to total CO2 emissions from soil. The variation in soil CO2 emissions was explained using a multiple linear regression model, including soil temperature, soil moisture, and their interactions.
Soil CO2 emissions in the youngest stand (QR4) were significantly higher compared to the other two stands (Q14 and Q70) on the same soil type (Chernozem) for the entire study period (2021–2022). The influence of soil moisture and temperature on emissions varied in the examined stands across different seasons. The different characteristics of the stands within the study location can explain the various dynamics of soil CO2 emissions. These characteristics include stand canopy, stand development stage (stand age), number of trees per hectare, mean diameter of the stand, and root density.
This study highlighted how soil CO2 emissions were affected by stand age and emphasized how afforestation management (establishment of new pedunculate forests) can affect soil carbon cycling in floodplain pedunculate oak forests. The seasons had a statistically significant effect on soil CO2 emissions in the examined stands during 2022. During the entire study period (2021–2022), QR4 had significantly higher soil CO2 emissions compared to QR14 and QR70, while there were no statistically significant differences in emissions between QR14 and QR70. These results showed the that natural high stand (QR70) had significantly lower soil CO2 emissions compared to the artificially regenerated stand (QR4). However, the 14-year-old stand (QR14) showed a similar response to soil CO2 emissions as the 70-year-old stand (QR70) during the entire study period. Understanding the effects of stand age on soil CO2 emission is pivotal for predicting the potential of soil carbon sequestration.

Author Contributions

V.K., Z.G. and M.S. designed the experiment, V.K., Z.G., N.P. and L.K. collected samples, M.S., V.K. and Z.G. performed laboratory analyses, V.K. wrote this paper, S.O. and M.Z. provided some suggestions to improve the paper quality. All authors have read and agreed to the published version of the manuscript.

Funding

This research was funded by the Ministry of Science, Technological Development, and Innovation of the Republic of Serbia (Grants No. 451-03-66/2024-03/200197).

Data Availability Statement

The data presented in this study are available from the corresponding author upon request.

Acknowledgments

We acknowledge the “VojvodinaŠume” public enterprise and the Institute for Nature Conservation of Vojvodina Province.

Conflicts of Interest

The authors declare no conflicts of interest.

Appendix A

Table A1. Regression equations of soil CO2 emission against soil temperature and soil water content in different seasons for each examined stand.
Stand/SeasonMod.eelRegression EquationsCoefficientsNR2R2adjp-Value
abcd
QR70/Summer of 20211.y = a + bT + cW19.4380.132−0.370 350.080.030.25
2.y = a + bT + cW + dTW309.848 ***−15.955 **−11.378 ***0.619 **350.350.29<0.05
QR14/Summer of 20211.y = a + bT + cW−101.547 ***4.579 ***0.968 *** 350.850.84<0.001
2.y = a + bT + cW + dTW−187.330 ***9.079 ***3.286 ***−0.124 ***350.920.91<0.001
QR4/Summer of 20211.y = a + bT + cW−46.818 ***2.581 ’0.319 *** 350.570.54<0.001
2.y = a + bT + cW + dTW−63.991 ’3.447 *0.945−0.032350.570.53<0.001
QR70/Spring of 20221.y = a + bT + cW−66.021 ***0.372 ***2.193 ** 300.750.73<0.001
2.y = a + bT + cW + dTW−89.608 ***2.4112.972 ***−0.067300.770.74<0.001
QR14/Spring of 20221.y = a + bT + cW−33.839 *0.570 **1.047 ** 300.300.25<0.05
2.y = a + bT + cW + dTW−10.425−1.5320.2740.071 ’300.390.32<0.05
QR4/Spring of 20221.y = a + bT + cW−10.3300.1450.502 300.120.050.18
2.y = a + bT + cW + dTW34.040 *−3.136 *−1.146 ***0.130 ***300.460.40<0.001
QR70/Summer of 20221.y = a + bT + cW−29.455−0.1841.750 *** 300.350.30<0.05
2.y = a + bT + cW + dTW−630.681 **30.809 **24.721 **−1.186 **300.520.46<0.001
QR14/Summer of 20221.y = a + bT + cW16.446−0.7660.344 300.07-0.37
2.y = a + bT + cW + dTW−689.561 *34.755 *29.783 *−1.492 *300.250.160.06
QR4/Summer of 20221.y = a + bT + cW46.889−0.901−0.890 300.080.010.32
2.y = a + bT + cW + dTW−6.4601.9231.602−0.132300.08-0.51
QR70/Autumn of 20221.y = a + bT + cW−12.653 ***0.577 ***0.295 *** 250.990.99<0.001
2.y = a + bT + cW + dTW−15.586 ’0.8260.391−0.008250.990.99<0.001
QR14/Autumn of 20221.y = a + bT + cW−5.2530.553 ***0.031 250.890.88<0.001
2.y = a + bT + cW + dTW153.956 ***−11.358 ***−5.091 ***0.383 ***250.990.99<0.001
QR4/Autumn of 20221.y = a + bT + cW−7.177 ***0.552 ***0.146 ** 250.920.91<0.001
2.y = a + bT + cW + dTW−15.3271.1930.422−0.022250.930.92<0.001
Signif. codes: *** (0.001); ** (0.01); * (0.05); ’ (0.1).

Appendix B

Figure A1. Middle-aged stand—70-year-old pedunculate oak stand (QR70).
Forests 15 01574 g0a1
Figure A2. Soil profile in the examined stand (70-year-old pedunculate oak stand—QR70).
Forests 15 01574 g0a2
Figure A3. Sapling stand—14-year-old pedunculate oak stand (QR14).
Forests 15 01574 g0a3
Figure A4. Soil profile in the examined stand (14-year-old pedunculate oak stand—QR14).
Forests 15 01574 g0a4
Figure A5. Sapling stand—14-year-old pedunculate oak stand (QR4).
Forests 15 01574 g0a5
Figure A6. Soil profile in the examined stand (4-year-old pedunculate oak stand—QR4).
Forests 15 01574 g0a6

References

  1. Rahman, M.M. Carbon dioxide emission from soil. Agric. Res. 2013, 2, 132–139. [Google Scholar] [CrossRef]
  2. Stojanović, D.B.; Orlović, S.; Zlatković, M.; Kostić, S.; Vasić, V.; Miletić, B.; Kesić, L.; Matović, B.; Božanić, D.; Pavlović, L.; et al. Climate change within Serbian forests: Current state and future perspectives. Topola 2021, 208, 39–56. [Google Scholar] [CrossRef]
  3. Tanovski, V.; Matovic, B.; Kesic, L.; Stojanovic, D.B. A review of the influence of climate change on coniferous forests in the Balkan peninsula. Topola 2022, 210, 41–64. [Google Scholar] [CrossRef]
  4. Netz, B.; Davidson, O.; Bosch, P.; Dave, R.; Meyer, L. Climate Change 2007: Mitigation. Contribution of Working Group III to the Fourth Assessment Report of the Intergovernmental Panel on Climate Change. Summary for Policymakers; Cambridge University Press: Cambridge, UK, 2007. [Google Scholar]
  5. Pan, Y.; Birdsey, R.A.; Fang, J.; Houghton, R.; Kauppi, P.E.; Kurz, W.A.; Phillips, O.L.; Shvidenko, A.; Lewis, S.L.; Canadell, J.G.; et al. A large and persistent carbon sink in the world’s forests. Science 2011, 333, 988–993. [Google Scholar] [CrossRef] [PubMed]
  6. Siraj, M. Forest carbon stocks in woody plants of Chilimo-Gaji Forest, Ethiopia: Implications of managing forests for climate change mitigation. S. Afr. J. Bot. 2019, 127, 213–219. [Google Scholar] [CrossRef]
  7. Vuletić, D.; Potočić, N.; Krajter, S.; Seletković, I.; Fürst, C.; Makeschin, F.; Galić, Z.; Lorz, C.; Matijašič, D.; Zupanič, M.; et al. How socio-economic conditions influence forest policy development in Central and South-east Europe. Environ. Manag. 2010, 46, 931–940. [Google Scholar] [CrossRef]
  8. Amundson, R. The carbon budget in soils. Annu. Rev. Earth Planet. Sci. 2001, 29, 535–562. [Google Scholar] [CrossRef]
  9. Change, I. 2006 IPCC Guidelines for National Greenhouse Gas Inventories; Institute for Global Environmental Strategies: Hayama, Japan, 2006. [Google Scholar]
  10. Valentini, R.; Matteucci, G.; Dolman, A.J.; Schulze, E.D.; Rebmann, C.; Moors, E.J.; Granier, A.; Gross, P.; Jensen, N.O.; Pilegaard, K.A.; et al. Respiration as the main determinant of carbon balance in European forests. Nature 2000, 404, 861–865. [Google Scholar] [CrossRef]
  11. Wei, X.; Shao, M.; Gale, W.; Li, L. Global pattern of soil carbon losses due to the conversion of forests to agricultural land. Sci. Rep. 2014, 4, 4062. [Google Scholar] [CrossRef]
  12. Lubbers, I.M.; Van Groenigen, K.J.; Fonte, S.J.; Six, J.; Brussaard, L.; Van Groenigen, J.W. Greenhouse-gas emissions from soils increased by earthworms. Nat. Clim. Change 2013, 3, 187–194. [Google Scholar] [CrossRef]
  13. Phillips, C.L.; Nickerson, N. Soil Respiration. In Reference Module in Earth Systems and Environmental Sciences; Elias, S., Ed.; Elsevier: Amsterdam, The Netherlands, 2015. [Google Scholar]
  14. Kuzyakov, Y. Sources of CO2 efflux from soil and review of partitioning methods. Soil Biol. Biochem. 2006, 38, 425–448. [Google Scholar] [CrossRef]
  15. Teramoto, M.; Liang, N.; Takahashi, Y.; Zeng, J.; Saigusa, N.; Ide, R.; Zhao, X. Enhanced understory carbon flux components and robustness of net CO2 exchange after thinning in a larch forest in central Japan. Agric. For. Meteorol. 2019, 274, 106–117. [Google Scholar] [CrossRef]
  16. Barba, J.; Cueva, A.; Bahn, M.; Barron-Gafford, G.A.; Bond-Lamberty, B.; Hanson, P.J.; Jaimes, A.; Kulmala, L.; Pumpanen, J.; Scott, R.L.; et al. Comparing ecosystem and soil respiration: Review and key challenges of tower-based and soil measurements. Agric. For. Meteorol. 2018, 249, 434–443. [Google Scholar] [CrossRef]
  17. Oertel, C.; Matschullat, J.; Zurba, K.; Zimmermann, F.; Erasmi, S. Greenhouse gas emissions from soils—A review. Geochemistry 2016, 76, 327–352. [Google Scholar] [CrossRef]
  18. Teramoto, M.; Liang, N.; Zeng, J.; Saigusa, N.; Takahashi, Y. Long-term chamber measurements reveal strong impacts of soil temperature on seasonal and inter-annual variation in understory CO2 fluxes in a Japanese larch (Larix kaempferi Sarg.) forest. Agric. For. Meteorol. 2017, 247, 194–206. [Google Scholar] [CrossRef]
  19. Prasad, S.; Baishya, R. Interactive effects of soil moisture and temperature on soil respiration under native and non-native tree species in semi-arid forest of Delhi, India. Trop. Ecol. 2020, 60, 252–260. [Google Scholar] [CrossRef]
  20. Yu, J.C.; Chiang, P.N.; Lai, Y.J.; Tsai, M.J.; Wang, Y.N. High rainfall inhibited soil respiration in an Asian monsoon forest in Taiwan. Forests 2021, 12, 239. [Google Scholar] [CrossRef]
  21. Mühlbachová, G.; Kusá, H.; Růžek, P.; Vavera, R. CO2 emissions in a soil under different tillage practices. Plant Soil Environ. 2022, 68, 253–261. [Google Scholar] [CrossRef]
  22. Wu, G.; Chen, X.M.; Ling, J.; Li, F.; Li, F.Y.; Peixoto, L.; Wen, Y.; Zhou, S.-L. Effects of soil warming and increased precipitation on greenhouse gas fluxes in spring maize seasons in the North China Plain. Sci. Total Environ. 2020, 734, 139269. [Google Scholar] [CrossRef]
  23. Pregitzer, K.S.; Euskirchen, E.S. Carbon cycling and storage in world forests: Biome patterns related to forest age. Glob. Chang. Biol. 2004, 10, 2052–2077. [Google Scholar] [CrossRef]
  24. Seedre, M.; Chen, H.Y. Carbon dynamics of aboveground live vegetation of boreal mixedwoods after wildfire and clear-cutting. Can. J. For. Res. 2010, 40, 1862–1869. [Google Scholar] [CrossRef]
  25. Wang, Z.Y.; Xie, J.B.; Wang, Y.G.; Li, Y. Biotic and abiotic contribution to diurnal soil CO2 fluxes from saline/alkaline soils. Sci. Rep. 2020, 10, 5396. [Google Scholar] [CrossRef]
  26. Reichstein, M.; Beer, C. Soil respiration across scales: The importance of a model—Data integration framework for data interpretation. J. Plant Nutr. Soil Sci. 2008, 171, 344–354. [Google Scholar] [CrossRef]
  27. Tang, J.; Qi, Y.; Xu, M.; Misson, L.; Goldstein, A.H. Forest thinning and soil respiration in a ponderosa pine plantation in the Sierra Nevada. Tree Physiol. 2005, 25, 57–66. [Google Scholar] [CrossRef]
  28. Pilipović, A.; Orlović, S.; Zhiyanski, M.; Andonovski, V.; Galić, Z. Soil respiration measurement in beech forest during two vegetation periods at Stara planina. Topola 2015, 195–196, 97–105. [Google Scholar]
  29. Pilipović, A.; Orlović, S.; Galić, Z.; Stojnić, S.; Borišev, M.; Župunski, M. Soil respiration in two different conifer stands during vegetation period 2011–2013. Topola 2014, 193-194, 73–84. [Google Scholar]
  30. Pilipović, A.; Orlović, S.; Galić, Z.; Stojnić, S.; Borišev, M.; Nikolić, N. The results of monitoring of soil respiration in two different beech associations during vegetation period. Topola 2011, 187–188, 65–75. [Google Scholar]
  31. Samardžić, M.; Galić, Z.; Orlović, S.; Kovač, M.; Andreeva, I.; Vasenev, I. Environmental assessment of greenhouse gases’ emission in poplar plantation under extreme climate conditions of winter 2019/2020. Topola 2021, 208, 15–19. [Google Scholar] [CrossRef]
  32. Karaklić, V.; Galić, Z.; Samardžić, M.; Kesić, L.; Orlović, S.; Zorić, M. Carbon dioxide (CO2) emissions from soils during the regeneration of pedunculate oak (Quercus robur L.) stand in the summer period. Šumarski List 2023, 147, 227–237. [Google Scholar] [CrossRef]
  33. Banković, S.; Medarević, M.; Pantić, D.; Petrović, N. National Forest Inventory of the Republic of Serbia—The Growing Stock of the Republic of Serbia; Ministry of Agriculture, Forestry and Water Management of the Republic of Serbia—Forest Directorate: Belgrade, Serbia, 2009; pp. 1–238.
  34. Development Plan of Srem Forest Area. Available online: https://psp.vojvodina.gov.rs/wp-content/uploads/2021/01/Plan-razvoja-Sremskog-sumskog-podrucja-knjiga-1.pdf (accessed on 5 December 2023).
  35. Nikić, Z.; Letić, L.J.; Nikolić, V.; Filipović, V. Procedure for Underground Water Calculation Regime of Pedunculata oak Habitat in Plain Srem. Bull. Fac. For. 2010, 101, 125–138. [Google Scholar]
  36. Jokanović, D.; Desimirović, I.; Živanović, K. Taxonomy and phytogeography analysis of medicinal plants within forest complex of pedunculate oak at the area of Gornji Srem. Topola 2022, 210, 5–14. [Google Scholar] [CrossRef]
  37. Cvetićanin, R.; Brujić, J.; Perović, M.; Stupar, V. Dendrology; University of Belgrade—Faculty of Forestry: Belgrade, Serbia, 2016; pp. 1–557. [Google Scholar]
  38. Rađević, V.; Pap, P.; Vasić, V. Management of the common oak forests in Ravni Srem: Yesterday, today, tomorrow. Topola 2020, 206, 41–52. [Google Scholar] [CrossRef]
  39. Republic Hydrometeorological Service of Serbia. Available online: https://www.hidmet.gov.rs/ (accessed on 10 December 2023).
  40. Jović, D.; Jović, N.; Jovanović, B.; Tomić, Z.; Banković, S.; Medarević, M.; Knežević, M.; Grbić, P.; Živanov, N.; Ivanišević, P. Forest Types of Ravni Srem—Atlas; University of Belgrade—Faculty of Forestry: Belgrade, Serbia, 1994. [Google Scholar]
  41. FAO. World Reference Base for Soil Resources 2014, Update 2015; World Soil Resources Reports 106; FAO: Rome, Italy, 2015. [Google Scholar]
  42. Avilov, K.V.; Barkov, A.V.; Vasenev, I.I.; Vasenev, I.V.; Vizirskaja, M.M.; Paskarev, A.A.; Terekhov, V.A.; Kurbatova, A.J.; Samardzhich, M. Device for Measuring Emission of Greenhouse Gas from Soil and Plants; Russian Federation’s Federal Service for Intellectual Property: Moscow, Russia, 2014; No. RU 2 518 979 C1.
  43. Buchmann, N. Biotic and abiotic factors controlling soil respiration rates in Picea abies stands. Soil Biol. Biochem. 2000, 32, 1625–1635. [Google Scholar] [CrossRef]
  44. Laganière, J.; Paré, D.; Bergeron, Y.; Chen, H.Y. The effect of boreal forest composition on soil respiration is mediated through variations in soil temperature and C quality. Soil Biol. Biochem. 2012, 53, 18–27. [Google Scholar] [CrossRef]
  45. Song, X.; Yuan, H.; Kimberley, M.O.; Jiang, H.; Zhou, G.; Wang, H. Soil CO2 flux dynamics in the two main plantation forest types in subtropical China. Sci. Total Environ. 2013, 444, 363–368. [Google Scholar] [CrossRef]
  46. Ming, A.; Yang, Y.; Liu, S.; Wang, H.; Li, Y.; Li, H.; Nong, Y.; Cai, D.; Jia, H.; Tao, Y.; et al. Effects of near natural forest management on soil greenhouse gas flux in Pinus massoniana (Lamb.) and Cunninghamia lanceolata (Lamb.) Hook. plantations. Forests 2018, 9, 229. [Google Scholar] [CrossRef]
  47. Vanhala, P. Seasonal variation in the soil respiration rate in coniferous forest soils. Soil Biol. Biochem. 2002, 34, 1375–1379. [Google Scholar] [CrossRef]
  48. Sarzhanov, D.A.; Vasenev, V.I.; Sotnikova, Y.L.; Tembo, A.; Vasenev, I.I.; Valentini, R. Short-term dynamics and spatial heterogeneity of CO2 emission from the soils of natural and urban ecosystems in the Central Chernozemic Region. Eurasian Soil Sci. 2015, 48, 416–424. [Google Scholar] [CrossRef]
  49. Sarzhanov, A.D.; Vasenev, I.V.; Vasenev, I.I.; Sotnikova, L.Y.; Ryzhkov, V.O.; Morin, T. Carbon stocks and CO2 emissions of urban and natural soils in Central Chernozemic region of Russia. Catena 2017, 158, 131–140. [Google Scholar] [CrossRef]
  50. Jia, B.; Zhou, G.; Wang, Y.; Wang, F.; Wang, X. Effects of temperature and soil water-content on soil respiration of grazed and ungrazed Leymus chinensis steppes, Inner Mongolia. J. Arid. Environ. 2006, 67, 60–76. [Google Scholar] [CrossRef]
  51. Cui, Y.B.; Feng, J.G.; Liao, L.G.; Yu, R.; Zhang, X.; Liu, Y.H.; Yang, L.-Y.; Zhao, J.-F.; Tan, Z.-H. Controls of temporal variations on soil respiration in a tropical lowland rainforest in Hainan Island, China. Trop. Conserv. Sci. 2020, 13, 1940082920914902. [Google Scholar] [CrossRef]
  52. Wickham, H. ggplot2: Elegant Graphics for Data Analysis; Springer: New York, NY, USA, 2016. [Google Scholar]
  53. Ligges, U.; Mächler, M. Scatterplot3d—An R package for visualizing multivariate data. J. Stat. Softw. 2003, 8, 1–20. [Google Scholar] [CrossRef]
  54. Adachi, M.; Bekku, Y.S.; Rashidah, W.; Okuda, T.; Koizumi, H. Differences in soil respiration between different tropical ecosystems. Appl. Soil Ecol. 2006, 34, 258–265. [Google Scholar] [CrossRef]
  55. Li, H.J.; Yan, J.X.; Yue, X.F.; Wang, M.B. Significance of soil temperature and moisture for soil respiration in a Chinese mountain area. Agric. For. Meteorol. 2008, 148, 490–503. [Google Scholar] [CrossRef]
  56. Ma, S.; Concilio, A.; Oakley, B.; North, M.; Chen, J. Spatial variability in microclimate in a mixed-conifer forest before and after thinning and burning treatments. For. Ecol. Manag. 2010, 259, 904–915. [Google Scholar] [CrossRef]
  57. Yuste, J.C.; Nagy, M.; Janssens, I.A.; Carrara, A.; Ceulemans, R. Soil respiration in a mixed temperate forest and its contribution to total ecosystem respiration. Tree Physiol. 2005, 25, 609–619. [Google Scholar] [CrossRef]
  58. Tang, X.L.; Zhou, G.Y.; Liu, S.G.; Zhang, D.Q.; Liu, S.Z.; Li, J.; Zhou, C.Y. Dependence of soil respiration on soil temperature and soil moisture in successional forests in southern China. J. Integr. Plant Biol. 2006, 48, 654–663. [Google Scholar] [CrossRef]
  59. Rawat, M.; Arunachalam, K.; Arunachalam, A. Tree species influence soil respiration in a temperate forest of Uttrakhand Himalaya, India. J. Sustain. For. 2021, 40, 820–830. [Google Scholar] [CrossRef]
  60. Wan, S.; Norby, R.J.; Ledford, J.; Weltzin, J.F. Responses of soil respiration to elevated CO2, air warming, and changing soil water availability in a model old-field grassland. Glob. Chang. Biol. 2007, 13, 2411–2424. [Google Scholar] [CrossRef]
  61. Lee, M.S.; Nakane, K.; Nakatsubo, T.; Koizumi, H. Seasonal changes in the contribution of root respiration to total soil respiration in a cool-temperate deciduous forest. Plant Soil 2003, 255, 311–318. [Google Scholar] [CrossRef]
  62. Nevedrov, N.P.; Sarzhanov, D.A.; Protsenko, E.P.; Vasenev, I.I. Seasonal dynamics of CO2 emission from soils of Kursk. Eurasian Soil Sci. 2021, 54, 80–88. [Google Scholar] [CrossRef]
  63. Rey, A.; Pegoraro, E.; Oyonarte, C.; Were, A.; Escribano, P.; Raimundo, J. Impact of land degradation on soil respiration in a steppe (Stipa tenacissima L.) semi-arid ecosystem in the SE of Spain. Soil Biol. Biochem. 2011, 43, 393–403. [Google Scholar] [CrossRef]
  64. Hanson, P.J.; Edwards, N.T.; Garten, C.T.; Andrews, J.A. Separating root and soil microbial contributions to soil respiration: A review of methods and observations. Biogeochemistry 2000, 48, 115–146. [Google Scholar] [CrossRef]
  65. Raich, J.W.; Tufekciogul, A. Vegetation and soil respiration: Correlations and controls. Biogeochemistry 2000, 48, 71–90. [Google Scholar] [CrossRef]
  66. Goncharova, O.; Matyshak, G.; Udovenko, M.; Semenyuk, O.; Epstein, H.; Bobrik, A. Temporal dynamics, drivers, and components of soil respiration in urban forest ecosystems. Catena 2020, 185, 1–8. [Google Scholar] [CrossRef]
  67. Díaz-Pinés, E.; Schindlbacher, A.; Pfeffer, M.; Jandl, R.; Zechmeister-Boltenstern, S.; Rubio, A. Root trenching: A useful tool to estimate autotrophic soil respiration? A case study in an Austrian mountain forest. Eur. J. For. Res. 2010, 129, 101–109. [Google Scholar] [CrossRef]
  68. Tang, J.; Baldocchi, D.D. Spatial-temporal variation in soil respiration in an oak–grass savanna ecosystem in California and its partitioning into autotrophic and heterotrophic components. Biogeochemistry 2005, 73, 183–207. [Google Scholar] [CrossRef]
  69. Wei, S.; Zhang, X.; McLaughlin, N.B.; Liang, A.; Jia, S.; Chen, X.; Chen, X. Effect of soil temperature and soil moisture on CO2 flux from eroded landscape positions on black soil in Northeast China. Soil Tillage Res. 2014, 144, 119–125. [Google Scholar] [CrossRef]
  70. Chen, W.; Jia, X.; Zha, T.; Wu, B.; Zhang, Y.; Li, C.; Wang, X.; He, G.; Yu, H.; Chen, G. Soil respiration in a mixed urban forest in China in relation to soil temperature and water content. Eur. J. Soil Biol. 2013, 54, 63–68. [Google Scholar] [CrossRef]
  71. Koizumi, H.; Kontturi, M.; Mariko, S.; Nakadai, T.; Bekku, Y.; Mela, T. Soil respiration in three soil types in agricultural ecosystems in Finland. Acta Agric. Scand. Sect. B-Plant Soil Sci. 1999, 49, 65–74. [Google Scholar] [CrossRef]
  72. Wiseman, P.E.; Seiler, J.R. Soil CO2 efflux across four age classes of plantation loblolly pine (Pinus taeda L.) on the Virginia Piedmont. For. Ecol. Manag. 2004, 192, 297–311. [Google Scholar] [CrossRef]
  73. Piao, S.; Luyssaert, S.; Ciais, P.; Janssens, I.A.; Chen, A.; Cao, C.; Fang, J.; Friedlingstein, P.; Luo, Y.; Wang, S. Forest annual carbon cost: A global-scale analysis of autotrophic respiration. Ecology 2010, 91, 652–661. [Google Scholar] [CrossRef]
  74. Guo, J.; Yang, Z.; Lin, C.; Liu, X.; Chen, G.; Yang, Y. Conversion of a natural evergreen broadleaved forest into coniferous plantations in a subtropical area: Effects on composition of soil microbial communities and soil respiration. Biol. Fertil. Soils 2016, 52, 799–809. [Google Scholar] [CrossRef]
  75. Yu, K.; Yao, X.; Deng, Y.; Lai, Z.; Lin, L.; Liu, J. Effects of stand age on soil respiration in Pinus massoniana plantations in the hilly red soil region of Southern China. Catena 2019, 178, 313–321. [Google Scholar] [CrossRef]
  76. Xiao, W.; Ge, X.; Zeng, L.; Huang, Z.; Lei, J.; Zhou, B.; Li, M. Rates of litter decomposition and soil respiration in relation to soil temperature and water in different-aged Pinus massoniana forests in the three gorges reservoir area, China. PLoS ONE 2014, 9, e101890. [Google Scholar] [CrossRef] [PubMed]
  77. Luan, J.; Liu, S.; Wang, J.; Zhu, X.; Shi, Z. Rhizospheric and heterotrophic respiration of a warm-temperate oak chronosequence in China. Soil Biol. Biochem. 2011, 43, 503–512. [Google Scholar] [CrossRef]
  78. Gao, J.; Zhang, Y.; Song, Q.; Lin, Y.; Zhou, R.; Dong, Y.; Zhou, L.; Li, J.; Jin, Y.; Zhou, W.; et al. Stand age-related effects on soil respiration in rubber plantations (Hevea brasiliensis) in southwest China. Eur. J. Soil Sci. 2019, 70, 1221–1233. [Google Scholar] [CrossRef]
  79. Saiz, G.; Byrne, K.A.; Butterbach-Bahl, K.; Kiese, R.; Blujdea, V.; Farrell, E.P. Stand age-related effects on soil respiration in a first rotation Sitka spruce chronosequence in central Ireland. Glob. Chang. Biol. 2006, 12, 1007–1020. [Google Scholar] [CrossRef]
  80. Klopatek, J.M. Belowground carbon pools and processes in different age stands of Douglas-fir. Tree Physiol. 2002, 22, 197–204. [Google Scholar] [CrossRef]
  81. Gong, J.; Ge, Z.; An, R.; Duan, Q.; You, X.; Huang, Y. Soil respiration in poplar plantations in northern China at different forest ages. Plant Soil 2012, 360, 109–122. [Google Scholar] [CrossRef]
  82. Law, B.E.; Ryan, M.G.; Anthoni, P.M. Seasonal and annual respiration of a ponderosa pine ecosystem. Glob. Chang. Biol. 1999, 5, 169–182. [Google Scholar] [CrossRef]
  83. Striegl, R.G.; Wickland, K.P. Effects of a clear-cut harvest on soil respiration in a jack pine-lichen woodland. Can. J. For. Res. 1998, 28, 534–539. [Google Scholar] [CrossRef]
  84. Zhao, X.; Li, F.; Zhang, W.; Ai, Z.; Shen, H.; Liu, X.; Cao, J.; Manevski, K. Soil respiration at different stand ages (5, 10, and 20/30 years) in coniferous (Pinus tabulaeformis Carrière) and deciduous (Populus davidiana Dode) plantations in a sandstorm source area. Forests 2016, 7, 153. [Google Scholar] [CrossRef]
  85. Tedeschi, V.; Rey, A.N.A.; Manca, G.; Valentini, R.; Jarvis, P.G.; Borghetti, M. Soil respiration in a Mediterranean oak forest at different developmental stages after coppicing. Glob. Chang. Biol. 2006, 12, 110–121. [Google Scholar] [CrossRef]
  86. Ma, Y.; Piao, S.; Sun, Z.; Lin, X.; Wang, T.; Yue, C.; Yang, Y. Stand ages regulate the response of soil respiration to temperature in a Larix principis-rupprechtii plantation. Agric. For. Meteorol. 2014, 184, 179–187. [Google Scholar] [CrossRef]
Figure 1. The geographical location of the study area and the position of the examined stands: 1(QR70)—70-year-old stand (44°56′28.20″ N; 19°11′41.87″ E); 2(QR14)—14-year-old pedunculate oak stand (44°56′32.92″ N; 19°11′39.43″ E); 3(QR4)—4-year-old stand (44°56′32.07″ N; 19°11′35.78″ E).
Forests 15 01574 g001
Figure 2. Dynamics of soil temperature during the study period (2021–2022) within the study location. (QR70)—70-year-old stand; (QR14)—14-year-old stand; (QR4)—4-year-old stand.
Forests 15 01574 g002
Figure 3. Dynamics of soil moisture during the study period (2021–2022) within the study location. (QR70)—70-year-old stand; (QR14)—14-year-old stand; (QR4)—4-year-old stand.
Forests 15 01574 g003
Figure 4. Dynamics of soil CO2 emission in 2021: (QR70)—70-year-old stand; (QR14)—14- year-old stand; (QR4)—4-year-old stand.
Forests 15 01574 g004
Figure 5. Dynamics of soil CO2 emission in 2022: (QR70)—70-year-old stand; (QR14)—14-year-old stand; (QR4)—4-year-old stand.
Forests 15 01574 g005
Figure 6. Seasonal variations in soil CO2 emission for each examined stand during 2022: (QR70)—70-year-old stand; (QR14)—14-year-old stand; (QR4)—4-year-old stand.
Forests 15 01574 g006
Figure 7. Soil CO2 emission variation among examined stands within study location over the entire study period (2021–2022): (QR70)—variation in soil CO2 emissions in middle-aged stand (70-year-old); (QR14)—variations in soil CO2 emissions in sapling stand (14-year-old); (QR4)—variations in soil CO2 emissions in sapling stand (4-year-old). Significant differences between the examined stands were determined using a one-way ANOVA followed by Tukey’s post hoc test (p < 0.05). These differences are displayed as different lowercase letters above the box plots.
Forests 15 01574 g007
Figure 8. The combined influence of soil temperature and soil moisture on soil CO2 emissions for the study location during the summer season in 2021: y-axis (soil CO2 emission (g CO2 m−2 day−1)); x-axis (soil moisture (%)); and z-axis (soil temperature (°C)).
Forests 15 01574 g008
Figure 9. The combined influence of soil temperature and soil moisture on soil CO2 emissions for the study location during the spring season in 2022: y-axis (soil CO2 emission (g CO2 m−2 day−1)); x-axis (soil moisture (%)); and z-axis (soil temperature (°C)).
Forests 15 01574 g009
Figure 10. The combined influence of soil temperature and soil moisture on soil CO2 emissions for the study location during the summer season in 2022: y-axis (soil CO2 emission (g CO2 m−2 day−1)); x-axis (soil moisture (%)); and z-axis (soil temperature (°C)).
Forests 15 01574 g010
Figure 11. The combined influence of soil temperature and soil moisture on soil CO2 emissions for the study location during the autumn season in 2022: y-axis (soil CO2 emission (g CO2 m−2 day−1)); x-axis (soil moisture (%)); and z-axis (soil temperature (°C)).
Forests 15 01574 g011
Table 1. Physical and chemical properties of soils within the examined stands.
Examined StandsSoil DepthTotal Sand
>0.02 mm
Silt
0.02–0.002 mm
Clay
<0.002 mm
Textural ClassCNCaCO3pH (H2O)
cm%%%-%%%-
QR700–3026.835.637.6clay loam0.890.160.587.32
30–8025.228.646.2clay0.160.071.217.65
>8028.433.238.3clay loam0.04-0.927.97
QR140–3027.838.633.6clay loam2.540.161.336.47
30–8027.027.046.0clay0.190.061.167.32
>8025.733.640.7clay0.19-0.177.36
QR40–3040.335.724.0loam5.300.132.017.56
30–8026.729.144.2clay0.220.041.347.86
>8027.634.138.4clay loam0.01-1297.90
Table 2. F-statistics of two-way ANOVA for effects of stand age, season, and their interaction on soil CO2 emissions during 2022.
Source of VariationdfFp
Stand age20.820.44
Season214.70<0.001
Stand age × Season42.60.38
Disclaimer/Publisher’s Note: The statements, opinions and data contained in all publications are solely those of the individual author(s) and contributor(s) and not of MDPI and/or the editor(s). MDPI and/or the editor(s) disclaim responsibility for any injury to people or property resulting from any ideas, methods, instructions or products referred to in the content.

